Article

Renewable Energy Integration in Vietnam’s Power System: Generation Adequacy Assessment and Strategic Implications

1
Department of Strategic Management, Faculty of Business Administration, Thuongmai University, 79 Ho Tung Mau Road, Hanoi 100000, Vietnam
2
Vietnam Electricity Group, 11 Cua Bac Street, Hanoi 100000, Vietnam
3
Charles Darwin University, Asia Pacific College of Business and Law, Darwin City, NT 0800, Australia
4
Business Sustainability Research Group, Thuongmai University, 79 Ho Tung Mau Road, Hanoi 100000, Vietnam
*
Author to whom correspondence should be addressed.
Energies 2021, 14(12), 3541; https://doi.org/10.3390/en14123541
Submission received: 23 April 2021 / Revised: 25 May 2021 / Accepted: 9 June 2021 / Published: 14 June 2021
(This article belongs to the Section A: Sustainable Energy)

Abstract

:
Vietnam is widely considered as an energy-intensive economy. Renewable energy integration has been set as an important goal in the country’s revised Power Development Plan 7 (PDP7). This study first conducted a generation adequacy assessment using the basic probabilistic modeling approach to evaluate how the generation fleet, as foreseen in the PDP7, can meet the demand, despite the fast-changing renewable energy sources (RES) generation. The adequacy of the generation was measured using the Loss of Load Expectation (LOLE, expressed in hours) index. The study then conducted in-depth interviews with key stakeholders to identify and propose efficient strategic approach and policy implementations for integration of RES into the current power system in Vietnam. The results suggested that three major pillars should be considered to ensure the success of RES integration: strategic objectives, structural reforms and system transformation.

1. Introduction

Vietnam is widely considered as an energy-intensive economy [1]. Given that economic growth needs to harmonize with sustainable development (MOIT and DEA, 2017), Vietnam has revised its Power Development Plan 7 (hereinafter referred to as PDP7) that prioritizes renewable energy sources (RES) in electricity production [2]. Specifically, the revised PDP7 sets the RES targets for electricity production and power generation installed capacity of above 10% and 21%, respectively, by 2030 (Decision No: 428/QD-TTg, 2016).
In the electricity market, the power generated by electricity generation firms must always balance the power load because of the limitation of electrical storage capacities [3]. It is generally easier for traditional power generation firms to control and adjust for different load demands than for RES generation firms to do so, given the dependent of RES on weather situations. Thus, when the proportion of electricity generated from RES increases in the energy system, generation adequacy assessment that helps to find the reliable energy supply during peak times with very high load demand becomes significantly essential. There has been increasing research interest on generation adequacy assessment when integrating RES in the power system [3,4,5].
Previous studies examine generation adequacy assessment from different points of view. Several researchers use an analytical approach [6] and simulation approach [7] with various indices based on uncertain input variables and different procedures to assess generation adequacy. Furthermore, some studies investigate the influences of energy storage system on generation adequacy [8,9], while others investigate the impact of demand response programs [10,11]. The combination of energy storage system and demand response is also used [12]. Notably, those studies were purely technical approaches that aimed to examine power systems’ reliability. Nevertheless, in the interests of renewable energy integration, a strategic approach that includes suggested policies and plans to efficiently integrate RES have to be considered besides the pure technical characteristics [13,14,15].
In fact, the integration of RES into the power systems have attracted many researchers who investigated different aspects, from technical to strategic, policy or economic views. However, studies that investigate the generation adequacy assessment and strategic approach for integrating RES are still limited. Hence, this study aims to fill the aforementioned gap by not only focusing on generation adequacy assessment, but also by providing a strategic approach to integrating RES into Vietnam’s power system. To support the development of the renewable energy sector, the study’s objectives are to:
(i)
conduct a generation adequacy assessment to evaluate how the generation fleet, as foreseen in the PDP7, can meet the demand, despite the fast-changing RES generation;
(ii)
isuggest strategic approach and policy implementations for effective integration of RES into the current power system in Vietnam.
After this introduction, the following part of the research highlights the development of renewable energy in Vietnam. The research methodology is described in the third part and it is followed by the research’s results. The fifth part presents discussions and policy implications for integrating RES into Vietnam power system. Finally, the sixth part highlights conclusions and future research.

2. The Development of Renewable Energy in Vietnam

The current strategy of Vietnam’s renewable energy development is demonstrated in Decision 2068/QĐ-TTg, which approved the Renewable Energy Development Strategy of Vietnam to 2030 with a vision to 2050. Importantly, renewable energies development will be harmonized with the goals of economic, social and environment development. Specifically, Vietnam will expand its renewable energies not only on the scale and the share in total primary energy supplies, but also to rural and remote areas for better utilization of resources in efficient and eco-friendly manners. Furthermore, the development of Vietnam renewable energies is also established upon the links of the country’s socio-economic development and needs of the country’s resources and energy [16].
To date, there are 110 renewable energy plants (excluding small hydroelectric plants) in operation in Vietnam’s power system; thus, the total installed capacity of RES is 5392 MW, accounting for approximately 9.7% of installed capacity of the whole system, of which there are 91 solar, 10 wind and 9 biomass generation companies, with the sum of capacities of 4695 MW (8.4% of installed capacity), 377 MW (0.7% of installed capacity) and 320 MW (0.6% of installed capacity), respectively [17].
Regarding small hydroelectric plants, as of November 2019, there are 378 factories with the sum of installed capacity is 3959 MW in the whole national power system, of which 216 plants are located in the north, 130 factories in central Vietnam and 32 factories in the south, with the sum of capacities of 2200 MW, 1470 MW and 289 MW, respectively [17].
According to a recent report of the National Power Development Steering Committee, the total capacity of solar and wind power is expected to reach to 14,450 MW and 6030 MW by 2025 and to 20,050 MW and 10,090 MW by 2030, respectively [16]. Thus, by 2025, the total electricity from wind and solar power will reach 36 billion kWh (about 2.6 times higher than the target in the Renewable Energy Development Strategy), while small hydro and renewable energy will make up 25.5% of the sum of capacity (nearly 13% higher than the adjusted PDP7) [16].
RESs are connected to high density in some areas, causing local overload for 4110 kV transmission lines in three provinces of Ninh Thuan, Binh Thuan, An Giang, including (i) Ninh Thuan—Thap Cham, (ii) Solar PV Ecoseido—Phan Ri, (iii) PV Phan Lam—Dai Ninh, (iv) Chau Doc—Tinh Bien. These 110 kV lines are all connected to the national power system and linked to 220 kV and 500 kV lines. Therefore, there are 25 related renewable energy plants involved regularly cutting capacity to avoid overloading the grid. The reduction rate of production is estimated to be about 43% of the actual output. It is expected that the overload situation will significantly spread along with the progress of putting the renewable energy power plants that have been contracted for electricity purchase and sale into operation.
There are also overload issues with the 220 kV lines in areas with many RESs in the South-Central Coast region like Ninh Thuan and Binh Thuan provinces (e.g., the 220 kV Da Nhim—Duc Trong—Di Linh, DMZ, the 220 kV thermal power station Hong Phong 1—Phan Thiet, the 220 kV transmission line Quy Nhon—Tuy Hoa, the 220 kV transmission line Phu My—Quang Ngai, the 220 kV transmission line Quang Ngai—Doc Soi and the 500 kV transformer Dak Nong). If all of the current RESs are at maximum capacity, the grid will be severely overloaded, with overload rate from 105% to 140% [16]. The increase in proportion to RES sources causes new difficulties and challenges in the power system. Figure 1 illustrates part of the 220 kV and 500 kV transmission system in two provinces of Ninh Thuan and Binh Thuan.
As can be seen in Figure 1, the 220 kV Da Nhim—Duc Trong—Di Linh transmission line (highlighted on the map) is connected with the 220 kV Thap Tram—Phan Ri—Phan Thiet transmission line. They collectively help to transmit traditional hydro power sources and RES generated in Ninh Thuan and Binh Thuan provinces to load centers (in Ho Chi Minh city and some industrial zones in the southeast region) collecting from local 110 kV lines (not shown on the map) which are connected to various RES in the region. With the recent massive development of solar and wind power projects in Ninh Thuan and Binh Thuan provinces, those above-mentioned 110 kV and 220 kV lines have got overloaded during peak hours. To solve this congestion problem, a series of 110 kV, 220 kV and even 500 kV transmission lines have been added to the grid development master plan and are urgently under construction.
Unlike the electrical systems in European countries (that are linked together through one-way or alternating lines capable of transmitting large, easily supporting each other’s capacity), Vietnamese electricity system is an independent system, which separates from other countries in the region (deadly linked with Laos; Cambodia is unable to support capacity; China’s power receiving area operates independently). It is leading to poor flexibility in operation, that might cause negative economic and technical impacts.

3. Research Method

The mix method that combines both quantitative and qualitative is utilized in this research. First, the quantitative method that bases on the basic probabilistic modeling approach is used for generation adequacy assessment. Second, the qualitative method that bases on face-to-face interviews is used for developing strategic approach to efficiently integrate RES to the current power system and for providing policy implementations for Vietnam’s renewable energy development.

3.1. Method for Assessment of Generation Adequacy

In order to evaluate how the generation fleet, as foreseen in the PDP7 of Vietnam, is able to meet demand, despite the fast-changing RES generation, the adequacy of the generation is measured using the loss of load expectation (i.e., LOLE, expressed in hours) index. This index can be compared with international standards (the LOLE should be less than ~3 h, according to usual standards) [3].
The basic probabilistic modeling approach is used to assess generation adequacy [5]. Of which, the generation and load models are transformed to a suitable reliability model. In this model, risk of having less generation capacity than the load is under the first consideration. Nevertheless, there are three steps for assessing generation adequacy: (1) build an appropriate load model; (2) establish a generation capacity model upon on the characteristics of operating and generating divisions; (3) incorporate a load model and generation capacity model to acquire a reliability model, which helps to evaluate the generation adequacy fleet to cover demand. From the reliability model, derive reliability metrics and compare them with acceptance criteria, when available.
In order to measure the reliability indices, Monte Carlo simulation is utilized. According to Billinton and Li [7], Monte Carlo simulation can be used as an effective method to represent outages by selecting the available generation in each hour based on drawing from the probability distribution that describes its availability. It has been widely used in the solution of real engineering problems in many fields [18]. Hence, to the best of our knowledge, Monte Carlo simulation it is an appropriate choice for this research. Monte Carlo simulation is an analytical method that describes the system as analytical models and uses mathematical solutions to assess these models’ indices by simulating the actual and random process of the system, considering all issues based on sets of experiments. The indices of reliability represent the generation plants’ capability in respond to the demand of the system. The huge computational attempt needed to examine a series of system situations becomes the substantive challenge of Monte Carlo simulation, since each of systems situation identified by its own intrinsic probabilities [19].

3.1.1. Representation of the Load—The Load Model

Load is the total demand to be covered by the Vietnamese generation fleet: Vietnam’s inland demand, including the losses to transmit energy, plus the export to foreign countries (e.g., Cambodia), minus the import from abroad (e.g., China). The load in the electrical system for any given period of time is a random process. Hence, it is difficult to represent it by a single formula.
In this methodology, hourly load values (365 days × 24 h = 8760 values) during several past years are used to build a statistically representative load distribution function.
Load can vary from one year to another (e.g., demographic growth, economic growth, electrification). In this research, we establish the curve of yearly load distribution based on hereinafter procedure:
(1)
Use of historical hourly data of Vietnamese gross demand
year: 1 time series of 8760 hourly values
Recommended N > 5 years: Total = N × 8760 hourly values
(2)
Building of a yearly distribution curve for national demand
Step 1—Normalization: for each time series n out of N, divide each hourly value
L i , n   i = 1, …, 8760) by the peak value of the time series
L i , n n o r m = L i , n M a x j = 1 8760 ( L j , n ) i = 1 8760 ;   n = 1 N
Step 2—Average load curve: made of 8760 values which are average of the N associated normalized values
L i a v e r a g e = A v e r a g e n = 1 N L i , n n o r m i = 1 , ,   8760
Step 3—Rescaling: multiply the average load curve in 2nd step with the peak load of the year under study (i.e., 2025 or 2030)
L i * = L i a v e r a g e   x   p e a k   i = 1 8760
This process can be achieved using Excel, resulting in a load probability function L:
Lk = P(lk − 1 < Z < lk)
where the Lk 1, …, L discretize the interval of possible load values.
Peak demand, as foreseen in the PDP7, increases significantly until 2025 and 2030. In this research, the yearly load pattern has been estimated as the average load pattern in 2016–2020, multiplied by the foreseen peak demand associated to that year that is provided by EVN [16]. By doing so, the shape of the load pattern is kept the same in 2025 or 2030, as an average for the period 2016–2020.

3.1.2. Including Hydro and RES Generation in the Analysis—Residual Load and Capacity Credit

Renewable generation is strongly dependent on weather conditions. The level of RES generation varies depending on the hour of the day (e.g., no solar generation during the night) and depending on the seasons (winter is often windier and less sunny) [20]. Electric demand also varies depending on the hour of the day (e.g., economic activities during the day) and the season (e.g., less economic activity or more air conditioning during the summer) [21]. There is, therefore, a correlation between load and RES generation, which needs to be kept during the analysis. Renewable generation and load should not be considered independent variables. In this context, it is proposed to use hourly time series of generating wind and solar power in past years. These time series are rescaled according to the planned RES installed capacity (in 2025 or 2030) and subtracted from the hourly time series of load. The same approach is proposed for hydropower. It is dispatched according to the season to cover the load more efficiently. Historical hourly time series of total hydro generation will be deducted from the load time series. In this approach, it is assumed that hydro generation will be dispatched in the same way in the future as in the past. On the one hand, this assumption makes sense since hydro generation is zero marginal cost and will be used, as today, to cover demand at least cost, provided the hydro constraints (level of reservoirs or rivers). On the other hand, RES integration is zero marginal cost but cannot be dispatched. It will often get the priority of dispatch and hydro generation sometimes will be displaced accordingly to other moments in the years. This displacement would require a full dedicated study with a specific methodology and is out of scope of this study. In general terms, it is assumed that the hydro generation dispatch will be optimized in the same way as today to cover peak moments, which are the most relevant of the adequacy assessment.
The yearly variation of renewable, solar, wind or bio and hydropower is considered based on historical time series that is provided by Vietnam Electricity (EVN). As for wind energy, a yearly profile has been derived as the average of the power output of existing wind farms (Bac Lieu, Tuy Phong, Huong Linh, Phú Lạc). As for solar energy, the profile has been built on the basis of the historical output of the Phuoc Thai plant. As for biomass, the power plant Bourbon Biomass has been used to elaborate a yearly profile. As for wind energy, the adequacy assessment has been achieved using the same wind profile for the whole country. Since the wind conditions are not the same in the whole country, a sensitivity has been carried out where the country has been split in three zones (South, Centre and North), with their respective yearly generation profile, corresponding to the wind conditions as provided by EVN. The wind speed values are translated into generated power using the IEC 61400-1 standard generation curves in function of the wind speed (average of wind turbine classes 1, 2 or 3) [22] (Table 1). Losses in the wind farms are estimated at 12% in average, according to [23] (Table 2).
In the next sections, the load model needs to be understood as the actual load, from which solar, wind and hydro generation is subtracted, i.e., the residual load. By considering both load and residual load duration curves, we can assess the level of RES replacement capacity through examining the gap between the peak and the peak residual demand [24]. This assessment is rooted in the capacity credit concept, which can be understood as the additional load which can be covered in a system with the same level of reliability, thanks to the introduction of RES generation. In a deterministic approach, where the target reliability level is set as the absolute coverage of the load at peak time, the capacity credit is the peak demand less the peak residual demand, expressed as a percentage of the variable renewables installed. The capacity factor is used to integrate the volatility of RES in assessing adequacy in a deterministic approach [16]. For example, if 10 GW of wind power plants are installed in a region and their capacity credit is 10%, then there will be a reduction of 1 GW in the amount of other plants required, compared to a situation with no wind capacity. More advanced target reliability level is defined in terms of LOLE. According to this definition and the data provided for Vietnam, the capacity factor of solar and wind energy in Vietnam are 20% and 65%, respectively.

3.1.3. Representation of the Conventional Generation: The Generation Model

For each unit i with its installed capacity ( C i ) , a two-state model is proposed [18]. Of which, the unit unavailability ( U i ) represents the probability of failure and it can be calculated based on the rate of unit failure rate ( λ i ) and the rate of repair ( μ i   ) as:
U i = λ i μ i   +   λ i
where U i = unit   unavailability   of   unit   i ;   λ i =   unit   failure   of   unit   i ;   μ i   =   unit   repair   rate   of   unit   i
FOR i   = Forced   outage   hours In service   hours + Forced   outage   hours
FOR is shorted for “forced outage rate”, with the meaning as same as unit unavailability and it is measured based on a long time period (e.g., 365 days). Specifically, in this research, we focus on the forced outage rates, but not for planned outage rates, that relates to maintenance. Adequacy studies assesses the capability of the generation fleet to cover demand, considering load and varying renewable generation. It is assumed that maintenance will be planned to maximize the availability of the generation fleet in demanding or stressed situations. In the two-state model (i.e., Bernoulli model), the probability that plan i, generates outputs X i = X k is given by the following:
G i , k   = P X i = X k = 1 U i     if   X k 1 = C i U i   if   X k     C i  
In order to measure the total power generation of the system, we then establish a capacity model by connecting the capacity and each of unit i’s availability. In this model, each generating division is denoted by its nominal capacity ( C i ) and its unavailability, (FORi or U i   ).
Two situations in the two-state model are either “on outage” or “in operation”. Assumed that in the power system, there are n electricity manufacturers, it is expected to have 2n dissimilar capacity situations. We can calculate the probability of cumulative situation by summing up the total probability of each individual situation.
G k   = P g k 1 i = 1 N X i       g k
where the g k , k = 1, …, G discretize the interval of possible total generation capacity [MW].
There is no direct analytical method to evaluate this distribution, hence, Monte–Carlo simulation is proposed in several steps [19]: (1) Outages are drawn randomly for each power plant i, based its outage probability Ui; (2) At each draw, the available generation capacity is counted over the whole fleet; (3) The draw is repeated a very large number of times; (4) Statistical distribution of the counted available generation capacities over the whole set of draws are evaluated; they are the required distribution of available generation. The adequacy of the generation fleet in 2025 and 2030 is tested relative to possible unavailability of power plants.
Three cases are considered: (i) Unavailability associated to forced outages, meaning following the incident of power plants; (ii) Unavailability associated to forced outages or minor planned outages (i.e., minor maintenance) of power plants; (iii) Unavailability associated to forced outages, minor or major planned outages of power plants.
This approach enables to visualize the respective effect of forced and planned outages on the reliability of the generation fleet. The associated values have been supported by the National Load and Dispatch Centre (NLDC) and presented in Table 3.
Where not available, the following standard forced outage rates are used [25] (Table 4).

3.1.4. Reliability Indices

The power generation system’s reliability indices (i.e., LOLP—Loss of Load Probability, LOLE—Loss of Load Expectation, LOEP—Loss of Energy Probability, LOEE—Loss of Energy Expectation, EENS—Expected Energy Not Served, LOLF—Loss of Load Frequency, LOLD—Loss of Load Duration) are utilized to evaluate the power generation system’s reliability [5,25]. Most of them are random variable’s expected values.
Loss of load occurs when the system load exceeds the generating capacity available for use. Loss of Load Probability (LOLP) is a projected value of how much time, in the long run, the load on a power system is expected to be greater than the capacity of the available generating resources. It is defined as the probability of the system load exceeding the available generating capacity [5].
LOLP can be evaluated using the following relation:
LOLP = j = 1 G G j   ×   P   ( L   >   G j   ) = j = 1 G G j   × t j 100
where   t j is the percentage of time where the load is greater than Gj.
If the total amount of reserves is greater than capacity outage, loss of load will not be a problem. In the contrast, the risk will be as p j × t j . Notably, in the real situations, LOLE indicator is frequently utilized than LOLP indicator. Both of them are interconnected as:
LOLE = LOLP × 8760 h
Normally, LOLP is used as generation capacity planning’s reliability indicator. It’s better to obtain LOLP of less than 01 day in 10 years or the amount of accumulated shortage time is less than 0.0274% of a day [4].
Another method to evaluate power generation reliability is utilizing the indicator of LOEP. Of which, we calculate the ratio of EENS and total power demand (E) during long period of observation (i.e., yearly):
LOEP = k = 1 G E k   × p k E
where E = i = 1 L l i × L i × 8760 is the yearly total energy demand [MWh]
  • E k is the energy not supplied due to a capacity outage O k
  • p k is the probability of the capacity outage O k
  • E is the total energy demand during the period of study
E k = i = 1 L l i   ×   ( L i G k )   ×   8760
is the yearly total energy demand [MWh].
The achieved value represents a unit of MWh/year, that is denoted as LOEE.
In order to calculate all these probabilities of generation system, Monte Carlo simulation and probabilistic modelling with Oracle Crystal Ball was utilized. Crystal Ball, which is an add-on for Microsoft Excel, is a helpful tool to create probabilistic models in Excel with Monte Carlo simulations without having to use more complicated statistical and mathematical platforms.

3.2. Method for Exploring Strategic Approach to Integrating RES into the Power System

To explore strategic approach to integrating RES into Vietnam’s power system, in depth interviews with respondents at different levels (government policymakers, provincial authorities, CEOs/managers of electrical generation, transmission, distribution firms) are conducted. The objective of these interviews is to detect varying perspectives of renewables policy and strategic approach to efficiently incorporating RES to Vietnam’s power system. Semi-structured interviews that are guided by a topic list based on required energy policies, structural reforms and system transformation are collected consistently across the whole sample. From 17 November to 23 December 2020, a total of 25 interviews (Table 5) were conducted, lasting from 45 min to 1 h for each. The interviewees’ profiles are indicated in Table 5.
Criteria for choosing an interviewee for the research included his/her expertise in electric field, especially in renewables field and knowledge of the regulations and energy policies. During strategic approach discussion, attention was paid on the policy maker and manager’s perception of strategic approach to efficiently integrate RES to Vietnam power system.
The interview data are analyzed by themes and thematic topics allow considerations to different opinions and perceptions to be identified in how RES is integrated to power system. These themes reflect the respondents’ thoughts of strategic approach to efficiently integrate RES to Vietnam power system. Codes are assigned and memos are utilized to match interviewees’ stories.

4. Results

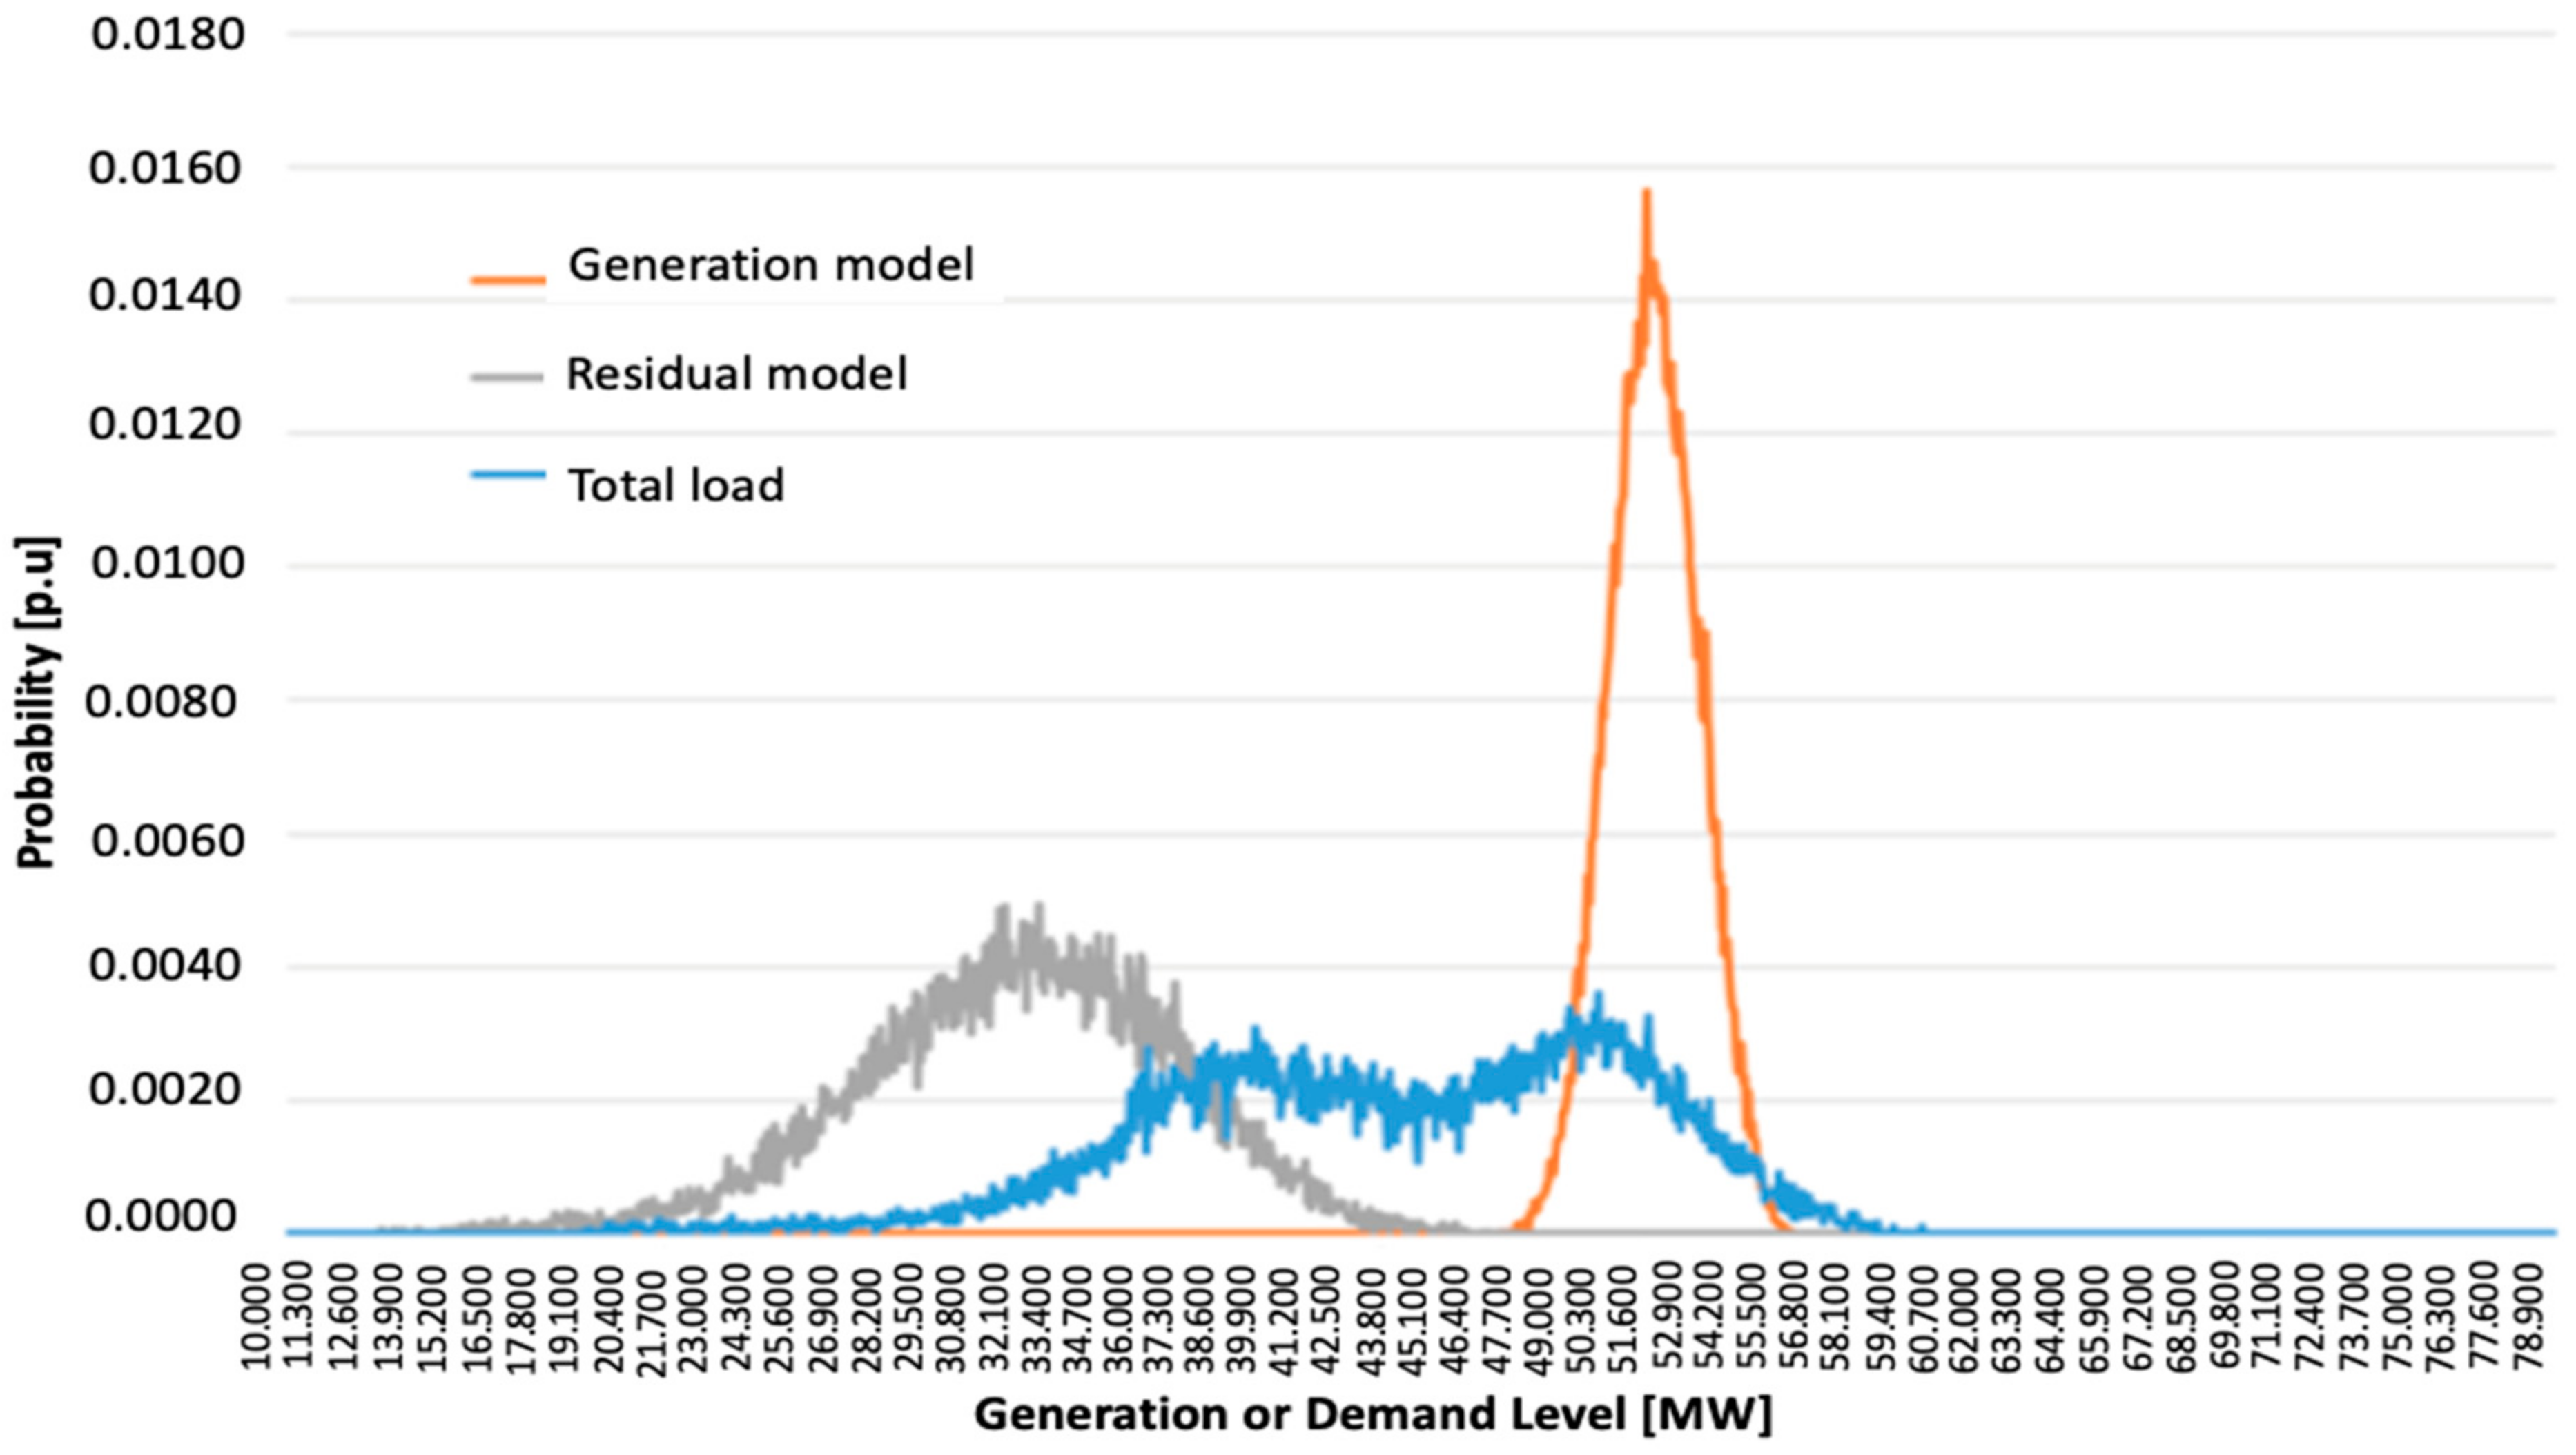
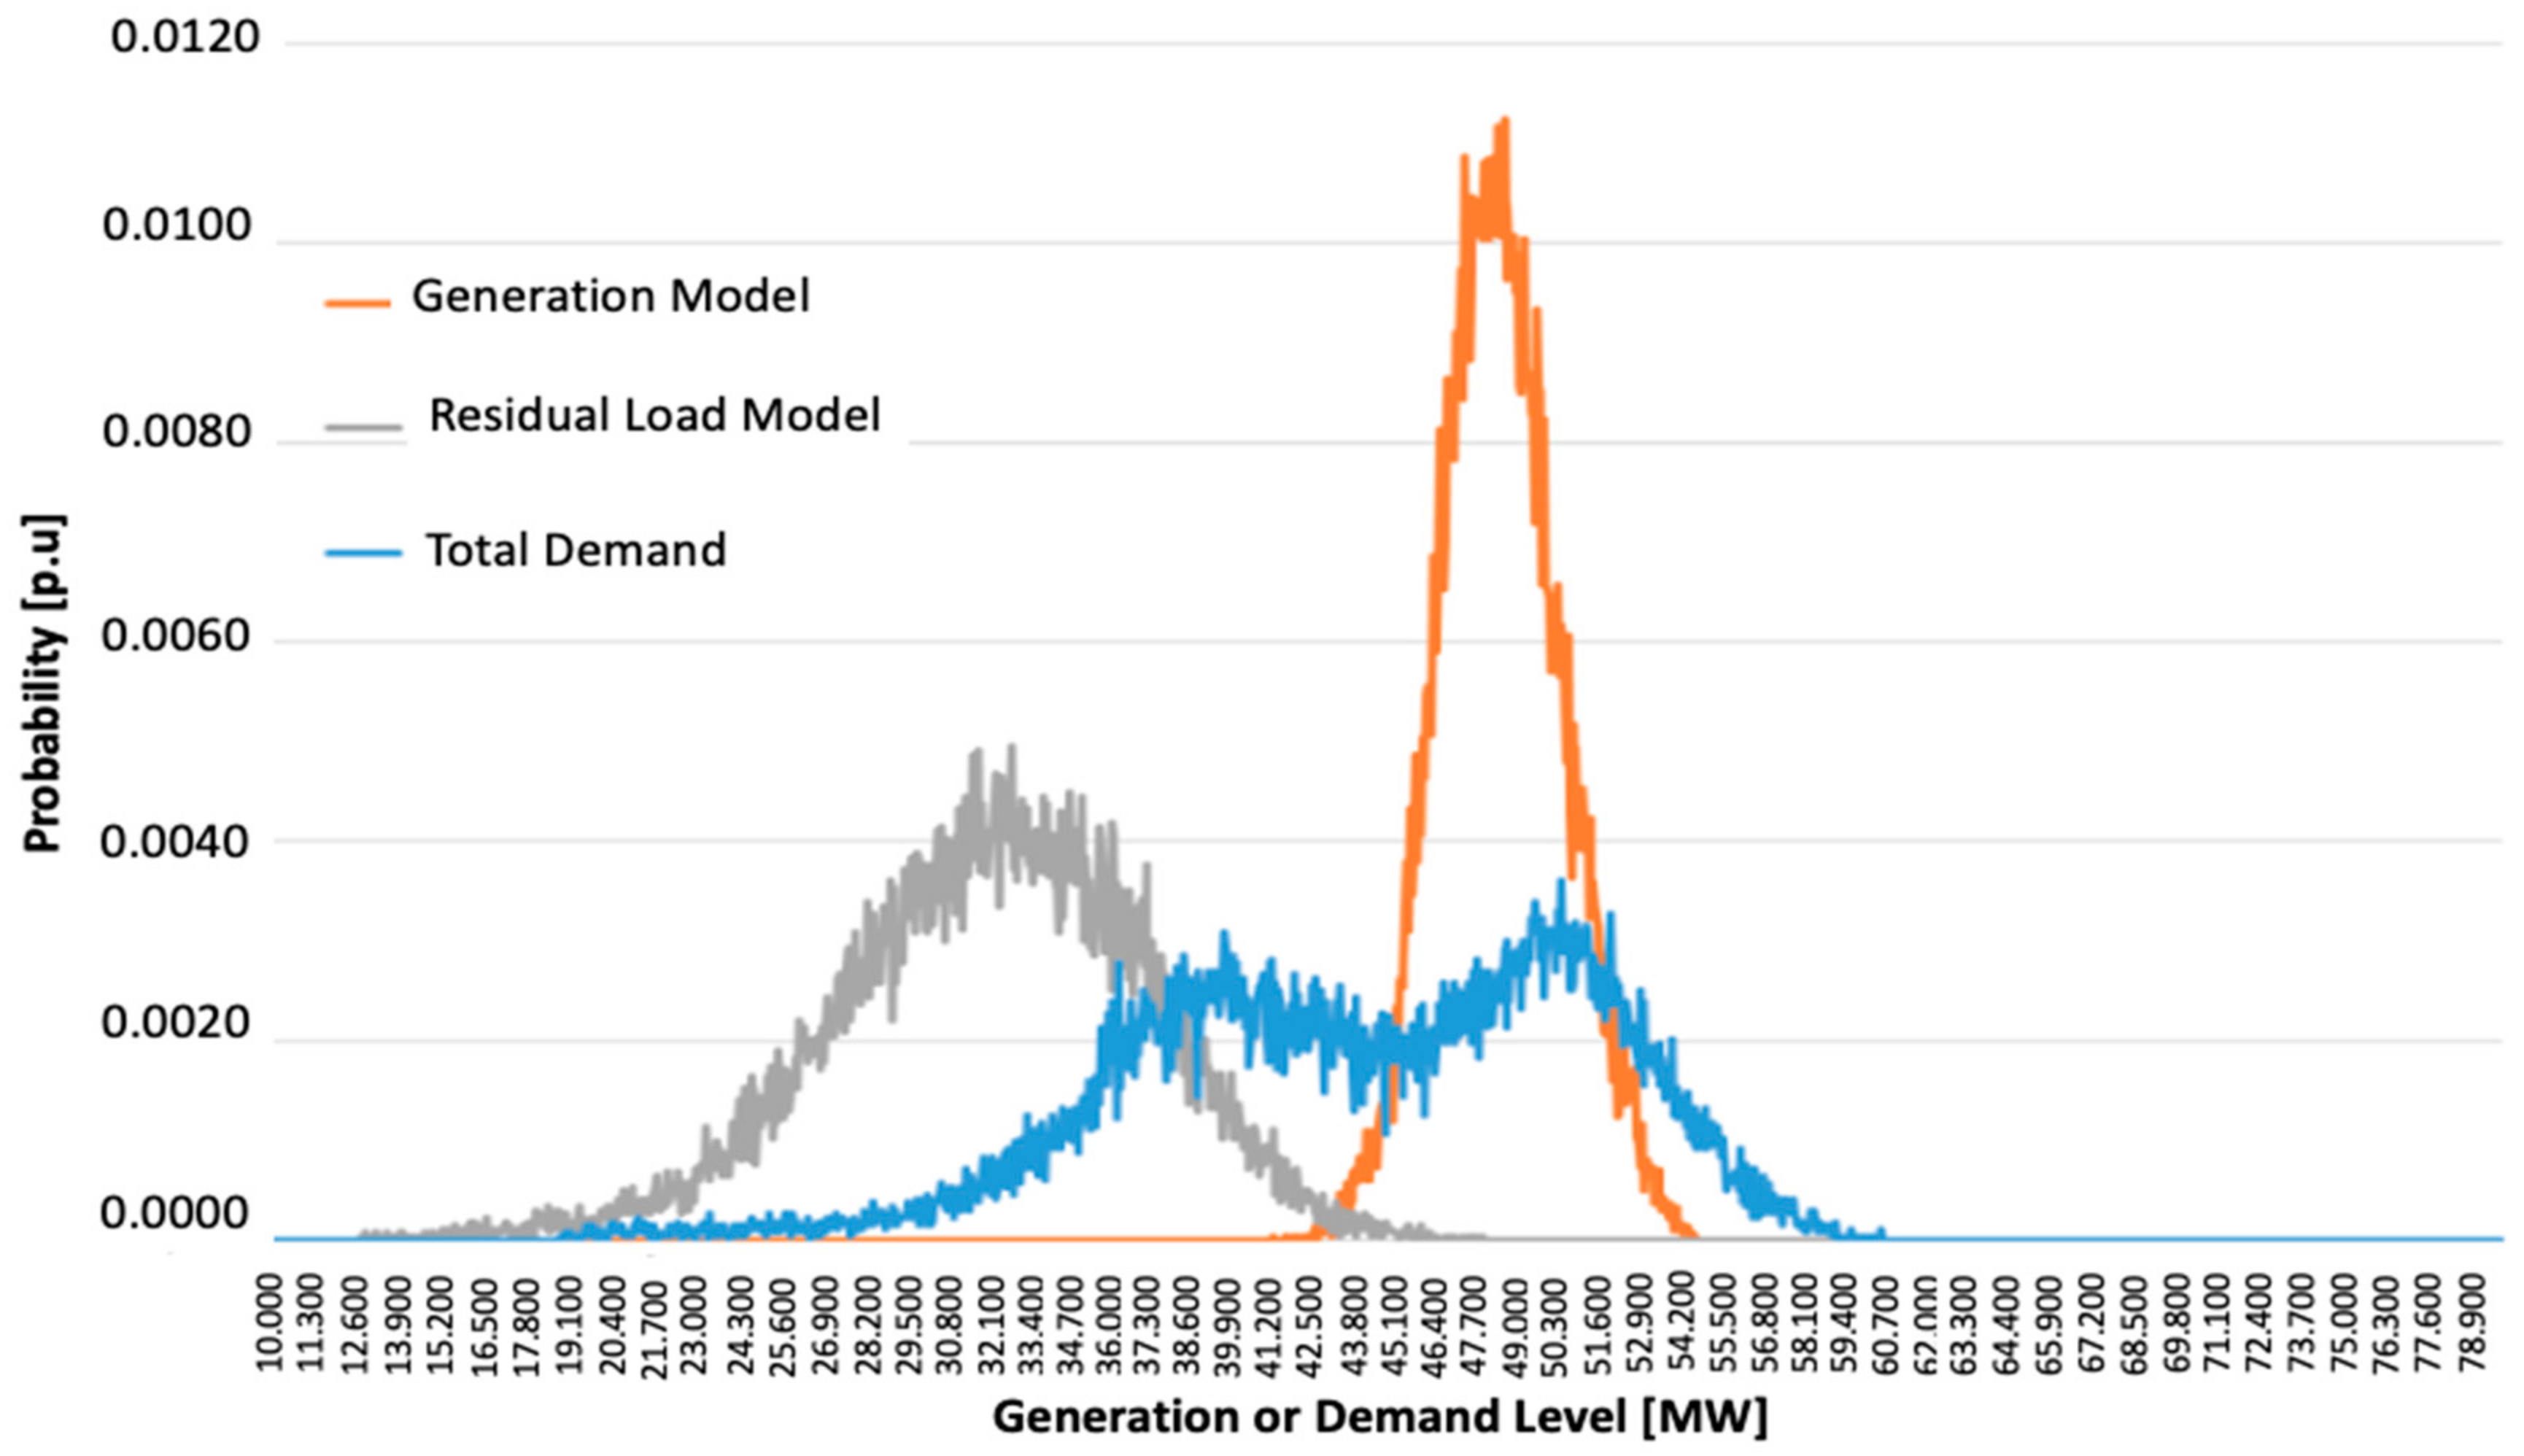
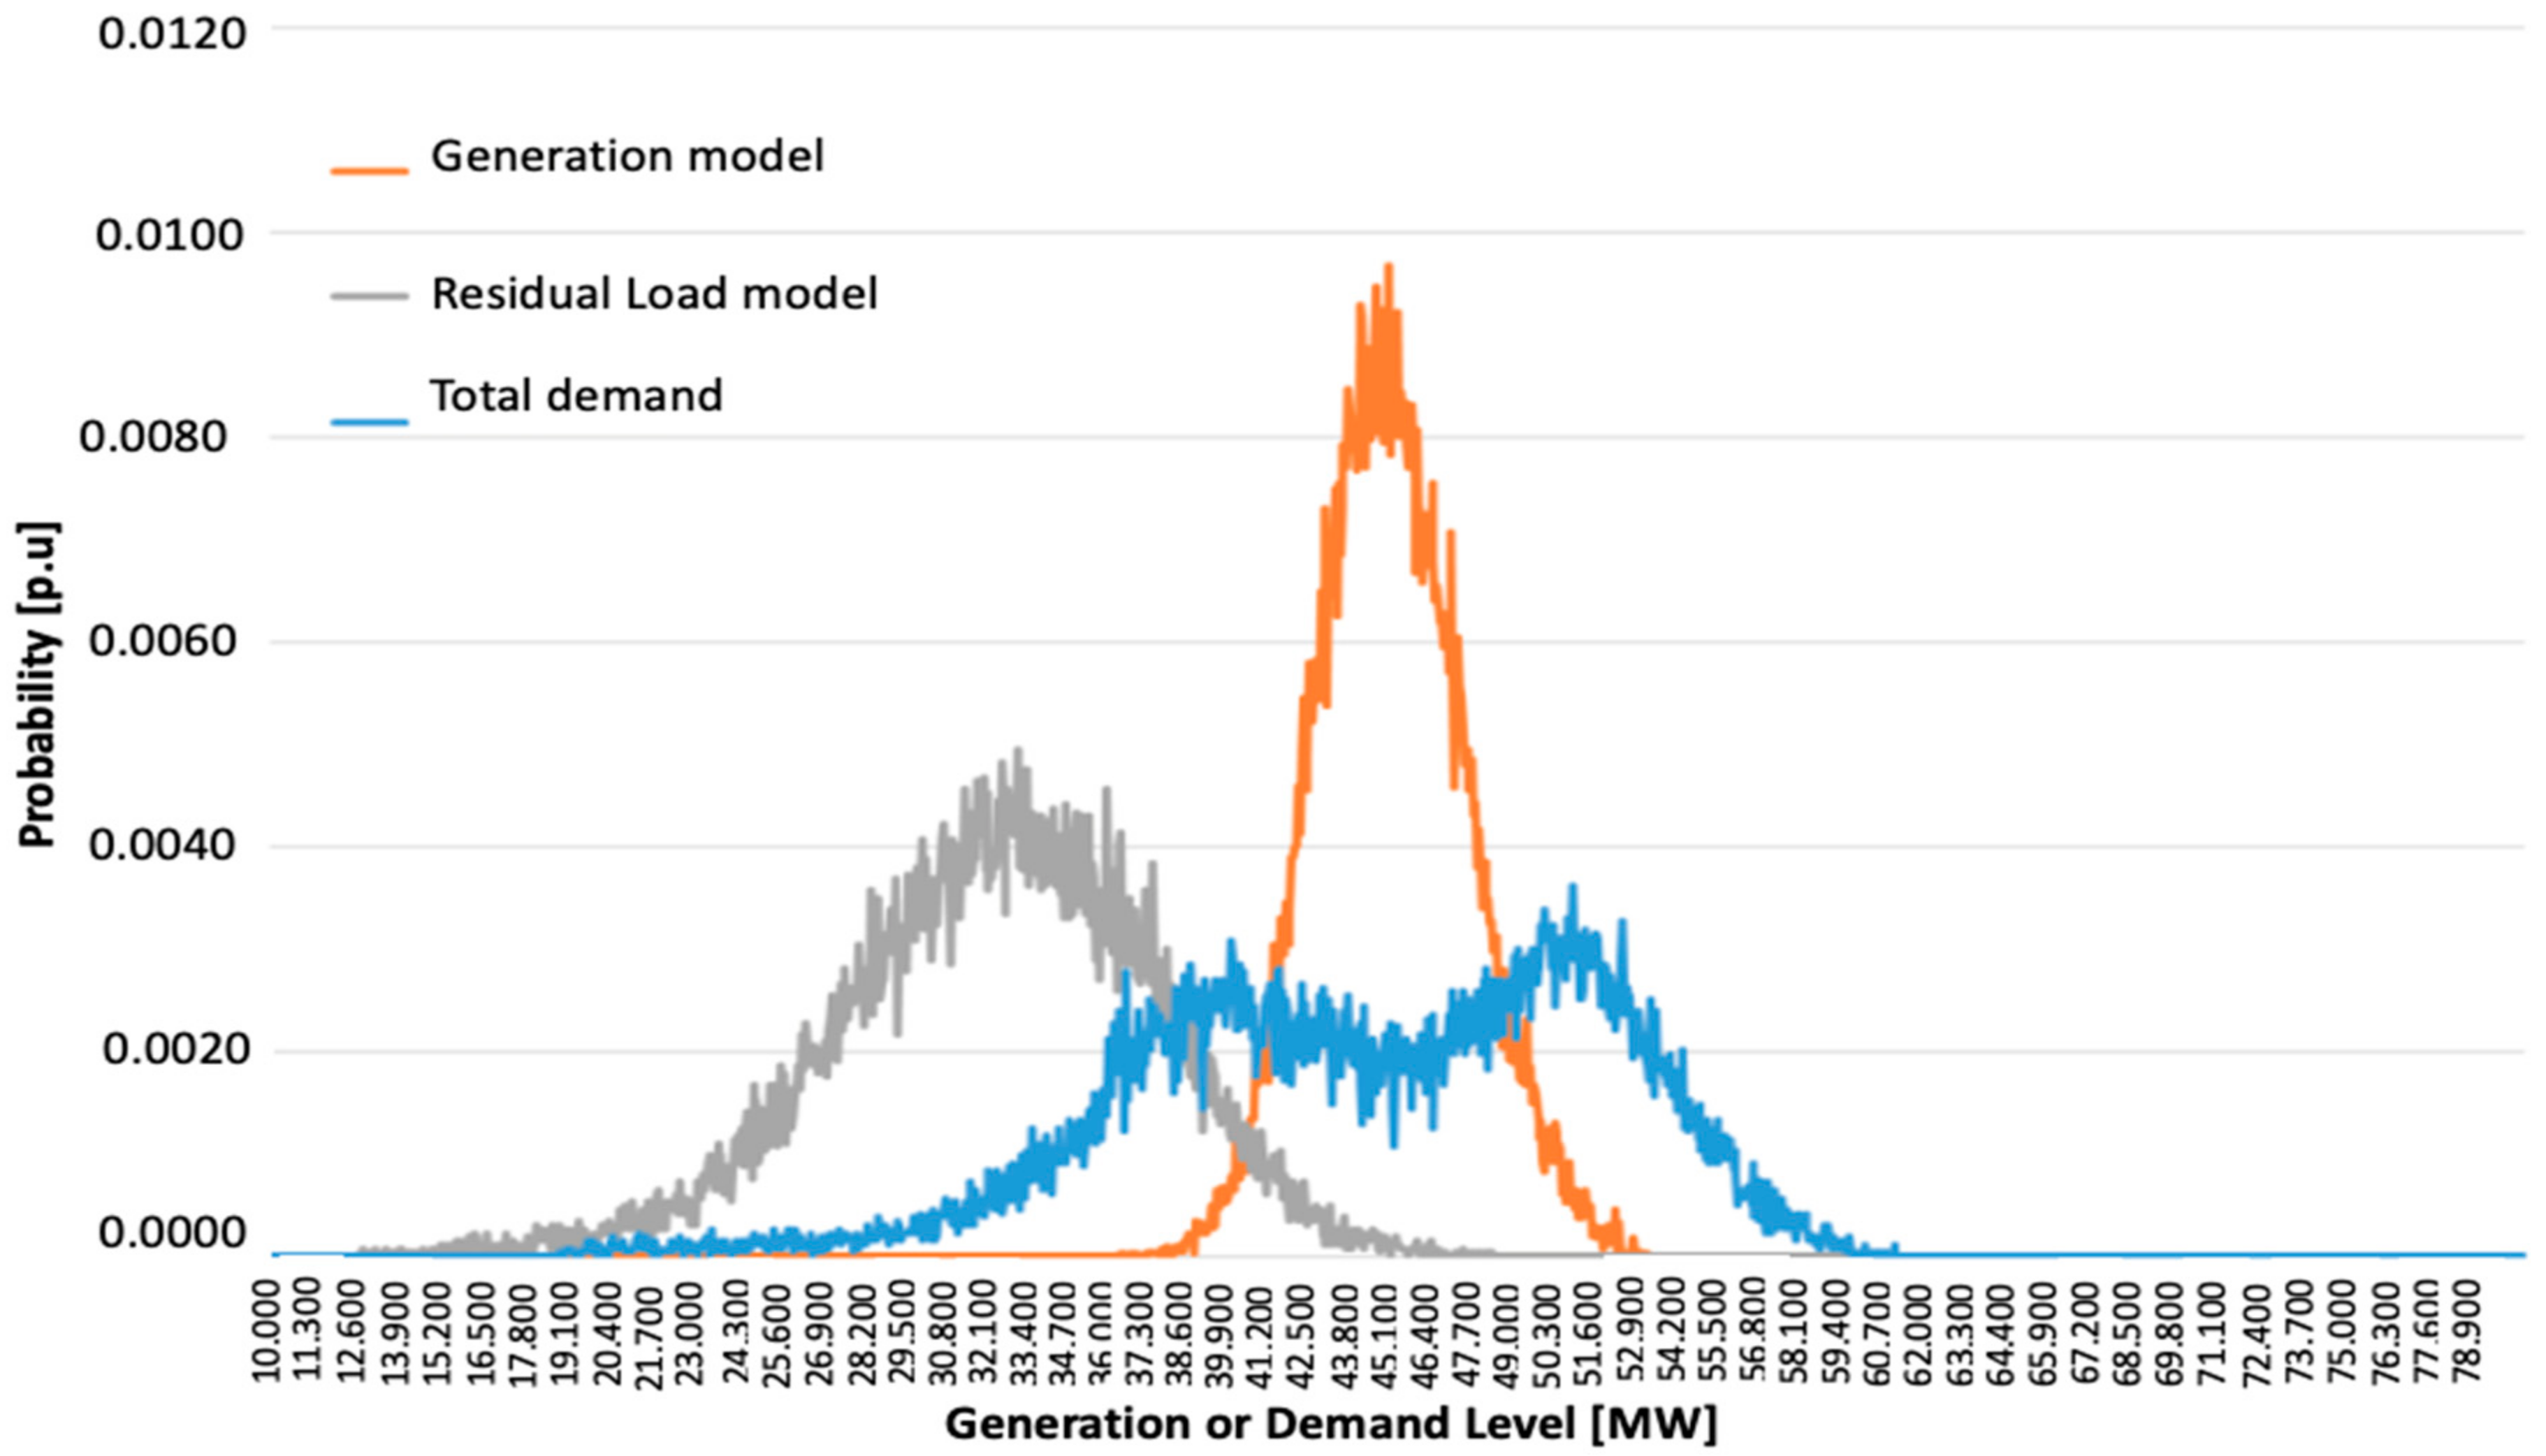
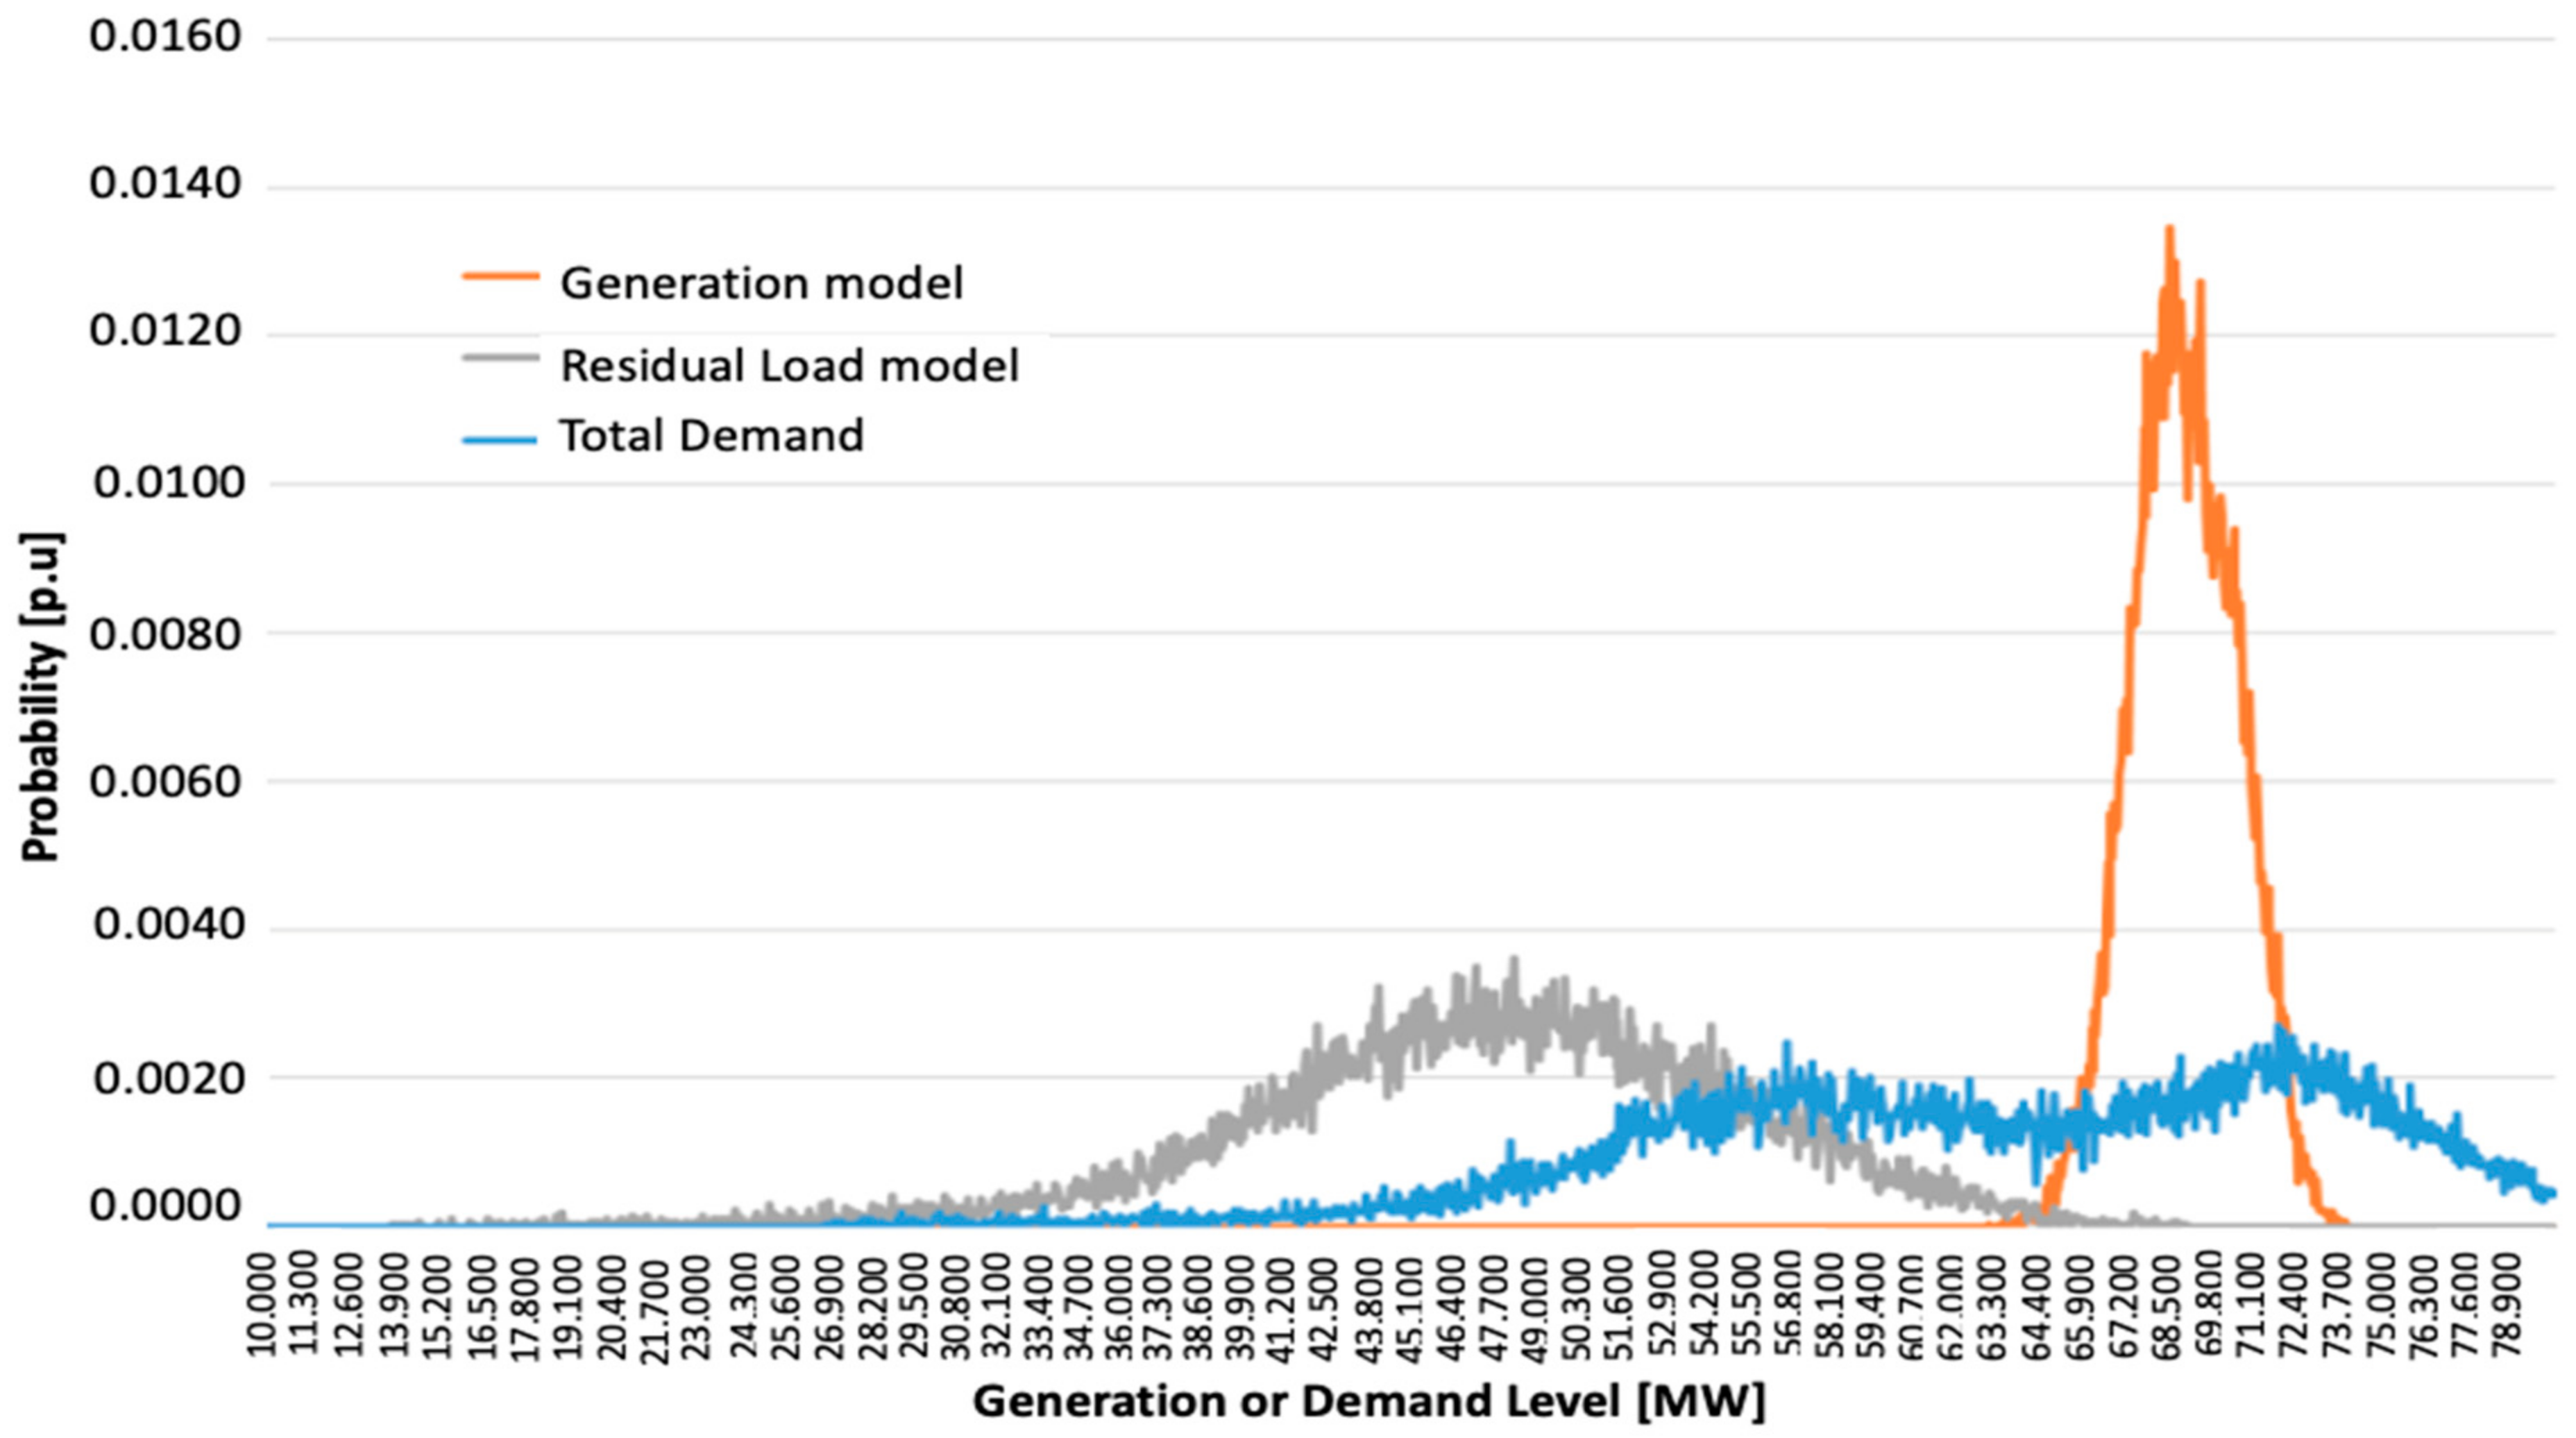
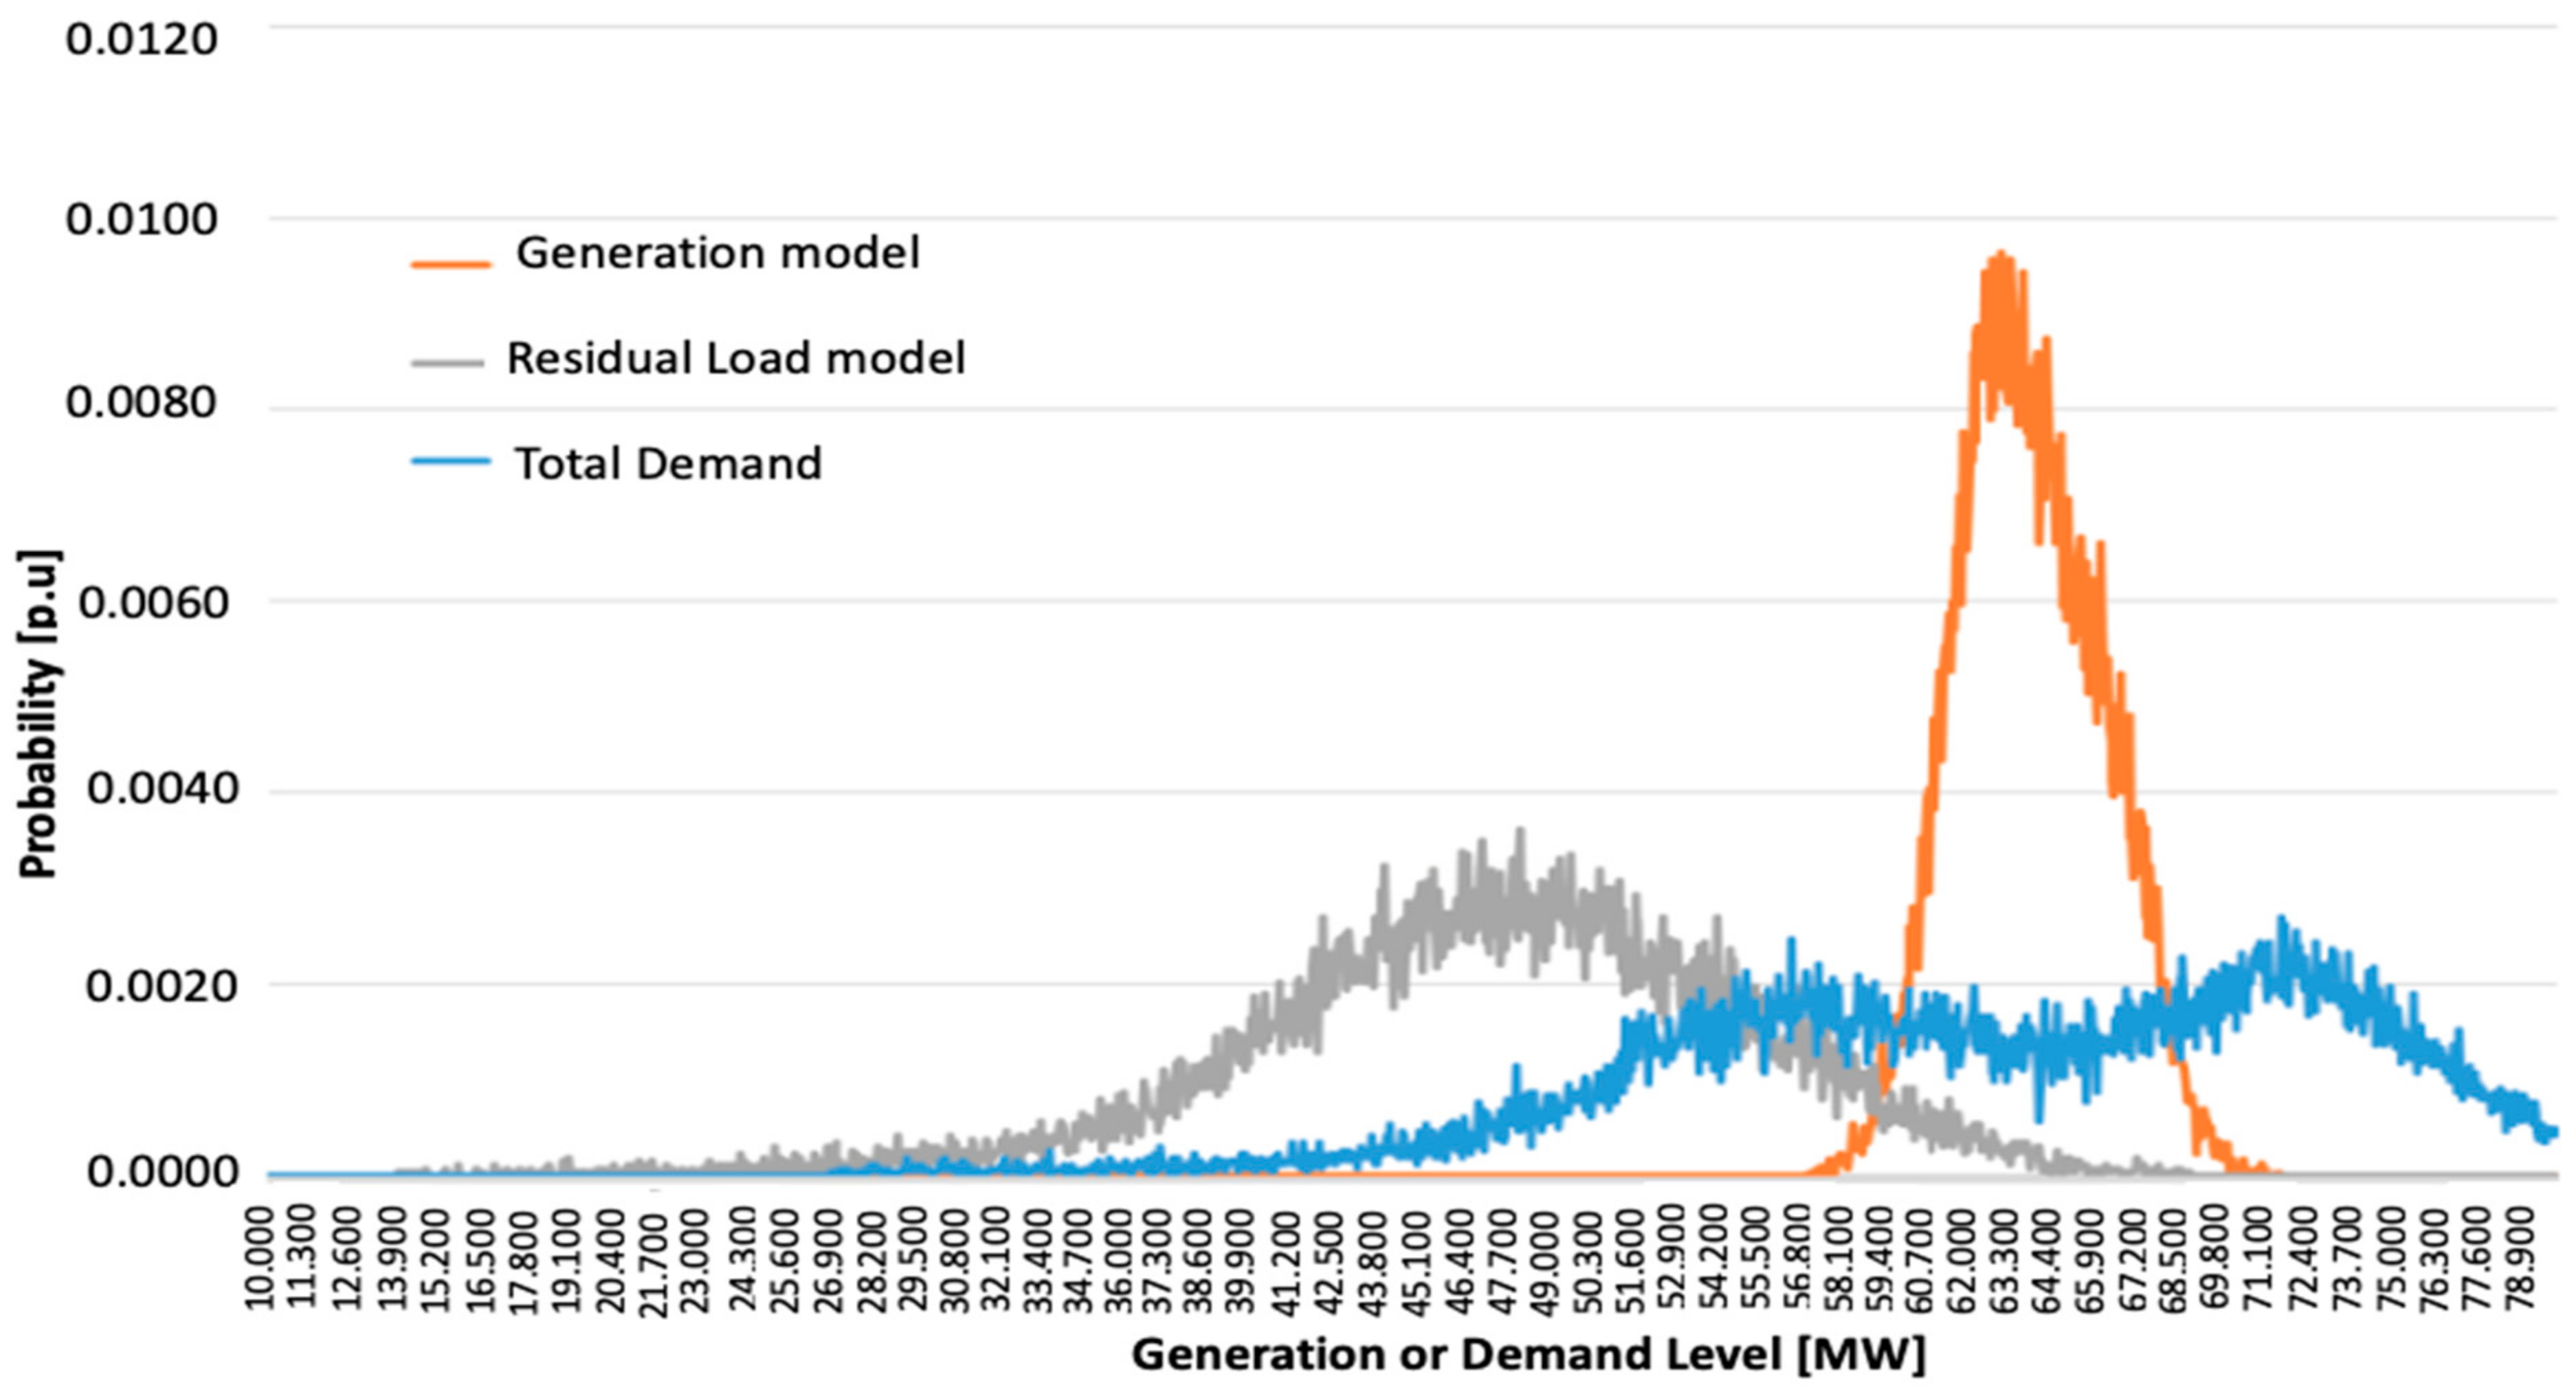
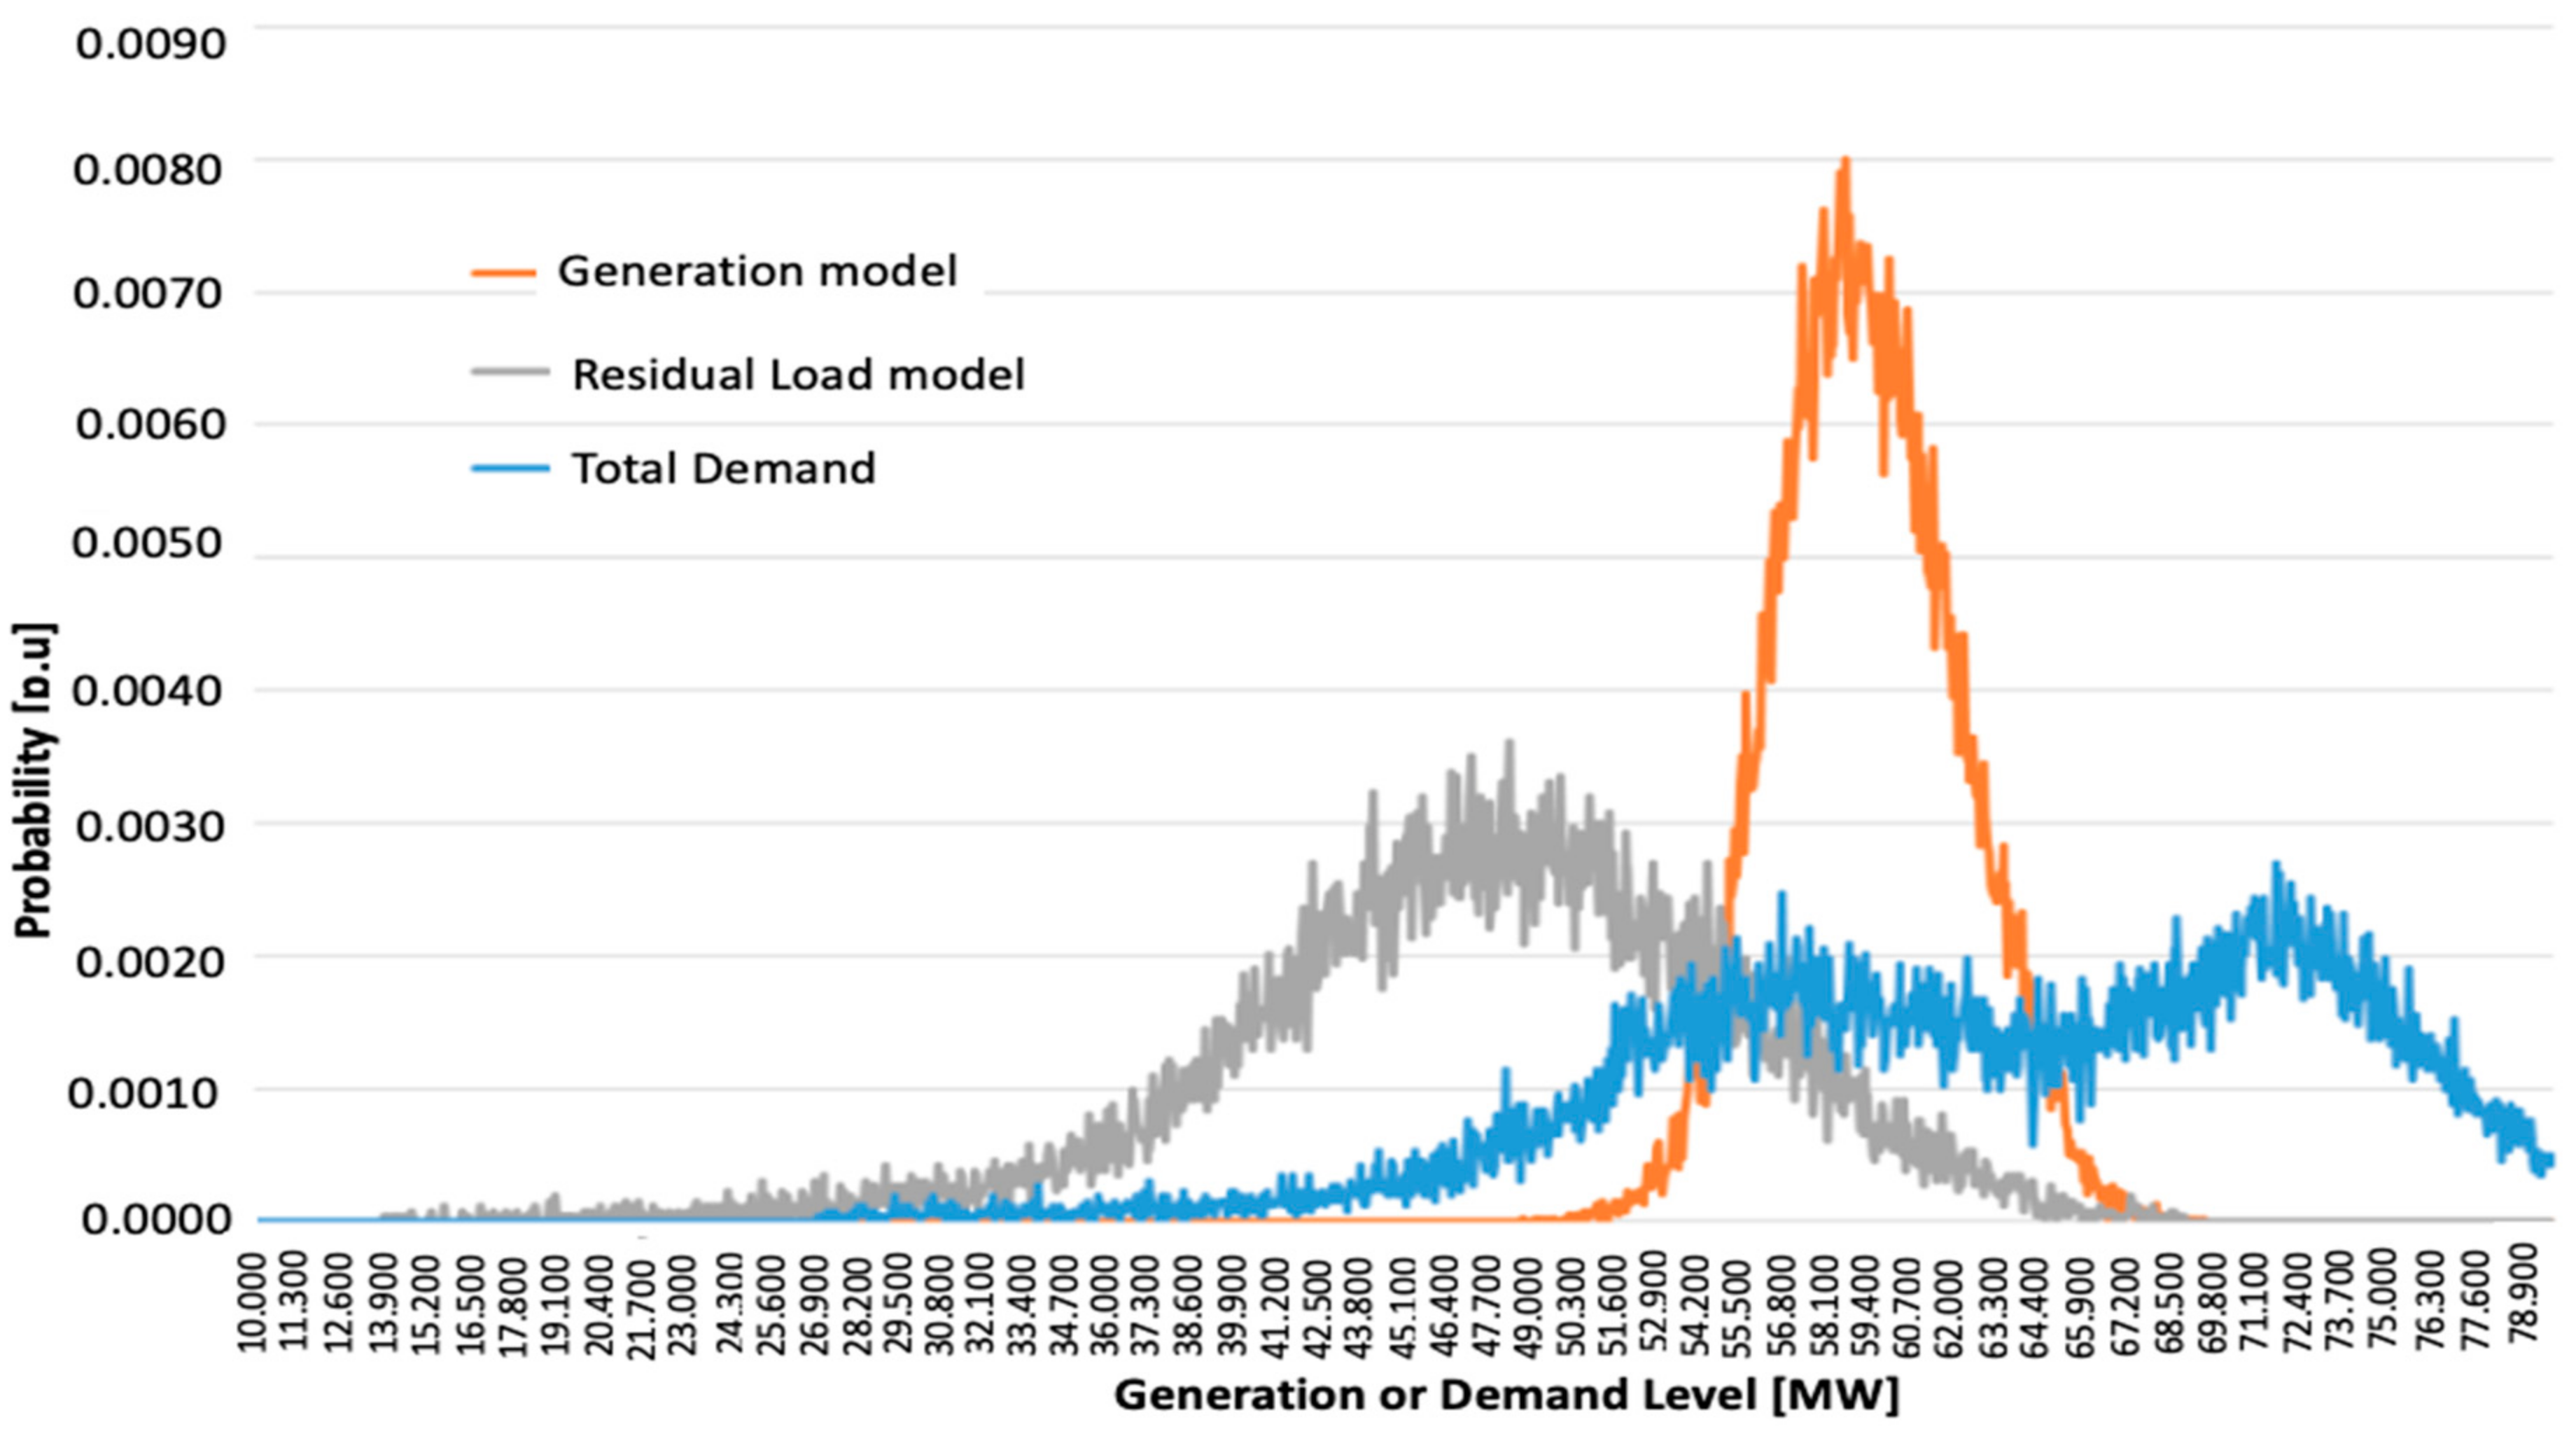
4.1. Impact on the Ability of the Generation Fleet to Cover Demand

The power demand in Vietnam increases until 2025. Investment in thermal generation is made, but not enough to cover the demand. As indicated in Figure 2, the total thermal generation—the orange line—is lower than total demand—the blue line—with some probability.
Thanks to hydropower and the introduction of renewable energy, the residual load—the grey line—to be covered by the thermal generation is significantly lower. If we consider that minor or major planned outages (i.e., maintenance) cannot be scheduled when the residual load is not too high; only forced outages can jeopardize security of supply during peak residual load moments. Figure 3 illustrates that the situation is absolutely safe in these conditions. The LOLP is equal to zero and LOLE is 0.00037 h.
If minor planned maintenances need to be scheduled during high residual load moments, then the available generation decreases. The available thermal generation is not enough to cover the residual load in all circumstances. The LOLP is equal to 0.00025 and the LOLE is 2.2 h. In these conditions, the reliability level of the generation fleet meets the usual standards and the situation may be considered as being safe. The situation becomes worsen if major maintenance needs to be scheduled during high residual load moments. The major maintenance is significantly longer than minor interventions; the exposure to a power plant outage jeopardizing the security of supply increases accordingly. This is reflected in Figure 4.
If major maintenance happens during stressful situations, the LOLP is equal to 0.00669 and the LOLE is 58.57 h. The usual reliability standards are not met and the security of supply in endangered. The conclusion does not change if the wind generation profiles are defined per region (South, Centre and North). In this situation, the sensitivity analysis represents that the LOLP is equal to 0.00681 and the LOLE is 59.61 h (Figure 5). Wind penetration is low in this scenario.
In 2030, peak demand has increased again and the share of RES becomes important in the whole generation mix. The demand increase is covered more by the renewable than the thermal generation.
If the minor and major planned outages are not scheduled when residual demand is high, the LOLP is equal to 0.00048 and the LOLE is 4.2 h. This is very close to meeting the highest reliability standards (i.e., 3 h) and the situation appears to be quite acceptable. Due to minor maintenances scheduled during the peak moments, the LOLP increases to 0.01155 and the LOLE is 101.2 h. The electricity system’s adequacy is not secured and the security of supply is jeopardized (Figure 6).
The situation worsens when major maintenance is considered: the LOLP increases to 0.06711 and the LOLE is 587.91 h. This means that the security of supply will not be secured during 24 days in 2030 if major maintenance needs to be scheduled during residual demand peak moments. If the regional wind generation profiles are used, the LOLP changes to 0.07759 and the LOLE is 679.65 h (Figure 7). The effect of these profiles is higher in 2030 than 2025 because the integration of wind generation is higher in the 2030 case.

4.2. Strategic Approach to Integrating RES in Vietnam Power System

In the interests of RES integration, a strategic approach based on required energy policies, structural reforms and system transformation must be considered besides the pure assessment of generation adequacy. Results from interviews show that three (3) major pillars should be considered to ensure the success of affordable RES integration as strategic targets, structural reforms and system transformation (Table 6).

4.2.1. Theme 1. Strategic Objectives

Regarding expectations for the need of strategic objectives for integrating RES into the power system and government actions’ timeline, all of respondents expressed their overwhelmingly support for the government’s efforts to design policy that supports RES integration.
“Vietnam has issued several policies to promote RES like national energy development strategy to 2030 with a vision to 2050, supporting mechanism (FiT) for Solar PV projects, the preparation of appropriate regulations, appraisal and approval of the plan of biomass energy development… To ensure to reach to the long-term objectives of RES, those policies are substantive important”.
—C2
According to many respondents, policies ensuring that long-term objectives are met and a clear vision on RES penetration targets are key to RES integration. The importance of learning from successful cases is also highlighted.
“Germany is recognized worldwide as an early adopter and visionary leader with its commitment to transit the country to a sustainable economy, of which RES and energy efficiency are priority for development. Vietnam should learn how to set up strategic targets like Germany to successfully integrate RES into its power system”.
—F3
“An inspiring country in terms of strategic targets is Denmark with its commitment to go 100% RES by 2050 while many other countries have the same targets. As a prerequisite, the company targets and policies should be designed with a view on the development of the country goals”.
—A3
It is notable that once the regional goals are set, they can be aligned at the national level with careful considerations of local constraints such as investment costs and resource availability (i.e., spatial planning caused by solar irradiation and wind speed). Several respondents concentrated on a connection between the strategic targets and effective energy policies at different levels. This is exemplified by the following excerpt:
“We understand that to be integrated in Vietnam power system, we have to establish our firm’s objectives and policies towards the national renewable energy’s strategy. We need clear and supportive policies and targets for renewable energy from government”.
—E4

4.2.2. Theme 2. Structural Reforms

Attracting investors is also crucial to RES integration. In this regard, market openings and reforms are key to attracting investors to invest in RES. Notably, 23 out of the 25 respondents highlight the role of energy market reform in integrating RES in Vietnam power system:
“Because Vietnam hopes to establish a reliable and affordable energy supply environment for its all citizens and businesses, it is necessary to reforms the power market. The key behind a successful energy market reform is to allow more flexibility into the system, for instance the opening of the market as well as an efficient cooperation from all market actors”.
—B2
“Even though RES depends on the weather, the whole electricity system must be sufficiently produced to satisfy consumers’ demands and the power grid must be stable. Today’s electricity market, as seen in the countries that have heavily integrate RES, differs fundamentally from their market five years ago. Therefore, reforming electricity market should be priority when integrating RES into the system”.
—G5
There are several ways to add flexibility into electricity market, as shown in comments from respondents: “…incentivizing independent power producers to move from the single buyer model to wholesale competition”—A2.
“Consumers should be motivated to actively join in the electricity market by being offered the real time prices upon on their consumptions. It could be done through efficient power purchase agreements, that might attract investments in RES as well as conventional power generation”.
—F1
“EVN should pay attention to flexible trading: regarding efficient integration of RES to the power system, all electricity generation plants, transmission companies and electricity traders should be able to purchase power as real time prices, so that it is easier to predict the expected capacity of solar, wind or biomass energy”.
—G1
“We think that EVN should eliminate regulating electricity prices on its only side with inefficient supports for others because it will distort all characteristics of the electricity market. Not only investors but also customers will not be able to catch up with the market as power prices do not present the real costs”.
—C2
“I believe that all electricity investments should be driven by markets. It will help investors get right signals of time and where to invest”.
—D3
At the same time, finance and business models are also stressed as significant elements of structural reform.
“Commercial banks are the main source of debt finance for RES followed by private banks and lenders. Besides the opening of the market, the investors payments can be determined by RES incentive schemes. Thus, it is necessary to consider finance model”.
—A2
“RES generators need to be able to compete equally to conventional electricity generators to attract investors. Furthermore, an appropriate and efficient business model could be invested when investors decide to participate in electricity market in general and in RES in particular ”.
—G4
It should be noted that inadequate access to information on the Vietnamese economy may act as an important obstacle for potential foreign investors to the RES field. Hence, structural reforms related to market reforms and finance and business models pave the way for RES implementation.

4.2.3. Theme 3. System Transformation

All of the interviewees agreed that the recent power system is facing new challenges and, thus, has to be transformed in terms of infrastructure, system operations and new market design.
Grid connection of RES is the first contact between the grid operator and the power plant operator and experiences show that this is where most of the barriers occur. The role of grid access and infrastructure is confirmed by many interviewees, such as:
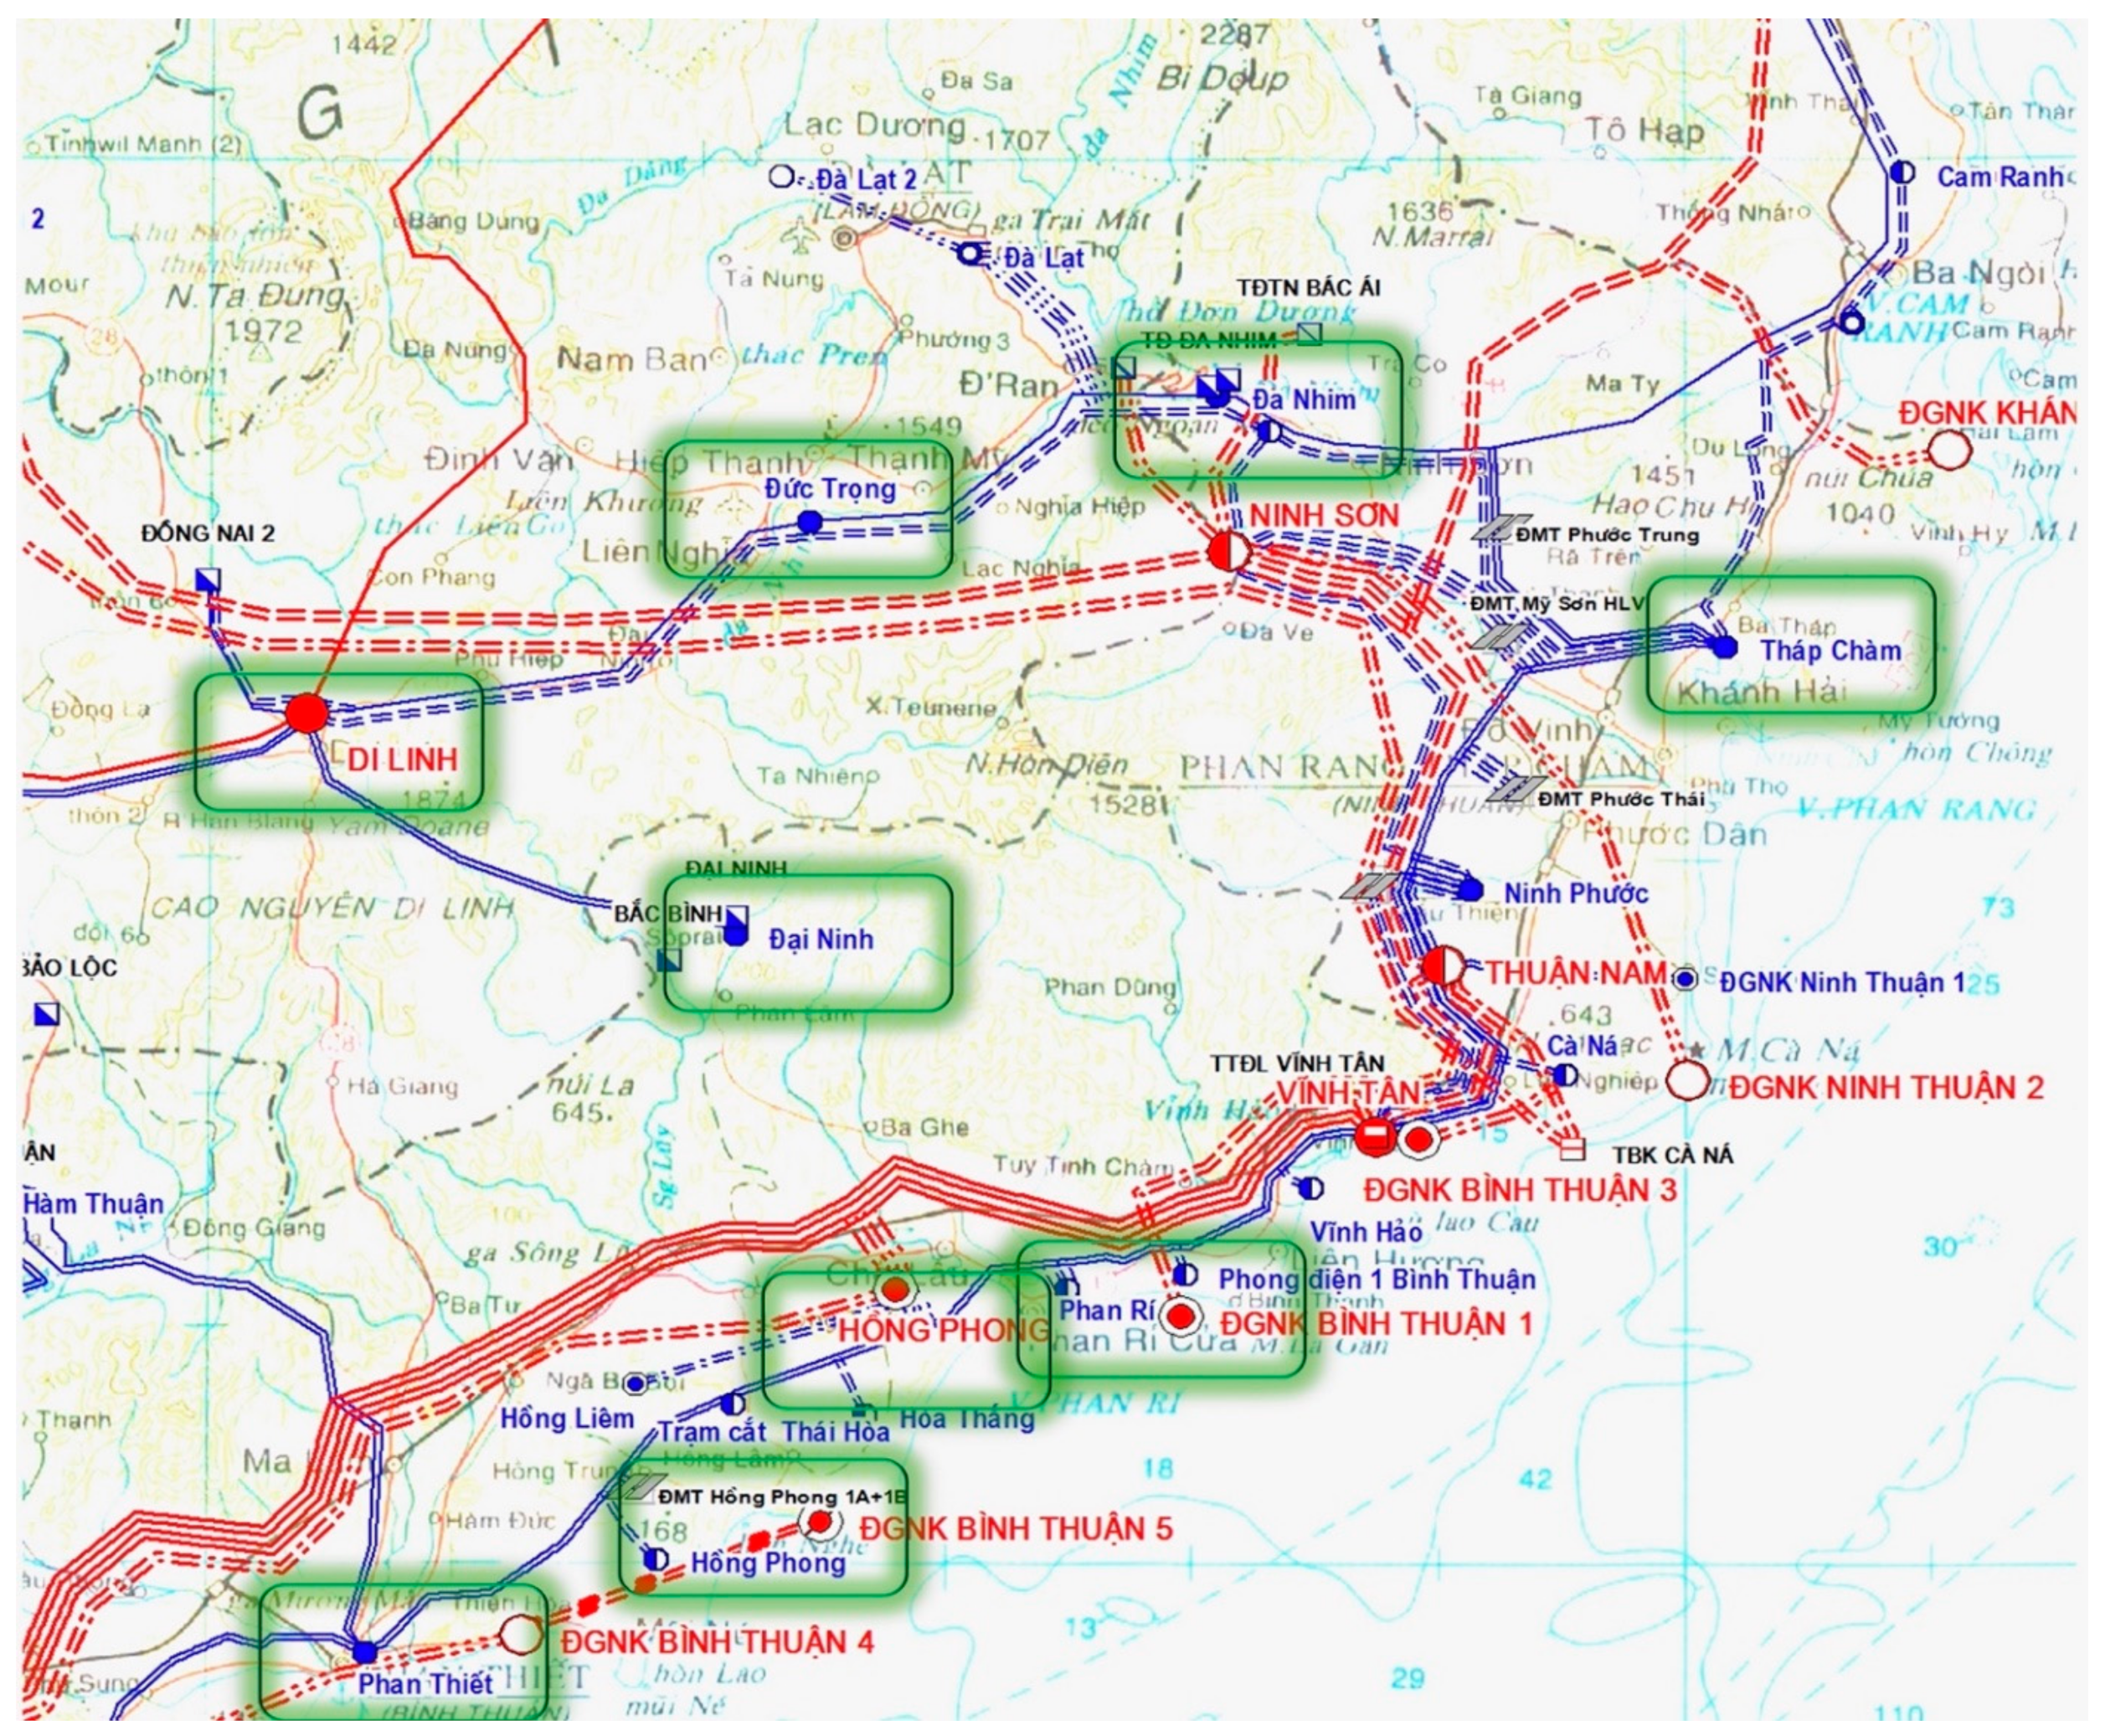
“To overcome the grid overload in Ninh Thuan and Binh Thuan area, EVN and its subsidiaries have made great efforts in investing in power grids’ construction, that serve to release the capacity of RES. Meeting the requirements of the release of RES, especially speeding up the construction investment progress of power transmission grid projects, is the priority of EVN recently”.
—D2
“Denmark and Germany provide positive conditions for grid connection, that make lead-time in the grid connection process shorter. Other countries in Eastern and South-eastern Europe provide negative conditions, that actually hamper the grid connection of RES. Thus, grid connection of RES is the first thing for contact system transformation”.
—F1
Furthermore, enhanced methods for RES generation forecasts are playing a pivotal role in dealing with the operational complexity of intermittent infeed. As a next step to controlling the infeed of RES, network operations that include renewable control centers can act as coordinators between system operators and generators. Respondents revealed that:
“Compared to grid connection there are fewer barriers to a secure grid operation of RES. Volatile RES like wind and solar power cause problems for the grid operation but only with high level of penetration. It is expected that the network operations that include renewable control centers will gain importance in future”.
—B1
Smart and sustainable market design is needed to adequately remunerate the required investment and to set an economically rational standard for reliability by enabling system flexibility through demand side management, storage and cross-border capacity exchanges:
“RES can fully participate in synchronization with demand. A crucial point is efficient DSO-TSO collaboration to best manage distributed RES generation as well as close-to-real time operation to cover forecasting deviation and mitigate unbalances. Hence, smart and sustainable market design needs to be included in strategic approach for integrating RES”.
—G1
It is noted that RES could provide a high level of flexibility as explains of interviewees:
“Indeed, RES can be used as resources for solving congestion during the planning phase and resources for the primary power reserve”.
—E3
“RES can be used as resources for the secondary and tertiary power reserve and resources for balancing”.
—G2
“RES can be used as reactive power reserve for voltage regulation, active power reserve for frequency regulation, island operation of part of the network, demand response and load rejection, and participation in the recovery of the electricity system”.
—F1
These ancillary services can be offered both during normal operation and in emergency situations and can also be offered to address local problems as well as global problems.

5. Discussions and Policy Implications

The study first assessed the adequacy of Vietnam’s generation fleet to cover demand in 2025 and 2030. A probabilistic approach was used to assess the reliability of the generation fleet, including an increasing share of renewable energy.
The results summarized in Table 7 show that, without considering any grid constraint, the security of supply of the Vietnamese generation fleet is not jeopardized in 2025 or 2030 if maintenance is not scheduled during moments where the residual load is high.
Planning minor maintenance during these moments is still possible in 2025, but not in 2030. In both time horizons, no major maintenance should be programed during residual demand peak periods. The completion of the assessment of generation adequacy has enabled to highlight the following policy implications:
First, the study has shown how scheduling minor of major maintenance during peak moments can affect the security of supply. It is recommended to anticipate this phenomenon and identify a maintenance strategy for the generation fleet, considering periods where maintenance is not recommended and where maintenance is safe for the security of supply. In operational planning, renewable energy forecast will help identify whether the proper conditions are foreseen to kick-off any maintenance [26].
Second, data and parameters are key for a sound adequacy assessment of Vietnam’s power system. The development of a database centralizing all the relevant information about renewable power plants is pivotal. With a growing share of (decentralized) renewable generation, gathering the information in an excel file will not be sufficient [5,12].
Third, for all renewable power plants, National Load Dispatch Central (NLDC) should have access to all measurements of generated output. Historical time series are the cornerstone to derive the necessary generation profiles to assess the adequacy of generation [18,19]. The sensitivity (Scenario 4) in the study has shown that more detailed wind profiles can influence the results when wind generation increases. These time series can be stored in the renewable database proposed in the previous recommendation. In the same vein, databases recording all forced and planned outages (and associated parameters like root cause, duration, etc.) helps refine the forced and planned outage rates to be used in the study.
Fourth, hydropower is a significant part of the Vietnamese generation fleet. A detailed study should determine how hydro generation, including pump-storage, should be dispatched with a growing share of renewable [27]. Should pump-storage store solar energy during the day and unload it during the night? How should the hydro reservoir be used during seasons when renewable energy varies with seasons as well? The definition of such a hydro-dispatch strategy should be included in future adequacy study to increase its representativeness.
Fifth, weather-dependent RES is fast-changing and the conventional fleet (including hydro) should be able to compensate these changes to keep the system balance. The ability of the generation fleet to react to fast changes and keep the balance of the system (i.e., its flexibility) should be assessed in a detailed study. The use of a dedicated generation dispatch model would support beneficially this study, just like the hydro-strategy study proposed in the previous recommendation.
Sixth, interconnections with neighboring countries can support the security of supply in the country when the national generation is short. A regional cross-border interconnection study, including the parameters of the generation fleet and demand of each country, could identify which new interconnections would be the most beneficial for security of supply a balance volatile RES.
Seventh, demand-side management can be developed to help covering demand in stressed situations. In this case, demand can be decreased due to a lack of generation. The effect of demand-management can be included in adequacy analysis. In the analysis conducted in this study, demand-side can be simulated by an additional power plant (its capacity is equal to the demand-side management capacity and its forced outage rage is equal to the reliability of the demand-side management service) [12].
In-depth interviews have been used to explore strategic approach to integrating RES into Vietnam’s power system. The results show that three major pillars should be focused in RES integration: strategic objectives, structural reforms and system transformation (Figure 8).
Obtaining strategic objectives through energy policies: The interviews’ results emphasize that establishing strategic objectives is a priority in overall RES development strategy in Vietnam and it is harmonized with general strategic management process [28,29]. Furthermore, strategic objectives are implied by the strategy’s vision. Hence, in this very first phase of integrating RES into Vietnam power system, a clear vision on RES penetration targets must be established. Since the strategic approach to incorporating RES in Vietnam power system is closely linked to the Viet Nam’s Renewable Energy Development Strategy, it is part of a sustainable strategic management, where all strategic management processes are in balance with the cycles of nature [30]. As a prerequisite, to achieve the vision and strategic objectives, it is necessary to establish energy policies focusing on the development of RES in both the national level and the regional level. Furthermore, better and stronger energy policies should be facilitated so that strategic objectives of integrating RES into the power system can be achieved. This is supported by other studies of RES in the context of Vietnam [31].
Organizing structural reforms through energy market reforms and finance and business models reforms: The interviews’ results reveal the critical roles of attracting investors in integrating RES in the power system, which is in line with previous studies of expanding and integrating RES in different countries [32,33]. Market openings and procurement/business models are key for organizing structural reforms. The interviewees highlight key factors of energy market reforms, as well as finance and business models. Given that RES integration is putting a significant challenge to every country’s power sector [34] and that Vietnam hopes to establish a reliable and affordable energy supply environment for all its citizens and businesses [27], market reforms should focus on promoting independent power producers shift to wholesale competition, offering real time prices to customers, ensuring flexible trading and introducing a more coordinated approach to renewable energy support schemes. In particular, it is necessary to create an electricity market that motivates the equal competition between RES and conventional energy producers by considering renewables’ support schemes across the national borders and regional cooperation.
Regarding reforming finance and business models, government and commercial banks are the main sources of debt finance for RES, followed by private bank and lenders [16]. In addition, the opening of the market, the investors’ payments can be determined by RES incentive schemes and this is highly influenced by the costs of RES [13,27].
Increasing RES penetration by system transformation: The interviews’ results also demonstrate that when RES penetration increases, the Vietnam power system is facing more challenges and, thus, has to be transformed not only in terms of infrastructure, system operations and market design. Regarding infrastructure, one of the key success factors to a proper system transformation is a guaranteed grid connection for independent power producers to the grid, under consideration of grid connection rules. This suggestion is also confirmed in several previous studies [35,36].
For networks operations, the results present the significant role of forecasting RES generation, that is also the first objective of this research. Upgrading methods for RES generation forecasts to assess generation adequacy is again highlighted as a substantive part of strategic approach to integrating RES in the power system. Furthermore, it is important to develop and implement renewable control centers or renewable energy management system tool for coordinating and dispatching of the RES. Finally, in line with infrastructure transformation and network operations, market design that is focused on liberalization needs to be considered for system transformation to increase RES penetration. In line with previous research [37,38], demand side management, storage and cross-border capacity exchanges are main market design elements that need to be focused.

6. Conclusions and Future Research

Renewable energy integration has been set as an important goal in Vietnam’s revised PDP7. Essentially, this study contributes to sustainable energy research in two ways. First, it provides novel findings that support renewable energy integration in the context of Vietnam’s power system. Second, the present study is methodologically unique in its use of both quantitative modeling approach and qualitative in-depth interview, which provides an integrative understanding of the research topic.
By using the basic probabilistic modeling approach, the research reveals that, regardless of any grid constraint, the security of supply of Vietnam’s power generation fleet is not threatened in 2025 or 2030 if maintenance is not carried out during periods of high residual load. Furthermore, planning minor maintenance during these moments is still possible in 2025 but not in 2030 and no major maintenance should be programed during residual demand peak periods in both 2025 and 2030. Generation adequacy evaluation becomes novelty in Vietnam’s RES integration context as it reveals a maintenance strategy for the generation fleet, considering periods where maintenance is not recommended and where maintenance is safe for the security of supply.
By in-depth interview of 25 officers/ managers at different levels (government policymakers, provincial authorities, CEOs/managers of electrical generation, transmission, distribution firms), the research proposes an efficient strategic approach, suggesting that three major pillars should be considered to ensure the success of RES integration. These pillars include strategic objectives, structural reforms and system transformation. This qualitative information and these fresh insights complement pure technical analysis in the development of policies and plans for effective RES integration.
This research has some limitations that suggest further research directions. First, the methodology used in generation adequacy assessment is only valid for long-term studies, when the schedule of maintenance is not yet known. The maintenance is introduced in the methodology in a probabilistic way to include this uncertainty in the analysis. At shorter terms (e.g., year-ahead, month-ahead or week-ahead), the same methodology can be applied to assess the security of supply at those time horizons. However, the maintenance programs are known and should not be included in a probabilistic way. Second, the proposed strategic approach for efficiently integrating RES into the current Vietnam’s power system is just an initial approach. Hence, future studies should be conducted to to develop more comprehensive strategies for sustainable development of RES in the power system.

Author Contributions

Conceptualization, B.D. and N.N.; methodology, B.D., N.N. and T.T.; software, B.D. and T.T.; formal analysis, B.D. and T.T.; investigation, B.D.; writing—original draft preparation, B.D., N.N. and T.T.; writing—review and editing, B.D., N.N. and T.T. All authors have read and agreed to the published version of the manuscript.

Funding

This research received no external funding.

Institutional Review Board Statement

The study was conducted according to the guidelines of the Declaration of Helsinki, and approved by the Department of Strategic Management at Thuongmai University (DSM 2021).

Informed Consent Statement

Informed consent was obtained from all subjects involved in the study.

Conflicts of Interest

The authors declare no conflict of interest.

References

  1. Shem, C.; Simsek, Y.; Hutfilter, U.F.; Urmee, T. Potentials and Opportunities for Low Carbon Energy Transition in Vietnam: A Policy Analysis. Energy Policy 2019, 134, 110818. [Google Scholar] [CrossRef]
  2. German Corporation for International Cooperation. Vietnam Power Development Plan for the Period 2011—2020: Highlights of the PDP 7 Revised; German Corporation for International Cooperation: Hanoi, Vietnam, 2016; pp. 1–9. [Google Scholar]
  3. Kloubert, M.L. Assessment of Generation Adequacy by Modeling a Joint Probability Distribution Model. Electr. Power Syst. Res. 2020, 189, 106803. [Google Scholar] [CrossRef]
  4. Council of European Energy Regulators. Assessment of Electricity Generation Adequacy in European Countries; Council of European Energy Regulators: Brussels, Belgium, 2014. [Google Scholar]
  5. Kolev, V.; Georgiev, A.; Sulakov, S. Probabilistic Modelling and Evaluation of System Adequacy. In Proceedings of the 2018 10th Electrical Engineering Faculty Conference (BulEF), Sozopol, Bulgaria, 11–14 September 2018; pp. 1–4. [Google Scholar] [CrossRef]
  6. Oliveira, G.C.; Cunha, S.H.F.; Pereira, M.V.F. A Direct Method for Multi-Area Reliability Evaluation. IEEE Trans. Power Syst. 1987, 2, 934–940. [Google Scholar] [CrossRef]
  7. Billinton, R.; Li, W. Reliability Assessment of Electric Power Systems Using Monte Carlo Methods; Springer: Boston, MA, USA, 1994. [Google Scholar] [CrossRef]
  8. Pudjianto, D.; Aunedi, M.; Djapic, P.; Strbac, G. Whole-Systems Assessment of the Value of Energy Storage in Low-Carbon Electricity Systems. IEEE Trans. Smart Grid 2014, 5, 1098–1109. [Google Scholar] [CrossRef]
  9. Shi, N.; Luo, Y. Energy Storage System Sizing Based on a Reliability Assessment of Power Systems Integrated with Wind Power. Sustainability 2017, 9, 395. [Google Scholar] [CrossRef] [Green Version]
  10. Gao, J.; Ma, Z.; Guo, F. The Influence of Demand Response on Wind-Integrated Power System Considering Participation of the Demand Side. Energy 2019, 178, 723–738. [Google Scholar] [CrossRef]
  11. Huang, D.; Billinton, R. Effects of Load Sector Demand Side Management Applications in Generating Capacity Adequacy Assessment. IEEE Trans. Power Syst. 2012, 27, 335–343. [Google Scholar] [CrossRef]
  12. Teh, J. Adequacy Assessment of Wind Integrated Generating Systems Incorporating Demand Response and Battery Energy Storage System. Energies 2018, 11, 2649. [Google Scholar] [CrossRef] [Green Version]
  13. Alizadeh, R.; Soltanisehat, L.; Lund, P.D.; Zamanisabzi, H. Improving Renewable Energy Policy Planning and Decision-Making through a Hybrid MCDM Method. Energy Policy 2020, 137, 111174. [Google Scholar] [CrossRef]
  14. Nong, D.; Nguyen, D.B.; Nguyen, T.H.; Wang, C.; Siriwardana, M. A Stronger Energy Strategy for a New Era of Economic Development in Vietnam: A Quantitative Assessment. Energy Policy 2020, 144, 111645. [Google Scholar] [CrossRef]
  15. Wüstenhagen, R.; Menichetti, E. Strategic Choices for Renewable Energy Investment: Conceptual Framework and Opportunities for Further Research. Energy Policy 2012, 40, 1–10. [Google Scholar] [CrossRef] [Green Version]
  16. Vietnam Electricity Group (EVN). Ability to Release the Capacity of RE Sources and Supplement the Planning of Transmission Grid Works; EVN: Hanoi, Vietnam, 2020.
  17. The National Electricity System Dispatching Center. Report on Renewable Energy in Vietnam; The National Electricity System Dispatching Center: Hanoi, Vietnam, 2020.
  18. Phoon, H.Y. Generation System Reliability Evaluations with Intermittent Renewables; University of Strathclyde: Glasgow, UK, 2006. [Google Scholar]
  19. European Commission. Identification of Appropriate Generation and System Adequacy Standards for the Internal Electricity Market; European Commission: Brussels, Belgium, 2016. [Google Scholar]
  20. Mouraviev, N. Renewable Energy in Kazakhstan: Challenges to Policy and Governance. Energy Policy 2021, 149, 112051. [Google Scholar] [CrossRef]
  21. Moon, H.B.; Park, S.Y.; Jeong, C.; Lee, J. Forecasting Electricity Demand of Electric Vehicles by Analyzing Consumers’ Charging Patterns. Transp. Res. Part D Transp. Environ. 2018, 62, 64–79. [Google Scholar] [CrossRef]
  22. King, J.; Clifton, A.; Hodge, B. Validation of Power Output for the WIND Toolkit; National Renewable Energy Laboratory: Golden, CO, USA, 2014. [Google Scholar] [CrossRef] [Green Version]
  23. Clifton, A.; Smith, A.; Fields, M. Wind Plant Preconstruction Energy Estimates. Current Practice and Opportunities; National Renewable Energy Laboratory: Golden, CO, USA, 2016. [Google Scholar] [CrossRef] [Green Version]
  24. International Atomic Energy Agency. Expansion Planning for Electrical Generating Systems: A Guidebook—Technical Report Series No. 241; International Atomic Energy Agency: Vienna, Austria, 1984. [Google Scholar]
  25. U.S. Department of Energy. Renewable Fuels Module of the National Energy Modeling System: Model Documentation; U.S. Department of Energy: Washington, DC, USA, 2020.
  26. Jonaitis, A.; Gudzius, S.; Morkvenas, A.; Azubalis, M.; Konstantinaviciute, I.; Baranauskas, A.; Ticka, V. Challenges of Integrating Wind Power Plants into the Electric Power System: Lithuanian Case. Renew. Sustain. Energy Rev. 2018, 94, 468–475. [Google Scholar] [CrossRef]
  27. Nguyen, P.A.; Abbott, M.; Nguyen, T.L.T. The Development and Cost of Renewable Energy Resources in Vietnam. Util. Policy 2019, 57, 59–66. [Google Scholar] [CrossRef]
  28. Dobson, P.; Starkey, K.; Richards, J. Strategic Management: Issues and Cases; Blackwell Publishing: Edinburgh, UK, 2004. [Google Scholar]
  29. Omalaja, M.A.; Eruola, O.A.; College, I. Strategic Management Theory: Concepts, Analysis and Critiques in Relation to Corporate Competitive Advantage from the Resource—Based Philosophy. Econ. Anal. 2011, 44, 59–77. [Google Scholar]
  30. Stead, J.G.; Stead, W.E. Sustainable Strategic Management. Sustain. Strateg. Manag. 2017, 1, 1–287. [Google Scholar] [CrossRef]
  31. Nong, D.; Wang, C.; Al-Amin, A.Q. A Critical Review of Energy Resources, Policies and Scientific Studies towards a Cleaner and More Sustainable Economy in Vietnam. Renew. Sustain. Energy Rev. 2020, 134. [Google Scholar] [CrossRef]
  32. Lv, P.; Spigarelli, F. The Integration of Chinese and European Renewable Energy Markets: The Role of Chinese Foreign Direct Investments. Energy Policy 2015, 81, 14–26. [Google Scholar] [CrossRef]
  33. Hvelplund, F.; Østergaard, P.A.; Meyer, N.I. Incentives and Barriers for Wind Power Expansion and System Integration in Denmark. Energy Policy 2017, 107, 573–584. [Google Scholar] [CrossRef]
  34. Zhang, S.; Andrews-Speed, P.; Li, S. To What Extent Will China’s Ongoing Electricity Market Reforms Assist the Integration of Renewable Energy? Energy Policy 2018, 114, 165–172. [Google Scholar] [CrossRef]
  35. Martinot, E. Grid Integration of Renewable Energy: Flexibility, Innovation, and Experience. Annu. Rev. Environ. Resour. 2016, 41, 223–251. [Google Scholar] [CrossRef]
  36. Wang, F.; Yin, H.; Li, S. China’s Renewable Energy Policy: Commitments and Challenges. Energy Policy 2010, 38, 1872–1878. [Google Scholar] [CrossRef]
  37. Auer, H.; Haas, R. On Integrating Large Shares of Variable Renewables into the Electricity System. Energy 2016, 115, 1592–1601. [Google Scholar] [CrossRef]
  38. Newbery, D.; Pollitt, M.G.; Ritz, R.A.; Strielkowski, W. Market Design for a High-Renewables European Electricity System. Renew. Sustain. Energy Rev. 2018, 91, 695–707. [Google Scholar] [CrossRef] [Green Version]
Figure 1. Part of 220 kV and 500 kV transmission system in Ninh Thuan and Binh Thuan province.
Energies 14 03541 g001
Figure 2. Residual load, total load and available thermal generation in 2025—probability density function.
Energies 14 03541 g002
Figure 3. Residual load, total load and available thermal generation in 2025 with minor maintenance—probability density function.
Energies 14 03541 g003
Figure 4. Residual load, total load and available thermal generation in 2025 with minor and major maintenance—probability density function.
Energies 14 03541 g004
Figure 5. Residual load, total load and available thermal generation in 2030—probability density function.
Energies 14 03541 g005
Figure 6. Residual load, total load and available thermal generation in 2030—probability density function.
Energies 14 03541 g006
Figure 7. Residual load, total load and available thermal generation in 2030—probability density function.
Energies 14 03541 g007
Figure 8. Suggested strategic approach to efficiently integrating RES into the power system.
Energies 14 03541 g008
Table 1. Power curve in the function of the wind speed.
SpeedIEC1IEC2IEC3AverageLossesFinal
000000.120
100000.120
200000.120
30.00430.00520.00540.0049670.120.004371
40.03230.04230.0530.0425330.120.037429
50.07710.10310.13510.10510.120.092488
60.14260.19090.25080.1947670.120.171395
70.23290.31270.40330.31630.120.278344
80.35280.47310.59520.47370.120.416856
90.50240.66930.78490.65220.120.573936
100.67320.85540.91780.8154670.120.717611
110.82870.96410.97960.9241330.120.813237
120.92640.994210.9735330.120.856709
130.97740.994410.9922670.120.873195
140.9946110.99820.120.787416
150.999110.9996670.120.879707
160.9999110.9999670.120.879971
1711110.120.88
1811110.120.88
10011110.120.88
Source: Authors’ analysis based on [22].
Table 2. Unavailability of the generation fleet, depending on the root cause [23].
RangeAverageDescription
Wake Effects0–10%5%
Electrical losses1.5–2.5%2%Collector and substation
Turbine performance1–3%2%Actual operating conditions in comparison with generic conditions
Environmental losses1–5%3%Soiling, erosion, exposure over time
Total in average 12%
Source: Authors’ analysis based on [23].
Table 3. Unavailability of generation fleet, depending on the scenario.
Forced Outages RateMinor Maintenances/YearDurations (Days)Minor Planned Outage Rate [p.u]Availability (Forced + Minor)
Coal10%2.333323.33336.39%83.61%
CCGT5%1.6667256.85%88.15%
Major Maintenances/YearDurations (Days)Major Planned Outage Rate [p.u]Availability (Forced + Minor)
Coal 0.333256.85%76.76%
CCGT 0.333205.48%82.67%
Table 4. Default forced outage-related unavailability of the generation fleet by production type.
TypeFraction of Yearly Hours
Combined Cycle5.5%
Coal6.6%
Combustion turbine3.6%
Hydro3.6%
Waste6.6%
Other steam7.1%
Biomass6.6%
Geothermal6.6%
Intermittent (Wind, PV, etc.)3.6%
Table 5. Profiles of interviewees.
Interviewee’s Organizations/CodeFrequencyPercentage
The National Power Transmission Corporation (A1 → A3)312%
National Load and Dispatch Centre (NLDC) (B1 → B3)312%
Power Generation Corporations (C1 → C3)312%
Vietnam Electricity (EVN) (D1 → D3)312%
Renewable Energy Plants (E1 → E5)520%
Ministry of Industry and Trade’s officers (F1 → F3)312%
Provincial Departments of Industry and Trade’s officers (G1 → G5)520%
Total25100%
Table 6. Results of the interviews.
Themes/Areas of FindingsSub-ThemesBasic CharacteristicsFrequency
Strategic objectivesEnergy policiesPolicies ensure that long term objective are met25
Structural reformsEnergy market reformsReforms pave the way for RES implementation23
Finance and business models19
System transformationGrid access and infrastructureSystem evolves with increasing RES penetration25
Network operations22
Market design and flexibility20
Table 7. Adequacy assessment of the Vietnam power system in 2025 and 2030.
Scenario20252030
Only forces outages (Scenario 1)LOLP: 0
LOLE: 0.00037
LOLP: 0.0048
LOLE: 4.2
Forced outages and minor maintenance (Scenario 2)LOLP: 0.00025
LOLE: 2.2
LOLP: 0
LOLE: 101.204
Forced outages, minor and major maintenance (Scenario 3)LOLP: 0.00669
LOLE: 58.59
LOLP: 0.06711
LOLE: 587.91
Sensibility with 3 zones for wind profiles (North, Centre and South) (Scenario 4)LOLP: 0.00691
LOLE: 59.61
LOLP: 0.07759
LOLE: 679.65
Publisher’s Note: MDPI stays neutral with regard to jurisdictional claims in published maps and institutional affiliations.

