Article

Methodological Proposal for the Assessment Potential of Pumped Hydropower Energy Storage: Case of Gran Canaria Island

by
Hilario J. Torres-Herrera
1,* and
Alexis Lozano-Medina
2
1
Department of Mechanical Engineering, University of Las Palmas de Gran Canaria, Campus de Tafira S/N, 35017 Las Palmas de Gran Canaria, Canary Islands, Spain
2
Department of Civil Engineering, University of Las Palmas de Gran Canaria, Campus de Tafira S/N, 35017 Las Palmas de Gran Canaria, Canary Islands, Spain
*
Author to whom correspondence should be addressed.
Energies 2021, 14(12), 3553; https://doi.org/10.3390/en14123553
Submission received: 25 May 2021 / Revised: 9 June 2021 / Accepted: 11 June 2021 / Published: 15 June 2021
(This article belongs to the Section D: Energy Storage and Application)

Abstract

:
The pumped hydropower energy storage (PHES) assessments carried out so far have been focused on large water bodies obtained from global or restricted-use databases, or, on the other hand, on the application of methodologies to specific areas focusing on the detection of dams. In addition, many assessments do not include data optimization, or include it at the end of the process and are subject to the prior application of restrictions, often stipulated with subjective criteria. The aim of this article is to design a universal and easily applicable methodology for the assessment of viable PHES potential, which provides immediate and reliable results to assist in the energy planning of a given territory. It is classified in ravine basins, including an optimization before using the restrictions. The island of Gran Canaria is taken as the territory of application, whose density of dams is the highest in the world and whose share of hydroelectric energy is, at present, null; besides, no PHES studies have been carried out. The results show that the PHES potential in Gran Canaria is 5996 MWh after applying the optimization and all technical constraints. If all environmental constraints were rigorously applied, the island would have no possible pairing. The results demonstrate the importance of tailoring the restrictions to each particular territory.

Graphical Abstract

1. Introduction

The latest agreement adopted by the international community on climate change is the Paris Agreement, which came into force on 4 November 2016 and establishes the objective of keeping the global temperature of the planet below 2 °C with respect to pre-industrial levels and to do everything necessary to try to reduce this value to 1.5 °C. This ambitious objective implicitly implies accelerating all the procedures that help to achieve it, such as reducing greenhouse gas emissions, increasing energy production from renewable energy sources (RES) and improving energy efficiency. Globally, RES have experienced exponential growth, driven by this international commitment. Installed RES capacity has grown from almost 1227 GW to 2537 GW in the last decade alone (2010–2019) [1]. In other words, more than double the capacity has been installed in just 10 years. Hydroelectric power, in 2019, had 1310 GW installed, equivalent to 51.6% of the total RES installed capacity in that year [1]. However, RES impairs the management of the electricity grid, creating insecurities in the grid, due to the variability of natural resources such as wind and solar radiation [2,3]. For this reason, energy storage systems are required for the grid feed-in of RES energy production to enable secure management of the electricity system. There are many energy storage technologies available today [4]; however, on a large scale, electrochemical batteries and pumped hydro energy storage (PHES) stand out. PHES has been established as a commercially acceptable technology for more than 120 years [5].
Pumped hydropower energy storage (PHES) can be carried out according to the scheme shown in Figure 1 and takes advantage of the reversible turbine mode to generate hydroelectric power, depending on whether we have surplus production due to RES or if, on the contrary, there is a peak in demand to be covered, respectively.
Hydropower plants with PHES are one of the most cost-effective solutions for integrating RES [6,7], at affordable prices [8] and are usually the preferred option for large-scale global energy policies [9,10].
Some studies have evaluated the potential of PHES using geographic information systems (GIS) focusing on the detection of existing locations or the creation of such locations [11,12,13,14], which is usually the main obstacle in the development of PHES plants [12]. These studies focus on various types of artificial or natural reservoir such as: dams, natural watercourses, reservoirs, rivers, ravines, etc. Some focus on small PHES plants [11,13], while others are applied to larger capacities [12,14]. At the European level, Gimeno-Gutiérrez and Lacal-Arántegui [15] evaluated the PHES potential by classifying it into typologies according to the topology of the terrain. Typology T1 is for existing reservoirs. In Spain, the result was 1890 GWh considering reservoirs less than 20 km apart. In addition, only those artificial reservoir pairings with a minimum distance of 150 m in height were considered. Recently, the need to focus on the assessment of small-scale potential has been identified [13] because of its lower greenhouse gas emissions [11] and its lower environmental impact [12]. Lu and Wang [16] estimated the PHES potential in Tibet, considering only reservoirs with a height difference of more than 500 m and considering a number of constraints such as the head/distance ratio between dams and the distance to the power grid; however, no environmental impact criteria were included. Rogeau et al. [11] estimated the potential of small-PHES in France, considering the natural depressions of the territory and estimating energy costs. As a result, it is found that small-PHES also suffer from scale effects in terms of technology cost, as do large-PHES. However, the application of small-PHES at the national level does not in itself solve the energy policy problems. Soha et al. [13] add open pit mines as possible locations and restrict the sites based on the technical complexity of the terrain, however, they stick to mid-mountain terrain. Others, such as Ghorbani et al. [12], decided to include seawater as a possible lower reservoir, reducing the environmental impact by avoiding the construction of one of the reservoirs and avoiding the use of fresh water. Ghorbani et al. [12] focus their study on large artificially constructed reservoirs and on rivers.
However, energy storage is booming on the global scene, with global installed capacity expected to increase by more than 200% in the 2014–2050 period [17] and technologies are developing faster due to the momentum coming from institutions and companies [18]. PHES technology has been on the market for years [5]; however, many countries need to assess its potential because it is necessary to design the right energy policy to serve as a basis for the implementation of future PHES projects, as it still plays a key role in the energy landscape [17].
As a summary of the background information analyzed, a knowledge gap is detected in the optimization of the results; some studies do not consider it while others do it at the end of the methodology, in such a way that this optimization is subject to the selected restrictions, with the corresponding degree of subjectivity that this implies. The effects of applying the optimization before applying the set of constraints are not known. On the other hand, a choice of constraints adjusted to the particular territory is not addressed. More detailed field work is needed for this task. In addition, the calculation of the potential does not provide accurate data as it does not consider the head losses in the pipelines of the PHES plants. It is not known what influence head losses have in methodologies similar to the one proposed here. Nor do we see studies that approach the evaluation of potential from a more detailed and useful point of view, structuring the methodology in gully basins. This approach could provide a more enriching vision for decision making in energy planning. In addition, existing potential assessment studies require time-consuming mathematical and graphical developments, making it difficult to replicate these methodologies. It is necessary to know if a methodology can provide accurate results with a simpler application.
This study aims to propose a new methodology whose contributions will help to overcome the shortcomings described in the previous paragraph. The methodology is therefore easy to replicate elsewhere, as it does not require time-consuming mathematical and graphical processes. It is applicable to existing dams of any scale and the restrictions it contains are selected according to each territory; therefore, it is modular. Moreover, these constraints are applied after the optimization, so that if we modify the constraints, the optimization is not invalidated. The optimization ensures that a dam cannot belong to two different pairings. The fact that we focus only on existing dams increases the speed of decision making on the implementation of projects by the social agents, since the first projects to be implemented should be those in which there is no new construction of dams, due to the high cost involved [8]. The purpose of this methodology is to demonstrate the importance of the choice of constraints and to check the influence they have on the final result, taking into account that they are applied after optimization and depending on the territory considered. The most relevant constraints in the territory of application are selected. On the other hand, we have considered the application of technical and environmental constraints, without going into the calculation of costs. Regarding the calculation of the energy potential, we have estimated the load losses in the pipelines for greater precision in the calculation. Another noteworthy contribution is the classification of dams according to their belonging to the ravine basins existing in the territory and the results are also expressed according to this scheme. Geographic Information Systems (GIS) data are used for the location of the existing dams and the application of the different types of restriction. Finally, the results of the estimated potential on the island of Gran Canaria, Spain, the place chosen for the application of the methodology, where the total potential at the island level has not been studied considering small-PHES and large-PHES, are presented. This evaluation of potential can be used as a database of the best sites for power plants.

Case Study: Gran Canaria Island, Spain

The European Union, in the Framework for Action on Energy and Climate, established for the year 2030 that member countries, collectively, should strive to achieve a 32% share of energy from renewables in the European energy mix. This figure includes hydropower as RES. By the end of 2019, the Kingdom of Spain had a 37.5% share of electricity generation from renewables [19]. Of the total RES production, hydropower accounts for only 25.3%. Moreover, not all regions of the country are progressing at the same pace. In the Canary Islands region (see Figure 2), the share of renewables in terms of energy production in the total energy generation mix of the region was 15.9% [20]. Of the total energy production due to RES, the contribution of hydroelectric energy on the island of Gran Canaria is zero.
The European Union also requires Member States to develop energy storage facilities. The Spanish government approved an Energy Storage Strategy [21] in early 2021 to accelerate the decarbonization of the Spanish energy system. The strategy aims to have a storage capacity of 20 GW, which already includes the 8.3 GW currently in place [21].
The island of Gran Canaria (see Figure 2) has been selected because it is one of the territories in the world with the highest density of dams per unit of surface area [22]. Furthermore, it is surprising that there is only one hydroelectric power plant planned for implementation, the Chira-Soria hydroelectric power plant, whose project is still in the public information phase [23] and that no scientific studies of the island’s storage potential have yet been carried out. There is no large-scale storage on the island [20]. The future Chira-Soria plant will not be sufficient to cover the year-on-year growth rate of RES penetration [20], which is expected to persist over the next 10 years. The island had 205 MW of RES installed capacity at the end of 2019. Studies on the island have analyzed the role of PHES on the island [24,25]; however, they do not comprehensively calculate the potential across the island or apply it to a specific project on another island in the region [26]. Other studies focus on describing the contribution of PHES to the island in a specific area in the west of the island, taking the sea as the lower reservoir [27]. Finally, Padrón et al. [28] detail the contribution of PHES from an island grid connection point of view, giving as an example only one pairing between two dams. Despite the presumably, high potential on the island due to its number of dams already built, we hypothesize that many of the pairings of dams that can be built are not feasible and, therefore, far from a theoretical potential based on formulas belonging to the field of hydraulics, we propose the development of a methodology for the calculation of the useful, viable and realizable potential that can be exploited on the island.

2. Methods

The aim of the methodology is to provide information on the viable storage potential in a given region in an optimized manner and it is also intended to serve as a support for choosing the best locations based on a series of technical and environmental criteria. Given the considerable density of large dams per unit area on the island of Gran Canaria, we have taken it as the region for the application of the methodology. Only one typology is considered for this study, which is to analyse the potential of existing large dams [29] and this methodology does not contemplate the creation of new dams.
Viable potential is understood as that which indicates a value that can be used for decision making in the implementation of the individual projects of each connection. This is why this study is intended to be of practical use. The flow diagram shown in Figure 3, is constructed as a series of acceptability criteria and technical and environmental parameters are applied as restrictions or filters in the different steps of the process, always with the objective of maximizing the production of stored energy and minimising the environmental impact. This methodology contains an optimization process that allows us to decide which hydroelectric power plant projects should be given priority for implementation.
The proposed methodology consists of obtaining, from the data of existing dams and the possible connections between them, a calculation of the useful and viable potential for energy storage, in such a way that it constitutes a solid basis for the implementation of the various PHES power plant projects that can be concluded at the end of this study. The methodology is structured as follows:
  • Detection of dams and creation of connections (See Section 2.2):
    (a)
    Detection of existing dams and their georeferencing on the map. Processing of previous data on dams to calculate their potential. Classification of the territory into ravine basins and interbasins.
    (b)
    Creation of a large dataset with all possible connections or pairings (combinations).
  • Calculation of theoretical potential and application of acceptability constraints (See Section 2.3):
    (a)
    Calculation of the theoretical energy storage potential, without applying any constraints.
    (b)
    Application of the technical acceptability constraints (maximum distance and minimum height between dams) to the dam pairings and attainment of a new data set.
  • Optimization (See Section 2.4):
    (a)
    Optimization of the connections resulting from step two: one connection per dam, maximizing the stored energy.
  • Application of constraints (See Section 2.5):
    (a)
    Application of the rest of the technical restrictions previously defined: maximum volume, minimum volume, minimum stored energy, maximum height above sea level (altitude), maximum head-distance ratio and distance to the electricity grid, etc.
    (b)
    Application of environmental restrictions: discarding those connections with any of its dams included in any of the environmentally protected areas (Canary Islands Network of Protected Natural Spaces, Natura 2000 Network and Biosphere Reserve) and attainment of the list of selected connections.
  • Calculation of the viable storage potential (See Section 2.6):
    (a)
    Calculation of the viable storage potential of the selected connections.
This methodology is open to variations in the restrictions applied, so that a multitude of modifications or variations in the criteria for applying restrictions can be carried out. This gives the methodology a modular character. The proposed methodology is summarised in the flow chart presented in Figure 3.

2.1. Main Model Assumptions

In the methodology for the calculation of the viable potential that we propose, we consider only the existing dams (see Table 1) in a territory for the development of the operating scheme proposed in Figure 1. On the other hand, the possibility of using the sea as a lower reservoir is not considered [12]. In addition, Katsaprakakis et al. [30] studied the use of the sea as a reservoir on islands with low penetration of onshore wind power. However, the purpose of this methodology is to assess as a priority those land-based sites that have not been exploited because their potential has not been assessed. The assumption has been made only to use dams as reservoirs, because the dams which have been constructed are hermetic, facilitate faster project implementation and are often unused in energetic and hydraulic terms. In addition, the use of these dams as part of a hydroelectric power plant would imply an adaptation and filling of those dams that are not in operating conditions and so could be used for other complementary uses, such as the implementation of solar photovoltaic plants on the surface [31,32] or irrigation for farmers in the areas located below the connected dams.
The distance between two dams in the vertical plane has been taken as the difference between the height of the dam bed at the higher elevation and the crest height of the dam at the lower elevation. This gross head difference becomes a net head difference when pipe head losses are added (Section 2.3.1). However, the net head difference has been used in the calculation of the stored energy. For the acceptability constraint corresponding to the head difference, the gross head difference between dams has been used. Hereafter, the height difference between dams is referred to as the “height” between dams for reasons of simplicity.

2.2. Detecting Dams and Creating Connections

2.2.1. Detection of Existing Dams

There are several databases containing information on the water bodies existing in a territory. At a global level, we have the World Register of Dams, produced by the International Commission on Large Dams (ICOLD) and the Global Reservoir and Dam database (GRanD). In the European environment we have the European Catchments and Rivers Network system (Ecrins). However, the lack of georeferencing of dams or the prioritization of very large dams means that these databases are not the most suitable for our purposes.
For smaller dams it is preferable to use databases specific to each country, normally managed by the national geographic institutes, such as: the SNIG of Portugal, the IGN of France and the IGN of Spain, which offer adequate databases at the national level. In addition, if they exist, it is advisable to locate databases of a regional nature, as these databases sometimes increase the detail and amplify the information provided by the national system.
On the other hand, the terrain to be studied is divided into ravine basins and interbasins, each with its own group of dams, in order to present the results obtained with a greater degree of detail and specification. Connections can be established between dams corresponding to different basins or to different interbasins. In addition, connections can also be generated between a dam belonging to a basin and a dam belonging to an interbasin. This is why we will use this classification as an alternative way of presenting the results, in case the potential is to be zoned in this way and to facilitate priority areas for action.

2.2.2. Creation of a database of Possible Connections

Using the data described in Section 2.2.1 and after having processed it to obtain information that does not appear in the software, we create a database with all possible combinations. No constraints or optimization are considered in this step. The dams are joined in pairs, so that one dam can be paired with several other dams. In the new dataset we will have the raw list with all possible connections.

2.3. Calculation of Theoretical Potential and Application of Acceptability Constraints

2.3.1. Calculation of Potential before Constraints

Starting from the final dataset obtained in Section 2.2.2 and before applying any acceptability adjustments, we will calculate the theoretical energy storage potential of the final dataset.
The assessment of the energy storage potential of a connection between two dams will depend on the potential hydraulic energy available in the limiting reservoir, i.e., that with the lowest volumetric capacity, this being estimated as follows:
E = ρ · g · H · V · η
where:
  • E = connection energy (Joules).
  • ρ = water density (Kg/m3).
  • g = acceleration of gravity (m/s2).
  • H = net height difference (m), after calculation of head losses.
  • V = volume of water to be transferred, calculated as the smaller volume of the two dams involved (m3)
  • η = pumped storage plant efficiency, assumed to be 0.87.
On the other hand, the net head difference is obtained from the gross head difference and the addition of head losses. The inclusion of head losses has been dealt with in other studies dedicated exclusively to this purpose, such as the mathematical model proposed by Mousavi et al. [33]. In the present study, it is only intended to have an estimation of these losses in order to make the calculation more precise, but it is not the main purpose to develop mathematical models for this purpose. For this reason, for the calculation of the head losses, hf (m) detailed in Equations (2) and (3) we will use the Darcy–Weisbach formula [34]:
h f = λ · L · v 2 2 · g · d
Δ H C = λ · v 2 2 · g · d
Being the total pipe length L   ( m ) , the mean fluid velocity v   ( m / s ) , the dimensionless Darcy-Weisbach coefficient of friction λ , the gravitational field strength g   ( m 2 / s ) and the internal diameter of the pipe d   ( m ) . Resetting Equation (2) we have Δ H C   ( m / m ) , which represents the continuous pressure losses per unit length of pipe.
Finally, in Equation (4) we use the expression of the electrical power P   ( W ) as a function of electrical energy E   ( J ) and time t   ( s ) , which is necessary in the calculation of the installed storage power:
P = E t  
The dam with the lowest volumetric capacity has been taken as the limiting dam in the energy calculation, regardless of whether this dam is the one at the lower or higher altitude of the two that make up the pairing. This avoids discarding connections for the sole reason that the dam with the higher capacity is at a higher altitude.
What is described in this section will also be used in all potential calculations that the methodology includes throughout the flowchart (Figure 3).

2.3.2. Technical Acceptability Restrictions

The dataset obtained in Section 2.2.2 includes a multitude of connections that cannot be realised due to their high improbability of execution. In order to restrict this list and work on a real basis, a series of acceptability restrictions must be applied. In this study, the maximum distance between dams and the minimum height between dams are used as adjustments to the methodology for greater speed of calculation and manoeuvrability. The values chosen as limiting values are shown in Table 2; those values that exceed these limits are not considered viable or executable. On the other hand, care has been taken not to choose excessively restrictive values, as this would lead to a low number of connections to be treated in the methodology, which would imply an impoverishment of the study.
In areas with steep and rugged terrain, for example, it is not possible to establish connections between dams over long distances, due to the high costs involved [8]. For this reason, a maximum distance value must be established that allows us to move within a realistic framework for the calculation of the energy storage potential. This value has been set as 5000 m, which has been overdimensioned to include a greater number of pairs of dams to be analyzed by applying restrictions. On the other hand, the height difference is a major factor in the calculation of the hydraulic potential energy, as it depends, among other factors, on the height difference, as shown in Equation (1). Too small a head difference will considerably reduce the energy yield of the hydroelectric power plant at the connection. In this section, only the gross head difference between dams is considered, without taking into account head losses (see Section 2.1). The net head difference is only used in the calculation of the potential of Equation (1).
After applying these restrictions, the dataset changes, although it still considers pairings of one dam with several other dams. The optimization of this process will be considered in the next section.

2.4. Optimization

One Connection Per Dam, Maximizing Stored Energy

This methodology can be modulated, i.e., the potential can be calculated in any of its steps. This allows you to stop at one or another of these steps as needed, or to reverse the order of a group of factors or all of them. This is why the optimization is applied after the acceptability conditions, mainly because after optimizing the process, the variations on how to apply the rest of the technical and environmental constraints multiply exponentially. The rest of the methodology is based on the restrictions that we have considered most important in the environment of the territory of application, in this case the island of Gran Canaria, since, as already described, the variants of this methodology would entail a much more extensive study which has not been planned for this article.
Among the selected connection pairings, it may happen that some dams are in more than one pairing. Although there is the possibility of connecting one dam to two or more dams, this situation is not intended to be the subject of this study. We consider that the power plant operation scheme described in Figure 1 can involve only two dams. That is why in this step we decided to use an optimization of the dataset as described in Equations (5)–(7). However, in order to choose the optimal connection for each dam we need to do it according to an optimization criterion, in this case, that criterion will be the stored energy of the connection. For this, we optimize in such a way that we consider the problem to be a multidimensional knapsack problem [11]. For the optimization, we have taken into account what has been described by Akçay et al. [35], detailed below:
m a x Z = j = 1 n e j x j
s u b j e c t j = 1 n a i j x j 1 ,      i [ 1 , m ]
      x j { 0 , 1 } ,      j [ 1 , n ]
where j is the number of the connection and i is the number of the dam; x j is the number that decides the possibility of making the connection and e j is the stored energy to be maximizedIn this equation, a i j is the matrix of dams and connections, that describes whether connection j concerns dam i.

2.5. Application of Restrictions

2.5.1. Application of the Remaining Technical Restrictions

It has been decided to establish a number of technical constraints, in addition to those used for the acceptability of the results described in Section 2.3.2. These restrictions may be seen in Table 3. The volumetric capacity of the dams directly influences the calculation of the energy of the pair of dams, as can be seen in Equation (1). As for the maximum volume, no limit is set, as the results for the largest dams existing in a given territory are of special interest.
On the other hand, the parameter of the maximum altitude of the connection is included, which limits those locations that involve high costs, such as that related to the distance to the electricity grid [36]. In addition, the head/distance ratio parameter considers the relationship between two parameters that are already applied independently of each other. The stored energy parameter is also included, to ensure connections whose possible implementation in the form of a hydroelectric power plant is of considerable significance, although this limit has been set so that not too many pairings are left out of the analysis.

2.5.2. Distance to the Electricity Grid

Finally, Table 3 shows a vitally important parameter, the distance to the electricity grid. The generation plants distribute the energy through electrical substations throughout the territory to the points of consumption. This restriction considers the distance of the pairs of dams analyzed to the nearest electricity substation. This is intended to reduce the construction costs of the power plant and avoids long distances of electrical cabling [37], reducing the environmental impact. This factor could have a decisive influence on the viability of whether or not to implement a given hydroelectric power plant project. Building a new substation and a new line has a very high cost, so the smaller the distance between the power plant and the nearest electrical substation, the lower the cost of connection to the grid. To apply this parameter, the existing substations and the substations to be built in the short term have been considered.

2.5.3. Environmental Constraints

The inclusion or non-inclusion in some type of environmentally protected area by some environmental management instrument, whether regional, national or international, is used as a restriction. In the case of this methodology, the following have been highlighted: the Natura 2000 Network, both the Special Area of Conservation (SAC) and the Special Protection Area for Birds (SPAB); the Network of Protected Natural Spaces, which includes categories such as National Parks; Natural Parks; Rural Parks; Special and Integral Nature Reserves; Natural Monuments; Protected Landscapes; and Sites of Scientific Interest; and the Network of Biosphere Reserve Spaces. These restrictions are shown in Table 4. If any of the two dams making up a pairing were to be located in any of the areas described in Table 4, then that pairing would automatically be excluded.
However, current regional and national environmental legislation establishes a procedure for evaluating each connection individually in the event that it is to be implemented and an environmental impact study must be carried out for this purpose. This study could be considered favourable for the execution of the project by the administrations if the execution of the hydroelectric plant corresponding to a connection is considered to be of little or no significance. It should be borne in mind that all the dams under study have already been built and that, therefore, the impact on these protected areas is reduced to the minimum possible, as the construction of the dams is the main factor of negative environmental impact that the creation of a hydroelectric power plant by PHES can have, in addition to the time involved in the construction of the dams [38].

2.6. Calculation of Viable Storage Potential

The calculation procedure described in Section 2.3.1 is applied again, but the result in this case is a feasible and realizable energy storage potential, valid to take as a reference for any action. The results that originated are those that were analyzed and compared with all the results taken throughout the process. They are also classified according to the basins or interbasins to which the dams that make up the pairings belong.

3. Application to the Case of Gran Canaria

This section presents the results obtained from the application of the method described in 
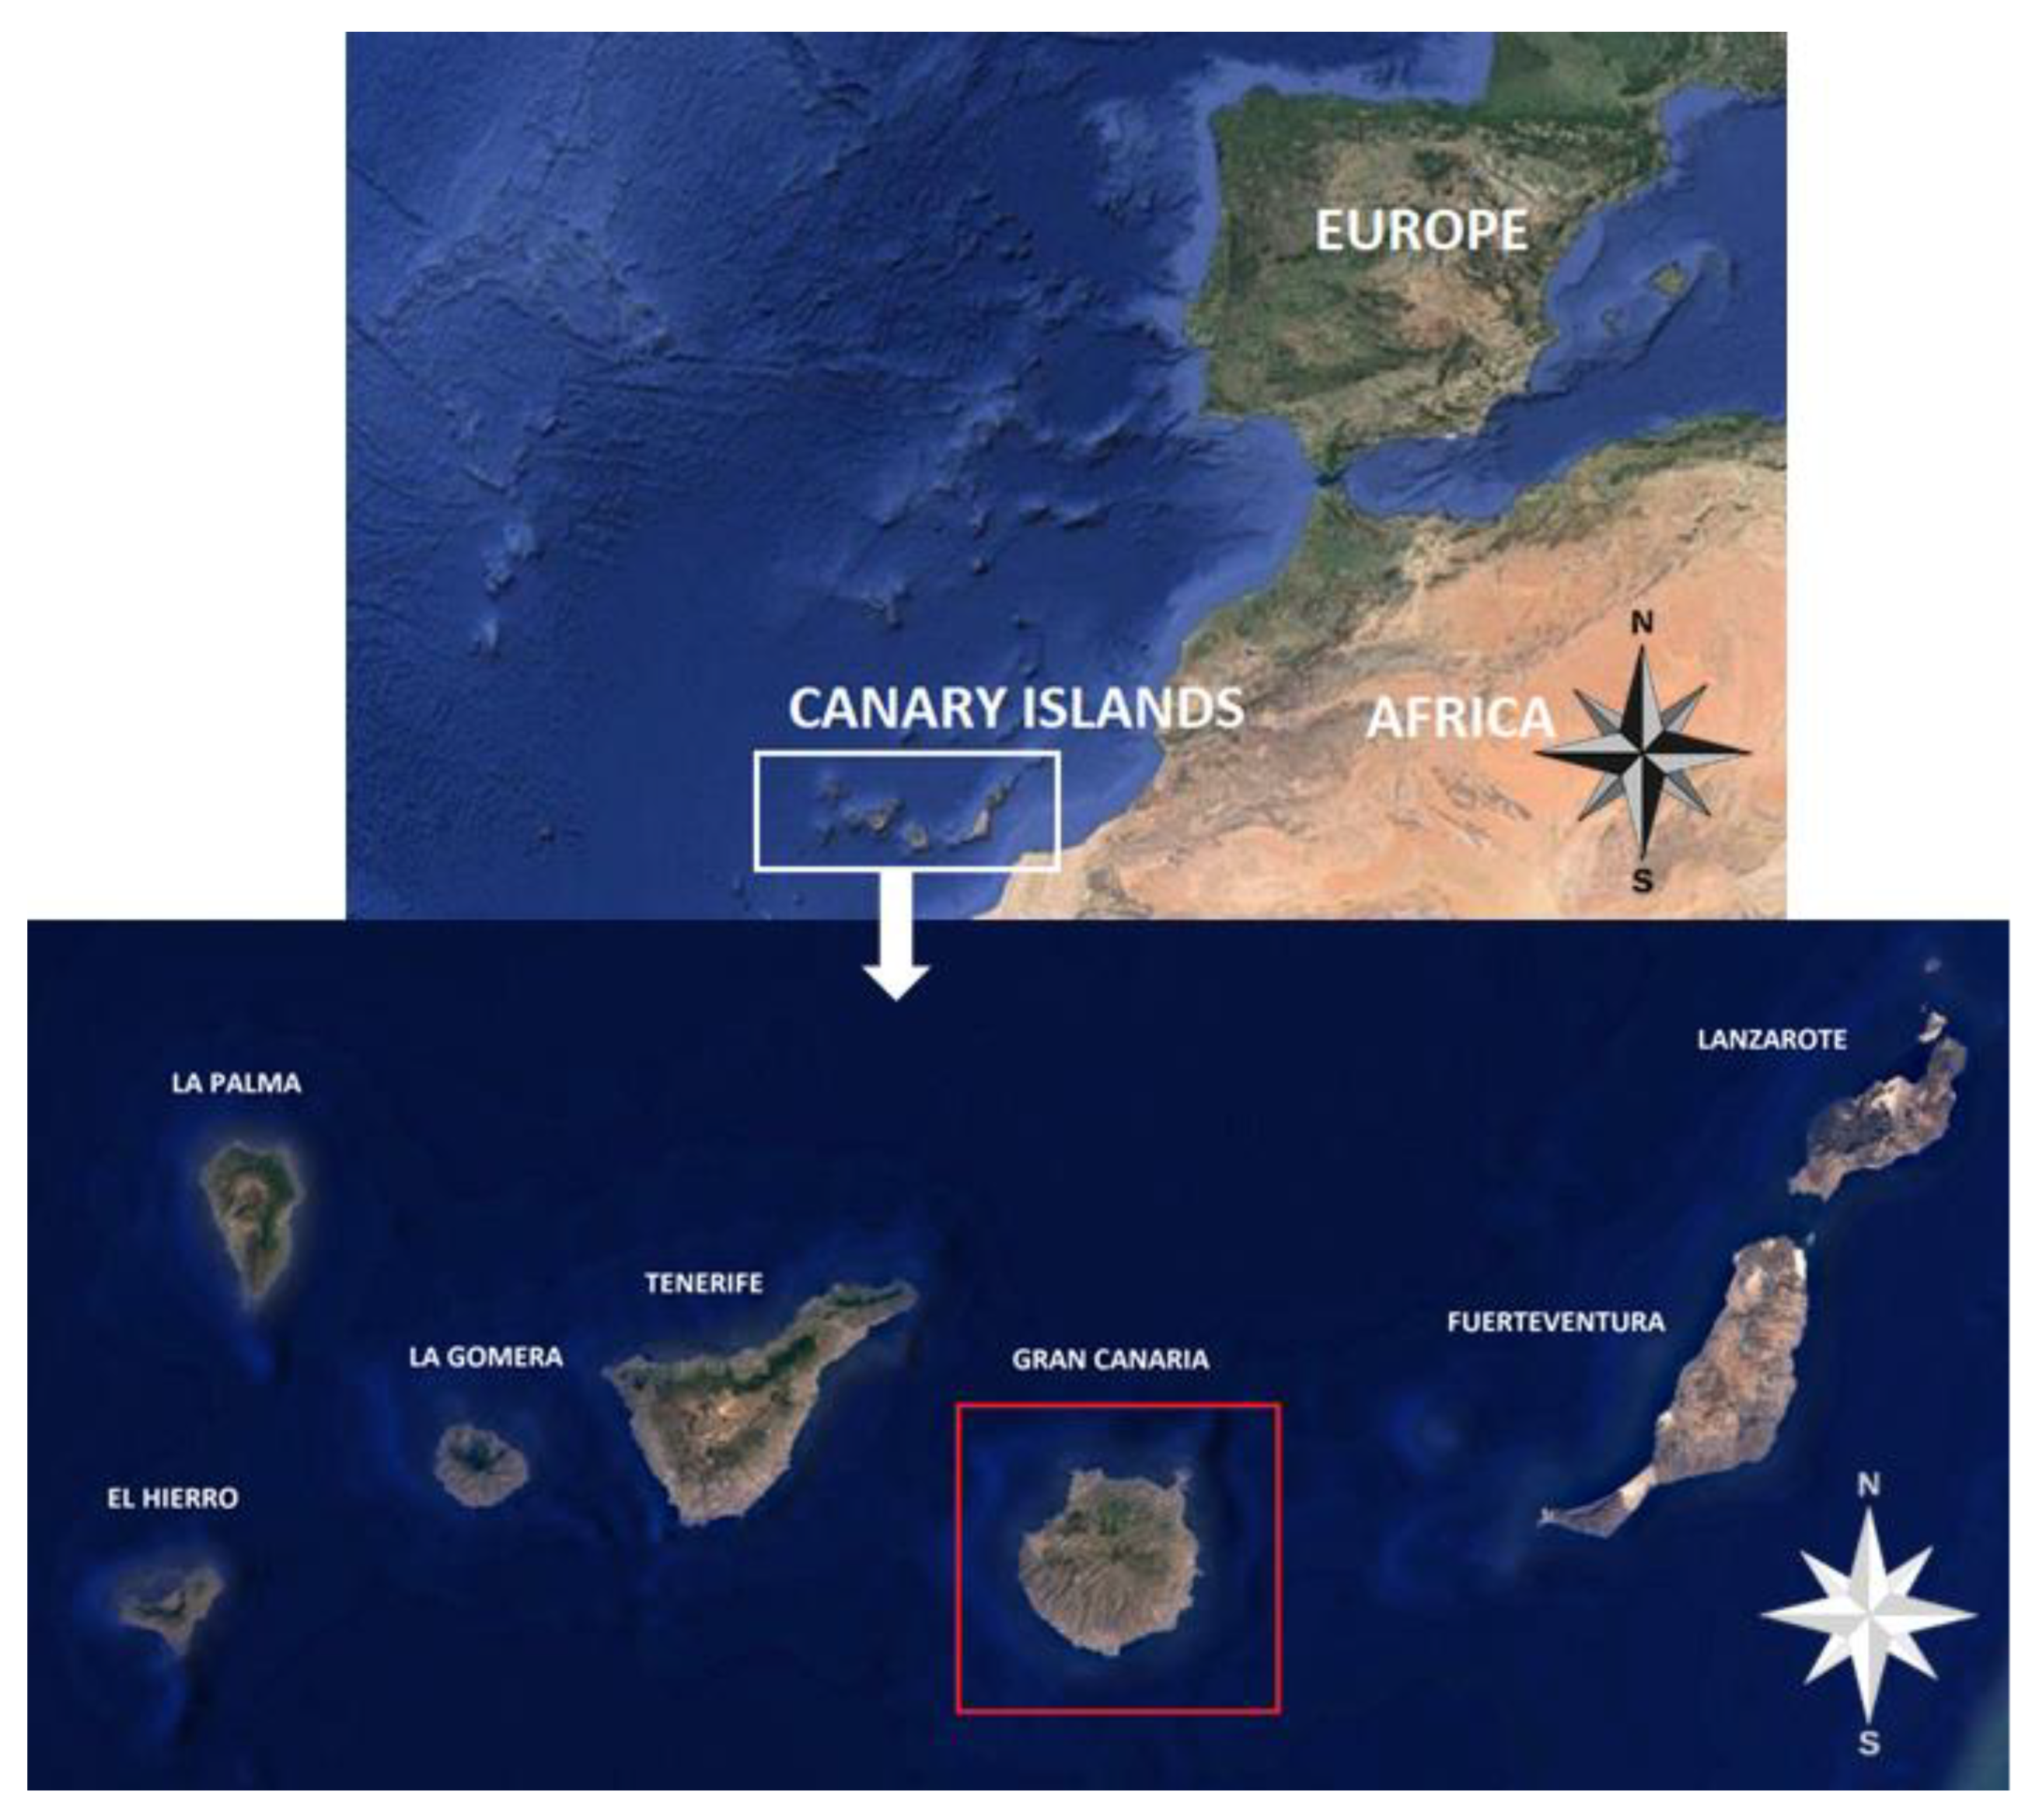
Section 2 to the island of Gran Canaria. This island belongs to the province of Las Palmas, in the region of the Canary Islands, Spain. Gran Canaria is located in the southwest of the Iberian Peninsula, at 28° North latitude and 15°35′ West longitude. Its total surface area is 1560 km2. Its maximum altitude is 1956 metres above sea level. It consists of a rugged volcanic landscape with an average height of 150 metres. Of the 114 “large dams” existing in the eight Canary Islands, Gran Canaria has 69, more than 60% of the total. In relation to its surface area, it is considered the area with the highest concentration of dams on the planet. The island has 172 dams, which are divided by the local authorities into 69 “large dams” and 103 “small dams”, according to the local nomenclature used by the island’s government, the Cabildo de Gran Canaria [22]. The “large dams” are hydraulic works for the retention of water in ravines with a height of more than 15 metres or with a capacity of more than 100,000 m3 [22]. For simplicity of wording, the term “large dams” will be replaced by the term “dams”. It is not the purpose of this study to apply the proposed methodology to what are considered “small dams” at the local level, in order to avoid considering excessively low storage capacities. However, the methodology is designed to be applied also to sites with small capacities.
As part of the study in this document, it has been decided to divide the surface area of the island into zones delimited by ravine basins and interbasins, as detailed in previous sections. Each of these includes one or more ravine channelswhich house the different dams on the island.
Considering the difficulty of the extremely complicated terrain of the island (with very steep orography) and the high cost of creating new dams, it has been decided to apply the methodology to the island of Gran Canaria as it is considered the most representative area of the T1 typology (Table 1). The data sets used and the results of the assessment of the potential will be reported in this section.

3.1. Dataset Choice and Connection Detection

In our application of the method, we will use the Spatial Data Infrastructure of the Canary Islands (IDE Canarias), included in the Spatial Data Infrastructure of Spain (IDEE), belonging to the National Geographic Institute of Spain (IGN). The IDE Canarias GRAFCAN Viewer Version 4.5.1 [39] has a maximum resolution of 10 m. This software contains all the dams to be analyzed in this study, as well as the basins, interbasins, watercourses and ravines that make up the island (see Figure 4). All the island’s ravines start, in the first instance, from Pico de Las Nieves, the point on the island with the highest elevation above sea level and located in the geometric centre of the island. Our study aims to offer the results broken down by basin and interbasin, so these data are of vital importance. If we look at Figure 5, we can see the distribution of the 69 “large dams” on the island in relation to the aforementioned breakdown. In addition, for further information on the dams, we have used data from the Consejo Insular de Aguas de Gran Canaria (Gran Canaria Water Board) [22], a public body belonging to the island government of Gran Canaria. These data include surface area, volume, state of exploitation and height.
Figure 4 shows the study area divided into the different basins and interbasins existing on the island on a steep terrain. Each basin has the bed of a large gully of the island, which crosses it until it reaches the sea. It is this ravine that gives the basin its name. Some basins have more ravines in addition to the main one described above. The basins with the largest extension correspond to the ravines of La Aldea (182 km2), Maspalomas (134 km2) and Arguineguín (94 km2).
Figure 5 shows the distribution of the island’s “large dams” divided into the different existing basins and interbasins, on a terrain whose relief has been highlighted in order to give an immediate idea of the height above sea level at which these dams are located, where the relief increases as we approach the highest point of the island.
With the IDE Canarias Viewer Version 4.5.1, we have also been able to locate the different environmentally protected areas on the island. Although it is true that the connections discarded because they are in these areas will be subject to an environmental impact assessment study:
-
Natura 2000 Network: European ecological network of biodiversity conservation areas, either Special Areas of Conservation (SAC) or Special Protection Areas for Birds (SPAB) (see Figure 6). 50% of the island’s land area belongs to one of the two categories of this protection instrument.
A large number of the dams analyzed in this study are located in the SAC Zone, specifically 28.99% in relative terms. Essentially, this zone is concentrated in the southwest and west, which coincides with the least populated area of the island. On the other hand, in Figure 6, the SPAB Zone occupies a smaller area than the SAC Zone, being mainly centered in the south and west of the island and the proportion of dams included in this category is 13.04%.
However, the greater dispersion of dams in the southwest and west of the island compared to the north and east of the island reduces the proportions described.
-
Canary Islands Network of Biosphere Reserves: UNESCO project to conserve biodiversity in a sustainable way. The island of Gran Canaria has 46% of its territory declared a Biosphere Reserve (see Figure 6.). This environmental protection is quite restrictive and covers land and sea. Some 33% of the island’s dams are located in this category.
Again, the protected territory is located in the southwest and west of the island, due to the high environmental value in terms of the number of native species, the scarce economic development in the area and the scarce or non-existent population. For all these reasons, this area has been the most unaltered area by humans over time.
-
Canary Islands Network of Protected Natural Spaces: It should contain the main habitats and centres of diversity (see Figure 6). It includes several categories: National, Natural and Rural Parks; Special and Integral Nature Reserves; Natural Monuments; Protected Landscapes; and Sites of Scientific Interest. 43% of the island’s surface area is in one of the above categories and 31.88% of the dams are located in this area. This instrument contemplates a greater dispersion in terms of the territories it protects.
In summary, it can be deduced that the island, which is relatively small in size, has a high level of environmental protection through any of the instruments described, in any of their categories This makes it a decisive factor in making decisions on the choice of suitable sites for the implementation of future pumped-storage hydroelectric power plant projects (PHES) in the aforementioned connections.
To form the initial connections, all possible pairings between two dams were established, so that for the 69 “large dams” on the island, a total of 2346 possible combinations were produced.

3.2. Distance to Grid Connections

The steep volcanic terrain of the island requires that the distance to the power grid of an inter-tie between two dams be as short as possible. This would favour the technical implementation of the PHES project and its economic viability [16]. In addition, the environmental impact of large extensions of high and medium voltage lines would be very high [40].
The location of the hydroelectric power plants and electrical substations, both existing and those to be built in the near future, is obtained with the software of the Spatial Data Infrastructure of Gran Canaria (IDE Gran Canaria). This software, IDE Gran Canaria Viewer Version 4.5, is complementary to the one described at the beginning of this section and in some sectors, it expands and details the information. This software integrates the data of the entities that own the electricity grids, which are: Red Eléctrica de España (REE) and Unelco-Endesa (Enel Group). In addition, Google Earth software has been used in this study to georeference the power plants and substations and manually create a shapefile (see Figure 7).
Figure 7 shows how the new substations attempt to remedy the deficiencies in certain areas of the island, strategically located to close the circle of the electricity network. In the areas with the highest density of substations, it has been decided to extend and display them independently (see Figure 8). On the other hand, the existing substations are clustered around the island’s main economic and tourist centres: the island’s capital, Las Palmas de Gran Canaria and the south of the island, comprising the municipalities of San Bartolomé de Tirajana and Mogán.
Figure 8 shows the two existing thermal power plants on the island and the nearest existing and future substations. Located close to the coast, they represent the two epicentres around which the electricity grids have been built over the years. However, this situation has already changed with the development of onshore wind farms, with an installed capacity of 159.3 MW and photovoltaic plants on the island, with a capacity of 40.6 MW [20], among other environmentally friendly technologies, different to fuel combustion. In addition, in Figure 8 we can also see an enlargement of the future hydroelectric power plant and its corresponding substation, which will be built for energy use between the Chira-Soria dams in the heart of the Arguineguín ravine basin. This will make it possible to develop electricity grids in the least exploited part of the island from the power lines associated with the power plant, since many other grid supply points will be able to be directly or indirectly incorporated into these lines.
On the other hand, no pairings have had to be ruled out in the application of the maximum distance to the grid constraint. This is due to the high number of electricity substations in a relatively small territory, to the dispersed and strategic distribution that has had to be carried out by the local authorities and to the coincidence of the location of these substations with the locations of the compatible connections obtained after having applied the optimization (see Figure 9). However, this is valid because we assume the future implementation of power plants and substations. Table 5 shows the frequencies of the distances of the connections to the substations. It can be seen that most of the compatible connections are between 1 and 5 km apart.

3.3. Overall Potential Results

The stored energy for the 2346 possible combinations available at the start of the methodology was calculated as described in Equation (1), resulting in 614,737 MWh (see Figure 9). However, this figure corresponds to an initial theoretical value, as these combinations do not include any real criteria or constraints and have not been subject to optimization. This value will only serve as a reference for comparison with those obtained in the following steps of the methodological process.
In order to achieve the calculation of a viable storage potential, we first need to establish acceptability limits that allow us to define a framework based on technically feasible connections. Two technical parameters have been chosen as limits: the maximum distance and the minimum height between dams (see Table 1). Values have been chosen that do not excessively restrict the number of connections. In particular, connections will be formed between dams with a height between them of not less than 30 m and a maximum distance between them of 5 km. The result is a new list of compatible connections that can actually be realised from a technically and economically realistic perspective. Calculating the storage energy obtained with this new dataset we obtain 19,768 MWh, produced by 151 connections formed between 67 dams (see Figure 9). This result corresponds to less than 5% of the previous value, obtained without applying the conditions.
Once the optimization has been applied, by means of Equations (5)–(7), we obtain a much lower result, 8443 MWh, with 26 connections and 52 dams. This result is less than half the value we had before optimization (19,768 MWh), which means that the optimization algorithm has worked. The optimized selection of connections, referred to in Figure 9 as “Selected connections 1”, is detailed in Table 6, which includes the basin or interbasin to which each dam belongs, in addition to the installed storage power estimated by Equation (4) and other results such as the values of distance between dams, height between dams and distance to the electricity grid. From the process optimization, the remaining technical constraints from Table 3 are applied to the resulting dataset. Again, the figure (5996 MWh) shows a considerable decrease (28.98%), essentially due to the technical restriction of the distance-to-height ratio. This shows the significant influence of this parameter on the final result. This new selection of connections is referred to in Figure 9 as “Selected Connections 2” and is shown in Table 7. The application of the maximum grid distance constraint does not alter the results (Section 3.2). This table shows the results before applying the environmental restrictions. We have considered these results as indicative of the potential because, as explained in Section 2.5.3, the connections included in these spaces must be analyzed on a case-by-case basis.
Finally, the environmental restrictions described in Table 4 results in a potential of zero. It must be taken into account that a single dam may belong to one, several or all the categories of protected areas. The graph in Figure 10 shows the distribution of dams on the island in relation to each category, taking into account the condition described above.
Considering our estimated viable potential as that to which environmental restrictions do not apply, we will increase the energy stored on the island from 0 MWh to 5996 MWh. If we consider the immediate implementation of the PHES Chira-Soria, then the existing potential would be 4814.34 MWh and the studied potential would add 1181.66 MWh of storage capacity, which would be an increase of 24.54%.
If instead of taking 5996 MWh as viable potential and instead we take 8443 MWh, which is the value obtained after optimizing and without having applied the technical environmental restrictions, the storage capacity would increase. At this point, the various local development agents would have to study which restrictions to apply to each PHES, because it may happen that, for example, the higher technical and economic cost of not complying with the distance-height ratio restriction may be assumed, or that, in another case, a connection excluded in this study due to an environmental restriction may be taken into account because it represents little or non-significant ecological impact.
It is for all the reasons described in the previous paragraph that, as described in the methodology, the process of calculating the viable potential presented in this study is open-ended. We therefore consider the value of 8443 MWh as the figure from which the variations of the method begin.
Although this study does not consider the possibility of connecting one dam to two other dams, it has been detected in the course of the study that the Cueva de Las Niñas-Soria connection, added to the future Chira-Soria connection, would represent the second largest storage capacity value between two dams (specifically, 4158.82 MWh of stored energy and 189.04 MW of installed power), second only to the Chira-Soria dam connection.
Table 8 shows the distribution of the potential between the basins and interbasins of the island after optimization. To understand the values in the table, it must be taken into account that in each basin the stored energy of a connection has been included, provided that in this connection, one of the two dams, or both of them, belong to this basin. Furthermore, if the dams forming a given connection belong to different basins (or interbasins), the storage potential will be imputed to both basins, so that the total storage potential does not necessarily coincide with the above results without distribution in basins and interbasins. The purpose of Table 8 is simply to show the ranking of basins and interbasins according to maximum stored energy. The distortion of the result for the reason described above does not alter the order of this ranking.
The Arguineguín ravine basin has the greatest potential and therefore the order in which projects are undertaken must begin there. The Chira-Soria hydroelectric power plant is located in this basin, as the two dams that make it up belong to this basin. If the option of adding the Cueva de Las Niñas dam to a power plant with three dams were also explored, the potential in this basin would almost double.
Table 9 is analogous to Table 8, the difference being that Table 9 is made for the viable storage potential, before applying the environmental restrictions. It may be highlighted that the same basins or interbasins in the first positions in Table 8 are those in Table 9.

4. Conclusions

The objective of this study was to create a quick and efficient methodology, capable of adapting to any territory by adjusting the restrictions to the reality of each territory, without including exhaustive mathematical or graphic developments, in order to offer the authorities of a given territory the possibility of taking decisions on energy planning in a short time interval and with reliability. We have been able to evaluate the potential of the existing dams on the island of Gran Canaria by applying optimization in the process, considering that a dam can only be considered in one connection. The results show that the theoretical PHES potential estimated in the T1 typology is approximately 615 GWh (see Figure 9). However, considering the results obtained in Table 6, i.e., after applying the optimization and before the application of the technical and environmental constraints, the result becomes 8443 MWh, using 52 of the 69 dams. Applying the remaining technical constraints, the result is 5996 MWh (see Table 7). If we finally apply the environmental restrictions, the PHES potential is non-existent. These results show that what a priori is considered a territory with a high theoretical storage potential, after applying this methodology, it may be considerably reduced.
We have found that the head/distance ratio has a very significant influence on the PHES potential values. Despite the large number of possible pairings in a limited island territory, this ratio is not fulfilled, which indicates that a large number of pairs of dams are located at a distance much greater than the difference in usable heights between them. On the other hand, the distance to the electricity grid is not an impediment in this case, due to the large number of substations strategically distributed throughout the island territory. Another finding has been the confirmation that environmental constraints are a determining factor in energy planning for PHES power plants. This result has been obtained because we have assumed strict environmental restrictions; if a dam is included in a protected territory, any pairing with another dam is cancelled. However, not all environmental management instruments are considered to be strictly restrictive. The environmental impact of each PHES connection must be assessed; if the result is little or no significant impact, the PHES plant could be implemented. If all the dams are built, the environmental impact is considerably reduced [37,38]. In practice, other factors need to be assessed when deciding on the implementation of PHES, such as the socio-economic impact [40] that a given PHES plant may generate and the development of the areas immediately surrounding its location. Furthermore, we propose an evaluation of each PHES plant project independently in which all these factors are assessed. The island has zero energy storage and urgently needs to develop a system to guarantee the high RES penetration that is expected in the coming years [20].
On the other hand, the classification of the results into basins and interbasins presented in Table 8 and Table 9 gave us a general picture of where to focus efforts to develop the PHES. This classification is not done in other studies, although classifications in geographical or political regions do appear, no classification in hydrographic zones is found [13,14]. We found that the Arguineguín Ravine Basin contains the greatest potential for PHES development, even without taking into account the possible connection between the three largest dams in the basin and on the island [22]: the dams of the future PHES power plant already planned called “Chira-Soria”, whose project is currently in the public information phase and the “Cueva de Las Niñas” dam, in such a way that the Chira and Cueva de Las Niñas dams would be the upper reservoirs and the Soria dam the lower reservoir. Figure 11 shows this possibility, taking into account that the volume of the Soria dam is sufficient for this purpose [22].
The results obtained indicated an increase in stored energy on the island from 0 MWh to 5996 MWh. If we consider the immediate implementation of the PHES Chira-Soria, then the existing potential would be 4814.34 MWh and the remaining estimated potential would add 1181.66 MWh, which would represent an increase of 24.54%. The potential results will not be sufficient to cover 100% of the demand for energy storage on the island in the coming years. Therefore, the option of combining PHES technology with other energy storage technologies should be explored [41].
Table 7 also constitutes the list of best sites to be considered from the point of view of the restrictions applied in this methodology. It is intended that this list may serve as a reference for the public administrations in charge of energy planning: the Government of the Canary Islands, Cabildo de Gran Canaria (Gran Canaria Island Council) and companies and stakeholders.
From the results obtained, it can be seen that the methodology works for analyzing any size of dam. Furthermore, the optimization has worked by maximizing the stored energy and ensuring that a dam cannot be part of more than one pairing. The inclusion of head losses is a factor that further refines the calculation and is not considered in other studies [11,12,16]. However, their removal can be considered and the results would not vary much if an even faster estimation is sought.
The methodology is simple to apply and the results can be considered valid. A true verification, for example, is the fact that this study foresees for the “Chira-Soria” PHES plant an installed power of 219.02 MW in terms of installed power, while the project drafted for the plant, with a much more profound and detailed calculation, specifies 220 MW. Thanks to this simple application, it can be used at any level and by any social agent without having to use, like in other works, large mathematical models and graphic processing, using public or free databases. This favours the change in the technical and environmental restrictions to be applied in each territory in a quick and dynamic way. It can be used to define the energy planning strategy of any territory in short-term decision making.
We found that the choice of the territory of application determines the type of restrictions that will be decisive or not and that applying the same restrictions to any territory does not optimize the choice of sites. Adapting the restrictions to the territory of application, with a prior objective analysis, avoids setting limits that are too subjective. Moreover, it has been applied to a territory in which there is no total island-wide calculation of energy storage of the PHES type envisaged in the framework of a detailed methodology.

Possible Future Ameliorations

The limitations of this study, mainly the absence of cost analysis and sensitivity analysis, because they increase the complexity of applying the methodology, also imply that the results may vary. If this analysis was applied, the optimization could not be used. Although the maximum distance to the grid has been taken into account and only already constructed dams have been considered, which represent the highest costs in PHES plants, a detailed cost analysis with a focus on cost-effectiveness would increase the information for decision making. The influence of each constraint has been weighed up, but a comprehensive sensitivity analysis has not been carried out.
On the other hand, the accuracy of the energy calculation could be increased, for example by further investigating the load losses or by carrying out a detailed study of the choice of the PHES power plant’s output.
The proposed methodology focuses only on existing dams in natural ravines. No other type of reservoir is considered to comply with the scheme of operation of a PHES power plant. Furthermore, the use of the dams is not analyzed. The possibility that the dams could be privately owned or that they could be used exclusively for other purposes, such as agricultural irrigation or the installation of solar photovoltaic plants on them, is not considered. The use of the sea as a lower reservoir is not envisaged, which could multiply the possible connections. With regard to the environmental restrictions concerning Protected Natural Spaces, the distribution of dams in each of the categories that make up these spaces could be detailed and an environmental impact assessment could be introduced [42].
After all that has been said, we must continue to investigate energy storage systems, including PHES, which remains a very viable option, especially in areas where this option is clearly underutilized. Although energy planning in this century is changing rapidly and dynamically, we must consider the possibility of combining all possible solutions for a given territory, analyzing the full potential and assessing each project individually.

Author Contributions

Conceptualization, H.J.T.-H. and A.L.-M.; Methodology, H.J.T.-H.; Investigation, H.J.T.-H.; Resources, H.J.T.-H.; Writing—Original Draft, H.J.T.-H.; Writing—Review & Editing, H.J.T.-H.; Visualization, H.J.T.-H. and A.L.-M.; Supervision, A.L.-M. All authors have read and agreed to the published version of the manuscript.

Funding

This research has been co-funded by ERDF funds and Interreg MAC 2014–2020 programme, within the ACLIEMAC project (MAC2/3.5b/380). The APC was funded by ERDF funds and Interreg MAC 2014–2020 programme, within the ACLIEMAC project (MAC2/3.5b/380).

Conflicts of Interest

The authors declare no conflict of interest. The funders had no role in the design of the study; in the collection, analyses, or interpretation of data; in the writing of the manuscript, or in the decision to publish the results.

References

  1. International Renewable Energy Agency (IRENA). Renewable Capacity Statistics 2020. 2020. Available online: https://irena.org/-/media/Files/IRENA/Agency/Publication/2020/Mar/IRENA_RE_Capacity_Statistics_2020.pdf (accessed on 10 March 2021).
  2. Yang, W.; Yang, J. Advantage of variable-speed pumped storage plants for mitigating wind power variations: Integrated modelling and performance assessment. Appl. Energy 2019, 237, 720–732. [Google Scholar] [CrossRef]
  3. Zhou, S.; Wang, Y.; Zhou, Y.; Clarke, L.E.; Edmonds, J.A. Roles of wind and solar energy in China’s power sector: Implications of intermittency constraints. Appl. Energy 2018, 213, 22–30. [Google Scholar] [CrossRef]
  4. Zhao, H.; Wu, Q.; Hu, S.; Xu, H.; Rasmussen, C.N. Review of energy storage system for wind power integration support. Appl. Energy 2015, 137, 545–553. [Google Scholar] [CrossRef]
  5. Rehman, S.; Al-Hadhrami, L.M.; Alam, M.M. Pumped hydro energy storage system: A technological review. Renew. Sustain. Energy Rev. 2015, 44, 586–598. [Google Scholar] [CrossRef]
  6. de Andrade Furtado, G.C.; Amarante Mesquita, A.L.; Morabito, A.H.; Hendrick, P.; Hunt, J.D. Using hydropower waterway locks for energy storage and renewable energies integration. Appl. Energy 2020, 275, 115361. [Google Scholar] [CrossRef]
  7. Jurasz, J.; Mikulik, J.; Krzywda, M.; Ciapała, B.; Janowski, M. Integrating a wind- and solar-powered hybrid to the power system by coupling it with a hydroelectric power station with pumping installation. Energy 2018, 144, 549–563. [Google Scholar] [CrossRef]
  8. Zakeri, B.; Syri, S. Electrical energy storage systems: A comparative life cycle cost analysis. Renew. Sustain. Energy Rev. 2015, 42, 569–596. [Google Scholar] [CrossRef]
  9. Barbour, E.; Wilson, I.G.; Radcliffe, J.; Ding, Y.; Li, Y. A review of pumped hydro energy storage development in significant international electricity markets. Renew. Sustain. Energy Rev. 2016, 61, 421–432. [Google Scholar] [CrossRef] [Green Version]
  10. Palizban, O.; Kauhaniemi, K. Energy storage systems in modern grids—Matrix of technologies and applications. J. Energy Storage 2016, 6, 248–259. [Google Scholar] [CrossRef]
  11. Rogeau, A.; Girard, R.; Kariniotakis, G. A generic GIS-based method for small Pumped Hydro Energy Storage (PHES) potential evaluation at large scale. Appl. Energy 2017, 197, 241–253. [Google Scholar] [CrossRef] [Green Version]
  12. Ghorbani, N.; Makian, H.; Breyer, C. A GIS-based method to identify potential sites for pumped hydro energy storage-Case of Iran. Energy 2019, 169, 854–867. [Google Scholar] [CrossRef]
  13. Soha, T.; Munkácsy, B.; Harmat, Á.; Csontos, C.; Horváth, G.; Tamás, L.; Csüllög, G.; Daróczi, H.; Sáfián, F.; Szabó, M. GIS-based assessment of the opportunities for small-scale pumped hydro energy storage in middle-mountain areas focusing on artificial landscape features. Energy 2017, 141, 1363–1373. [Google Scholar] [CrossRef]
  14. Fitzgerald, N.; Arántegui, R.L.; McKeogh, E.; Leahy, P. A GIS-based model to calculate the potential for transforming conventional hydropower schemes and non-hydro reservoirs to pumped hydropower schemes. Energy 2012, 41, 483–490. [Google Scholar] [CrossRef]
  15. Gimeno-Gutiérrez, M.; Lacal-Arántegui, R. Assessment of the European potential for pumped hydropower energy storage based on two existing reservoirs. Renew. Energy 2015, 75, 856–868. [Google Scholar] [CrossRef]
  16. Lu, X.; Wang, S. A GIS-based assessment of Tibet’s potential for pumped hydropower energy storage. Renew. Sustain. Energy Rev. 2017, 69, 1045–1054. [Google Scholar] [CrossRef] [Green Version]
  17. Olabi, A.G.; Onumaegbu, C.; Wilberforce, T.; Ramadan, M.; Abdelkareem, M.A.; Al-Alami, A.H. Critical review of energy storage systems. Energy 2021, 214, 118987. [Google Scholar] [CrossRef]
  18. Manfren, M.; Nastasi, B.; Groppi, D.; Garcia, D.A. Open data and energy analytics-An analysis of essential information for energy system planning, design and operation. Energy 2020, 213, 118803. [Google Scholar] [CrossRef]
  19. Red Eléctrica de España SAU. The Spanish Electricity System 2019. Available online: https://www.ree.es/sites/default/files/11_PUBLICACIONES/Documentos/InformesSistemaElectrico/2019/inf_sis_elec_ree_2019_v2.pdf (accessed on 10 March 2021).
  20. Canary Islands Institute of Statistics (ISTAC). Canary Energy Yearbook 2019. Available online: http://www.gobiernodecanarias.org/istac/jaxi-istac/menu.do?uripub=urn:uuid:131cf873-66a9-408d-8cfa-537d6be05067 (accessed on 10 March 2021).
  21. Government of Spain. Energy Storage Strategy 2021:116. Available online: https://www.miteco.gob.es/es/prensa/estrategiadealmacenamientoenergetico_tcm30-522655.pdf (accessed on 10 March 2021).
  22. Island Water Council of Gran Canaria. Dams of Gran Canaria. n.d. Available online: http://www.aguasgrancanaria.com/ (accessed on 10 March 2021).
  23. Red Eléctrica Infraestructuras en Canarias SAU. Chira Pumped-storage Hydroelectric Power Station-soria. Reformed Construction Project. Amended I 2018.
  24. Bueno, C.; Carta, J.A. Technical–economic analysis of wind-powered pumped hydrostorage systems. Part I: Model development. Sol. Energy 2005, 78, 382–395. [Google Scholar] [CrossRef]
  25. Bueno, C.; Carta, J.A. Wind powered pumped hydro storage systems, a means of increasing the penetration of renewable energy in the Canary Islands. Renew. Sustain. Energy Rev. 2006, 10, 312–340. [Google Scholar] [CrossRef]
  26. Bueno, C.; Carta, J.A. Technical–economic analysis of wind-powered pumped hydrostorage systems. Part II: Model application to the island of El Hierro. Sol. Energy 2005, 78, 396–405. [Google Scholar] [CrossRef]
  27. Portero, U.; Velázquez, S.; Carta, J.A. Sizing of a wind-hydro system using a reversible hydraulic facility with seawater. A case study in the Canary Islands. Energy Convers. Manag. 2015, 106, 1251–1263. [Google Scholar] [CrossRef]
  28. Padrón, S.; Medina, J.F.; Rodríguez, A. Analysis of a pumped storage system to increase the penetration level of renewable energy in isolated power systems. Gran Canaria: A case study. Energy 2011, 36, 6753–6762. [Google Scholar] [CrossRef]
  29. Arántegui, R.L.; Fitzgerald, N.; Leahy, P. Pumped-hydro energy storage: Potential for Transformation from Single Dams.Analysis of the Potential for Transformation of Non-Hydropower Dams and Reservoir Hydropower Schemes into Pumping Hydropower Schemes in Eu-rope n.d. Available online: https://doi.org/10.2790/44844 (accessed on 10 March 2021).
  30. Katsaprakakis, D.A.; Christakis, D.G. Seawater pumped storage systems and offshore wind parks in islands with low onshore wind potential. A fundamental case study. Energy 2014, 66, 470–486. [Google Scholar] [CrossRef]
  31. Rauf, H.; Gull, M.S.; Arshad, N. Complementing hydroelectric power with floating solar PV for daytime peak electricity demand. Renew. Energy 2020, 162, 1227–1242. [Google Scholar] [CrossRef]
  32. Sanchez, R.G.; Kougias, I.; Moner-Girona, M.; Fahl, F.; Jäger-Waldau, A. Assessment of floating solar photovoltaics potential in existing hydropower reservoirs in Africa. Renew. Energy 2021, 169, 687–699. [Google Scholar] [CrossRef]
  33. Mousavi, N.; Kothapalli, G.; Habibi, D.; Khiadani, M.; Das, C.K. An improved mathematical model for a pumped hydro storage system considering electrical, mechanical, and hydraulic losses. Appl. Energy 2019, 247, 228–236. [Google Scholar] [CrossRef]
  34. Mataix, C. Mecanica de Fluidos y Maquinas Hidraulicas [Fluid Mechanics and Hydraulic Machines], 2nd ed.; Ediciones del Castillo, S.A.: Madrid, Spain, 1982. [Google Scholar]
  35. Akçay, Y.; Li, H.; Xu, S.H. Greedy algorithm for the general multidimensional knapsack problem. Ann. Oper. Res. 2007, 150, 17–29. [Google Scholar] [CrossRef]
  36. Kucukali, S. Finding the most suitable existing hydropower reservoirs for the development of pumped-storage schemes: An integrated approach. Renew. Sustain. Energy Rev. 2014, 37, 502–508. [Google Scholar] [CrossRef]
  37. Zheng, Y.; Sahraei-Ardakani, M. Leveraging existing water and wastewater infrastructure to develop distributed pumped storage hydropower in California. J. Energy Storage 2021, 34, 102204. [Google Scholar] [CrossRef]
  38. Ansar, A.; Flyvbjerg, B.; Budzier, A.; Lunn, D. Should we build more large dams? The actual costs of hydropower megaproject development. Energy Policy 2014, 69, 43–56. [Google Scholar] [CrossRef] [Green Version]
  39. Cartográfica de Canarias SA. IDE Canarias Viewer GRAFCAN Version 4.5.1 n.d. Available online: https://www.grafcan.es/ (accessed on 10 March 2021).
  40. Hunt, J.D.; Byers, E.; Riahi, K.; Langan, S. Comparison between seasonal pumped-storage and conventional reservoir dams from the water, energy and land nexus perspective. Energy Convers. Manag. 2018, 166, 385–401. [Google Scholar] [CrossRef]
  41. Liu, Y.; Yu, S.; Zhu, Y.; Wang, D.; Liu, J. Modeling, planning, application and management of energy systems for isolated areas: A review. Renew. Sustain. Energy Rev. 2018, 82, 460–470. [Google Scholar] [CrossRef]
  42. Botelho, A.; Ferreira, P.; Lima, F.; Pinto, L.M.C.; Sousa, S. Assessment of the environmental impacts associated with hydropower. Renew. Sustain. Energy Rev. 2017, 70, 896–904. [Google Scholar] [CrossRef]
Figure 1. Operating diagram of a reversible pumped storage power plant.
Energies 14 03553 g001
Figure 2. Map of study area.
Energies 14 03553 g002
Figure 3. Methodological flow chart.
Energies 14 03553 g003
Figure 4. Subdivision of the study area into basins, interbasins and ravines on the island of Gran Canaria.
Energies 14 03553 g004
Figure 5. Location of the 69 “large dams” on the island of Gran Canaria in relation to their basins, interbasins and ravines according to relief. Icon of the dam made by Freepik from www.flaticon.com, accessed on 3 March 2021.
Energies 14 03553 g005
Figure 6. Distribution of “large dams” in relation to environmentally protected territories. (A) SAC (Special Area of Conservation) territories, belonging to the Natura 2000 Network. (B) SPAB (Special Protection Area for Birds) territories, belonging to the Natura 2000 Network. (C) Biosphere Reserve Territories. (D) Territories belonging to the Network of Protected Natural Spaces.
Energies 14 03553 g006
Figure 7. Existing and future electrical substations. Existing (Enlargement 1 and Enlargement 2) and Figure 3. power plants. Hydroelectric power plant icon by Freepik from www.flaticon.com. Figure based on Google Earth, accessed on 3 March 2021.
Energies 14 03553 g007
Figure 8. Enlargements of various areas of Figure 7. (A) Enlargement 1: Detail of the existing “Jinamar” thermal power plant. (B) Enlargement 2: Detail of the existing “Barranco de Tirajana” thermal power plant. (C) Enlargement 3: Detail of the Arguineguín ravine basin and the future “Chira-Soria” hydroelectric power plant. Icon of the hydroelectric power plant made by Freepik from www.flaticon.com. Figure based on Google Earth, accessed on 3 March 2021.
Energies 14 03553 g008
Figure 9. Variation of the storage energy and the number of connections established (see Figure 3). CS: Connections: Ds: Dams.
Energies 14 03553 g009
Figure 10. Distribution of the island’s 69 “large dams” in environmentally protected areas.
Energies 14 03553 g010
Figure 11. View of the potential connection between the Chira and Cueva de Las Niñas dams (upper reservoirs) and Soria dam (lower reservoir) in the Arguineguín Ravine Basin. Figure based on Google Earth, accessed on 3 March 2021.
Energies 14 03553 g011
Table 1. Typology considered according to the nature of the dams in the connection.
NameInitialsDescription
Type 1T1Pairs formed by existing dams
Table 2. Restrictions for technical parameters of acceptability of connection between dams.
ParameterType of ParameterLimitDefault Value
Head between damsTechnical acceptabilityMinimum30 m
Distance between damsTechnical acceptabilityMaximum5000 m
Table 3. Restrictions for the rest of the technical parameters of the connection between dams.
ParameterLimitDefault Value
VolumeMinimum0 m3
VolumeMaximum-
Grid distanceMaximum12,000 m
AltitudeMaximum2000 m
EnergyMinimum1000 kWh
Head/Distance ratioMinimum0.1
Table 4. Restrictions for the different environmental parameters of connection between dams.
RestrictionCriterion
SAC zone (Natura 2000 Network)Non-inclusion
SPAB zone (Natura 2000 Network)Non-inclusion
Protected Natural SpacesNon-inclusion
Biosphere ReserveNon-inclusion
Table 5. Frequencies and percentages of the distances of all compatible connections after optimization to the nearest electricity substation.
Distance (km)FrequencyPercentage (%)
<1623.08
1–3726.92
3–5726.92
5–713.85
>7519.23
Table 6. Stored energy and other results after optimization.
Pairing N°Name of Dam AName of Dam BName of Dam A BasinName of Dam B BasinStored Energy (MWh)Storage Power (MW)Distance between Dams (m)Height between Dams (m)Distance to Power Supply (m)
686ChiraSoriaArguineguín
ravine basin
Arguineguín ravine basin4818.33219.012531265726
1317El ParralilloEl VaqueroLa Aldea ravine basinLa Aldea-Agaete interbasin560.9825.4939684789101
1916La UmbríaLezcano IITenoya-Guiniguada interbasinTenoya ravine basin444.8820.2237702303999
1231El MulatoLa Cueva de Las NiñasMogán ravine basinArguineguín ravine basin392.6417.8425501142183
328Barranco Hondo and Cuevas BlancasTirajanaTirajana ravine basinTirajana ravine basin292.9813.3113001806465
2007Las HoyasLos PérezAgaete ravine basinAgaete ravine basin228.6610.391581707503
387Barranco Hondo-ParralesTamadabaAgaete-Gáldar interbasinAgaete ravine basin204.549.2934747213029
1980Las GarzasLos MondragonesGáldar ravine basinMoya ravine basin197.548.973243129713
602ChamoriscánLa GambuesaMaspalomas ravine basinMaspalomas ravine basin191.888.724565488216
105AriñezLa SiberiaGuiniguada ravine basinGuiniguada ravine basin177.148.0533733142137
164AyagauresFatagaMaspalomas ravine basinMaspalomas ravine basin134.116.0947521308728
718Cuevas BlancasLa LechucillaGuayadeque ravine basinGuiniguada ravine basin119.025.4127193393903
949El CallejónLos Dolores-CasablancaAzuaje-Tenoya interbasinAzuaje-Tenoya interbasin109.454.9725322013434
1383El Pinto ILos Jiménez-ArucasAzuaje-Tenoya interbasinAzuaje-Tenoya interbasin100.824.581981751806
212Barranco HondoEl CalabozoGáldar-Moya interbasinGáldar-Moya interbasin92.014.182415201499
1517El PiquilloSatautejoGuiniguada ravine basinGuiniguada ravine basin78.573.5749383393856
2058Lezcano IIPiletasTenoya ravine basinTenoya-Guiniguada interbasin57.332.603648523085
1715GañaníasToronjoGuiniguada ravine basinGuiniguada ravine basin53.862.443965343514
1592El VaqueroLos LugarejosLa Aldea-Agaete interbasinAgaete ravine basin41.071.863490357890
2120Los BetancoresLos JorgesMaspalomas-Arguineguín interbasinMaspalomas-Arguineguín interbasin40.291.8326321002599
1071El CondeValerónGáldar ravine basinGáldar-Moya interbasin36.901.672235101430
2332TamaraceiteTenoya ITenoya-Guiniguada interbasinTenoya ravine basin24.951.133203129949
404Cabo VerdeEl CondeMoya-Azuaje interbasinGáldar ravine basin14.530.664252.911111260
1268El Palmito-La MarquesaEl Pinto IIAzuaje-Tenoya interbasinAzuaje-Tenoya interbasin13.030.591103332765
2071Lomo de PereraLomo GordoMaspalomas ravine basinMaspalomas ravine basin11.140.501481322331
1073El CortijoEl HormigueroAzuaje-Tenoya interbasinGáldar-Moya interbasin6.520.294064454132
Table 7. Stored energy and other results after all other technical constraints have been applied.
Pairing
Name of Dam AName of Dam BName of Dam A BasinName of Dam B BasinStored Energy (MWh)Stored Power
(MW)
Distance between Dams (m)Height between Dams (m)Distance to Power Supply (m)
686ChiraSoriaArguineguín ravine basinArguineguín ravine basin4818.34219.022531265726
1317El ParralilloEl VaqueroLa Aldea ravine basinLa Aldea-Agaete interbasin560.9825.5039684789101
328Barranco Hondo and Cuevas BlancasTirajanaTirajana ravine basinTirajana ravine basin292.9813.3213001806465
387Barranco Hondo-ParralesTamadabaAgaete-Gáldar interbasinAgaete ravine basin204.559.3034747213029
718Cuevas BlancasLa LechucillaGuayadeque ravine basinGuiniguada ravine basin119.025.4127193393903
Table 8. Basin and interbasin distribution of energy storage potential after optimization.
NameStored Power (MWh)NameStored Power (MWh)NameStored Power (MWh)NameStored Power (MWh)
Arguineguín Ravine Basin5211Agaete Ravine Basin474.3Agaete-Gáldar Interbasin204.6Telde Ravine Basin0
La Aldea-Agaete Interbasin602Guiniguada Ravine Basin428.6Moya Ravine Basin197.5Guiniguada-Telde Interbasin0
La Aldea Ravine Basin561Mogán Ravine Basin392.7Guayadeque Ravine Basin119Tenoya-Azuaje Interbasin0
Azuaje-Tenoya Interbasin538.7Maspalomas Ravine Basin337.1Gáldar-Moya Interbasin50Tirajana-Maspalomas Interbasin0
Tenoya Ravine Basin527.2Tirajana Ravine Basin293Maspalomas-Arguineguín Interbasin40.3
Tenoya-Guiniguada Interbasin527.2Gáldar Ravine Basin249Moya-Azuaje Interbasin14.5
Table 9. Basin and interbasin distribution of viable energy storage potential.
NameStored Power (MWh)NameStored Power (MWh)NameStored Power (MWh)NameStored Power (MWh)
Arguineguín Ravine Basin4818.3Guayadeque Ravine Basin119Telde Ravine Basin0Moya-Azuaje Interbasin0
La Aldea Ravine Basin561Guiniguada Ravine Basin119Tenoya Ravine Basin0Tenoya-Azuaje Interbasin0
La Aldea-Agaete Interbasin561Gáldar Ravine Basin0Azuaje-Tenoya Interbasin0Tenoya-Guiniguada Interbasin0
Tirajana Ravine Basin293Maspalomas Ravine Basin0Gáldar-Moya Interbasin0Tirajana-Maspalomas Interbasin0
Agaete Ravine Basin205Mogán Ravine Basin0Guiniguada-Telde Interbasin0
Agaete-Gáldar Interbasin206Moya Ravine Basin0Maspalomas-Arguineguín Interbasin0
Publisher’s Note: MDPI stays neutral with regard to jurisdictional claims in published maps and institutional affiliations.

