Article

Comparative Analysis of Degradation Assessment of Battery Energy Storage Systems in PV Smoothing Application

by
Valentin Silvera Diaz
1,2,*,
Daniel Augusto Cantane
1,
André Quites Ordovás Santos
2 and
Oswaldo Hideo Ando Junior
2
1
Renewable Energy Center, Itaipu Technological Park Foundation—FPTI, 85867-900 Paraná City, Brazil
2
Research Group on Energy & Energy Sustainability (GPEnSE/CNPq), Federal University of Latin American Integration—UNILA, 85867-000 Paraná City, Brazil
*
Author to whom correspondence should be addressed.
Energies 2021, 14(12), 3600; https://doi.org/10.3390/en14123600
Submission received: 25 March 2021 / Revised: 14 April 2021 / Accepted: 18 April 2021 / Published: 17 June 2021
(This article belongs to the Section A2: Solar Energy and Photovoltaic Systems)

Abstract

:
Photovoltaic (PV) generation depends on the availability of solar resources, being directly influenced by the variation in irradiance due to the presence of clouds over the PV panels, causing a variation in the power output. The use of battery energy storage systems integrated with the PV showed to be a technically feasible solution to mitigate these power output fluctuations within the maximum ramp limit. Most articles reported in the literature on smoothing PV power output, by coupling with battery degradation as performance indicators of the control strategy, used the event-oriented model that considers only the number of cycles and depth of discharge. This paper presents on the comparative analysis of two approaches to battery degradation models, an event-oriented model based on the Rainflow counting and a semiempirical model, and applies to photovoltaic power smoothing by using a wide range of restrictions and installed PV plant capacities. The semi-empirical degradation model revealed higher battery degradation for all simulated cases. For Strategy 2, the order was 50% higher than the event-oriented model, probably due to severe DR and RR, which increases the stress on the battery. For Strategy 1, the difference was greater, between 100% and 300%. The event-based model indicated that Strategy 1 implied less battery degradation, but the semi-empirical model indicated the opposite. Considering that the semi-empirical model considers more parameters of degradation, the fact that Strategy 2 implies less degradation is more reliable. Moreover, the result obtained by the SimSES model corroborates that the accelerated lithium cell battery degradation takes place, as the operation is at high SoC. Maintaining Ebat, reference is SoC 80% decreased the degradation in at least 25% with respect to degradation, maintaining Ebat, reference is SoC 100%. For this, Ebat, reference of the SoC control, can be designed to avoid operating under a high load state. The results demonstrated that choosing a simplified degradation model approach can lead to an error in the conclusion of which strategies are the best since calendar life effects are very important in the application of PV power smoothing.

1. Introduction

The growth in the electrical energy generating share by using alternative renewable energy sources (e.g., solar and wind) has added concern about the intermittency effects on the power output, introducing significant uncertainties in the operation and planning of the electrical power system [1]. In particular, photovoltaic (PV) generation, which is highly dependent on solar radiation, can lead to high rates of variation in the generated instantaneous power under cloudy conditions [2].
As virtually the higher penetration level of photovoltaic generation in electrical systems can display the higher voltage instability in the distribution branch, most frequency and voltage variations in the maximum generation must be mitigated [3,4]. From the regulation perspective, maximum power ramp-rates (rmax) in the electricity grid were included in several countries. Puerto Rico was the first country to regulate the ramp-rate, requiring less than 10% in the rated power fluctuation of the inverter within one minute [5]. Similarly, fluctuations between 2% and 5% per minute for the rated power are allowed in Mexico, regardless of the conditions of solar irradiation [6]. Another example in the maximum permitted ramp-rate (100 kW/s) is also found in Denmark [7]. Finally, fixed percentages related to the installed plant capacity or employed powers are adopted in Ireland and China, respectively. The summary of the regulations mentioned for the different countries is listed in Table 1.
Worldwide, the integration of PV generation paired with a battery energy storage system (BESS) seems to be a technically viable solution to mitigate the variation of the injected power by following the current regulations. As a result, economic parameters related to the operating regime, such as energy capacity, overall efficiency (losses), and degradation (cycle life), are of particular importance. Among them, battery optimization on the dispatched capacity (required), nameplate cycle number, and depth of discharge (DoD) will intrinsically impact the overall costs (capital and operation expenditures over the cycle). Consequently, the control strategy over them is pivotal, because it provides the battery cell degradation [8].
From the literature analysis, the main used control techniques for this purpose are: the (i) ramp-rate control algorithm [11,12,13,14,15], (ii) moving average (MA) [16,17,18], and (iii) filter-based approach [19,20]. There are also other control strategies available, but they are less researched, such as the exponential moving average [21] and the constant generation [22]. It should be noted that, regardless of the control strategy used, the BESS must be prepared to mitigate the fluctuation of power in the most critical situation, i.e., in the worst-expected power output case. The occurrence of this type of event during the annual operation of the photovoltaic plant is less than 1% [23]. Therefore, the control strategy in battery management must evaluate not only the effectiveness of mitigating fluctuations but also its performance in minimizing battery degradation.
In the PV power smoothing techniques, the event-oriented battery degradation modeling stands out [8,14,24,25]. Thus, the degradation analysis of the battery life involves at least the determination of the total number of cycles and the DoD in each cycle.
Alam and Saha [8] investigated the impact of the PV smoothing application on the useful life of BESS by using a simple ramp rate algorithm over three different instability days (maximum power: −/+50 kW; capacity: 760 kWh lithium BESS and 3.3 MW photovoltaic plant). Once the microcycles were identified using the Rainflow Counting algorithm, the life cycle degradation was estimated by using the DoD life cycle curve versus the number of cycles provided by the manufacturer (datasheet). In the most realistic scenario considered, which was a mixture of the three types of days in equal proportion on an annual basis, the estimated degradation was 5.3% per year. Quantitatively, this approach for the estimated degradation is unrealistic because it uses only three types of day profiles. For example, cloudy days are not usually common when compared to the overall period of the year, resulting in the overestimation of battery degradation.
Marcos et al. [14] also performed a BESS degradation estimate for three control strategies using the Rainflow Counting method, obtaining 1.0%, 11.1%, and 0.6% for the ramp-rate, MA, and step-rate control modes, respectively. Contrary to that presented by Alam and Saha [8], the analysis was performed by considering data from the whole year. As a result, depending on the climatic conditions, the battery may be left without operating for several days, since it may be a sequence of sunny days with no power variation greater than the limit established in the control. Although non-cycle degradation took place, the battery degradation from temperature and the resting value (state of charge), namely calendar life, is still ongoing, decreasing the whole battery life. Another point is that the previously mentioned works did not consider the C-rate, which also influences degradation. The lack of consideration in the mentioned parameters can directly impact the cost-effectives of the control strategy for smoothing power fluctuations in photovoltaic plants along with BESS.
Control strategies, composed of semi-empirical (with equations and experimental data) approaches for smoothing power fluctuations in photovoltaic plants based on the BESS useful life can be employed by adding the calendar life degradation through a semi-empirical based model. As far as we are aware, no control strategy has yet been reported to use calendar life in the age model for better battery life estimation in the photovoltaic power smoothing application, although the semi-empirical approach presents a model closer to reality when compared to event-oriented ones. Two control strategies extracted from elsewhere [14,15] are compared as a basis for calculation implementation. The results revealed that the battery degradation under operation for the photovoltaic power smoothing application is underestimated when compared to that classical one without the calendar life aging model, making it promising for control strategies.

2. Estimation of BESS Degradation

Battery degradation is basically characterized by two components: the (i) cycle life, which dependents on battery operation, and (ii) calendar life (it is independent of battery operation). The main parameters that influence the behavior of the cycle life are (i) the DoD, (ii) the discharging/charging rate (c-rate), and (iii) the operating temperature [26]. On the other hand, the cell temperature and SoC, or even resting cell voltage, are the stress factors in the calendar life. A set of degradation phenomena may occur near or outside the stability limits, causing secondary chemical reactions and phase transformations. Consequently, the performance over the life of a battery depends on coupled physical and chemical processes that occur in a wide range of operating and resting conditions, modifying the rate of degradation [27,28]. All of this makes it difficult to obtain comprehensive models. Thus, the precise quantification of degradation is a challenging task, and there is no uniqueness in the literature to assess these factors quantitatively. In general, the techniques are divided into three approaches:
(i)
Physical-chemical aging model: based on a detailed knowledge of the processes related to the aging of batteries, describing them using partial differential equations and providing the most important state variables at any point in the cell and at any time.
(ii)
Semi-empirical model: assumes that the useful life of the batteries is proportional to the amount of charge transferred from them. The actual value of the transferred charge is multiplied by a weighted factor, calculated according to the conditions of use of the battery. This weighted factor can be linear or non-linear, depending on the stress element you are considering.
(iii)
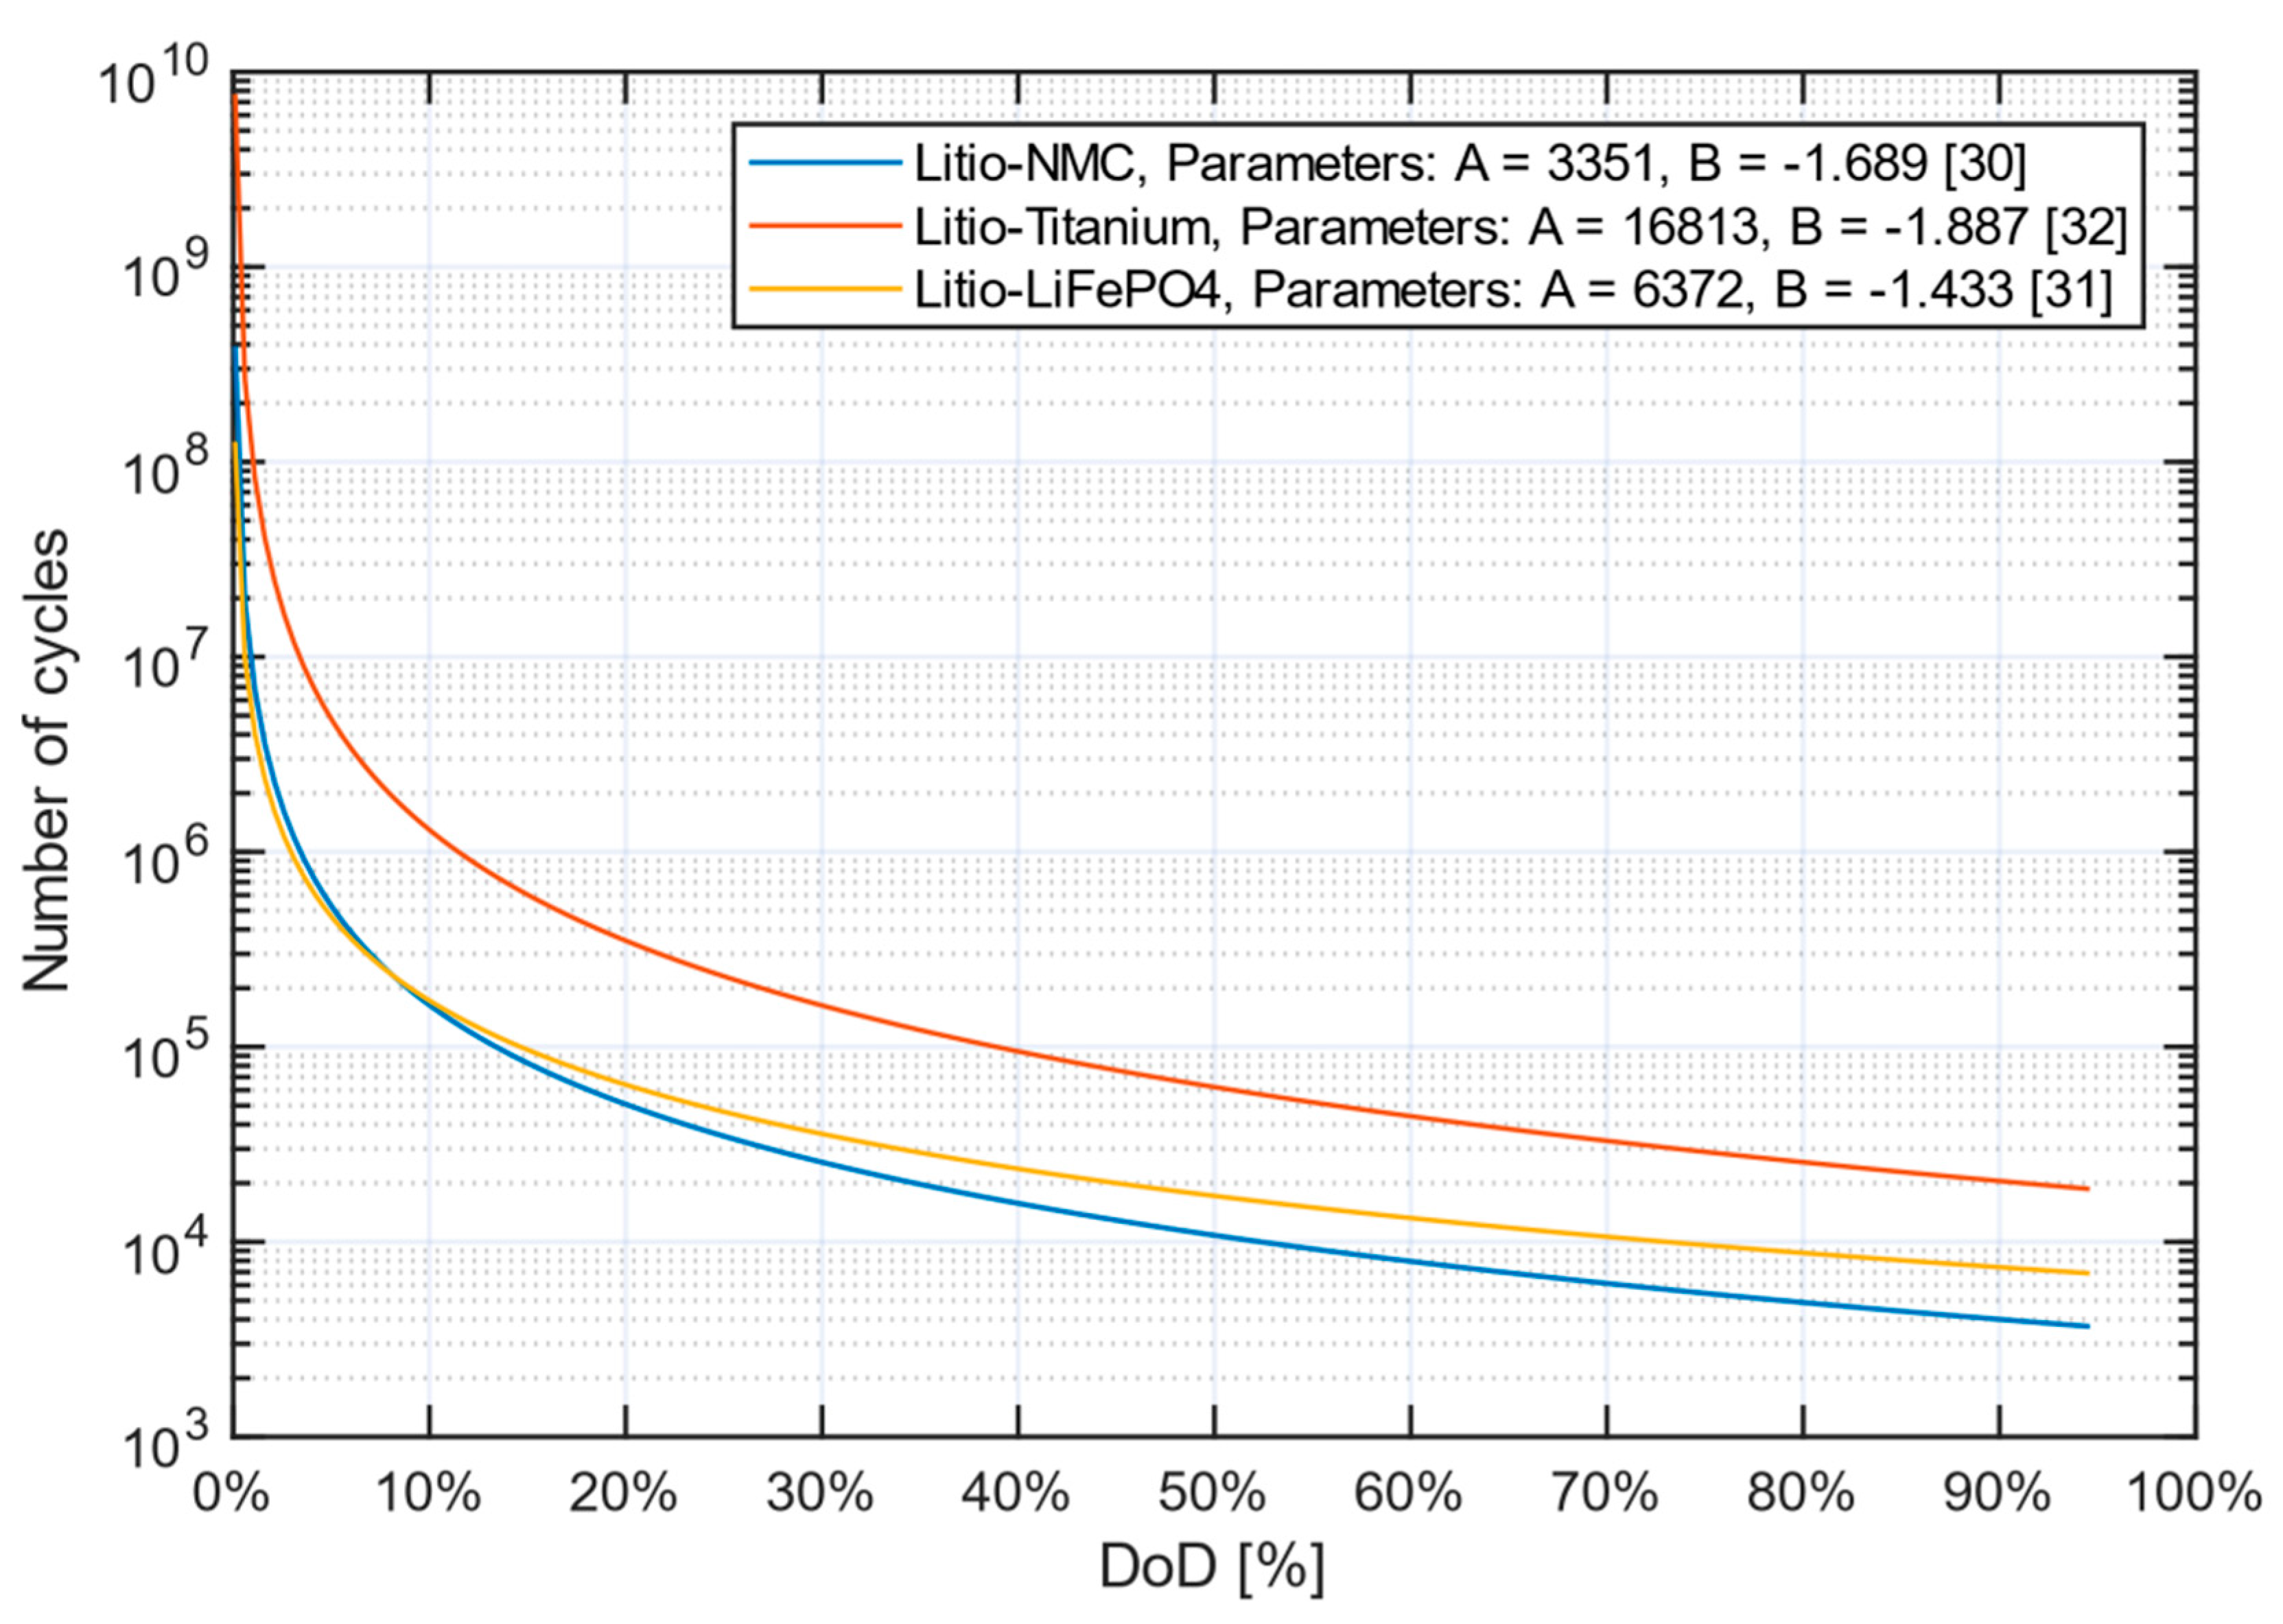
Event-oriented aging model: considers only a cycle life stress factor, which is the depth of discharge combined with data generally provided by manufacturers, such as the number of cycles curve versus the depth of discharge.
Both Rainflow and semi-empirical models that serve as a basis of this work will be detailed below. The Rainflow model is based on the event-oriented aging model. On the other hand, the semi-empirical model is embedded into the SimSES software (open source) [29].

2.1. Event-Oriented Modeling: Rainflow Counting and BESS Degradation Estimation

The analysis of battery life degradation involves, at a minimum, the determination of the total number of cycles spent in each period and the depth of discharge. In the specific case of PV smoothing, there is difficulty in counting cycles due to the presence of irregular and partial loading and unloading cycles caused by the PV variability. As battery life is influenced by a set of DoD parameters, the total amount of BESS degradation is estimated considering mainly all microcycles and short cycles (within a primary history of charge and discharge time) [8].
The Rainflow Counting method is composed of a generic cycle counting technique. The number of cycles and amplitude of time series for irregular data can be obtained by this method [30]. According to ASTM [30], the Rainflow cycle count uses three consecutive points in the loading history to determine whether or not a cycle was formed. First, the technique identifies the peaks and valleys of the data history and then builds possible cycles from the module difference between the pivot value and the element behind and before the pivot. The Rainflow counting algorithm is shown in Figure 1.
Once the DoD profile microcycles (quantity and amplitude) are identified and characterized, the degradation of the life cycle can be estimated using the empirical curve, DoD versus number of cycles, usually provided by the battery manufacturer. The degradation resulting from each of the cycles incurred is obtained and used to estimate the total degradation of the battery life through Equation (1),
D T = i n R j   C y c l e s A · R j B ·   100
where DT is the total degradation; Rj is the amplitude of the j-th microcycle in the DoD history; n is the total number of cycles; and A and B are empirical parameters provided by the battery manufacturer. The process is summarized in Figure 2.
Figure 3 shows an example of a life cycle curve, from which parameters A and B are extracted, for three different commercially available lithium-ion battery technologies (orange line for Lithium-NMC, Nickel Manganese Cobalt Oxide [31], blue line for Lithium-iron phosphate (LiFePO4) [32], and gray line for Lithium-Titanium [33]).

2.2. BESS Semiempirical Degradation Model

The event-oriented degradation model considers only a stress factor. The interaction between several stressors is a non-linear function. Therefore, the experimental data are used as input to estimate the correlation between them. Semi-empirical models, obtained from experimental data-fitting, are widely used in the literature for different purposes, such as to compare performance of energy management strategies in hybrid buses [34] and state of health estimated embedded in battery management system (BMS) [35]. For a more complete analysis, SimSES (Simulation of Stationary Energy Storage Systems) is used, which implemented the weighted charge model, integrating Rainflow cycle counting with experimental data and models from the literature for lithium-ion batteries. These additional elements will allow an estimate of degradation that considers parameters neglected by event-driven models, such as self-discharge, discharge rate, and calendar degradation.
SimSES is an open-source modeling framework for simulating stationary energy storage systems. The tool was developed on Matlab, initially by Maik Naumann and Nam Truong of the Technical University of Munich [29]. Figure 4 shows the structure of SimSES. The time series data (for example, load, PV generation, etc.) and system data, such as topology, battery characteristic, converter efficiencies, etc., are the entry for the “BESS Model” block. These blocks have the function of determining the necessary power of the energy storage system to meet the selected control algorithm, which, in turn, serves to calculate the state of charge. The output of the BESS Model block feeds the Battery Degradation Model block, which estimates the decrease in capacity and reduction in battery performance due to the stress factors considered by the degradation model. In turn, the effective capacity still available in the battery is passed on to the other blocks to continue the calculations until the end of the evaluated period.
SimSES comes with three control algorithms, shown in Figure 4 showed structure and function blocks of “Control algorithm”. To insert the smoothing strategies in SimSES, the script was written to respect the structure and name of variables existing in the software. The SoC profile of the generated strategies was compared with the performed simulation in the Matlab, validating the correct implementation into the SimSES.
As illustrated in the Battery Degradation Model block in Figure 4, the degradation model integrated into SimSES is a weighted event-driven model with experimental data and semi-empirical equations. The stress characterization is obtained by extracting the cycles number, DoD, and the discharge rate from the SoC profile generated by the BESS Model. This output is the input to the equations that estimate the resulting degradation. The details of the degradation formulation can be found in the article published by the authors [29] or in the SimSES code itself. SimSES also contains experimental data from the commercial cell LiFePO4, manufactured by Sony, model US26650FTC1, at different discharge rates, operating temperature, and discharge depth [36]. Only for the LiFePO4 model, it is possible to calculate the total degradation by overlapping the effects of aging due to cycling, interpolating the experimental data with the equations that consider the calendar effects. When considering experimental data, it is important to note that all input data needed for aging models can be accurately determined. Therefore, it is to be expected a better-quality estimate in the result of event-oriented modeling, which only uses the curve of cycles number versus DoD. In this way, effects not considered by this modeling can be quantified and show possible divergences in the result of degradation between the control strategies.

3. Control Strategies to Smoothing Output PV Power

For a given fluctuation, BESS acts by injecting to the grid or storing energy in quantities determined by the control system as a function of rmax. Mathematically, the battery power per moment, Pbat(t), is given by the difference between the allowable power to be injected to the grid, Pgrid(t), and the power from the photovoltaic system, Ppv(t):
P b a t ( t ) = P g r i d ( t ) P p v ( t )
The signal convention adopted for Pbat(t) is positive for battery discharge (negative fluctuation) and negative for battery charge (positive fluctuation). Extending Equation (2) over a representative period, it generates the required battery power time series for each fluctuation event.

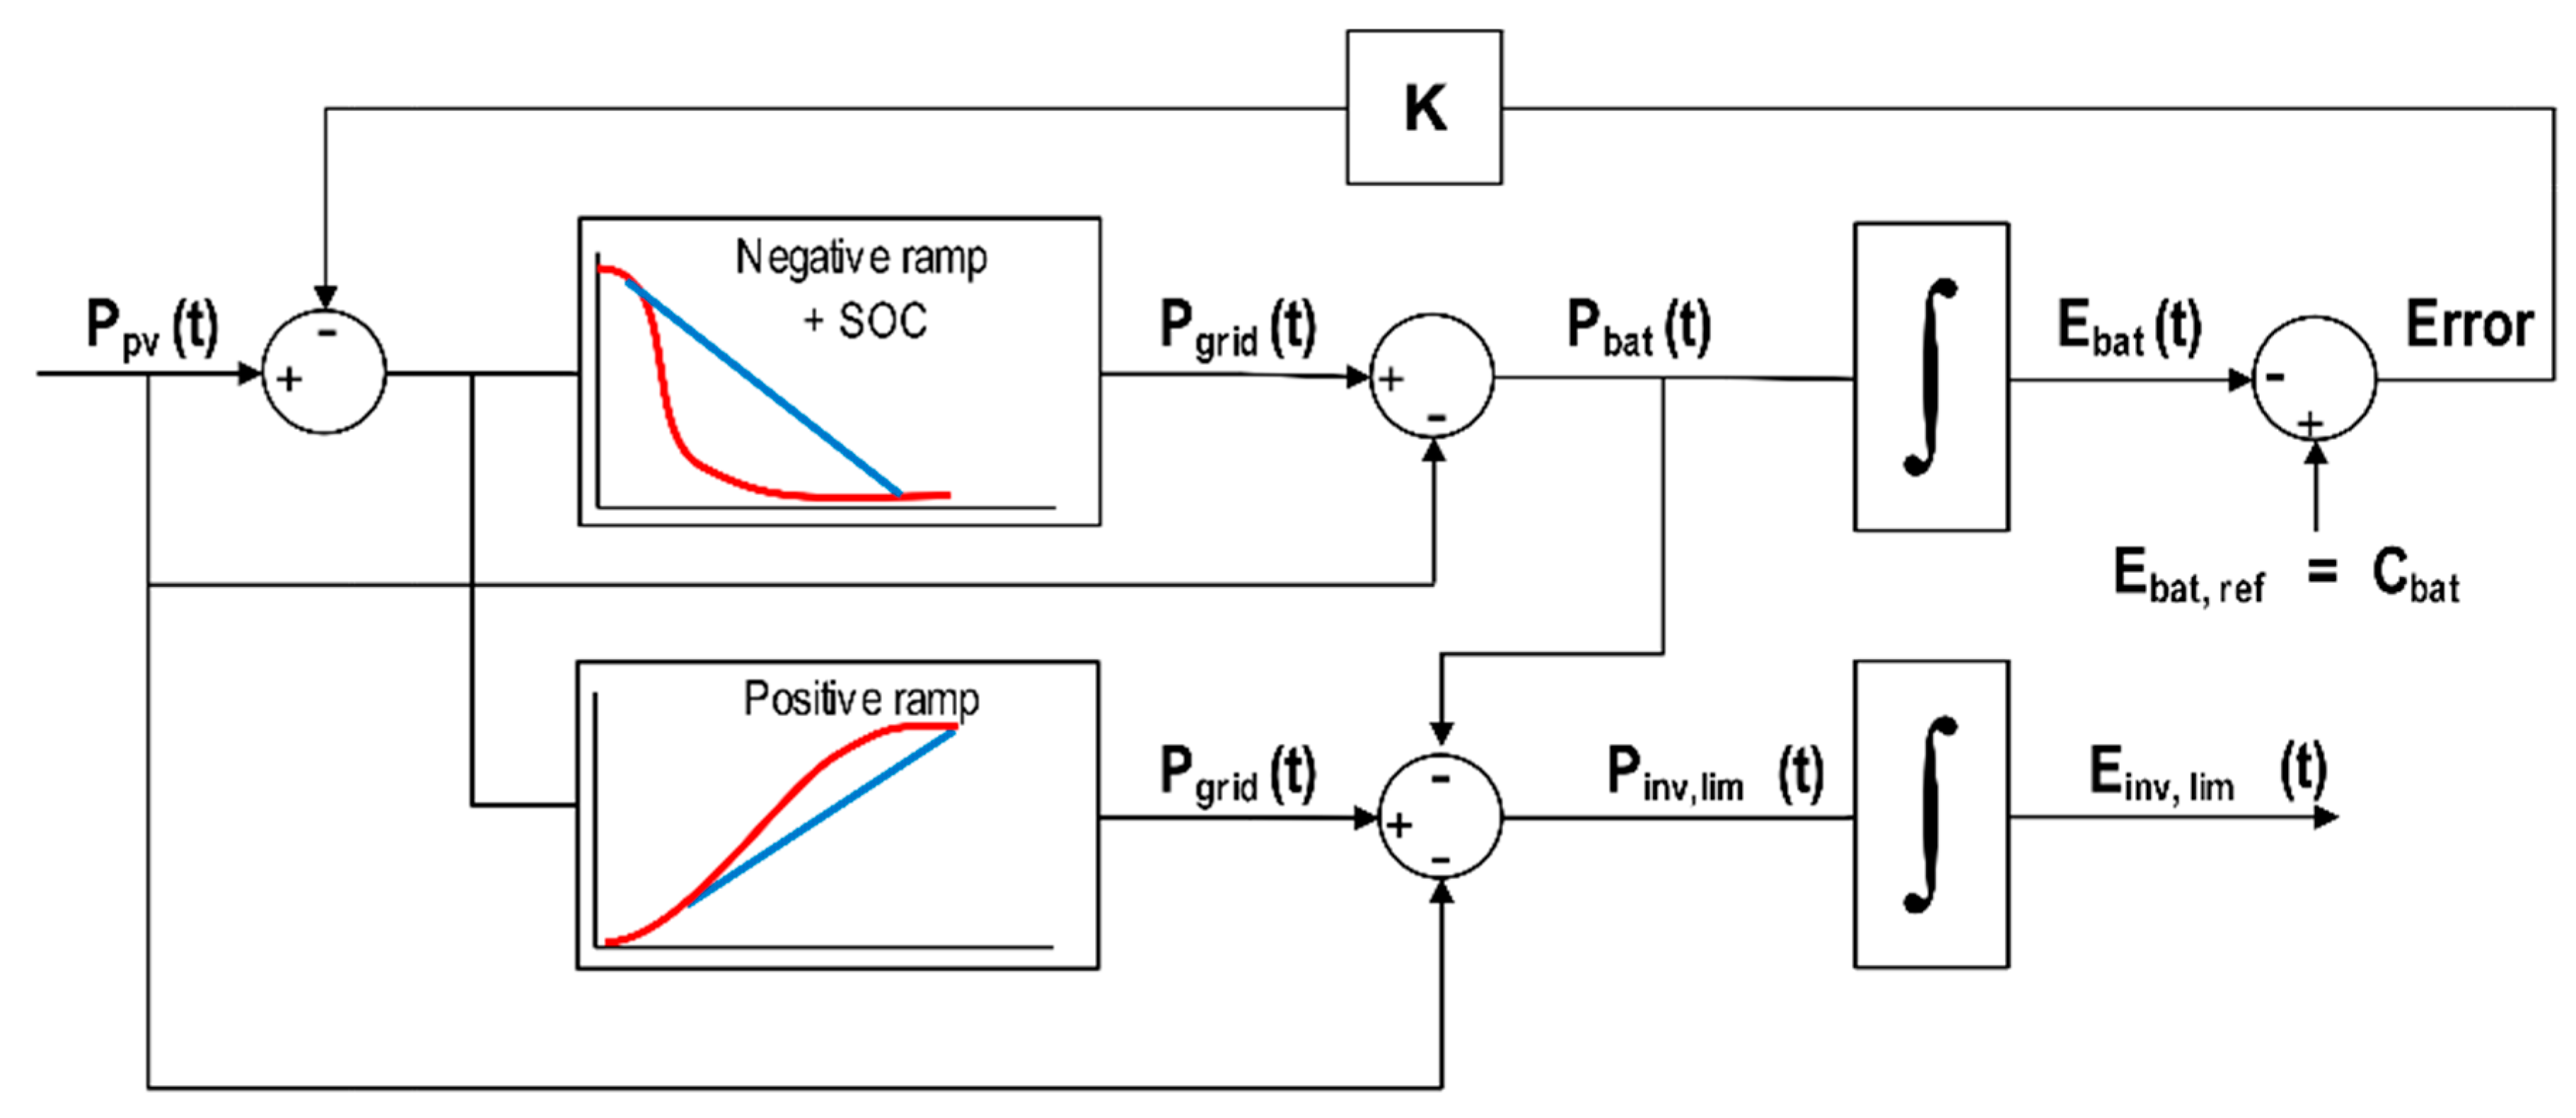
3.1. Strategy 1: Inverter Power Limitation

Makibar et al. [15] developed a strategy that does not need additional input parameters to reduce the inverter’s power limitation. The control diagram is shown in Figure 5. The idea is to use part of the PV power more than the upward fluctuation to control the SoC and, if there is still a generation surplus, to reduce the power of the inverters. SoC control consists of establishing a reference value for the energy stored in the battery (Ebat, ref) and implementing a control loop that tries to continuously regulate Ebat(t), if the ramp limit is met, and the energy never is removed from the grid (night charging prohibited).
The control will be faster or slower, depending on the value of the proportional parameter K. When the battery capacity is defined in advance, the Ebat(t) control is equivalent to the SoC control. While SoC is less than the reference value, all excess PV energy is used to charge the battery. Once the charging process is complete, the algorithm sends a reduction signal to the PV inverter, which is responsible for smoothing the rest of the upward fluctuation event. As the strategy allows restricting upward fluctuations, the reference value for SoC control is Ebat_ref = Cbat = 100% of SoC; otherwise, it would not be possible since the fluctuation signal is not known intuitively.
For this strategy, the value of the proportional parameter is k = 5, which allows maintaining a balance between speed and system stability and avoids high energy requirements on the part of the battery in the SoC recovery process [14]. The power limitation of the inverter, Pinv,lim (t), is calculated by the following equation:
P i n v , l i m ( t ) = P g r i d ( t ) P p v ( t ) P b a t ( t )
The strategy has four modes of operation (in addition to the standby mode). The equation attributed to the battery power value and the power limitation in the inverter in each mode is shown in Table 2.
During the simulations, there was a potential for improvement in Strategy 1. In the practical implementation of SoC control, the feedback loop is conditioned by a minimum value to avoid the inefficient operation of BESS in the last part of the SoC recovery. Otherwise, the values of the controlled variable Pbat would be extremely low and, although the efficiency of the converters is not considered in this article, the efficiency of the converter would decrease. Therefore, the effective power to charge the battery would be practically null.
In addition, to prevent oscillation of ON-OFF operations, a hysteresis region is defined to start and complete or interrupt the SoC recovery process. In addition to the positive effect on the efficiency of the converter, hysteresis avoids cycles of small magnitude even when the SoC has an acceptable value, reducing the total number of cycles.
In Figure 6, the region for the implementation of hysteresis between the blue and red lines is defined. After the battery is discharged under a fluctuation towards the blue line, it is only allowed to recharge it to the reference point if SoC(t) is less than the SoC reference to start, SoCstart = 95%.
When the SoCstop value = 98% is reached, following the direction of the red line, the SoC recovery process is completed. The SoCstop and SoCstart values were chosen after a series of simulations. It is important to mention that the hysteresis function only operates in the SoC recovery mode, not acting if it is due to an upward ramp event, as it would lead to overrunning rmax due to the battery not acting.

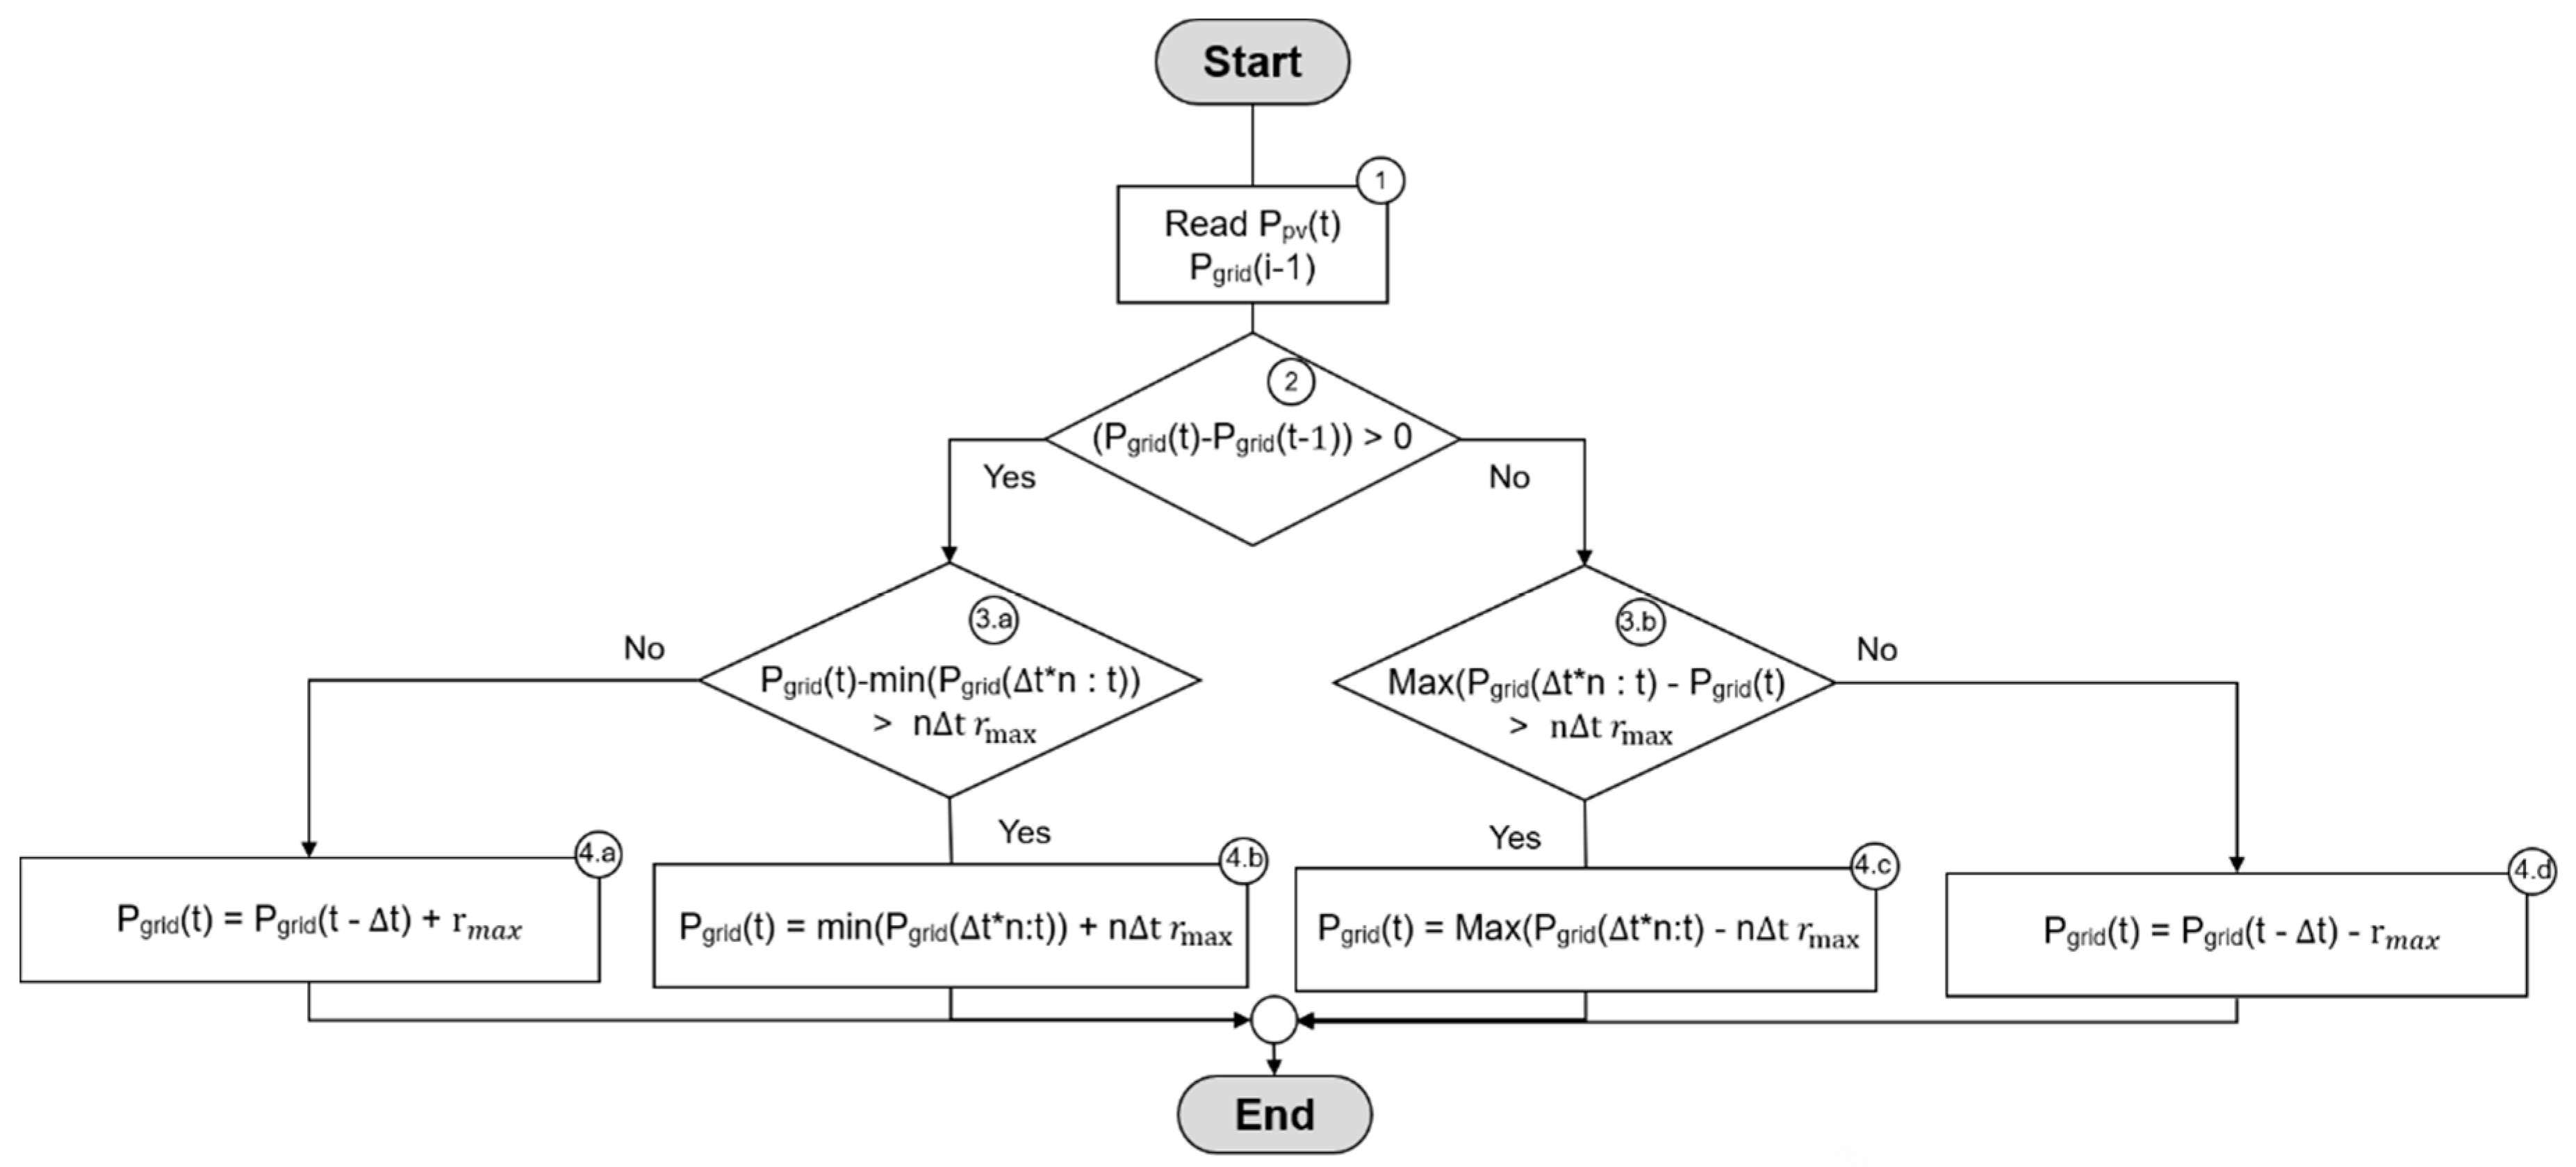
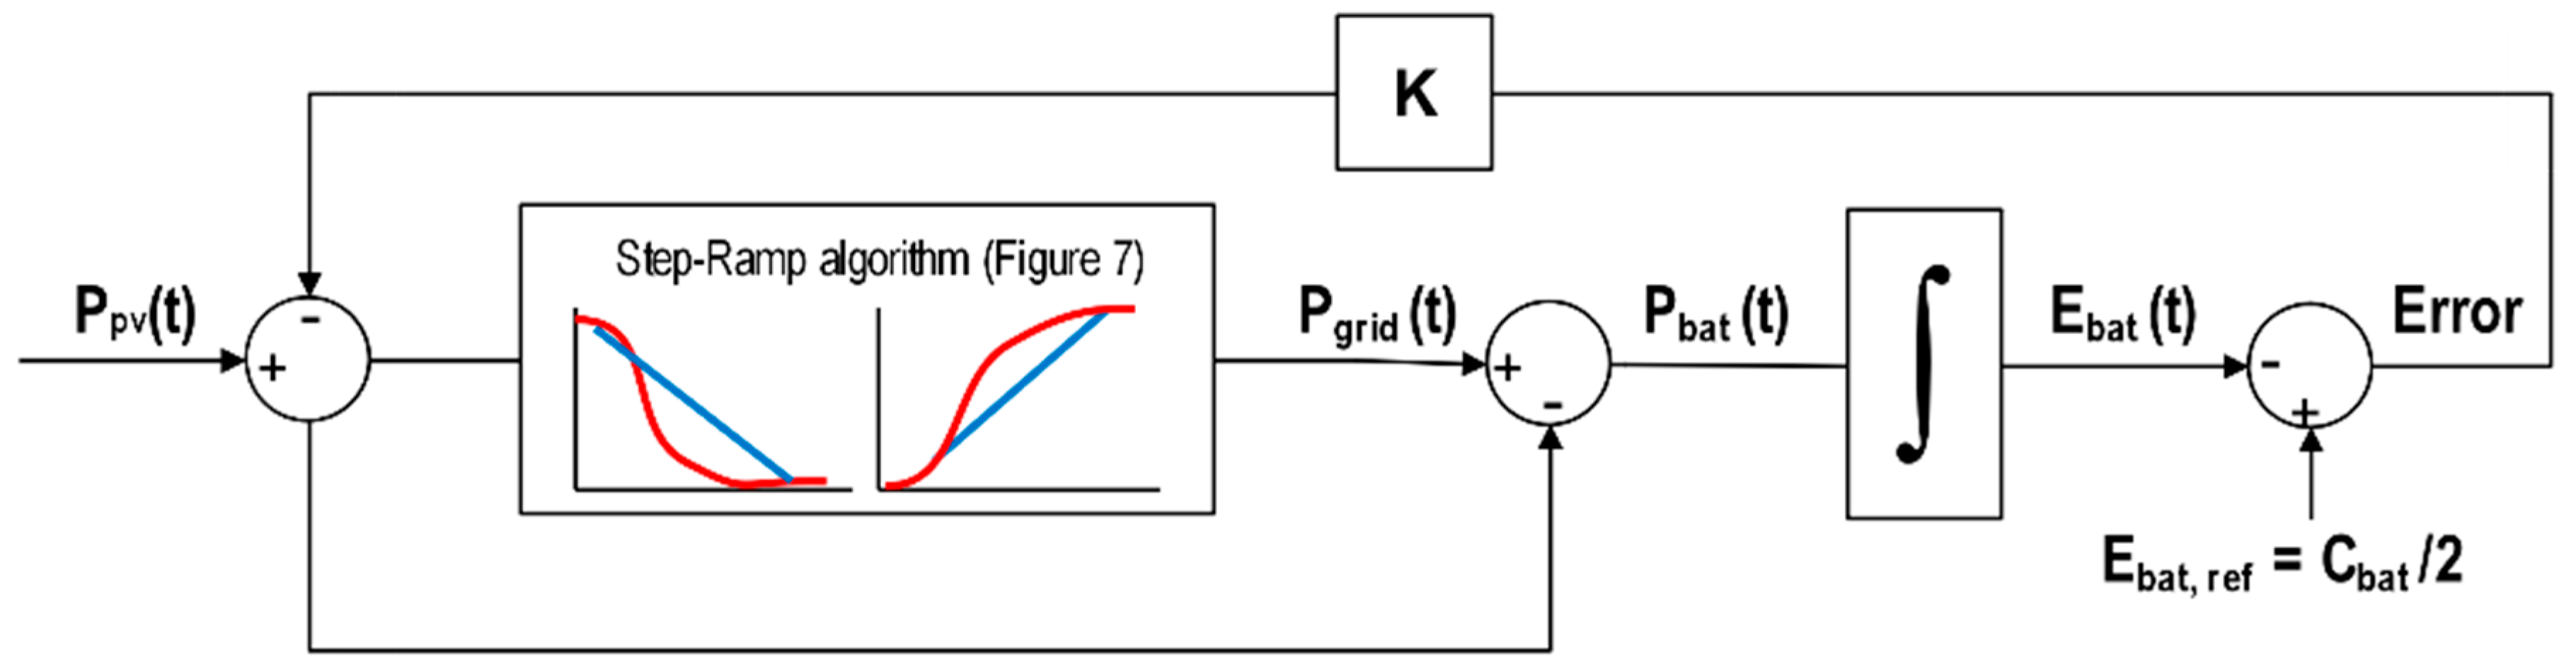
3.2. Strategy 2: Step-Rate

The Step-rate control was proposed by Marcos et al. [14] as an improvement to conventional ramp-rate control. The strategy is based on strict compliance with the rmax constraint for a defined time window (for example, 1 min, 10 min, etc.). Thus, the strategy mitigates fluctuations in that particular and higher time window. The algorithm for this strategy is shown in Figure 7.
It starts by reading Ppv (t) and Pgrid(t − Δt) and later verifying whether the evolution of Pgrid (t) is positive or negative (step 2). Then, a check is made to determine if the ramp condition is met in a previous time window with a duration of n times the sampling time Δt (5 s in our case), as described in step 3 of Figure 7. In other words, this implies strict compliance with the ramp condition for times equal to or greater than Δt, but not below this value. Finally, Pgrid (t) is calculated according to the respective equation presented in step 4.
To avoid battery discharge over time, this strategy also requires the same SoC control proposed for Strategy 1, as noted in the block diagram in Figure 8. As the fluctuation signal is unknown, a double capacity battery is required to absorb upward and downward fluctuation [14] or what is equivalent, and establish Ebat_ref = Cbat/2 in SoC control. The recommended values of k are between 2 and 8 [14], with k = 5 being chosen for all simulated cases.

4. Results

To overcome the lack of PV power data with different installed capacities, we used the PV plant model proposed by Marcos et al. [23], which allows estimating the power generated using only solar irradiation and the PV plant area as an input, with an average error of 0.8% and standard deviation of 4.8%. This model is widely used by several researchers to study the sensitivity of the performance of control strategies in relation to the capacity of PV [15,37]. Therefore, three PV powers were chosen to be investigated, 1 MWp, 5 MWp, and 20 MWp. The irradiance data for the implementation of the model were collected from the meteorological station installed at the Itaipu Technological Park, with a sampling rate of one second, during the period 12 July 2019 to 25 June 2020, totaling 349 days. After verification and data consolidation, 288 days were validated. The main reason for the rejection of most of the 61 days was due to failure to continue the record during a prolonged period of observation.
Figure 9 shows the number of cycles resulting from the application of the Rainflow counting algorithm for the SFV data series of 1 MWp, varying the strategy (Figure 9a) and the rmax ramp limit (Figure 9b). These graphs show an exponentially decreasing count pattern with deeper discharges. Cycles with a DoD less than 2% are responsible for a large part of the total cycles.
It is noted than in Figure 9b that, for rmax = 2 %/min, the cycles with DoD less than 2% represent more than 95% of the cycles; for rmax = 20 %/min, it drops to 75 %, still an expressive value. A contributor to this behavior is the momentary spikes in Ebat that only deviate slightly from Ebat_ref. These peaks originate from the compensation of small or short ramps. Although Figure 9b shows the result for rmax = 10 %/min and 1 MWp PV plant, similar behavior was observed for the other PV plant at different rmax. The most conservative cases, with PV plant of 20 MWp, rmax = 20 %/min and cycles with DoD less than 2%, represented more than 55% of the total cycles.
For Strategy 1, which implemented the hysteresis function, it can be seen, in Figure 9a, that BESS performs fewer total cycles than in the other strategy, but, in contrast, the number of cycles with DoD greater than 10 percent’s. It is also observed, in Figure 9a, that the number of cycles with DoD less than 1% is almost half (238). However, from DoD = 10%, the number of cycles in Strategy 1 is predominantly greater than in the other.
One of the main findings in Figure 9 is that shallow discharges have a cycle number in the range of 1000 to 1500. These counts are so high that many storage technologies, such as lead-acid batteries, cannot withstand them, regardless of the low energy involved in these cycles.
Only the results of the cyclical count do not reveal much, as the overall effect is uncertain. For a more accurate indicator of BESS degradation, a comparison with a reference to the maximum tolerance to the BESS cycle is required. Then, we proceed to estimate the degradation with the event-oriented model using Equation (1). It is assumed that the BESS is a lithium-ion battery of the NMC type, with a life cycle curve like that shown in Figure 3. The lithium-ion battery of the NMC type is chosen because it is the technology adopted for stationary use by several manufacturers [31,38,39]. Given the fact that the manufacturer does not allow DoD values greater than 80%, the Cbat data was scaled to correspond to a DoD between 0% and 80%, and not between 0% and 100%, but still maintaining the ratio of capacity between strategies.
The degradation values calculated for different PV plants and rmax for each strategy evaluated is shown in Figure 10. The behavior indicates that large PV plants have less degradation for higher rmax, with a difference becoming more pronounced while rmax increases. The results indicate that a centralized BESS for several PV plants can be a favorable point in terms of degradation.
By looking at Figure 10, it is observed that the DT remained is lower than 0.4%. Figure 10c shows the degradation of Strategy 1 (DT, Strategy1) in relation to the degradation of Strategy 2 (DT, Strategy2). Factor 1 indicates that both degradations were equal; a factor less than 1 indicates that the degradation of Strategy 2 was greater than the degradation of Strategy 1, and a factor greater than 1 indicates that the degradation of Strategy 1 was greater than Strategy 2. The results point out that in some cases, Strategy 1 was the one with the worst performance, reaching 50% higher in specific cases, such as rmax = 10 %/min. Although it has a lower number of total cycles (Figure 9a), the number of deep cycles is greater than that of the other strategy, further degrading the battery by the decreasing exponential relationship between the number of cycles and DoD (Figure 3).
It is important to note that the Cbat for Strategy 2 is more than two-fold the Strategy 1, hindering a simple comparison between DT, Strategy1 and DT, Strategy2. We compared the DT values of both Strategies with the same Cbat, using as reference the capacity value of strategy 2. By considering this normalized Cbat condition, the influence of the operation on the BESS degradation was evaluated. As seen in Figure 11, DT, Strategy1 decreases considerably and presents a lower degradation than DT, Strategy2. This shows that Strategy 1, under the same Cbat, makes better use of the battery resource. It is noteworthy that, regarding the losses due to inverter limitation, Cbat increased, and the losses decreased. For the worst-case calculated (1 MWp, rmax = 2 %/min), the value of the loss was 1.7%, with the average of the total cases being 0.5%.
The results obtained by Equation (1) show the degradation only because of BESS cycling referring to DoD. However, there are additional effects that were not considered, which clearly affects the useful life, such as discharge rate (DR) and recharge rate (RR), operating temperature (which, in stationary applications, is controlled considering constant 25 °C), dependence between cycles, and calendar degradation, which is independent of the cycles. For this, the strategies were simulated using SimSES. The main difference from the SimSES model is that it allows considering the effects of TD and CT, self-discharge, SoC, and calendar degradation on the degradation rate.
As seen in Table 3, the SimSES model calculated a greater degradation than the event-oriented model for all cases. For Strategy 2, the order was 50% higher than the event-oriented model, probably due to severe DR and RR, which increases the stress on the battery. For Strategy 1, the difference was greater, at least 100% and 300%. Comparing the DR result obtained by the SimSES model, the conclusion that Strategy 1 generates less battery stress than Strategy 2 (Figure 11) cannot be sustained.
Based on the difference obtained between the models, it is induced that the stress factors not considered by the event-oriented model have a greater effect on Strategy 1 than on Strategy 2. In the participation of the total degradation, the degradation by cycling participates with a portion, this being mainly due to DoD, DR and RR. For Cbat, Strategy 1 is less aggressive in terms of DR and RR than Strategy 2. Therefore, this should not be one of the factors that justifies such a difference.
The other portion of total degradation is due to calendar degradation. In lithium-based batteries, the cell’s calendar aging depends on temperature and charge status. The temperature is discarded because it was considered constant. The state of charge can be a differential stress factor because, for each strategy, the reference value to be maintained by the SoC control is different, as already explained, being Ebat, ref = 50% for Strategy 2 and Ebat, ref = SOC 100% for Strategy 1. The high SoC the same that high cell voltages, resulting in greater mechanical stress for the materials and, consequently, causes a shorter battery life [28]. Additionally, keeping the battery in high SoC while the battery is in standby generates a greater loss of cathodic material, a thicker solid electrolyte interface layer, and greater anode resistance compared to the cell in low SoC [26,27].
From these premises, another simulation was performed using the SimSES degradation model and Ebat, ref = SoC 80% for Strategy 1. The results are presented in Table 4. Maintaining Ebat, ref = SoC 80% decreased the degradation in at least 25% with respect to degradation maintaining Ebat, ref = SoC 100%.
As noted, for these circumstances, Strategy 1 presents less degradation than Strategy 2. These results show the importance of the degradation model. It is noteworthy that, in the works De la Parra et al. [40,41], they used a strategy with power limitations in the inverter, Ebat, ref = SoC 100%, and the event-oriented degradation model was always considered to compare with other strategies. The results revealed that this approach can lead to an error by deciding the best strategy in terms of BESS degradation.

5. Conclusions

The results showed the effects of different battery degradation models for the control strategy applications based on active power compensation units in photovoltaic generators connected to the grid. In sum, the battery model requirements were quantified and compared for two different control strategies by using a wide range of restrictions and installed PV plant capacities.
The semi-empirical degradation model revealed higher battery degradation for all simulated cases. For Strategy 2, the order was 50% higher than the event-oriented model, probably due to severe DR and RR, which increases the stress on the battery. For Strategy 1, the difference was greater, between 100% and 300%. As an important result, our study revealed that choosing a simplified degradation model approach can lead to an error in the conclusion of which strategies are the best since the calendar life effect are important in the application of PV power smoothing. The event-based model indicated that Strategy 1 was the one that implied less battery degradation, but the semi-empirical model indicated the opposite. Considering that the semi-empirical model considers more parameters of degradation, the fact that Strategy 2 implies less degradation is more reliable.
Moreover, the result obtained by the SimSES model corroborates that the accelerated lithium cell battery degradation takes place, as the operation is at high SoC. Maintaining Ebat, ref = SoC 80% decreased the degradation in at least 25% with respect to degradation, maintaining Ebat, ref = SoC 100%. For this, Ebat, ref of the SoC control can be designed to avoid operating under a high load state.
Despite the considerable battery degradation estimation difference obtained by using the model, we argued that the experimental validation may contribute to improving the models employed as well as comparing the feasibility of the control strategy. Therefore, a solid advance in the BESS degradation model may drive a promising PV smoothing strategy for practical applications.

Author Contributions

Conceptualization: V.S.D. and O.H.A.J.; investigation and simulation: V.S.D., A.Q.O.S., and O.H.A.J.; wrote and final editing: V.S.D., A.Q.O.S., and D.A.C. All authors have read and agreed to the published version of the manuscript.

Funding

This research was funded by COPEL of the Research and Development program, regulated by ANEEL, grant number PD-2866-0452/2016, The O.H.A.J. was funded by Triple Agenda Institutional Program of the Federal University of Latin American Integration (UNILA), grant number Edital PRPPG 137/2018. The O.H.A.J. was funded by the Brazilian National Council for Scientific and Technological Development (CNPq), grant number 407531/2018-1 and 303293/2020-9.

Institutional Review Board Statement

Not applicable.

Informed Consent Statement

Not applicable.

Data Availability Statement

Data available on request due to restrictions the privacy. The data presented in this study are available on request from the corresponding author ([email protected]). The data are not publicly available due to standard of the Itaipu Technological Park Foundation—FPTI.

Acknowledgments

The authors would like to thank to the COPEL and ANEEL for financial supporting and facilities, Federal University of Latin American Integration (UNILA), Coordination for the Improvement of Higher Education Personnel (CAPES) and the Brazilian Council for Scientific and Technological Development (CNPq) for financial support.

Conflicts of Interest

The authors declare no conflict of interest.

References

  1. Shivashankar, S.; Mekhilef, S.; Mokhlis, H.; Karimi, M. Mitigating Methods of Power Fluctuation of Photovoltaic (PV) Sources—A Review. Renew. Sustain. Energy Rev. 2016, 59, 1170–1184. [Google Scholar] [CrossRef]
  2. Marcos, J.; Storkël, O.; Marroyo, L.; Garcia, M.; Lorenzo, E. Storage Requirements for PV Power Ramp-Rate Control. Sol. Energy 2014, 99, 28–35. [Google Scholar] [CrossRef] [Green Version]
  3. Smart Energy Grid Engineering; Gabbar, H.A. (Ed.) Academic Press: London, UK; San Diego, CA, USA, 2017; ISBN 978-0-12-805343-0. [Google Scholar]
  4. Mansouri, N.; Lashab, A.; Sera, D.; Guerrero, J.M.; Cherif, A. Large Photovoltaic Power Plants Integration: A Review of Challenges and Solutions. Energies 2019, 12, 3798. [Google Scholar] [CrossRef] [Green Version]
  5. Gevorgian, V.; Booth, S. Review of PREPA Technical Requirements for Interconnecting Wind and Solar Generation; Energy Lab.(NREL): Golden, CO, USA, 2013. [Google Scholar]
  6. Comisión Reguladora de Energia. Reglas Generales de Interconexión al Sistema Eléctrico Nacional. 2012. Available online: https://www.cre.gob.mx/documento/2195.pdf (accessed on 5 October 2020).
  7. Energinet.dk. Technical Regulation 3.2.2 for PV Power Plants Above 11 KW; Energinet.dk: Copenhagen, Denamark, 2016; p. 108. [Google Scholar]
  8. Alam, M.J.E.; Saha, T.K. Cycle-Life Degradation Assessment of Battery Energy Storage Systems Caused by Solar PV Variability. In Proceedings of the 2016 IEEE Power and Energy Society General Meeting (PESGM), Boston, MA, USA, 17–21 July 2016; IEEE: Boston, MA, USA, 2016; pp. 1–5. [Google Scholar]
  9. Craciun, B.-I.; Kerekes, T.; Sera, D.; Teodorescu, R.; Annakkage, U.D. Power Ramp Limitation Capabilities of Large PV Power Plants With Active Power Reserves. IEEE Trans. Sustain. Energy 2017, 8, 573–581. [Google Scholar] [CrossRef]
  10. Zheng, Q.; Li, J.; Ai, X.; Wen, J.; Fang, J. Overivew of Grid Codes for Photovoltaic Integration. In Proceedings of the 2017 IEEE Conference on Energy Internet and Energy System Integration (EI2), Beijing, China, 26–28 November 2017; pp. 1–6. [Google Scholar]
  11. Alam, M.J.E.; Muttaqi, K.M.; Sutanto, D. A Novel Approach for Ramp-Rate Control of Solar PV Using Energy Storage to Mitigate Output Fluctuations Caused by Cloud Passing. IEEE Trans. Energy Convers. 2014, 29, 507–518. [Google Scholar] [CrossRef] [Green Version]
  12. De la Parra, I.; Marcos, J.; García, M.; Marroyo, L. Dealing with the Implementation of Ramp-Rate Control Strategies—Challenges and Solutions to Enable PV Plants with Energy Storage Systems to Operate Correctly. Sol. Energy 2018, 169, 242–248. [Google Scholar] [CrossRef]
  13. Kim, N.K.; Cha, H.J.; Seo, J.J.; Won, D.J. SOC Management Algorithm of Battery Energy Storage System for PV Ramp Rate Control. In Proceedings of the 2017 6th International Youth Conference on Energy (IYCE), Budapest, Hungary, 21–24 June 2017; IEEE: Budapest, Hungary, 2017; pp. 1–6. [Google Scholar]
  14. Marcos, J.; de la Parra, I.; García, M.; Marroyo, L. Control Strategies to Smooth Short-Term Power Fluctuations in Large Photovoltaic Plants Using Battery Storage Systems. Energies 2014, 7, 6593–6619. [Google Scholar] [CrossRef]
  15. Makibar, A.; Narvarte, L.; Lorenzo, E. On the Relation between Battery Size and PV Power Ramp Rate Limitation. Sol. Energy 2017, 142, 182–193. [Google Scholar] [CrossRef] [Green Version]
  16. Ellis, A.; Schoenwald, D.; Hawkins, J.; Willard, S.; Arellano, B. PV Output Smoothing with Energy Storage. In Proceedings of the 2012 38th IEEE Photovoltaic Specialists Conference, Austin, TX, USA, 3–8 June 2012; pp. 1523–1528. [Google Scholar]
  17. Sukumar, S.; Mokhlis, H.; Mekhilef, S.; Karimi, M.; Raza, S. Ramp-Rate Control Approach Based on Dynamic Smoothing Parameter to Mitigate Solar PV Output Fluctuations. Int. J. Electr. Power Energy Syst. 2018, 96, 296–305. [Google Scholar] [CrossRef]
  18. Van Haaren, R.; Morjaria, M.; Fthenakis, V. An Energy Storage Algorithm for Ramp Rate Control of Utility Scale PV (Photovoltaics) Plants. Energy 2015, 91, 894–902. [Google Scholar] [CrossRef]
  19. Martins, J.; Spataru, S.; Sera, D.; Stroe, D.-I.; Lashab, A. Comparative Study of Ramp-Rate Control Algorithms for PV with Energy Storage Systems. Energies 2019, 12, 1342. [Google Scholar] [CrossRef] [Green Version]
  20. Saez-de-Ibarra, A.; Martinez-Laserna, E.; Stroe, D.-I.; Swierczynski, M.; Rodriguez, P. Sizing Study of Second Life Li-Ion Batteries for Enhancing Renewable Energy Grid Integration. IEEE Trans. Ind. Appl. 2016, 52, 4999–5008. [Google Scholar] [CrossRef] [Green Version]
  21. PV Fluctuation Balancing Using Hydrogen Storage—A Smoothing Method for Integration of PV Generation into the Utility Grid—ScienceDirect. Available online: https://www.sciencedirect.com/science/article/pii/S187661021101959X (accessed on 7 June 2020).
  22. Beltran, H.; Bilbao, E.; Belenguer, E.; Etxeberria-Otadui, I.; Rodriguez, P. Evaluation of Storage Energy Requirements for Constant Production in PV Power Plants. IEEE Trans. Ind. Electron. 2013, 60, 1225–1234. [Google Scholar] [CrossRef]
  23. Marcos, J.; Marroyo, L.; Lorenzo, E.; Alvira, D.; Izco, E. From Irradiance to Output Power Fluctuations: The PV Plant as a Low Pass Filter. Prog. Photovolt. Res. Appl. 2011, 19, 505–510. [Google Scholar] [CrossRef] [Green Version]
  24. Chawla, M.; Naik, R.; Burra, R.; Wiegman, H. Utility Energy Storage Life Degradation Estimation Method. In Proceedings of the 2010 IEEE Conference on Innovative Technologies for an Efficient and Reliable Electricity Supply, Waltham, MA, USA, 27–29 September 2010; IEEE: Waltham, MA, USA, 2010; pp. 302–308. [Google Scholar]
  25. Karmiris, G.; Tengner, T. Control Method Evaluation for Battery Energy Storage System Utilized in Renewable Smoothing. In Proceedings of the IECON 2013—39th Annual Conference of the IEEE Industrial Electronics Society, Vienna, Austria, 10–13 November 2013; IEEE: Vienna, Austria, 2013; pp. 1566–1570. [Google Scholar]
  26. Alipour, M.; Ziebert, C.; Conte, F.V.; Kizilel, R. A Review on Temperature-Dependent Electrochemical Properties, Aging, and Performance of Lithium-Ion Cells. Batteries 2020, 6, 35. [Google Scholar] [CrossRef]
  27. Björklund, E.; Wikner, E.; Younesi, R.; Brandell, D.; Edström, K. Influence of State-of-Charge in Commercial LiNi0.33Mn0.33Co0.33O2/LiMn2O4-Graphite Cells Analyzed by Synchrotron-Based Photoelectron Spectroscopy. J. Energy Storage 2018, 15, 172–180. [Google Scholar] [CrossRef]
  28. Schmalstieg, J.; Käbitz, S.; Ecker, M.; Sauer, D.U. A Holistic Aging Model for Li(NiMnCo)O2 Based 18650 Lithium-Ion Batteries. J. Power Sources 2014, 257, 325–334. [Google Scholar] [CrossRef]
  29. Naumann, M.; Truong, C.N.; Schimpe, M.; Kucevic, D.; Jossen, A.; Hesse, H.C. SimSES: Software for Techno-Economic Simulation of Stationary Energy Storage Systems. In Proceedings of the International ETG Congress 2017, Berlin, Germany, 28–29 November 2017; pp. 1–6. [Google Scholar]
  30. ASTM International. Practices for Cycle Counting in Fatigue Analysis; ASTM International: West Conshohocken, PA, USA, 2017. [Google Scholar]
  31. Intensium Max+ 20P Datasheet; Saft, 2017. Available online: https://www.saftbatteries.com/products-solutions/products/intensium%C2%AE-max-megawatt-energy-storage-system (accessed on 17 December 2020).
  32. Xu, B.; Oudalov, A.; Ulbig, A.; Andersson, G.; Kirschen, D.S. Modeling of Lithium-Ion Battery Degradation for Cell Life Assessment. IEEE Trans. Smart Grid 2018, 9, 1131–1140. [Google Scholar] [CrossRef]
  33. Altairnano. PowerRack Technical Information. Available online: https://altairnano.com/products/powerrack/ (accessed on 10 December 2020).
  34. Wu, J.; Wei, Z.; Li, W.; Wang, Y.; Li, Y.; Sauer, D.U. Battery Thermal- and Health-Constrained Energy Management for Hybrid Electric Bus Based on Soft Actor-Critic DRL Algorithm. IEEE Trans. Ind. Inf. 2021, 17, 3751–3761. [Google Scholar] [CrossRef]
  35. Wei, Z.; Zhao, J.; He, H.; Ding, G.; Cui, H.; Liu, L. Future Smart Battery and Management: Advanced Sensing from External to Embedded Multi-Dimensional Measurement. J. Power Sources 2021, 489, 229462. [Google Scholar] [CrossRef]
  36. Rumpf, K.; Naumann, M.; Jossen, A. Experimental Investigation of Parametric Cell-to-Cell Variation and Correlation Based on 1100 Commercial Lithium-Ion Cells. J. Energy Storage 2017, 14, 224–243. [Google Scholar] [CrossRef]
  37. Schnabel, J.; Valkealahti, S. Energy Storage Requirements for PV Power Ramp Rate Control in Northern Europe. Int. J. Photoenergy 2016, 2016, 2863479. [Google Scholar] [CrossRef] [Green Version]
  38. Samsung SDI. Battery Brochure. 2019. Available online: https://www.samsungsdi.com/upload/ess_brochure/201902_Samsung%20SDI%20ESS_EN.pdf (accessed on 11 December 2020).
  39. Kokam. Cell Datasheet. 2019. Available online: https://kokam.com/data/filebox/cell_brochure.pdf (accessed on 12 December 2020).
  40. De la Parra, I.; Marcos, J.; García, M.; Marroyo, L. Control Strategies to Use the Minimum Energy Storage Requirement for PV Power Ramp-Rate Control. Sol. Energy 2015, 111, 332–343. [Google Scholar] [CrossRef]
  41. De la Parra, I.; Marcos, J.; García, M.; Marroyo, L. Improvement of a Control Strategy for PV Power Ramp-Rate Limitation Using the Inverters: Reduction of the Associated Energy Losses. Sol. Energy 2016, 127, 262–268. [Google Scholar] [CrossRef]
Figure 1. Rainflow counting algorithm.
Energies 14 03600 g001
Figure 2. Flowchart of event-based battery degradation modeling.
Energies 14 03600 g002
Figure 3. Number of cycles versus DoD for different lithium technologies.
Energies 14 03600 g003
Figure 4. SimSES structure and function blocks (adapted from [29]).
Energies 14 03600 g004
Figure 5. Control diagram of Strategy 1.
Energies 14 03600 g005
Figure 6. Hysteresis loop to start the SoC recovery process.
Energies 14 03600 g006
Figure 7. Strategy 2 Flowchart.
Energies 14 03600 g007
Figure 8. Control diagram of Strategy 2.
Energies 14 03600 g008
Figure 9. Number of cycles observed at a given discharge depth (DoD) for the 1 MWp PV plant. (a) Each strategy and rmax = 10 %/min, (b) Strategy 1 for rmax = 2 %/min, rmax = 10 %/min and rmax = 20 %/min.
Energies 14 03600 g009
Figure 10. BESS degradation for the 288 days. (a) Strategy 1; (b) Strategy 2; and (c) Total degradation ratio between strategy 1 and 2.
Energies 14 03600 g010
Figure 11. Total degradation ratio between Strategy 1 and 2, assuming that Strategy 1 works with the Cbat required by Strategy 2.
Energies 14 03600 g011
Table 1. Maximum power ramp-rate requirements (rmax) for different countries.
CountryPositive RampNegative RampRef.
Germany10 %/minNo[9]
China
<30 MW
30–150 MW
>150 MW
3 MW/min
Installed capacity/10
15 MW/min
3 MW/min
Installed capacity/10
15 MW/min
[10]
Denmark100 kW/s100 kW/s[7]
Ireland30 MW/minNo[9]
México 2–5%/min1–5%/min[6]
Puerto Rico 10%/min10%/min[5]
Table 2. Operation modes of Strategy 1.
StateOperation ModePbat (t)SignPinv,lim (t)
1Standby0 0
2Ramp-Down P g r i d ( t ) P p v ( t ) 0 > D0
3SoC Recovery/No ramp [ E b a t ,   r e f E b a t ( t ) ] 0 < C0
4SoC recovery/Ramp-Up P r e d e ( t ) P p v ( t ) 0 < C0
5Limited ramp-up01 P g i r d ( t ) P p v ( t )
Note: D = battery discharging, C = battery charging.
Table 3. Degradation comparison for different models.
rmax [%/min]Event-Oriented Model [%]SimSES Model [%]Relative Difference
[%]
DT, Strategy1DT, Strategy2DT, Strategy1DT, Strategy2DT, Strategy1DT, Strategy2
20.20.20.50.415050
100.30.20.60.410050
200.10.10.40.2300100
Table 4. Ebat, ref action in Strategy 1 using the SimSES degradation model.
rmax [%/min]DT, Strategy1
Ebat, ref = 80% SOC
DT, Strategy1
Ebat, ref = 100% SOC
Difference [%]
20,30,5−40
100,40,6−33
200,20,4−50
Publisher’s Note: MDPI stays neutral with regard to jurisdictional claims in published maps and institutional affiliations.

