Article

Effect of Floating Metallic Particles in Pre-Breakdown and Breakdown Characteristics of Oil Transformer under DC Voltage

by
I. Made Yulistya Negara
1,*,
Daniar Fahmi
1,
Dimas Anton Asfani
1,
I. G. N. Satriyadi Hernanda
1,
Mochammad Wahyudi
2 and
Muhammad Novis Ibrahim
1
1
Department of Electrical Engineering, Faculty of Intelligent Electrical and Informatic Technology, Institut Teknologi Sepuluh Nopember, Surabaya 60111, Indonesia
2
Department of Electrical Engineering and Information Technology, Faculty of Engineering, Universitas Gajah Mada, Yogyakarta 55281, Indonesia
*
Author to whom correspondence should be addressed.
Energies 2021, 14(12), 3669; https://doi.org/10.3390/en14123669
Submission received: 25 May 2021 / Revised: 17 June 2021 / Accepted: 17 June 2021 / Published: 20 June 2021
(This article belongs to the Section F: Electrical Engineering)

Abstract

:
Contaminants in transformer oil insulation can float when meeting several conditions. Then, the presence of floating contaminants affects the electrical characteristics of oil insulation. Therefore, the pre-breakdown (corona) and breakdown characteristics due to metallic floating particles in transformer oil insulation would be investigated. This test used DC high voltage stress. A 56 Ω resistor was connected to the oscilloscope to detect the corona currents. The camera was used to capture the images of corona light emission. In addition, the electric field between the electrode and particles was simulated. The variables were the particle size, including its shape, and the distance between the particles and the grounded electrode. The experimental results show that the average value of corona inception and breakdown was inversely proportional to the size of floating particles. The peak value of corona current was directly proportional to the particle size. The lowest breakdown voltage was found when the particle was close to the electrode, but they were not in contact.

1. Introduction

Insulation serves as a separator between conductors with non-energized parts, or between two or more conductors with different voltages. Liquid insulation is one kind of insulation. Insulating oil in electrical equipment is used as an impregnating and filler material, and can be a cooling substance to increase dissipation rate of the heat generated by winding and other resistive components through convection process.
The main problem is that liquid insulation can be a factor in breakdown. The reduced dielectric strength is a common cause of failure in liquid insulation. These can be caused by the aging of insulation and electrical equipment, such as transformers, that use oil liquid insulation. The presence of aging drives transformer oil to be decreased in quality and causes contamination [1,2].
Contamination in transformer oil may be in the form of gas bubbles, water content, and solid particles. The water content comes from a decrease in quality of paper insulation used in transformer windings, while the gas bubbles are due to thermal stress in transformer oil. The solid particles are derived from deterioration in windings, iron core, transformer body, or external solid particles that get inside the transformer at the time of installation or maintenance [3].
The contamination can cause overstress to the oil insulation, which will initiate localized partial discharge (PD). Recently, several studies have been conducted to analyze PD activity in transformer oil [4,5,6,7]. Moreover, the effect of solid contaminant as a source of PD is deeply investigated [3,8,9]. Wang et al. [10] suggested that escalation of the collisions between particles and electrodes generated more partial discharges as the DC part increased at composite AC and DC voltages, which decreased the transformer oil breakdown voltage.
In addition to the applied voltage type (DC, AC, or composite), liquid viscosity, and parameters related to the particles themselves, the liquid motion may affect the particle trajectories whereby the PD characteristics may be exaggerated. Recently, a research group actively investigated partial discharge activity on flowing trans-former oil contaminated by metallic particles under different operating temperatures, velocity, applied voltage, and particle concentration [11,12,13,14]. They found that the metallic particles increased partial discharge activity and lower breakdown voltage, but moving oil helped reduce partial discharge activity.
The solid particles or contaminants can move or float in the transformer oil due to charge induction. The induced particle will float between the conductor and non-energized part. The particles will continue to float until the transformer oil breakdown occurs [15].
Investigation of floating particle effects has been carried out for gas insulation [16,17,18]. Furthermore, in [19], it was found that Trichel and streamer corona occurred on the side of floating particle. In addition, the mechanism of corona release was influenced by the shape and location of particles parameters as well as the given ac high voltage. The effect of floating metal particles in SF6 gas was also investigated by using DC high voltage [20]. It was not easy to distinguish between the positive corona pulses and the negative corona pulses due to the irregular repetition of waves and amplitude, as well as the active development of corona due to the floating particle between two electrodes. A work on the effect of copper particles on the breakdown voltage of vegetable oil has been studied in [21]. This study used micrometer size, and did not focus on pre-breakdown and breakdown mechanisms.
Unfortunately, investigation of floating metallic particle effect in oil insulation has rarely discussed compared to in air or gas insulation. Our previous work discussed the motion of floating free metallic particles under DC voltage [22]. We found that pre-breakdown conditions in that investigation were quite challenging to observe, due to particle motion. Therefore, this paper wants to research more about the effects of static floating metallic particles on the transformer oil to better understanding the phenomena both in pre-breakdown conditions, such as corona inception voltage and corona current pulses, and breakdown conditions, such as breakdown voltage. The variations of particle parameters, including location, size, and shape, were also presented.

2. Breakdown Mechanism and Corona as Pre-Breakdown Phenomenon

Solid particles originating from a decrease in transformer quality are generally conductive or metallic. Components in transformers consist of various types of metals, such as iron and copper.
The presence of particles between electrodes increases the local field around the particles depending on their shape. If this field is very high, it will cause local failure near the particles and trigger gas bubbles. The dielectric strength of gas is lower than the dielectric strength of oil, so there will be a decrease in dielectric strength around the particles and gas bubbles, which will trigger a breakdown. The static model is used in this study, therefore the effect of cooling type or temperature was not considered in this study. However, the corona initiation due to bubble forming may be affected as the temperature varied [23,24].
Corona is a common phenomenon in high voltage that is very easily observed on non-uniform electrodes. Corona causes damage to insulation material due to chemical processes formed from discharges. Under positive voltage stress, corona will appear bluish-white. However, under negative voltage, the corona will appear to have glowing points.

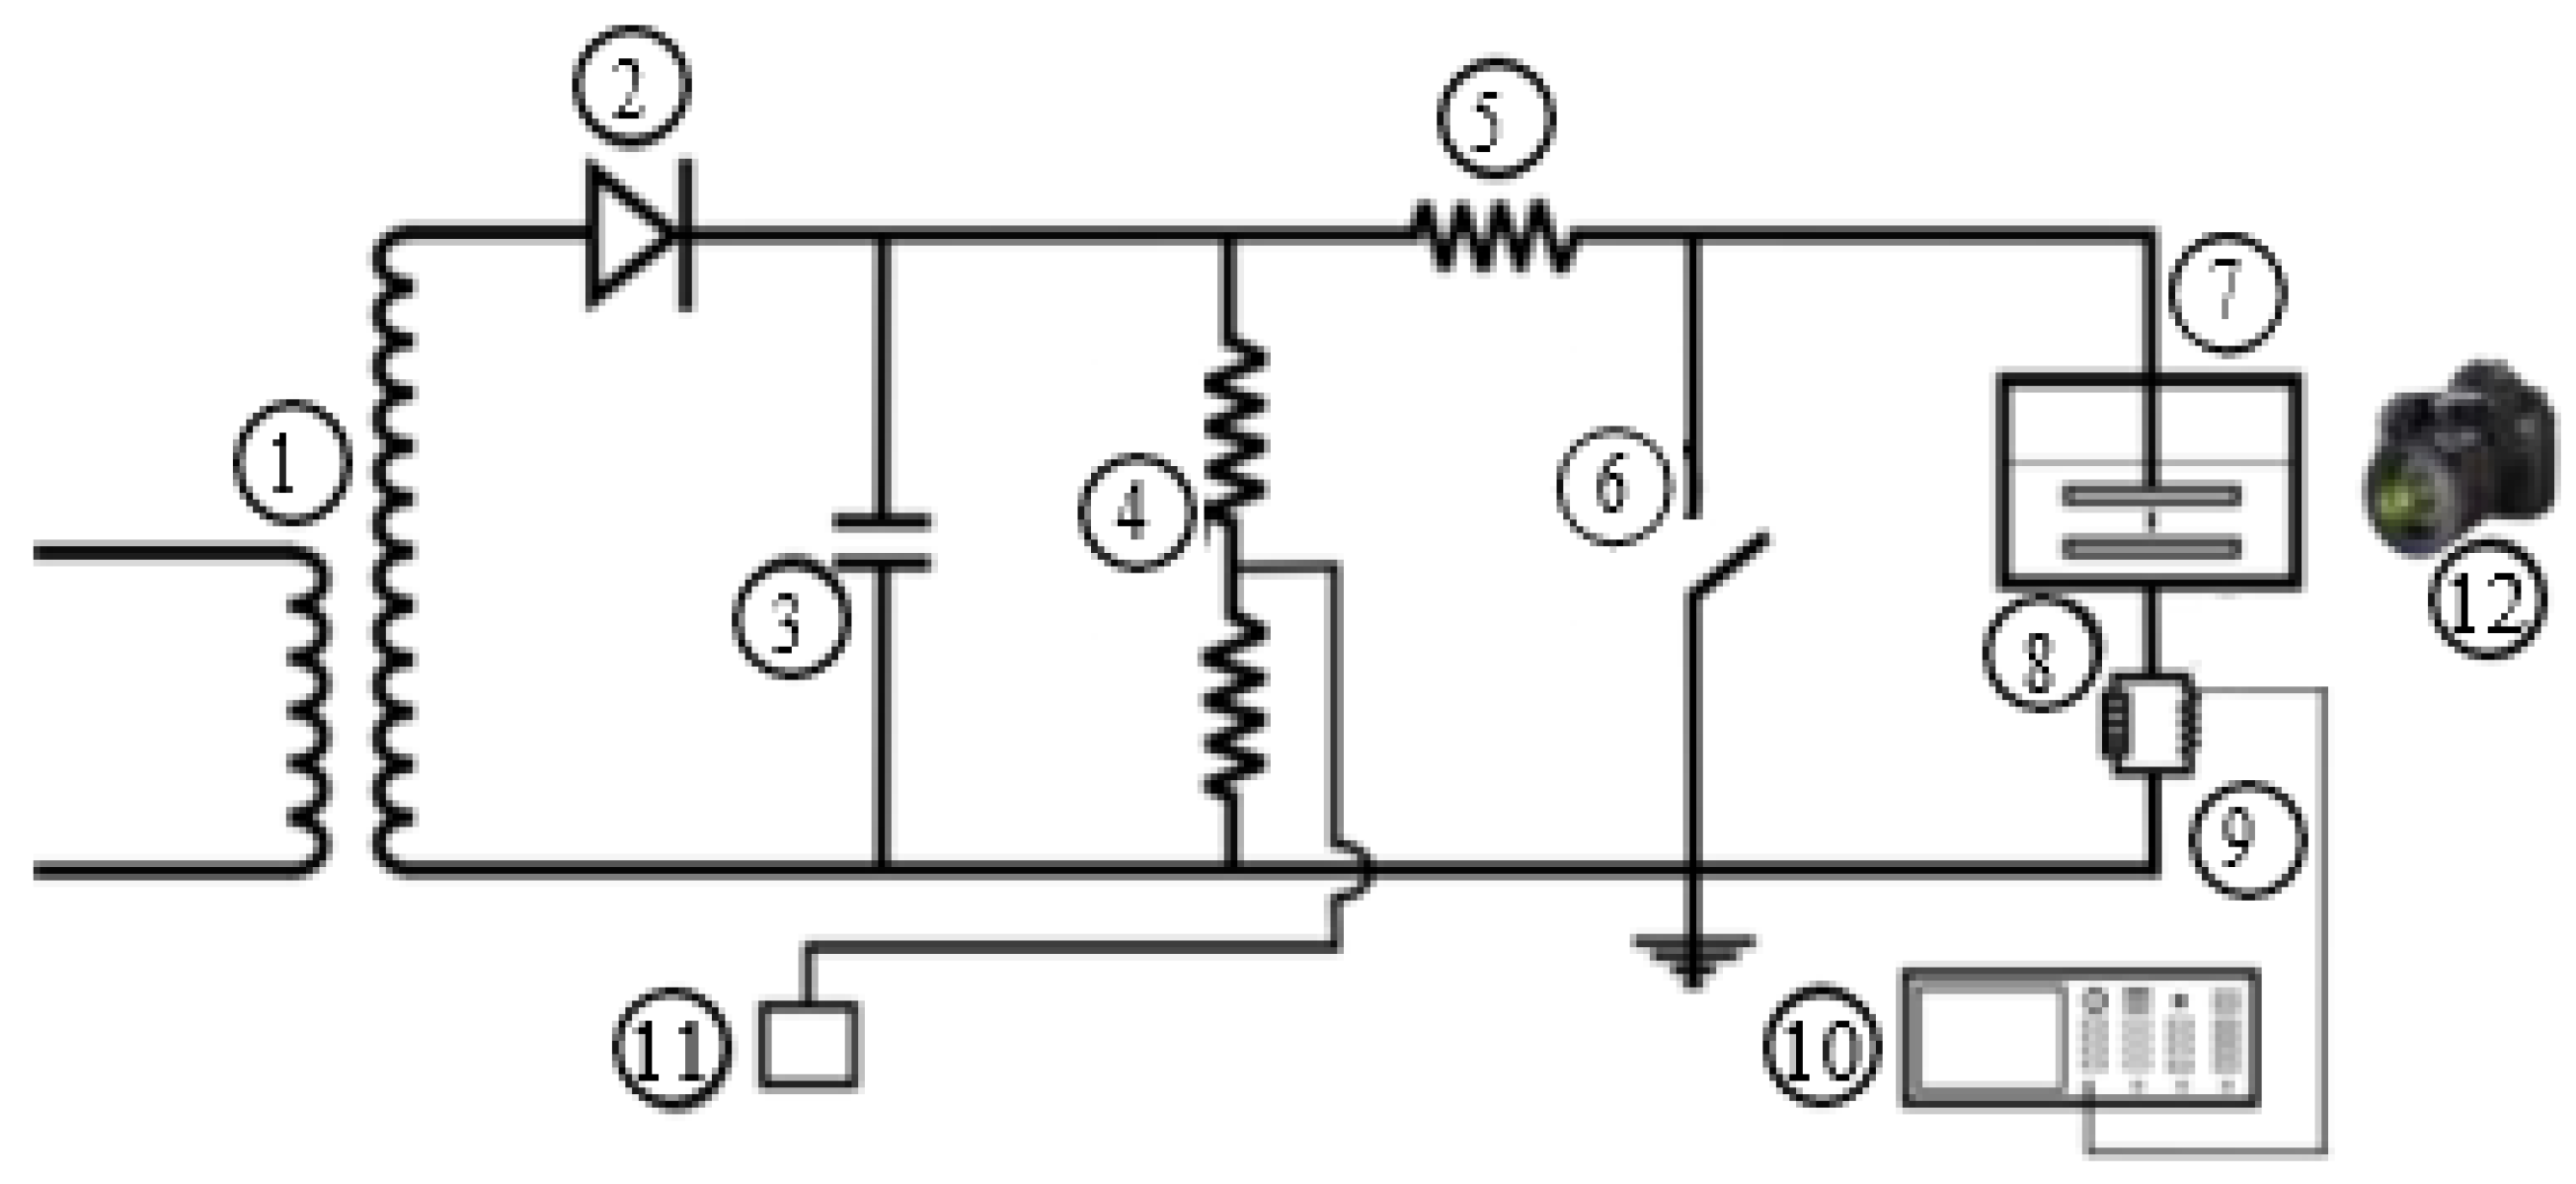
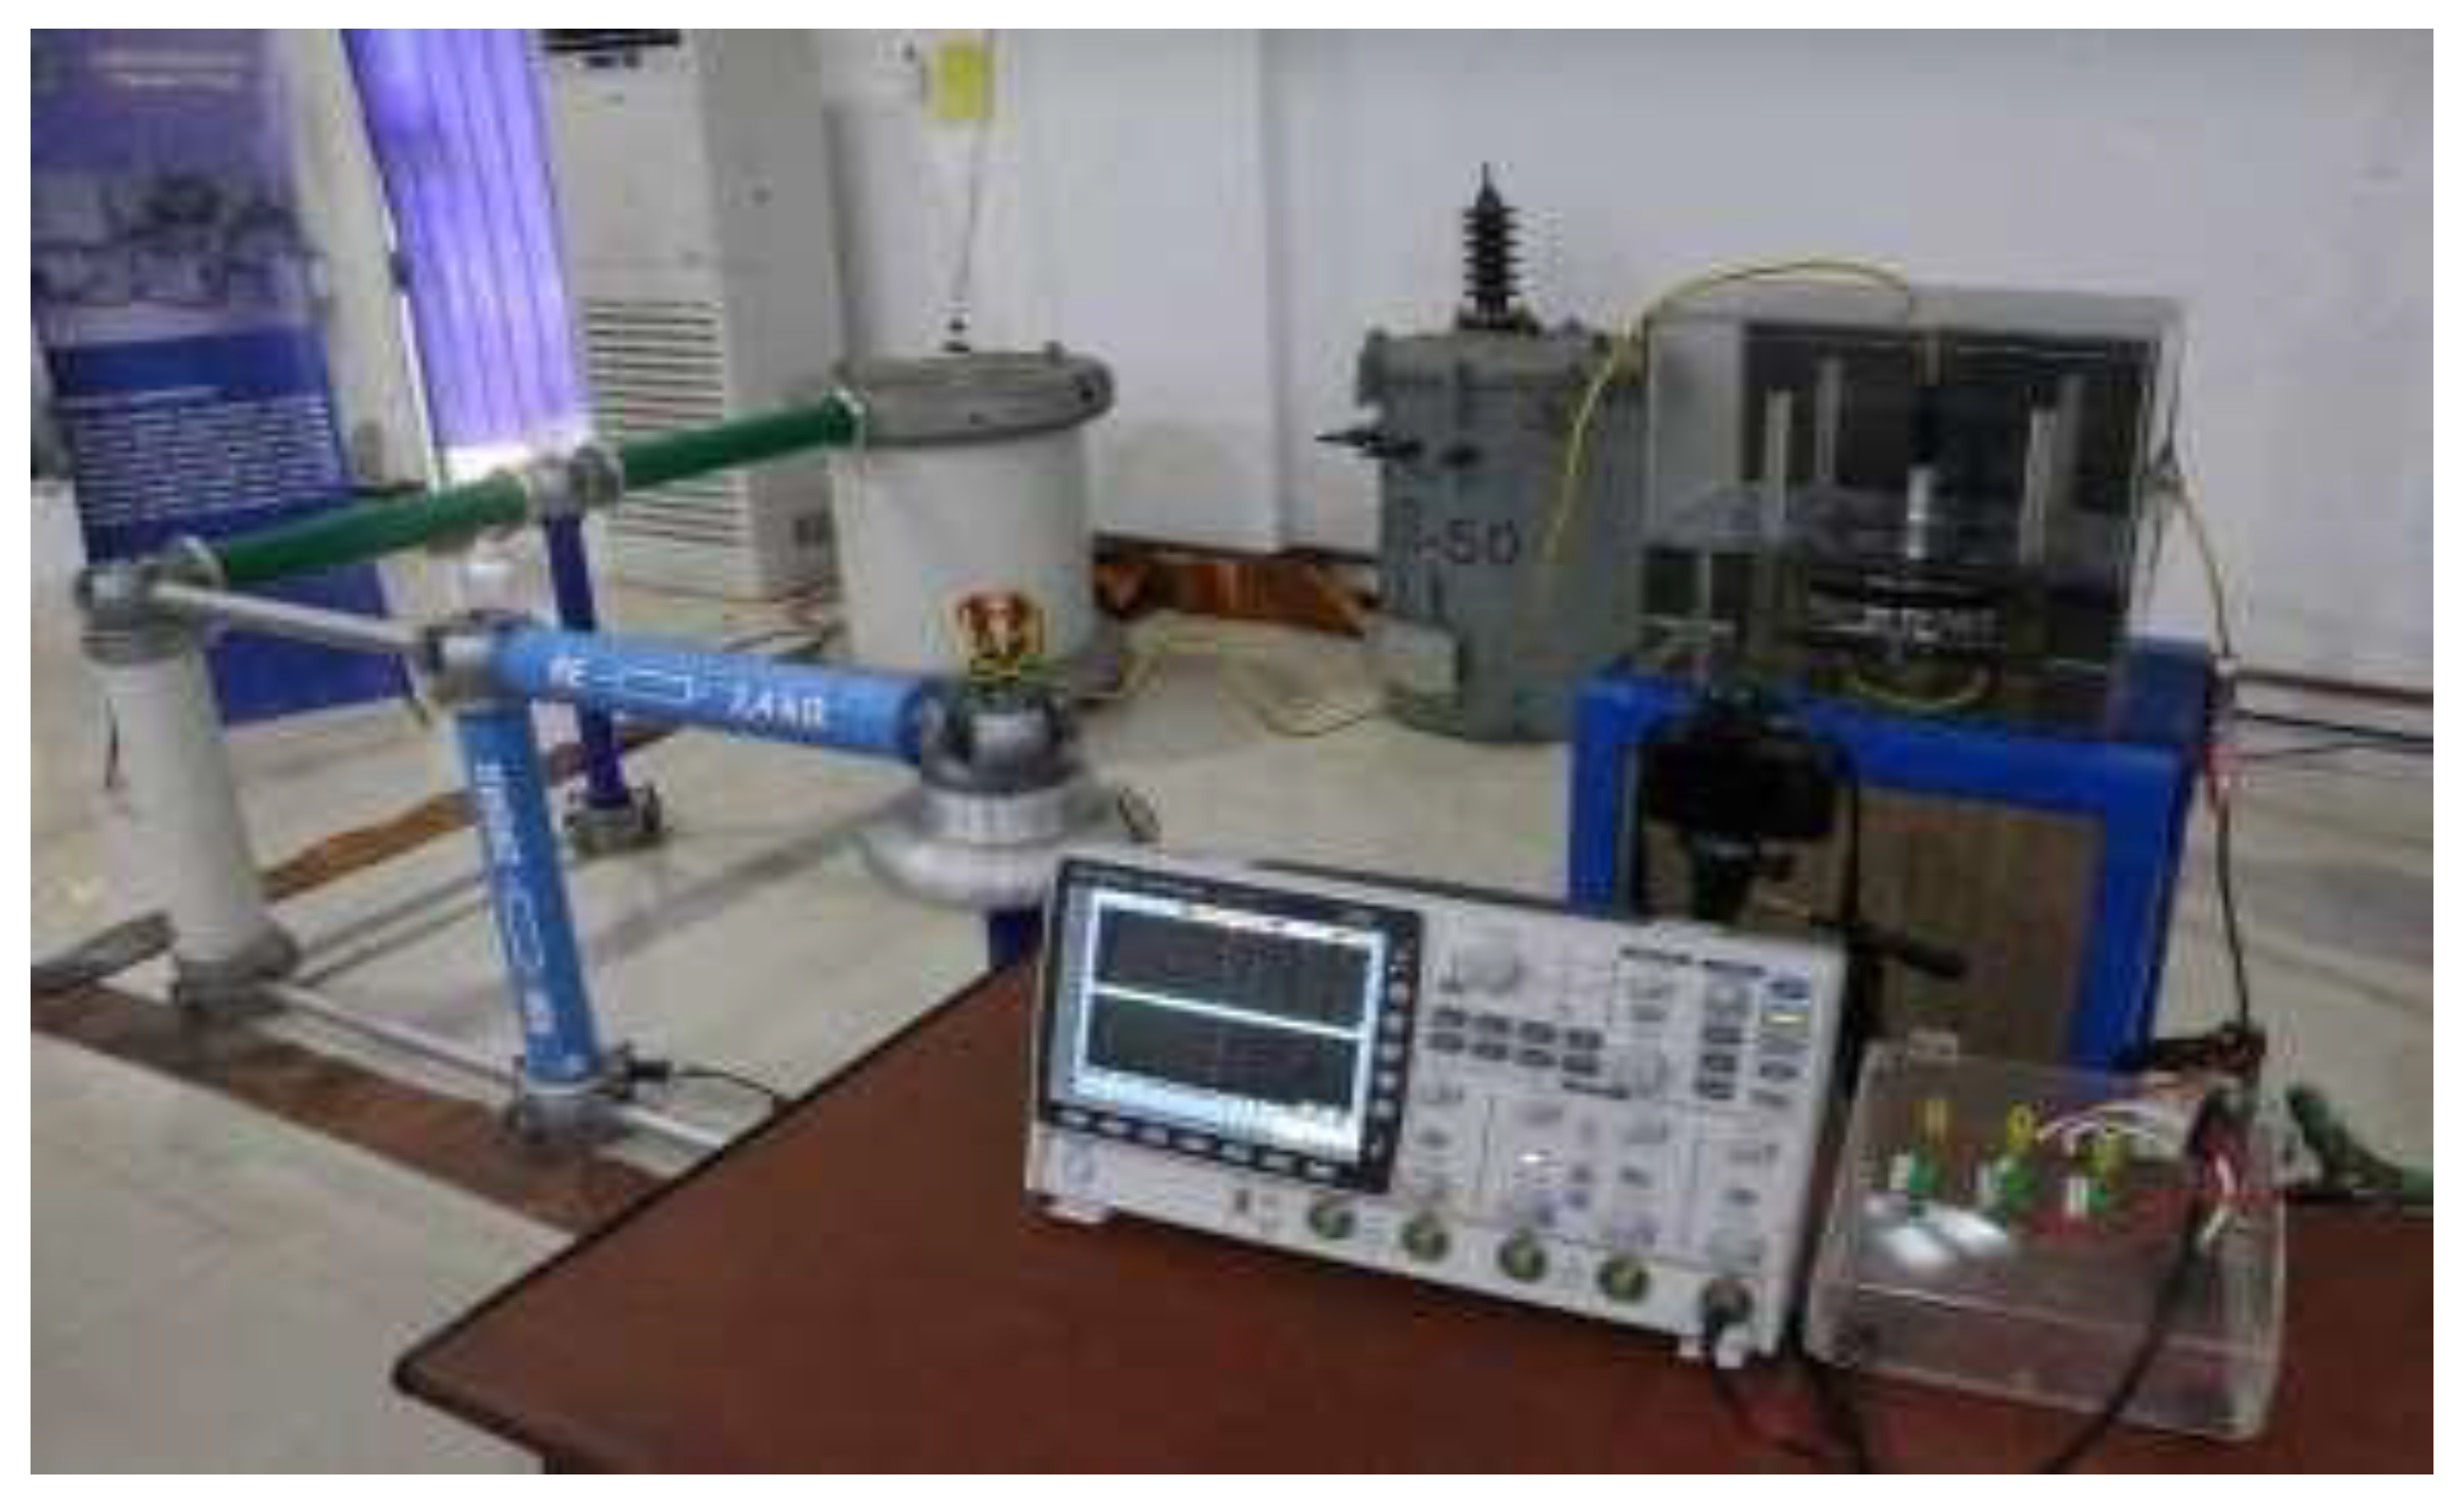
3. Experimental Setup of Oil Insulation Testing with Floating Metallic Particles

This study used a DC high voltage generator to test the effect of floating metallic particles on pre-breakdown and breakdown characteristics of transformer oil. The experiment setup was depicted in Figure 1, while its realization at the laboratory was shown in Figure 2. The test circuit consisted of a high voltage transformer (1), a diode (2), a smoothing capacitor (3), two measuring resistors (4), a damping resistor (5), a grounding switch (6), a set of the test object (7), an arrester tube (8), a resistor 56 Ω (9), an oscilloscope (10), a digital measuring instrument (11), and a camera (12). The specification for each component of the high voltage generator can be seen in Table 1.
The high voltage transformer had a ratio of 220 V/100 kV. The output voltage of the transformer was then rectified using a high voltage diode. The capacitor was used to reduce the voltage ripple, so that the DC voltage was smooth. The value of DC voltage was measured by using a resistive divider which was then acquired by the control box (digital measuring instrument). The high voltage resistor was placed between the diode and the high voltage electrode in order to limit the current.
A grounding cable was connected in series with a resistor of 56.6 Ω. Furthermore, the resistor voltage waveform was recorded by the digital oscilloscope. The corona current was then observed based on the resistor voltage. The camera was employed to obtain the corona shape caused by the floating metallic particles.
The flat electrodes were utilized to produce a uniform field, as shown in Figure 3. This dimension of the electrode was 17 cm in diameter and 2 cm in thickness. They were made of stainless steel. The metallic particles were also made of stainless steel, and their size and shape were different. The position of the floating particles were adjusted and stuck to the tip of a 2 mm thin acrylic bar. Figure 4 shows the shape of symmetrical particles with length variations of 5 mm to 8 mm, while the length of unsymmetrical particles were 10 mm.
According to IEC 156, the insulation oil testing used the electrode gap of 2.5 mm between electrodes with the breakdown voltage of 30 kV. However, in this experiment, the electrode gap was 20 mm, so that the position of particles between electrodes could easily be adjusted. In addition, the voltage stress was increased by 1 kV/s.
The tested oil was Diala Shell mineral oil which is commonly used in transformers. The 20 L of oil transformer were placed in the box made of acrylic with dimensions of 41 cm × 31 cm × 36 cm so that the electrodes and floating metallic particles could be submerged in the tested oil.
The pre-breakdown phenomena were also photographed with a still camera, and the field distributions were simulated based on finite element method (FEM). In this simulation, the electrode parameters were modeled, such as distance, type, and shape.
The simulation model was constructed on a 2D domain. To calculate electric field distribution, the proposed model utilized Gauss Law using scalar electric potential as the dependent variable as follows:
· ε 0 ε r E = 0
where E is the electric field, ε0 is permittivity of free space, and εr is relative permittivity. In this study, the relative permittivity of the oil was chosen to be 2.33 value. Then, the relation between electric field and electric potential was:
E = V
The boundary conditions of the model were described as follows:
-
Top and bottom electrode were set as terminal V0 = Vapp and ground V = 0, respectively;
-
The floating particle was assumed to have zero voltage and zero charge so total normal electric displacement field equals to zero;
-
The exterior boundaries were defined as zero charge n·(εoεrE) = 0.
Due to the nature of the problem, where the floating particle generates a non-uniform and high electric field around its tip, a fine mesh was used. Then, the model was numerically solved using a stationary solver.
The distances of floating particles were measured from the grounded electrode.

4. Result and Analysis

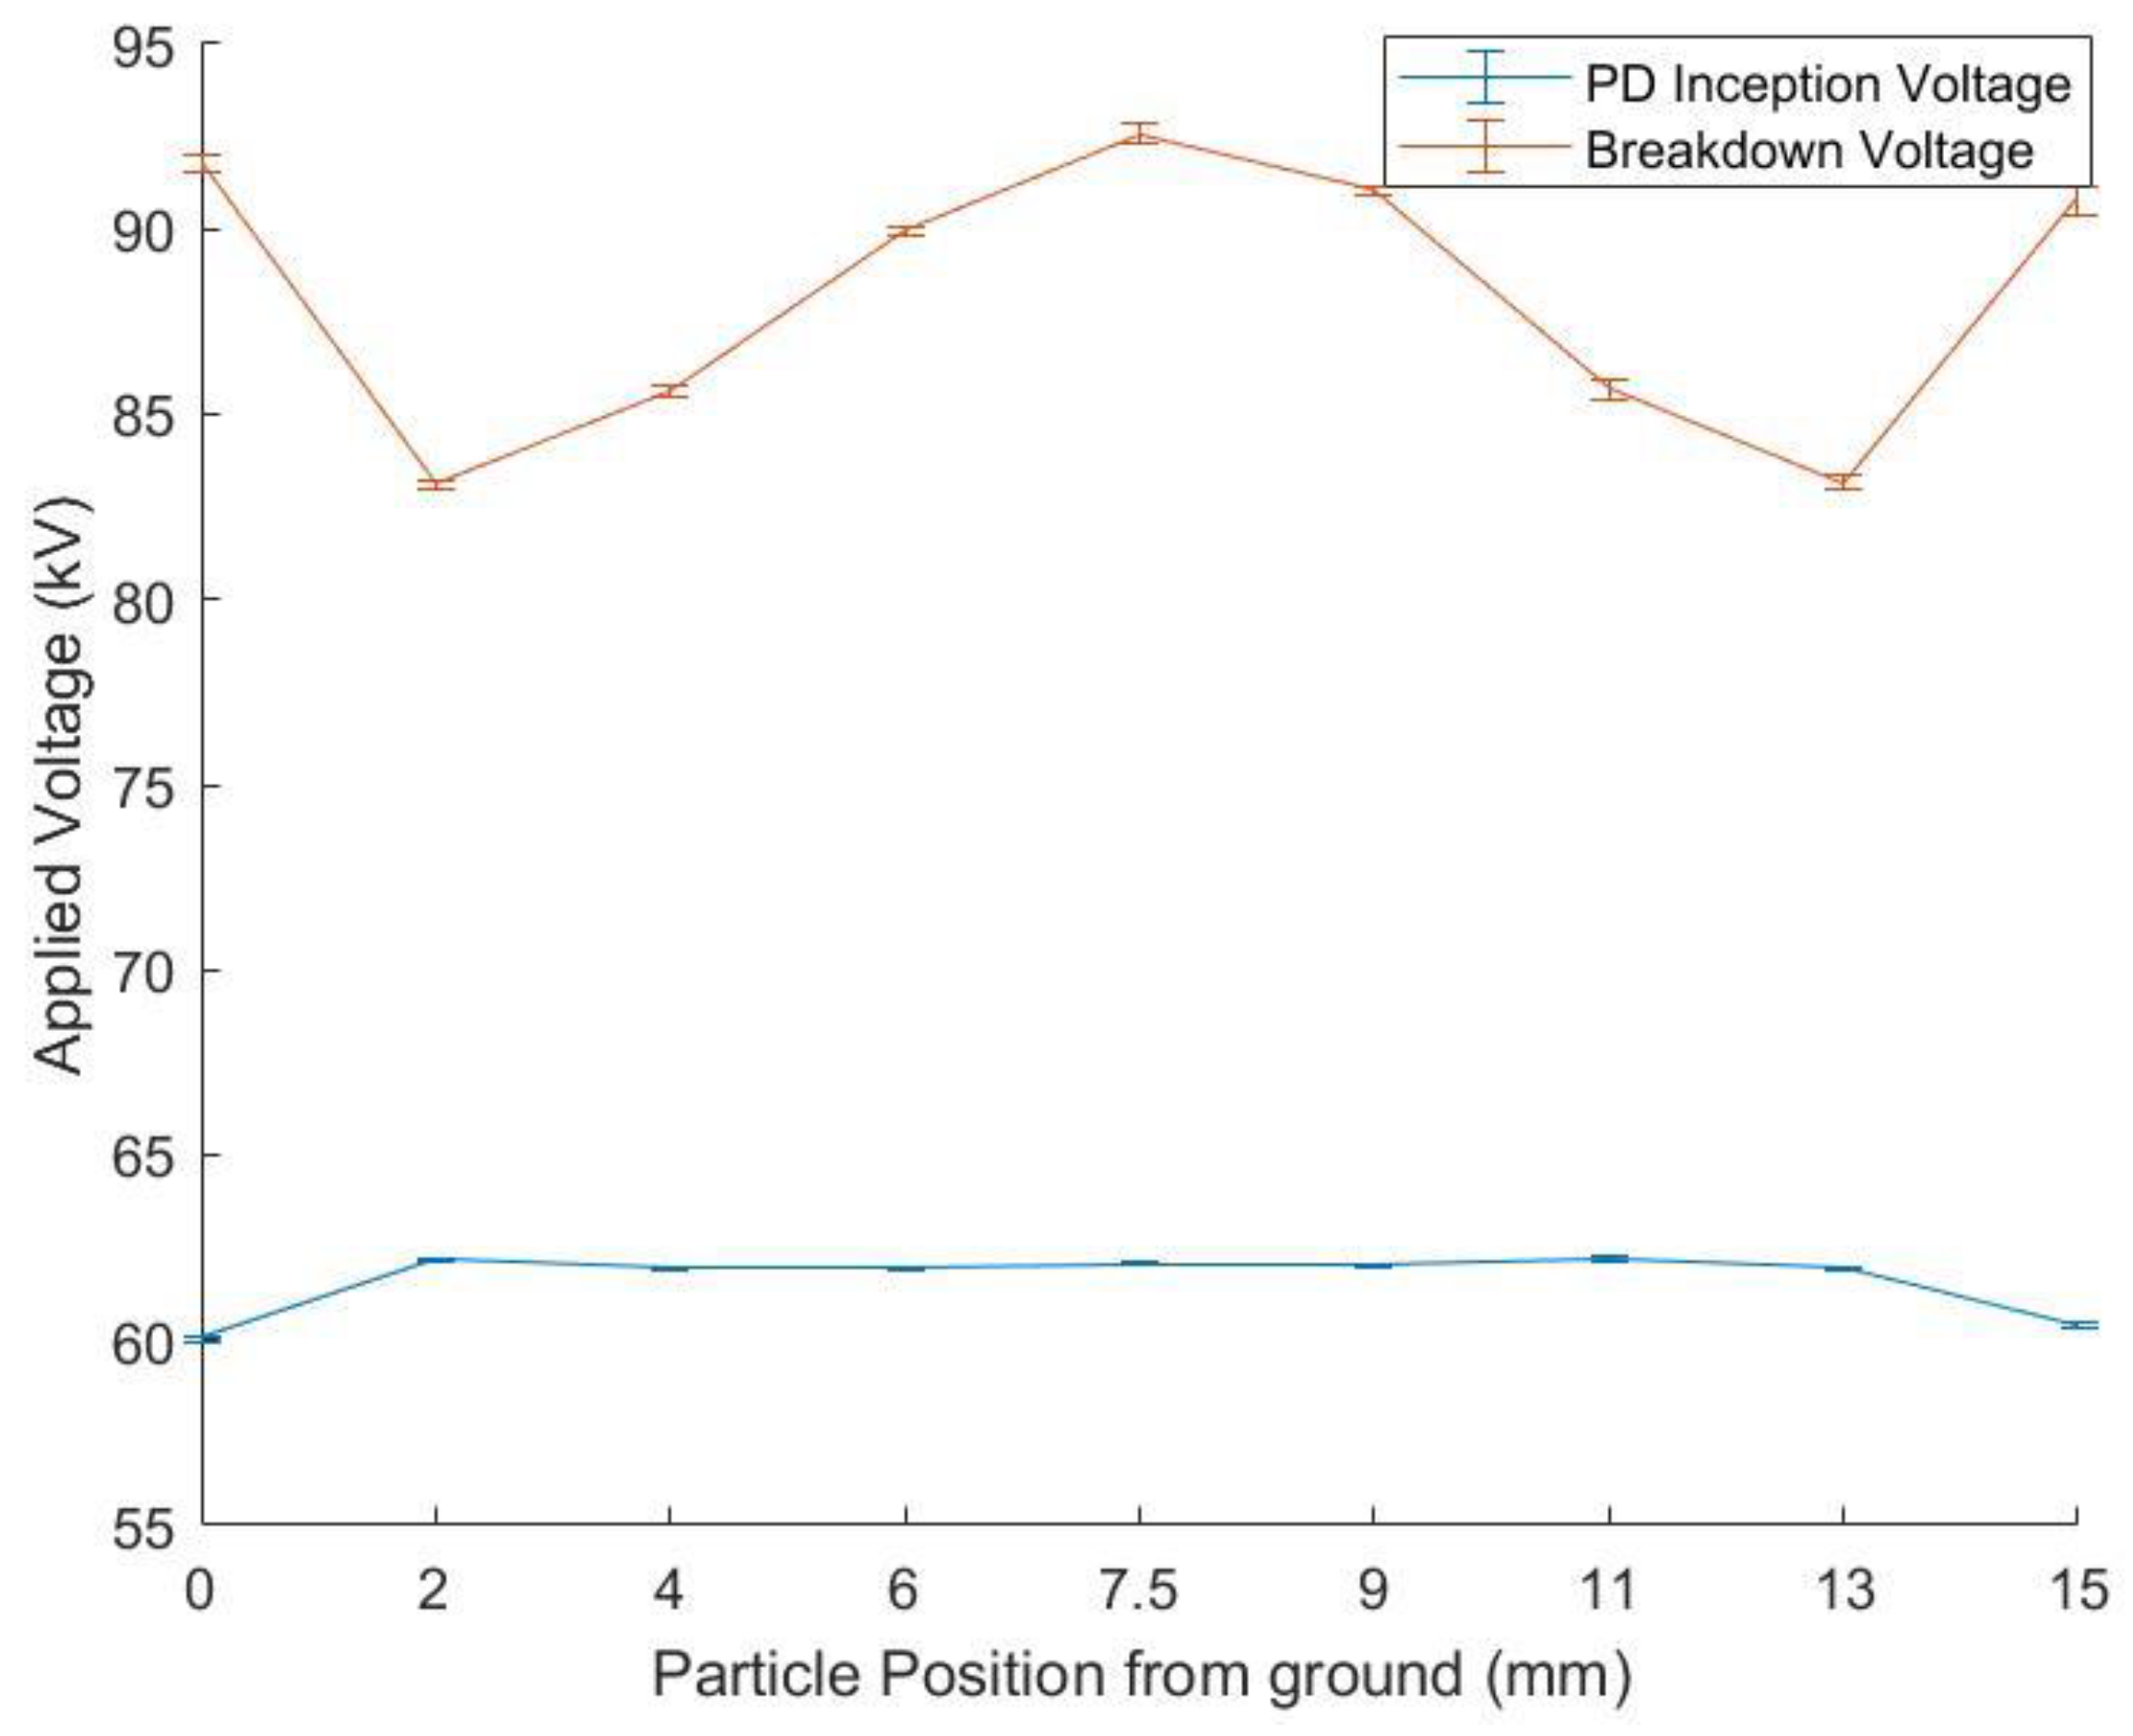
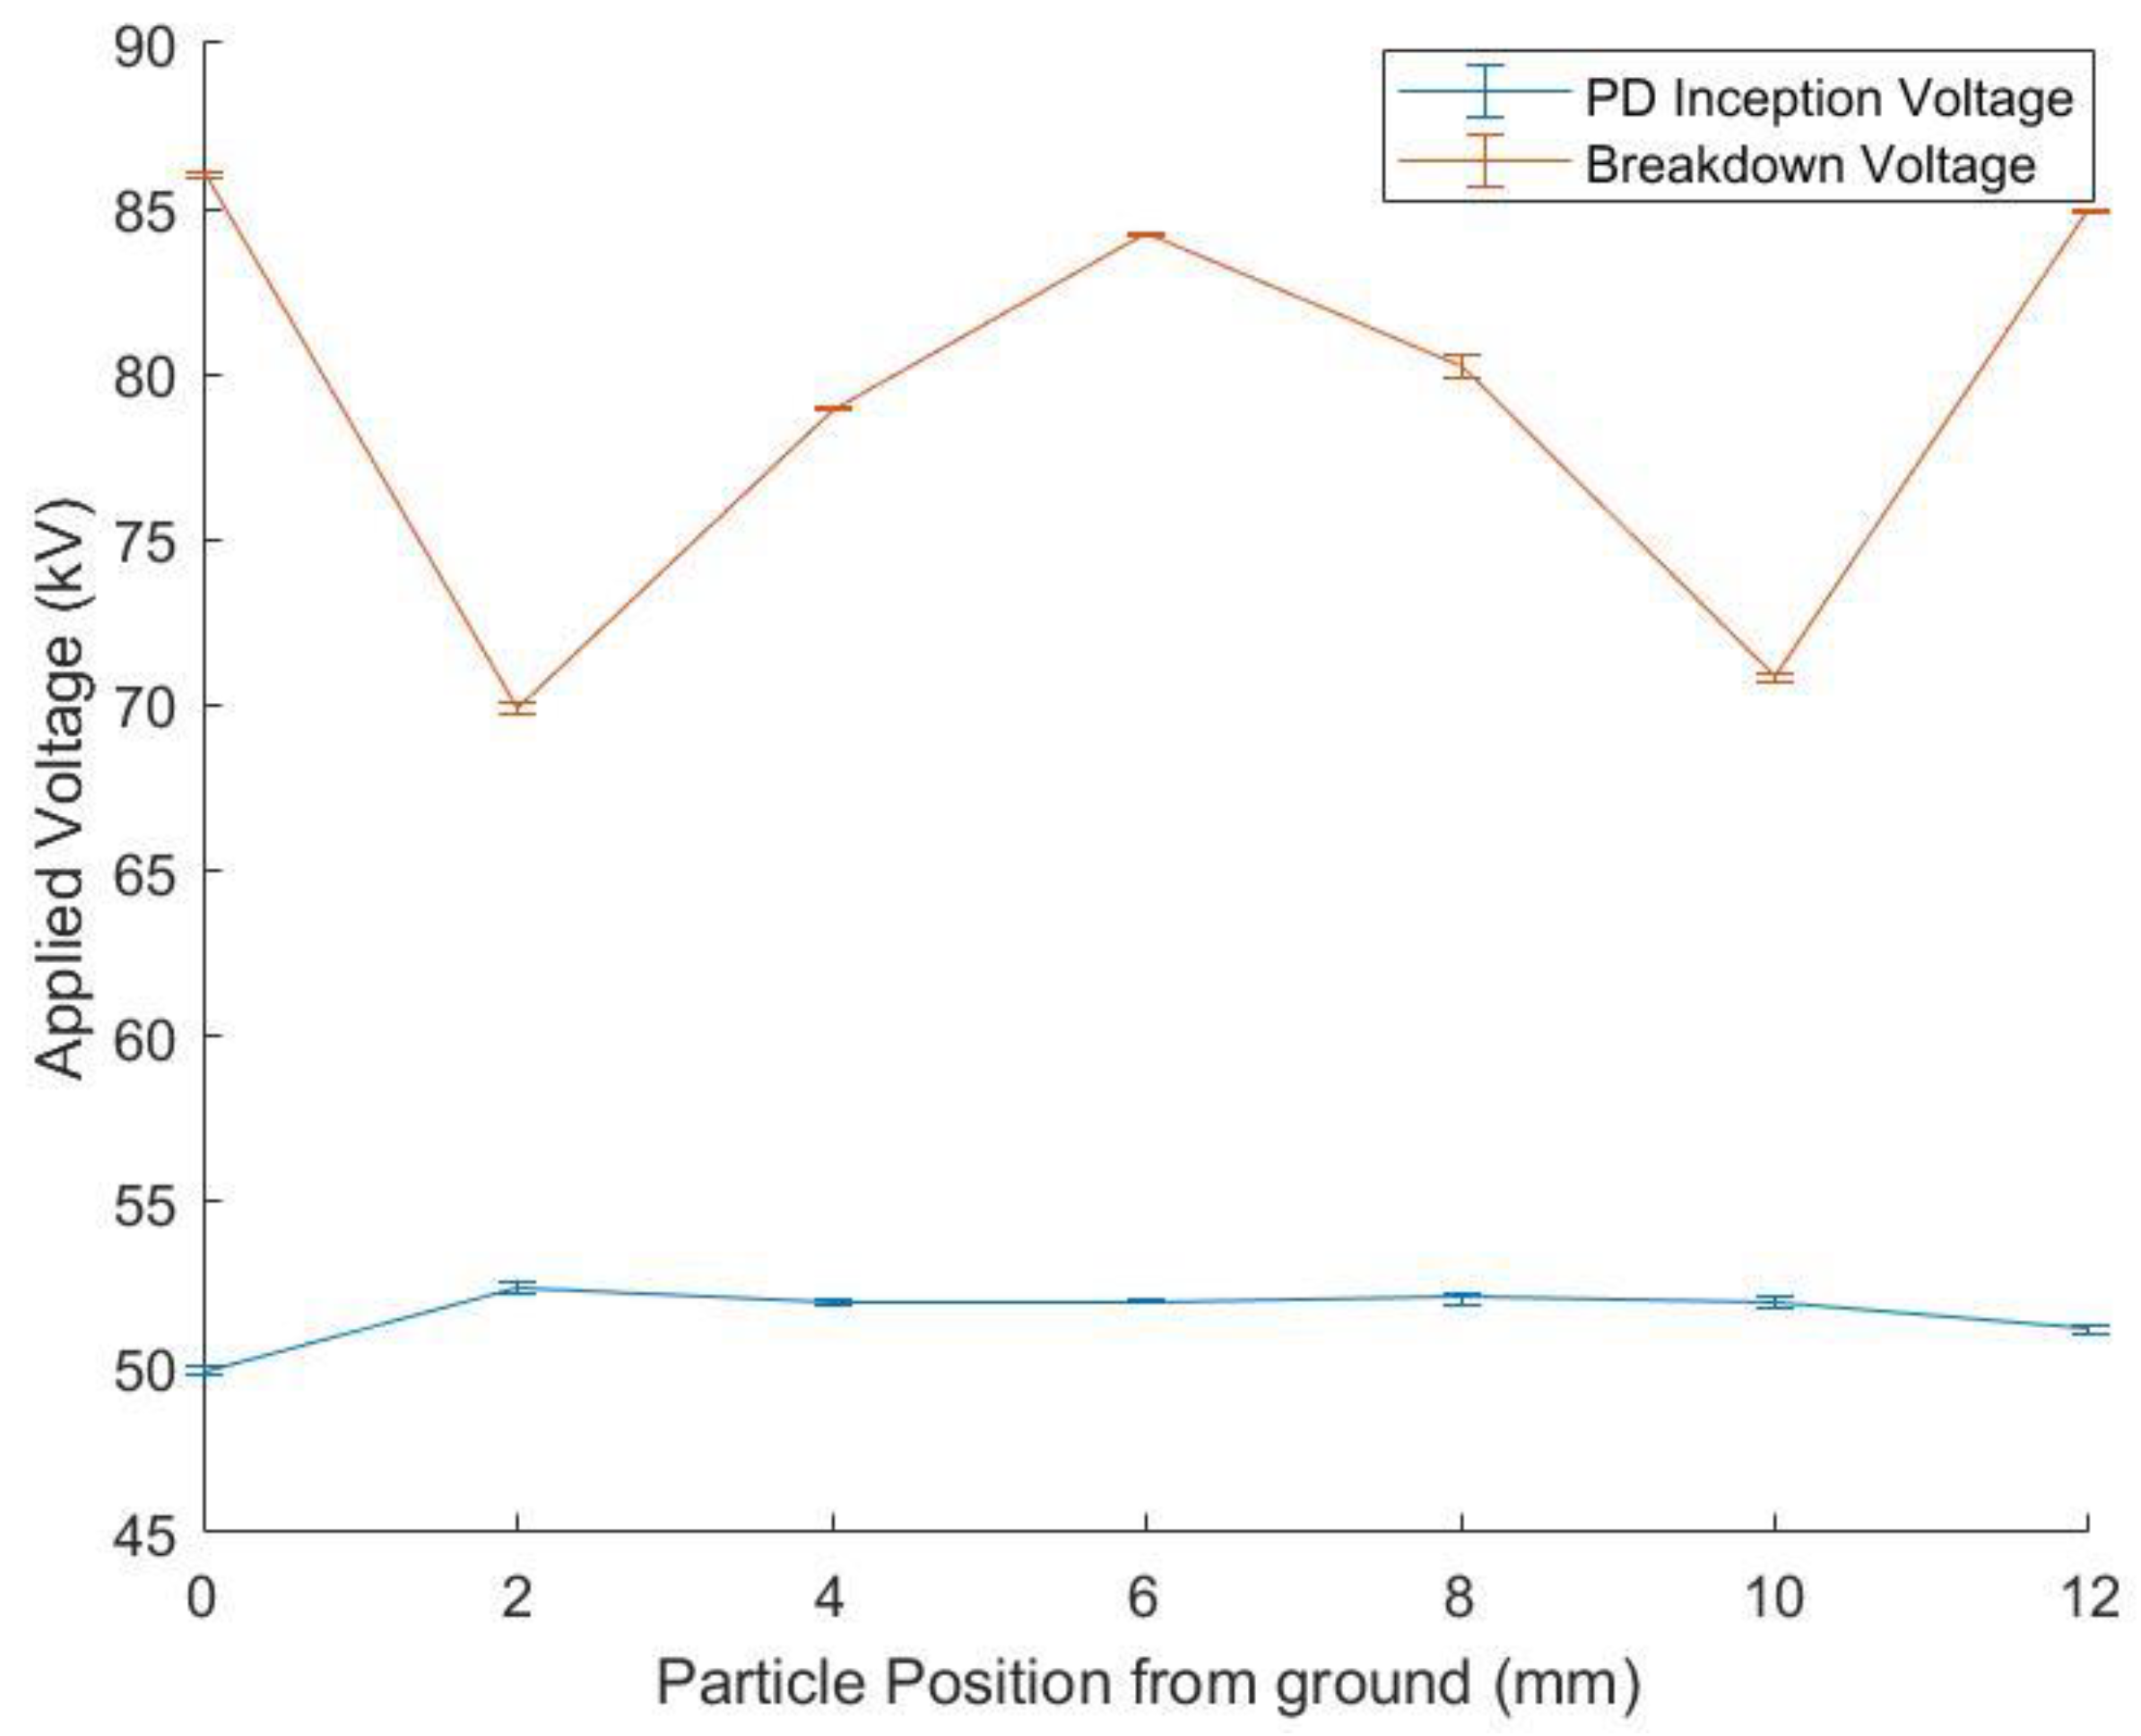
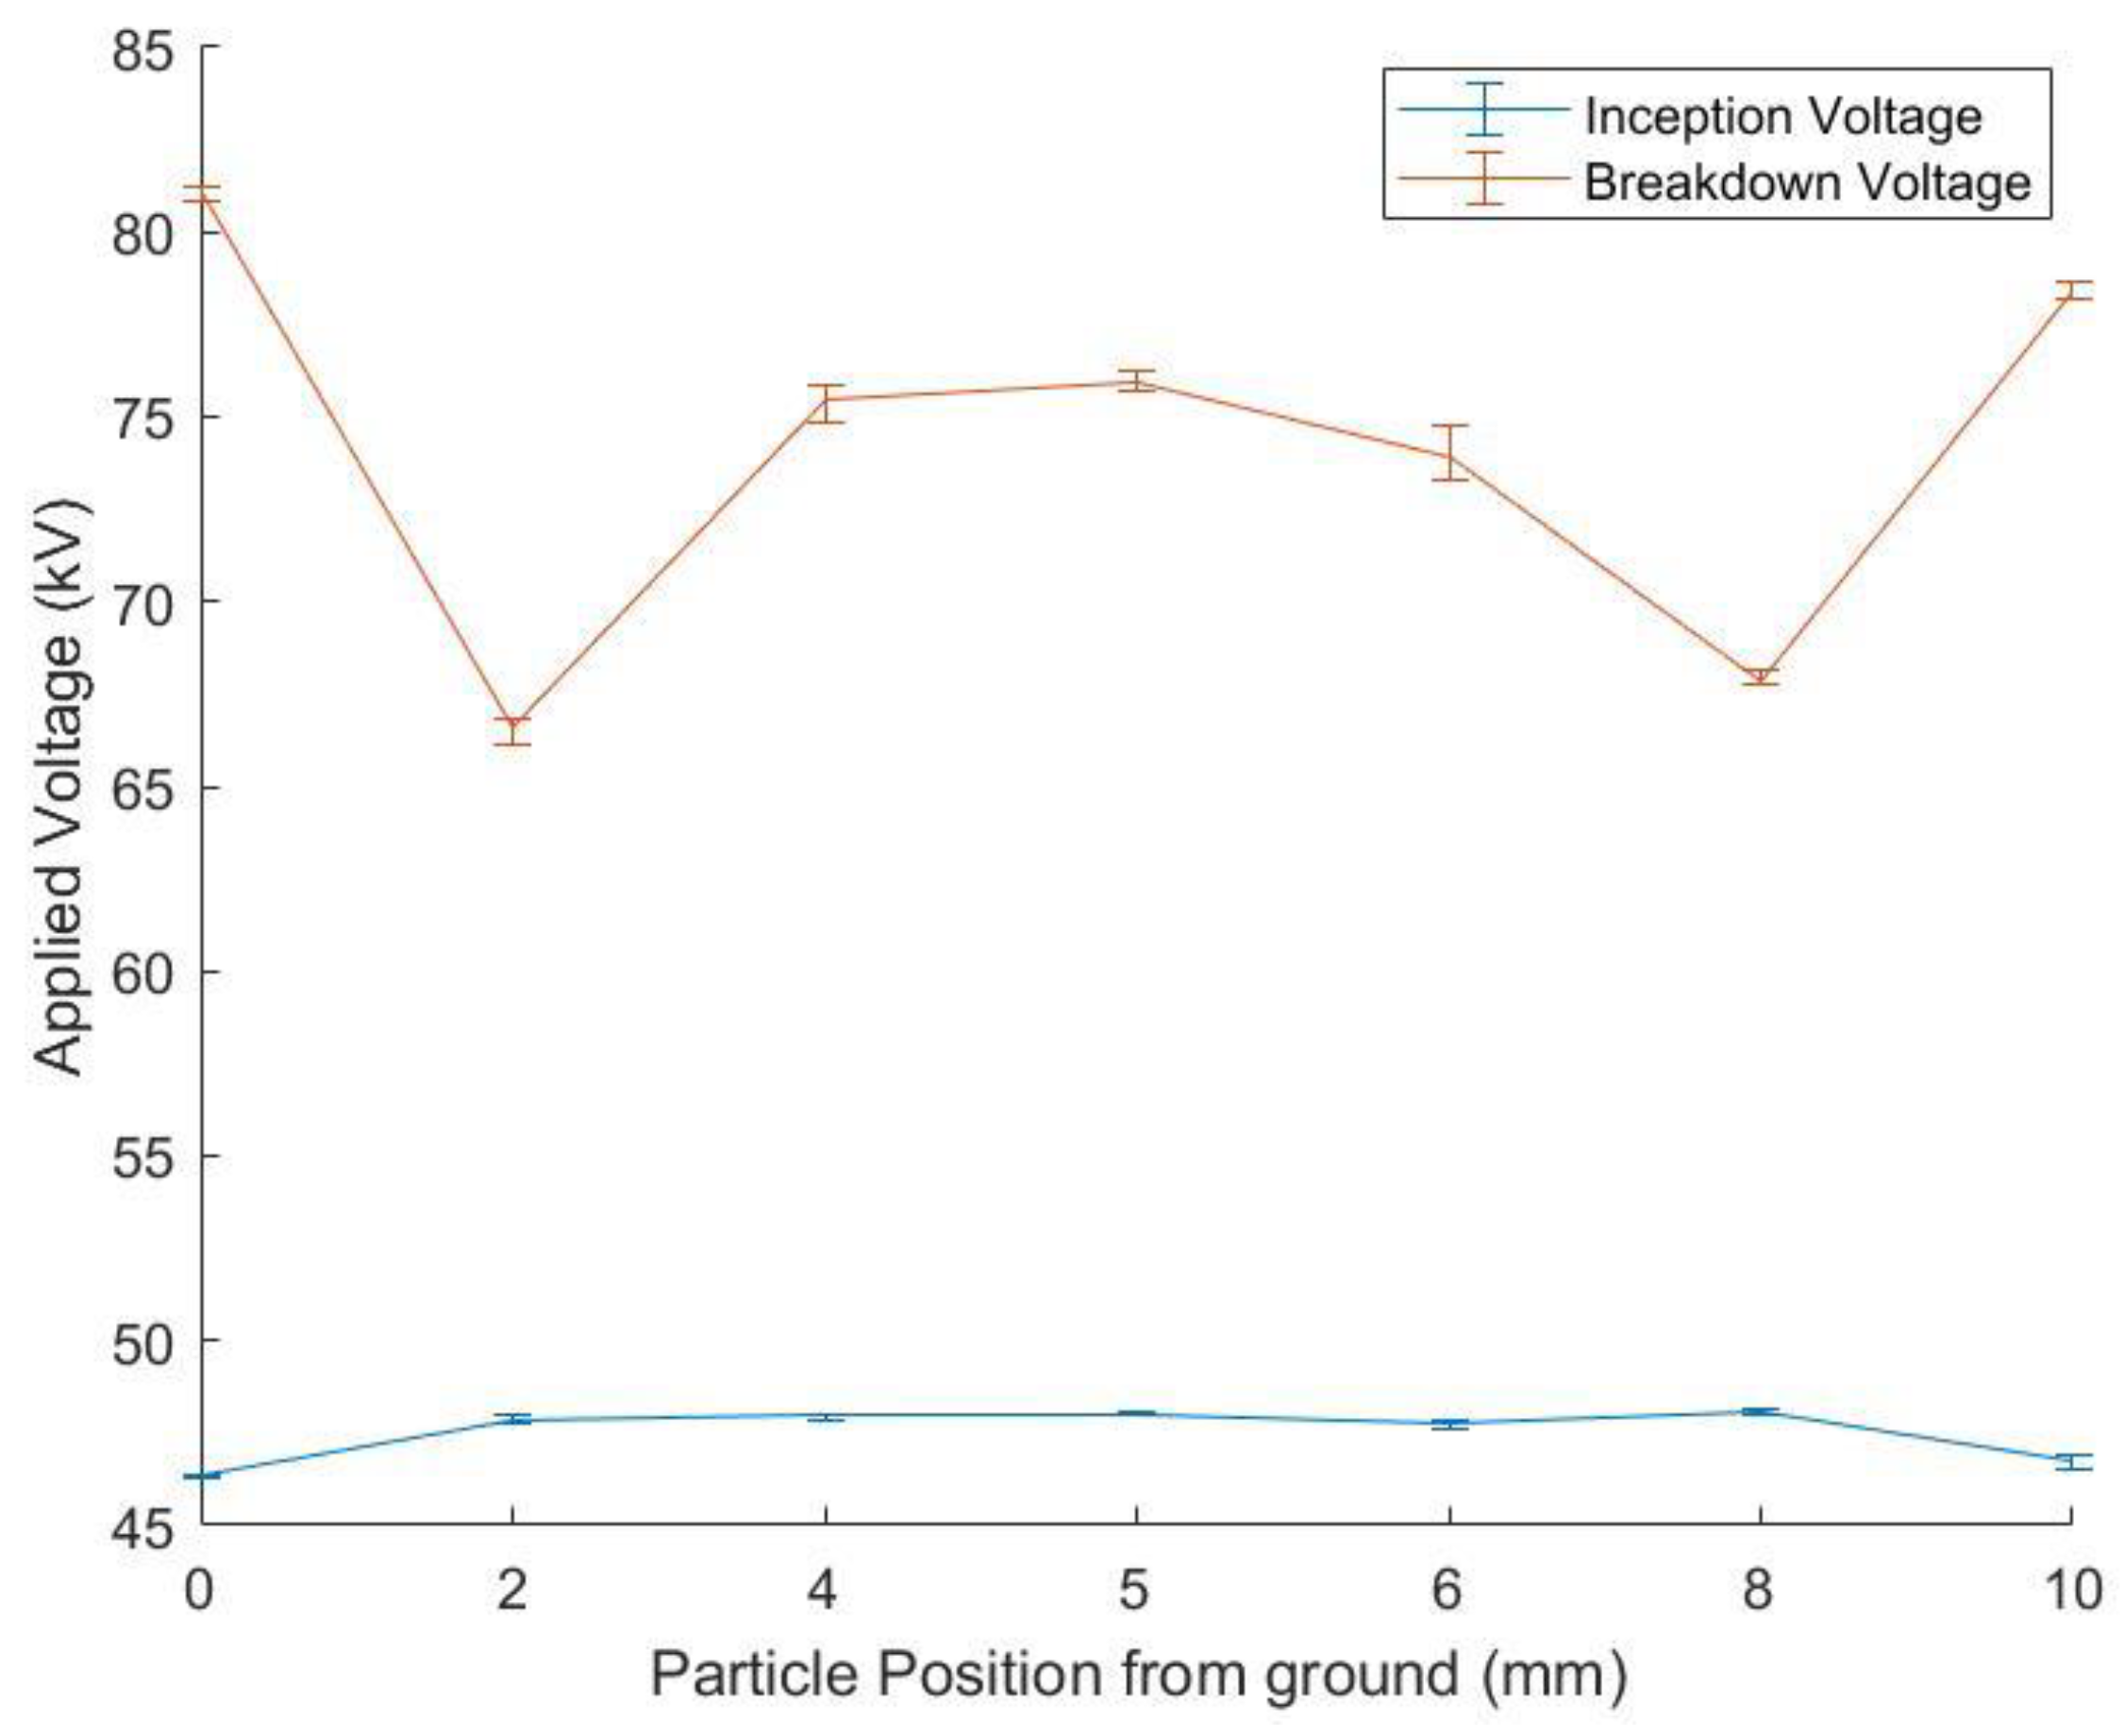
4.1. Corona Inception and Breakdown Voltage
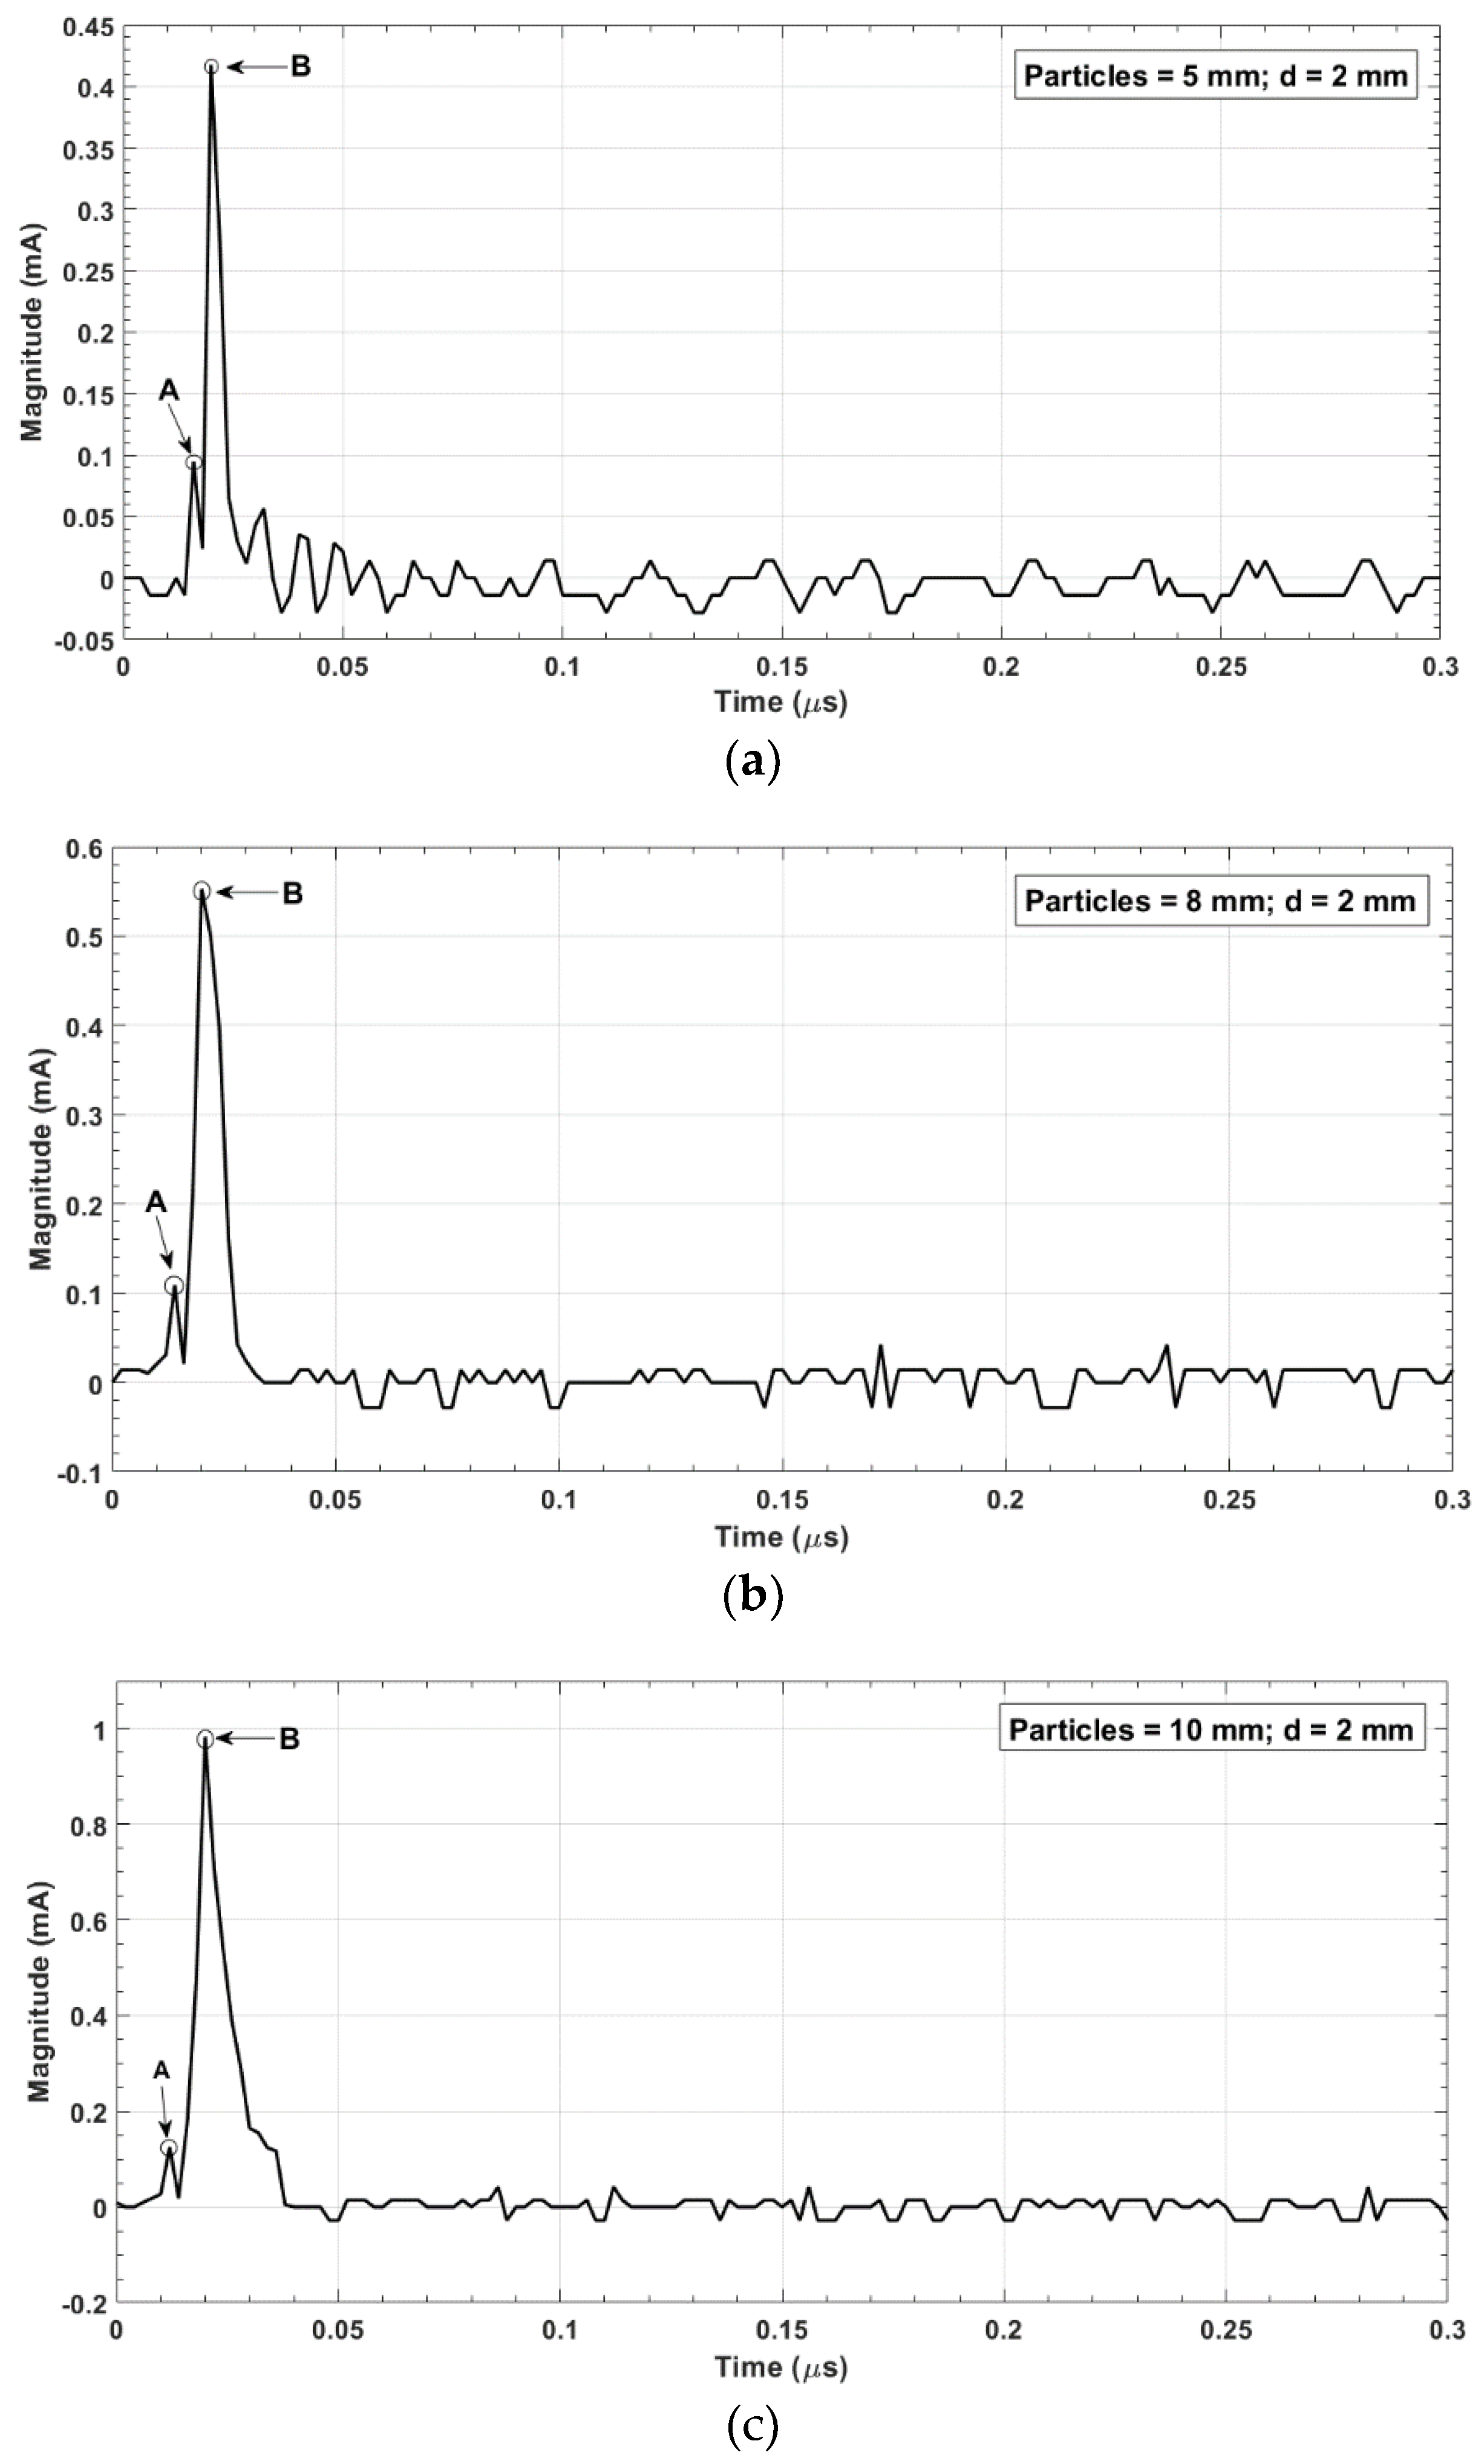
Inception voltage was defined as the voltage in which the corona current emerged first, while breakdown voltage was the voltage when the dielectric strength of oil insulation was not able to withstand the voltage stress [16].
In Figure 5, the corona inception voltage for particle size of 5 mm was 60–62 kV, whereas the breakdown voltage was 83–92 kV. The lowest value occurred when the particle touched the grounded electrode and the high voltage electrode with the values of 60.06 kV and 60.43 kV, respectively. The lowest value was obtained when the particle was near, but not touching, to the ground electrode and the high voltage electrode with the values of 83.1 kV and 83.13 kV, respectively. The highest value was achieved when the particle was in the middle of the two electrodes with a value of 92.56 kV.
Similarly, the characteristics of corona inception and breakdown voltages of particle lengths of 8 mm (symmetrical particle) and 10 mm (unsymmetrical particle) are shown in Figure 6 and Figure 7, respectively.
Generally, the lowest corona inception voltage was observed if the particle touched the electrode. On the other hand, the lowest breakdown voltage was observed if the particle was near the electrodes. Earlier studies in gaseous dielectrics observed similar characteristics of corona inception and breakdown voltages [19,20].
These phenomena might be explained as follows: as the particle close to the one of the electrodes would have a tight distance with one of the electrodes, the local arc would bridge the short gap between the electrode and the particle, as illustrated on Figure 8a. Furthermore, this local arc caused the field fluctuations, and disturbed the corona stabilization effect at the gap between the particle and the opposite electrode. This mechanism resulted in the active development of the corona discharge at the longer gap and the decreasing breakdown voltage.
When the particle floated at the middle of the electrode gap as drawn in Figure 8b, due to the interaction of bi-corona on both tips of the particle, the breakdown voltage would become higher compared to the other position of the particle in the gap. In addition, the absence of a local arc makes the corona much more stable on both tips of the particle, resulting in higher breakdown voltage.
The corona inception voltage was not affected by particle position except for the particle attached to the electrode, which behaved as a protrusion that elongated the electrode.
Regarding the particle size, the larger the particle size, the lower the inception and breakdown voltage values. Moreover, the shape of particle has a minor effect the corona inception and breakdown voltage, but affected the symmetrically of the breakdown characteristic, as shown in Figure 7.

4.2. Corona Current

The peak value of the corona current was used to determine the relationship between the particle size and the current at the corona inception voltage. The peak current for particle sizes of 5 mm was 0.39–0.46 mA, as stated in Table 2. The lowest value of 0.39 mA was at a distance of 0 mm from the grounded electrode, while the highest value of 0.469 mA was at a distance of 4 mm from the grounded electrode. The average peak value was 0.4 mA.
The experiment with a particle size of 8 mm presented the peak current of 0.54–0.63 mA, and the average value of 0.5945, as shown in Table 3. The lowest value was observed on the particle with 12 mm from the grounded electrode, while the highest value was obtained when the particle distance was 0 mm.
In Table 4, the peak current for particle size of 10 mm was 0.8513–1.047 mA, so that the average value was 0.9475 mA. The lowest and highest current value was obtained when the particle was located at 5 mm and 10 mm from the grounded electrode, respectively. The ratio of peak corona currents for all variation of particle size is shown in Table 5.
The current waveforms for the experiment with 2 mm of particle distance and various size particles were pictured in Figure 9. There were two parts, namely part A and part B. Part A was the peak of the small current before the peak of the larger current (part B). Part A was the initial current that triggered the corona current, whereas part B was the current at the inception voltage.

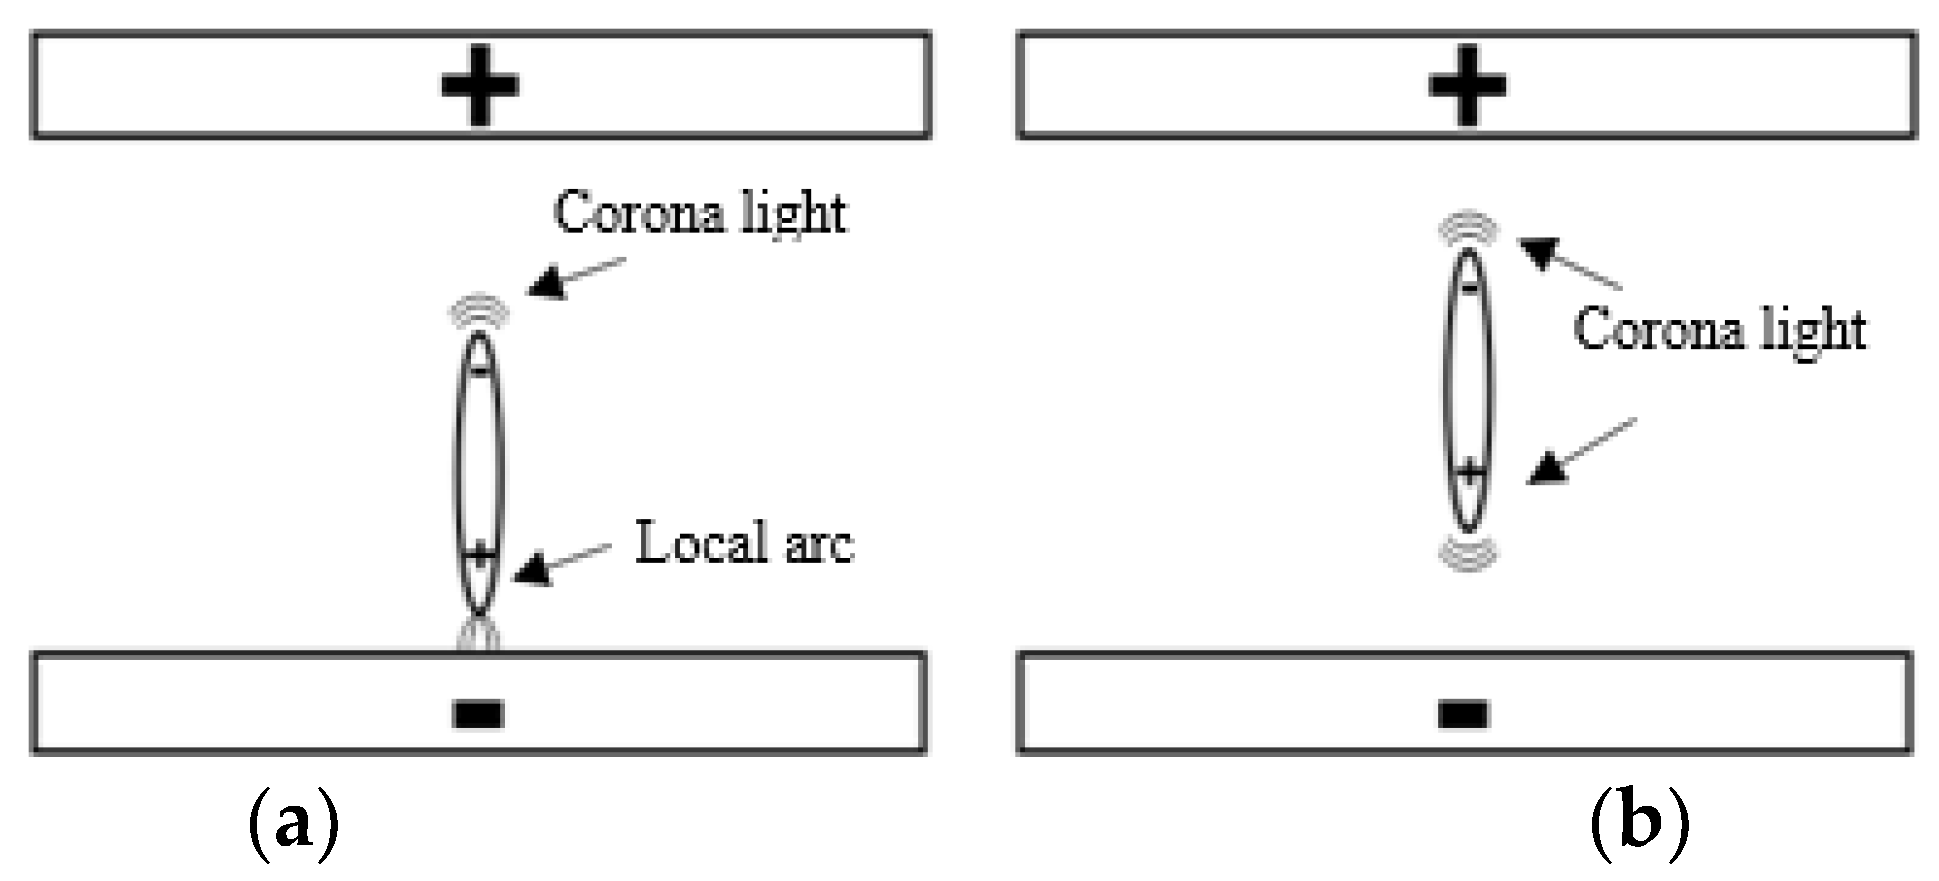
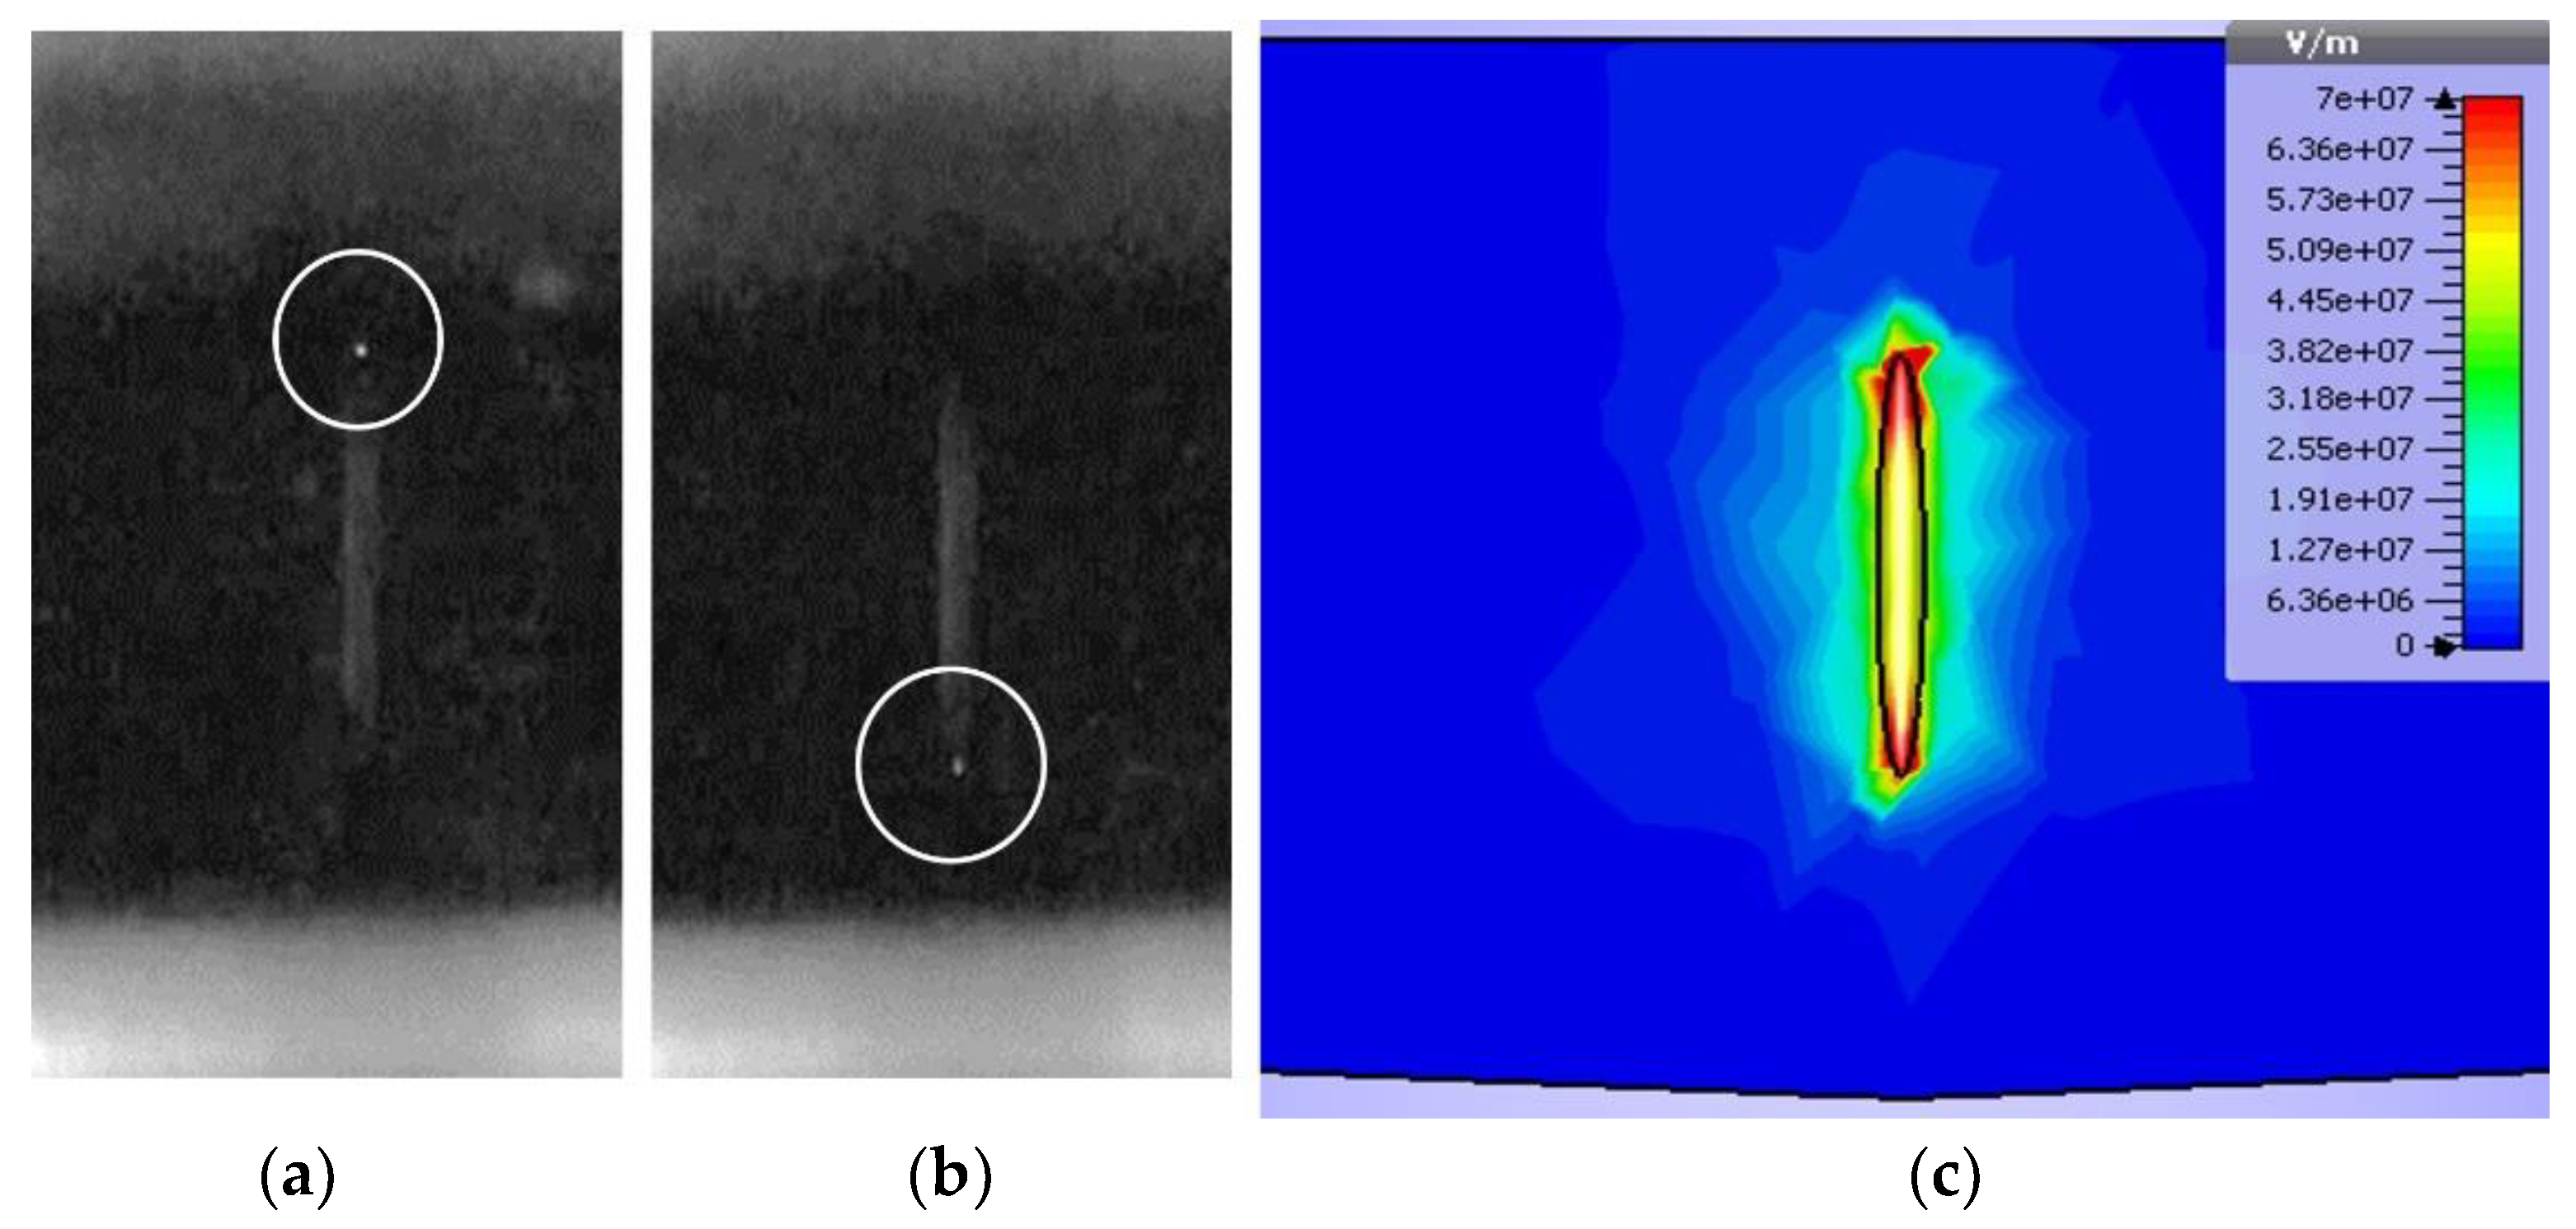
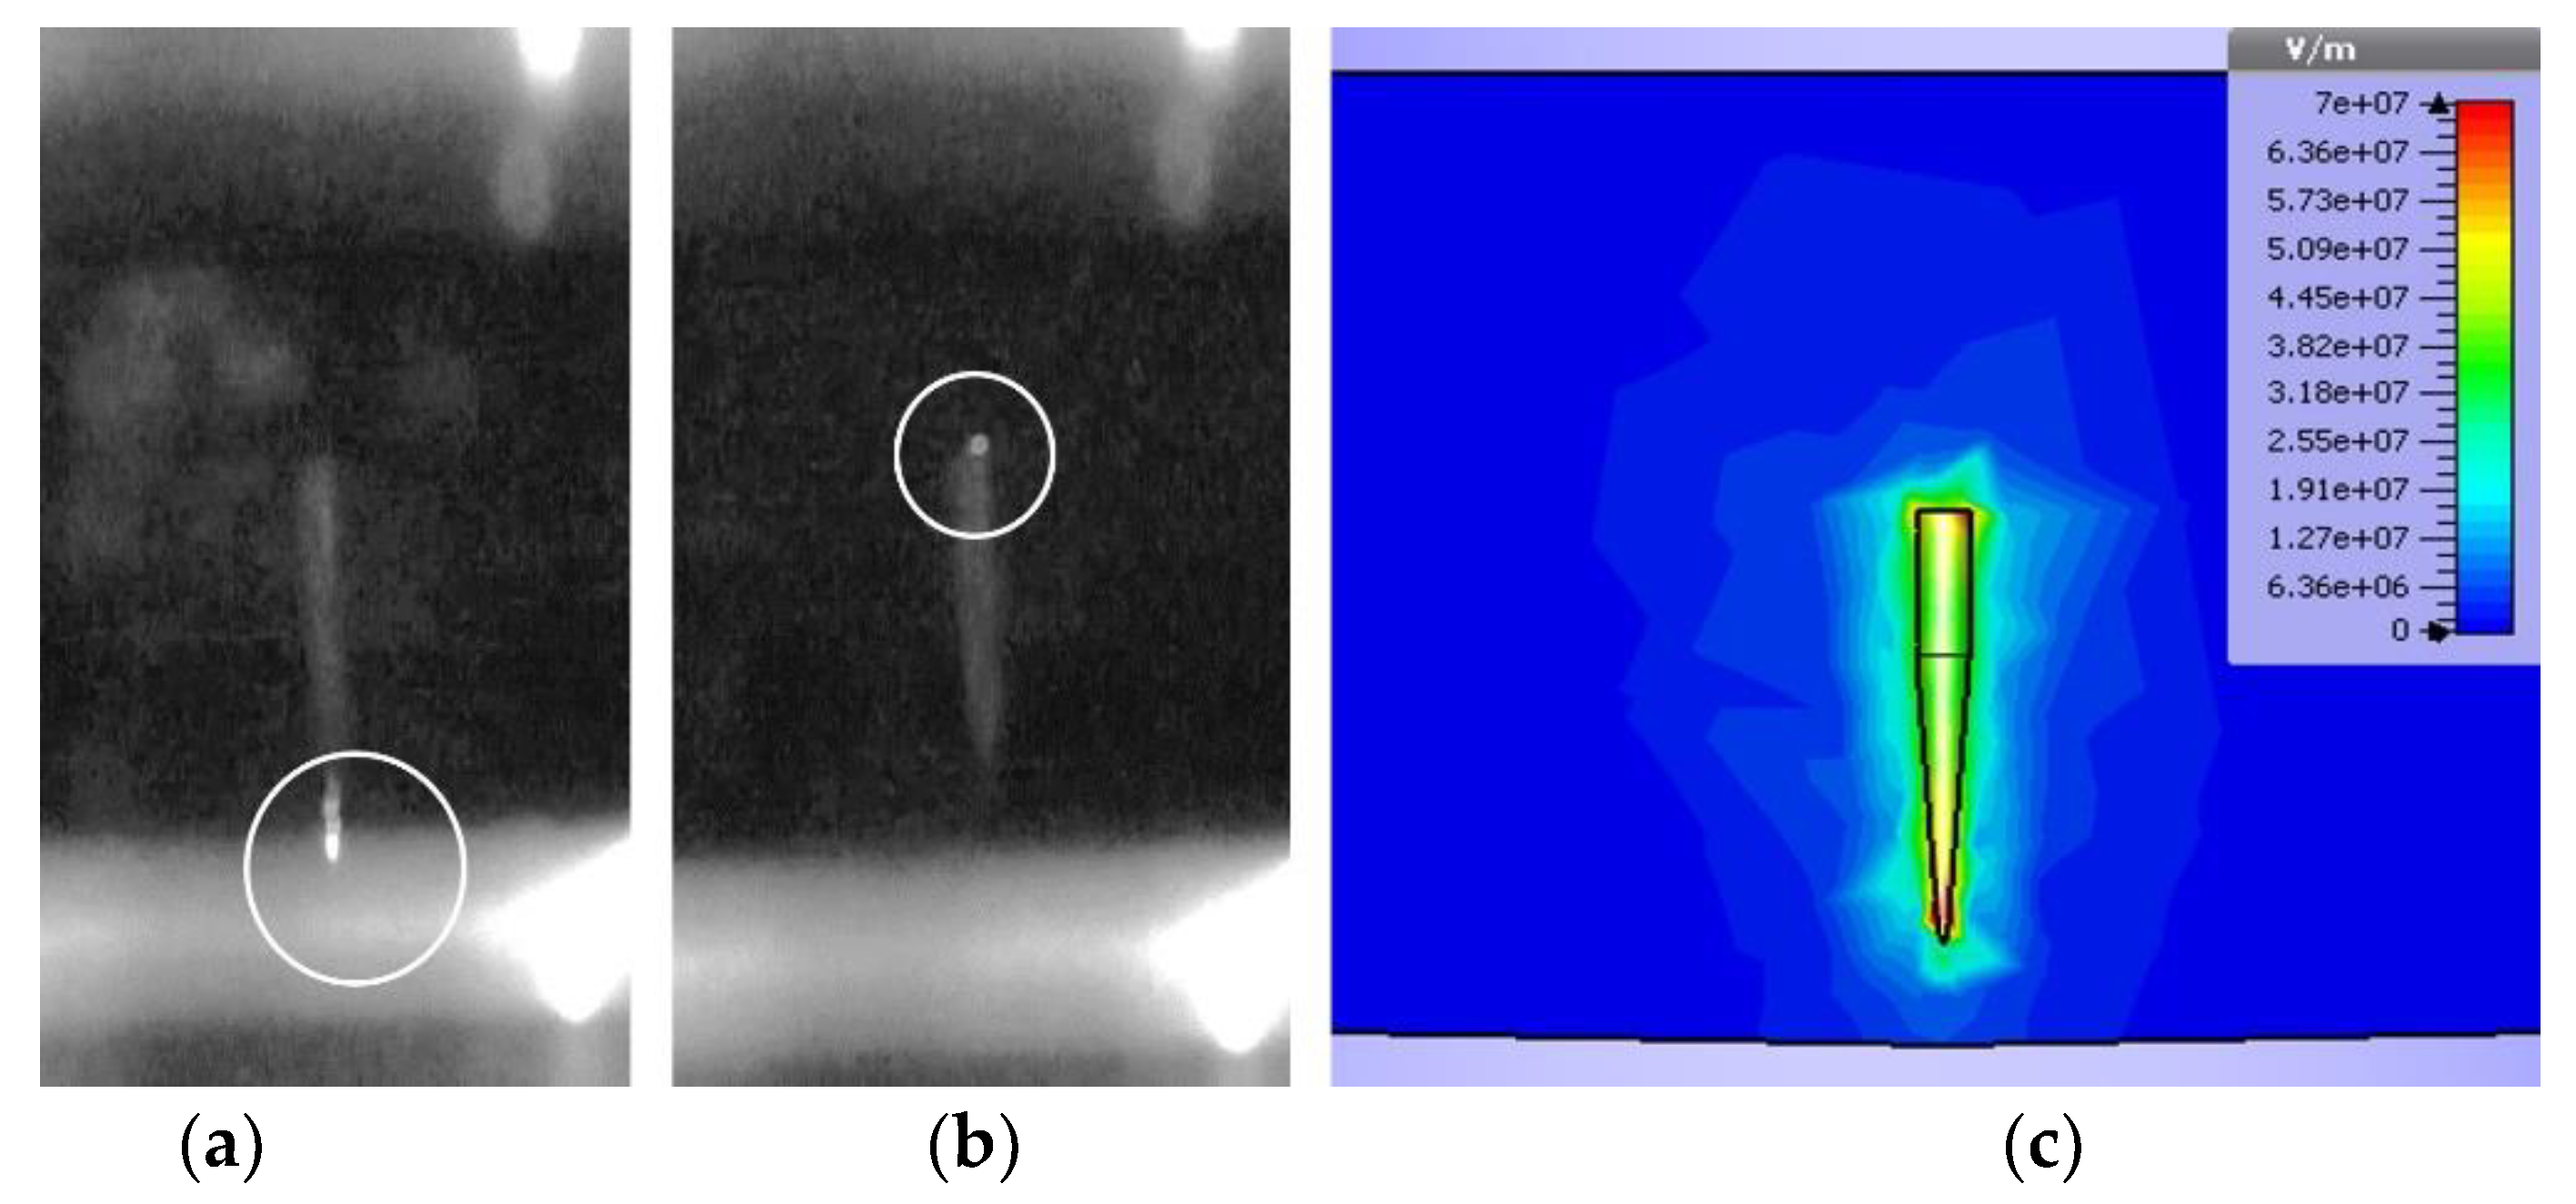
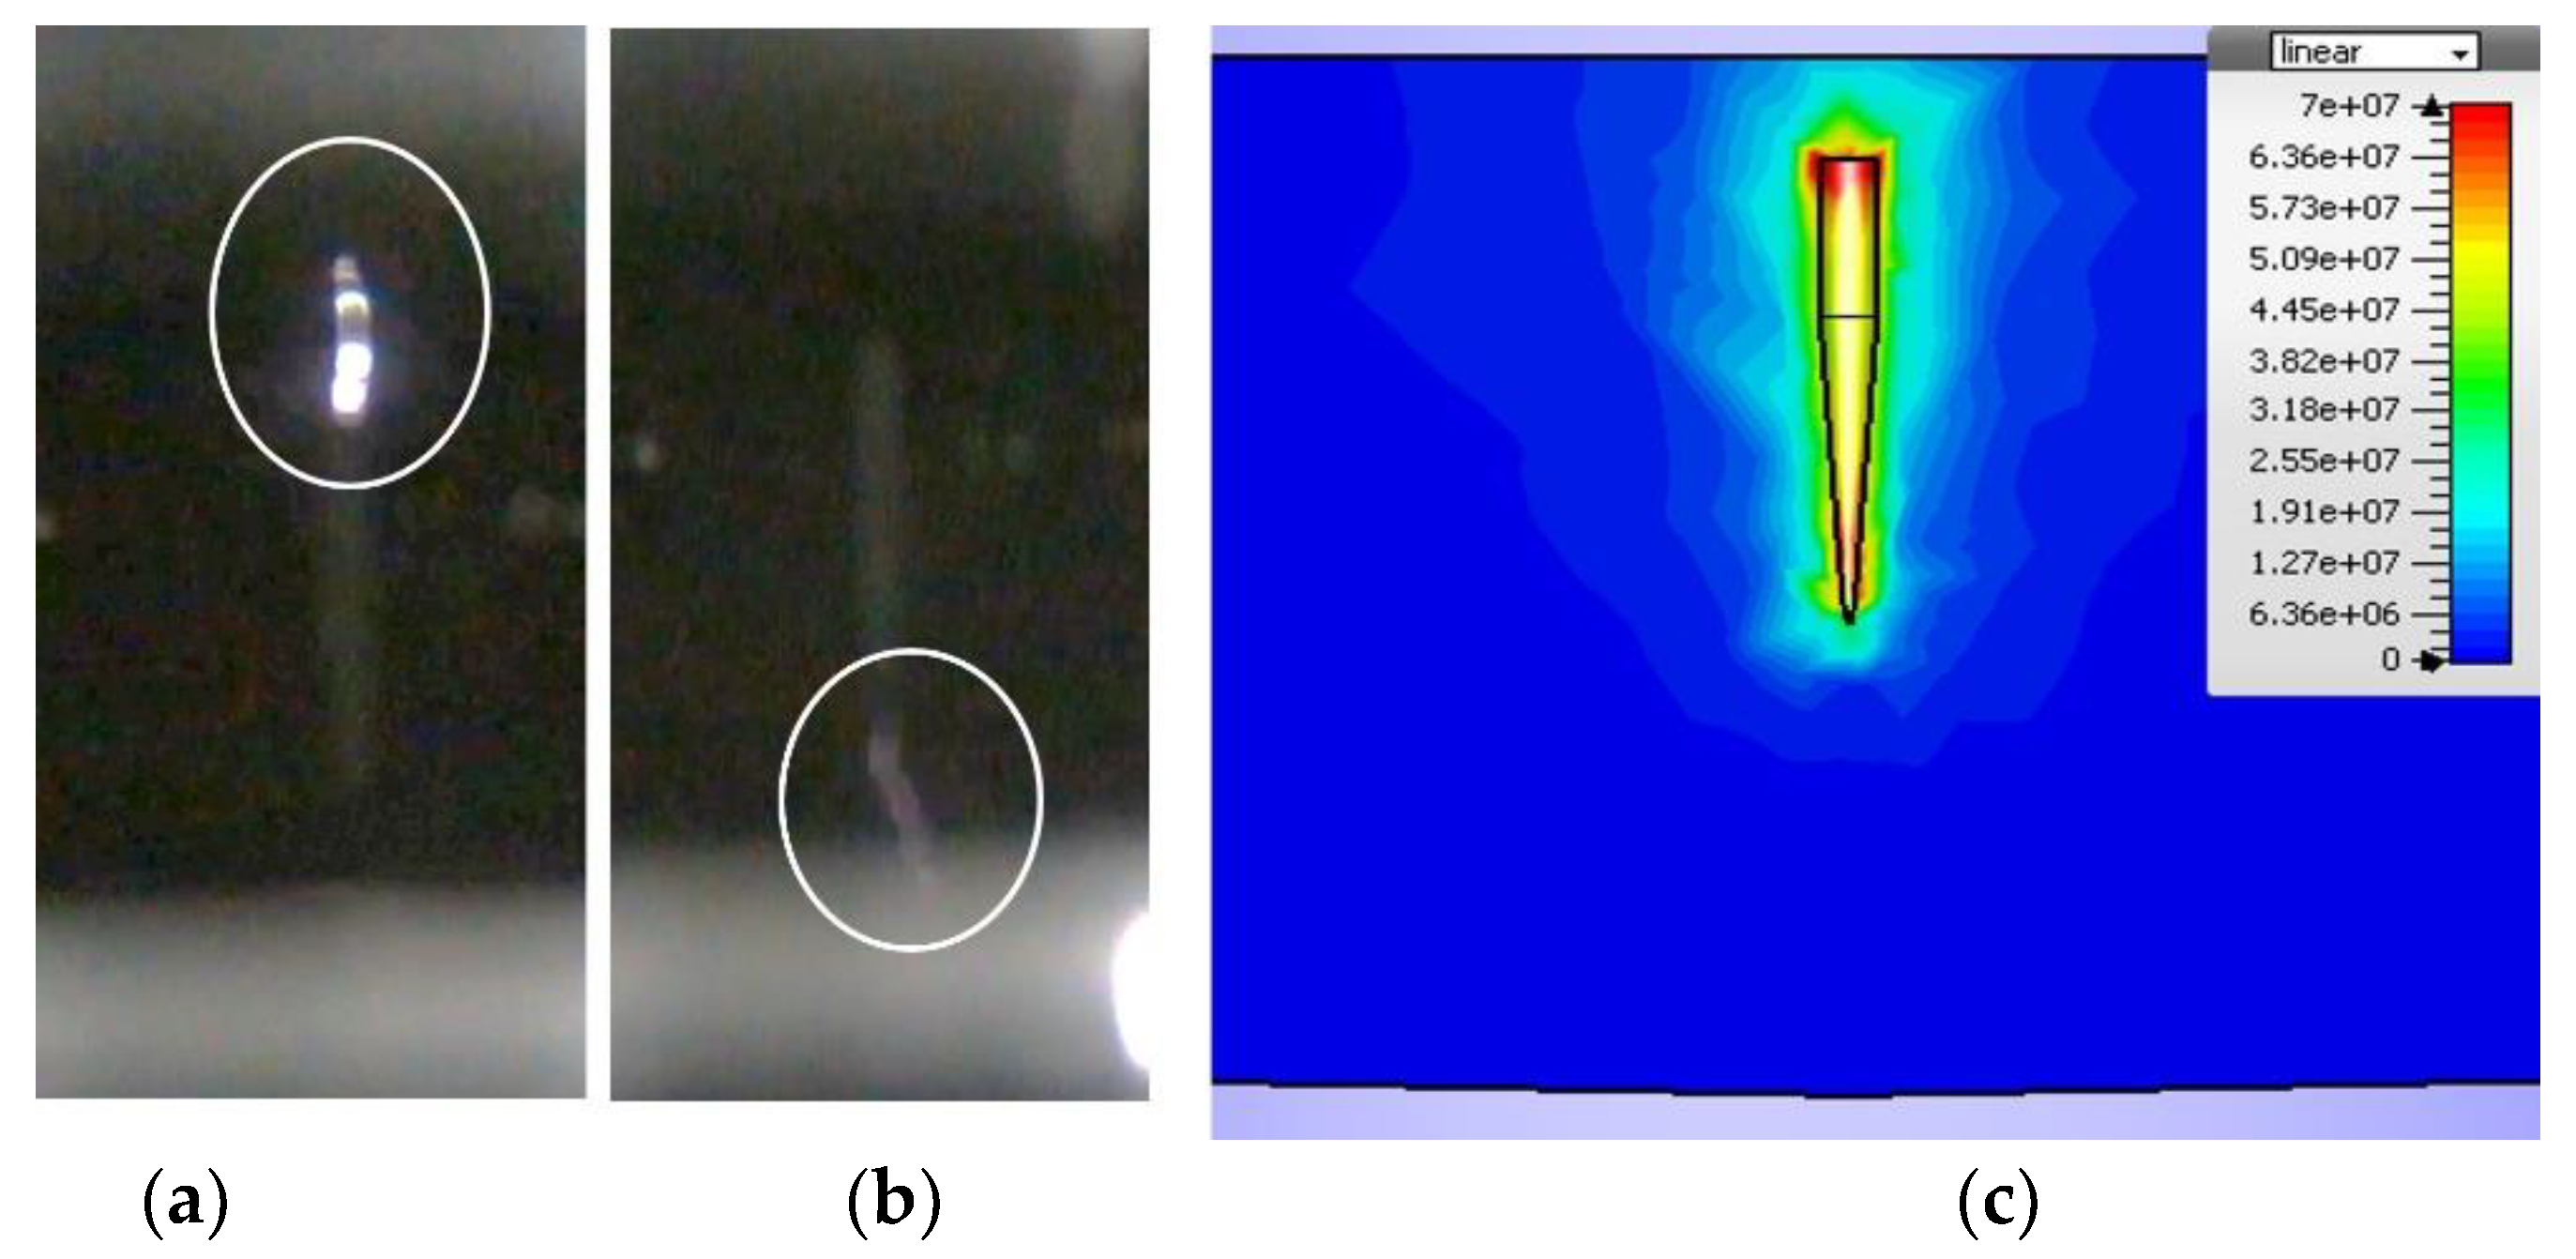
4.3. Corona Phenomenon

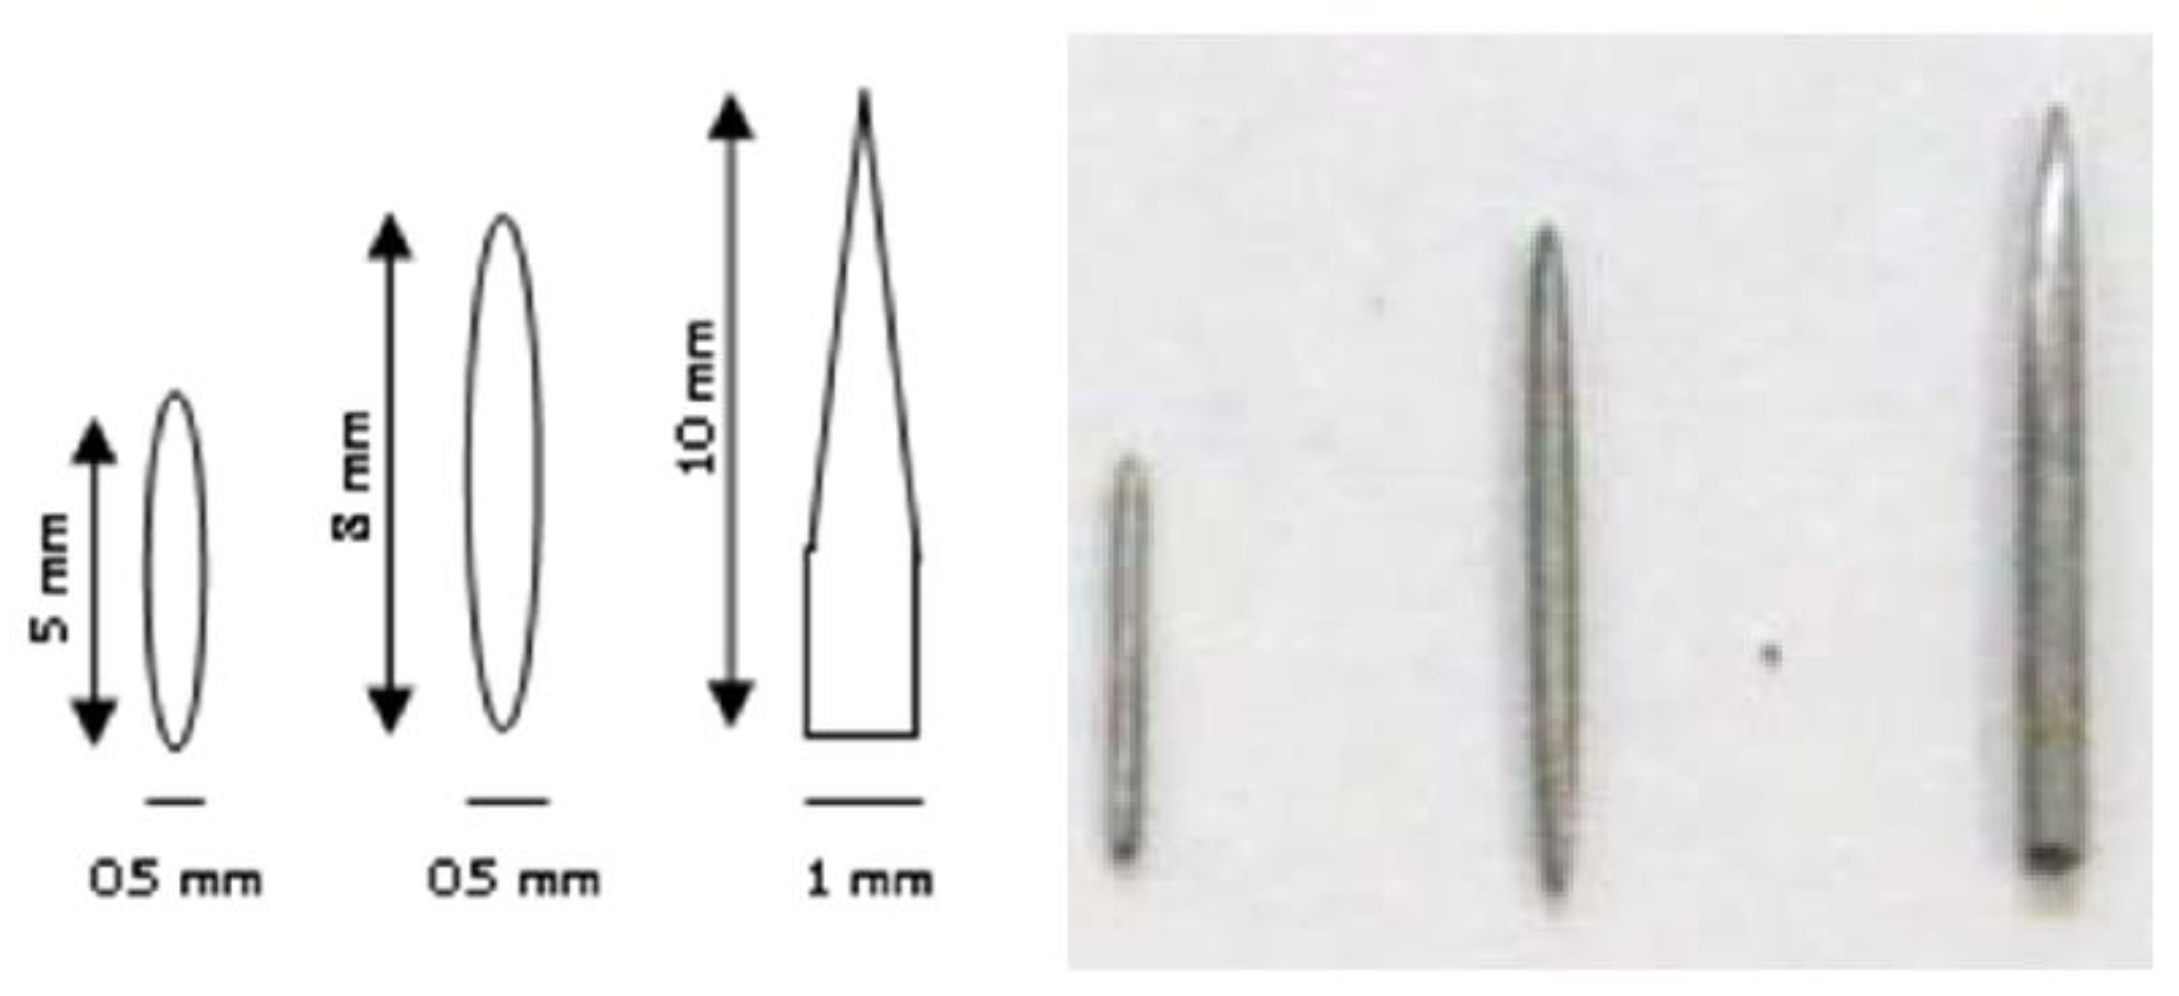
4.3.1. Symmetrical Particle

The particle with an 8 mm diameter and 2 mm distance had two coronas, namely a positive corona and a negative corona. In Figure 10a, the positive corona could be found between the particle and the grounded electrode, while in Figure 10b, the negative corona occurred between the particle and the high voltage electrode. In this condition, the negative corona was more significant, or more potent, than the positive corona due to the greater electric field at the bottom of the particle. This greater electric field was due to its distance, i.e., being closer to the grounded electrode. This analysis was supported by the results of simulation as depicted in Figure 10c. It explained that, under these conditions, the electric field between the particle and the grounded electrode was more significant than the electric field between the particle and the high voltage electrode.
As the distance of particle further increased, the stable bi-corona was observed at both particle tips. The corona phenomena of 8 mm particle size and 6 mm distance are depicted in Figure 11. Figure 11a shows the negative corona at the tip of the particle close to the high-voltage electrode. Meanwhile, Figure 11b depicts the positive corona at the end of a particle close to the grounded electrode. They were very weak as the electric fields in both ends of the particle were the same and low. They were evidenced by the result of simulation as figured in Figure 11c.

4.3.2. Unsymmetrical Particle

The negative and positive corona appeared during the experiment with the unsymmetrical particle of 10 mm particle size and 2 mm distance, as shown in Figure 12. In Figure 12a, the positive corona occurred between the particle and the grounded electrode, while in Figure 12b, the negative corona was seen at the particle near the high voltage electrode. This meant that the positive corona was more substantial than the negative corona, as the electric field between the particle and the grounded electrode was greater than the electric field between the particle and the high voltage electrode, as per the simulation result in Figure 12c.
The particle with a 10 mm size, located at 5 mm from the grounded electrode (at the middle between the electrodes) under DC voltage stress, generated the negative and positive corona, as seen in Figure 13. The positive corona appeared between the grounded electrode and the particle, as depicted in Figure 13a. On the other hand, the negative corona was at the end of the particle which close to the high voltage electrode. These findings confirmed that the negative corona was weaker than the positive corona due to the unsymmetrical particle. The flat part had a uniform electric field compared to the sharp part close to the grounded electrode. The electric field was collected at the end of the particle. These analyses have been convinced by the simulation, as seen in Figure 13c.
In Figure 14, the particle with a 10 mm size and 8 mm distance had a negative and positive corona. The negative corona was much more intense and vigorous than the positive corona due to its flat surface. The simulation result showed that the electric field at the particle tip near the high voltage was greater than the particle tip near the grounded electrodes, as seen in Figure 14c.

5. Conclusions

In this paper, pre-breakdown and breakdown voltage characteristics from floating metal particles in oil insulation have been investigated. In terms of the pre-breakdown phenomenon, the average value of corona inception voltage was inversely proportional to the size of the particles. The greater the particle size in oil insulation, the lower the corona inception voltage. Particle position had no significant effect on inception voltage characteristics. It tended to be stable at one value, but it was slightly lower when the particle touched the electrode. Meanwhile, the average breakdown voltage was inversely proportional to the particle size. The larger the particle, the lower the breakdown voltage in oil insulation. Contradicting with pre-breakdown characteristics, particle position affected breakdown voltage magnitude. It had the lowest value when the particle was close to the electrode (but was not in contact). Investigation about the peak value of corona currents suggested that it was directly proportional to the particle size. The larger the particle, the higher the peak value of corona current. Corona current was directly proportional to the generation voltage. The higher the voltage stress, the higher the corona current. Moreover, some results obtained in this study had an agreement with the floating particles of the air dielectric studied by other researchers.

Author Contributions

Conceptualization, D.F.; data curation, I.G.N.S.H.; investigation, M.W.; validation, M.N.I.; writing—original draft, I.M.Y.N.; writing—review and editing, D.F. and D.A.A. All authors have read and agreed to the published version of the manuscript.

Funding

This research received no external funding.

Institutional Review Board Statement

Not applicable.

Informed Consent Statement

Not applicable.

Acknowledgments

Authors would like to acknowledge supports provided by Institut Teknologi Sepuluh Nopember on research facilities and financial support during completion of this research.

Conflicts of Interest

The authors declare no conflict of interest.

References

  1. Missas, S.; Danikas, M.G.; Liapis, I. Factors Affecting the Ageing of Transformer Oil in 150 / 20 kV Transformers. In Proceedings of the 2011 IEEE International Conference on Dielectric Liquids, Trondheim, Norway, 26–30 June 2011; pp. 1–4. [Google Scholar]
  2. Homaei, M.; Moosavian, S.M.; Illias, H.A. Partial Discharge Localization in Power Transformers Using Neuro-Fuzzy Technique. IEEE Trans. Power Deliv. 2014, 29, 2066–2076. [Google Scholar] [CrossRef]
  3. Rahman, M.F.; Nirgude, P.; Burjupati, N.R. Effect of irregular-shaped Cu particles on transformer oil PD characteristics under varying electrode configurations. IET Sci. Meas. Technol. 2019, 13, 201–211. [Google Scholar] [CrossRef]
  4. Yan, W.; Yang, L.; Cui, H.; Ge, Z.; Li, S.; Li, S. Comparison of Degradation Mechanisms and Aging Behaviors of Palm Oil and Mineral Oil during Thermal Aging. In Proceedings of the 2018 Condition Monitoring and Diagnosis (CMD), Perth, WA, Australia, 23–26 September 2018; pp. 1–6. [Google Scholar]
  5. Omran, Y. Propagation Behavior of Partial Discharge Acoustic Signals by Using Finite Element Technique. In Proceedings of the 2018 1st International Conference on Computer Applications & Information Security (ICCAIS), Riyadh, Saudi Arabia, 4–5 April 2018; pp. 1–5. [Google Scholar]
  6. Shanker, T.B.; Nagamani, H.N.; Antony, D.; Punekar, G.S. Effects of Transformer-Oil Temperature on Amplitude and Peak Frequency of Partial Discharge Acoustic Signals. IEEE Trans. Power Deliv. 2018, 33, 3227–3229. [Google Scholar] [CrossRef]
  7. Azmi, K.; Ishak, D.; Kamarol, M.; Zuhairi, A. Comparison of Partial Discharge Behavior in Mineral Oil and PFAE under Influence of Spherical Metal Particle. In Proceedings of the 2017 International Conference on High Voltage Engineering and Power Systems (ICHVEPS), Sanur, Indonesia, 2–5 October 2017; pp. 519–523. [Google Scholar]
  8. Lundgaard, L.E.; Linhjell, D.; Berg, G. Streamer/leaders from a metallic particle between parallel plane electrodes in transformer oil. IEEE Trans. Dielectr. Electr. Insul. 2001, 8, 1054–1063. [Google Scholar] [CrossRef]
  9. Sarathi, R.; Koperundevi, G. Investigation of partial discharge activity of single conducting particle in transformer oil under DC voltages using UHF technique. IET Sci. Meas. Technol. 2009, 3, 325–333. [Google Scholar] [CrossRef]
  10. Cai, W.; Zhang, C.; Zhang, M.; Tang, J. Discharge characteristics and mechanism of conductive metal particles in function of the oil flow under AC voltages. IEEE Trans. Dielectr. Electr. Insul. 2017, 24, 268–278. [Google Scholar] [CrossRef]
  11. Luo, X.; Tang, J.; Pan, C.; Zhang, Y. Contribution of free iron particles to PD characteristics in flowing transformer oil at DC voltages. IET Gener. Transm. Distrib. 2020, 14, 294–300. [Google Scholar] [CrossRef]
  12. Zhang, Y.; Tang, J.; Pan, C.; Luo, X. Comparison of PD and Breakdown Characteristics Induced by Metal Particles and Bubbles in Flowing Transformer Oil. IEEE Access 2019, 7, 48098–48108. [Google Scholar] [CrossRef]
  13. Pan, C.; Tang, J.; Tao, X.; Zhang, Y.; Ma, S. Partial discharge and breakdown characteristics of moving transformer oil contaminated by metallic particles. IEEE Trans. Dielectr. Electr. Insul. 2018, 25, 1774–1784. [Google Scholar] [CrossRef]
  14. Tang, J.; Ma, S.; Zhang, X.; Zhang, M.; Liu, Z.; Li, X.; Zeng, F. Investigation of partial discharge between moving charged metal particles and electrodes in insulating oil under flow state and AC condition. IEEE Trans. Dielectr. Electr. Insul. 2016, 23, 1099–1105. [Google Scholar] [CrossRef]
  15. Setyawan, M.Y. Effect of Shape and Number of Particles on the Characteristics of Partial Discharge and Oil Insulation Breaking Voltage in Uniform Fields. Bachlelor’s Thesis, Institut Teknologi Sepuluh Nopember, Surabaya, Indonesia, 2014. [Google Scholar]
  16. Asano, K.; Hishinuma, R.; Yatsuzuka, Y. Bipolar DC Corona Discharge from a Floating Filamentary Metal Particle. IEEE Trans. Ind. Appl. 2002, 38, 57–63. [Google Scholar] [CrossRef]
  17. Upadhyay, P.; Amernath, J.; Singh, B.P.; Upadhyay, P. Movement of Metallic Particles in Gas Insulated Line Using SF6 and N2 Gas Mixture under the Influence of Power Frequency and Switching Transient Voltage. In Proceedings of the 2006 IEEE Conference on Electrical Insulation and Dielectric Phenomena, Kansas City, MO, USA, 15–18 October 2006; pp. 280–283. [Google Scholar]
  18. Baek, M.K.; Kim, H.K.; Lee, K.H.; Seo, K.S.; Park, I.H. Numerical Analysis of Floating Conductive Particle Motion in High-Voltage System. In Proceedings of the 28th International Symposium on Discharges and Electrical Insulation in Vacuum (ISDEIV), Greifswald, Germany, 23–28 September 2018; pp. 135–138. [Google Scholar]
  19. Hara, M.; Negara, Y.; Setoguchi, M.; Kurihara, T.; Suehiro, J.; Haashi, N. Particle-triggered Pre-breakdown Phenomena in Atmospheric Air Gaps under AC voltage. IEEE Trans. Dielectr. Electr. Insul. 2005, 12, 1071–1081. [Google Scholar] [CrossRef]
  20. Negara, Y.; Yaji, K.; Imasaka, K.; Suehiro, J.; Hayashi, N.; Hara, M. Corona Discharge Mechanism and Breakdown Voltage Characteristics from Metallic Floating Particles in SF6 Gas under DC Voltage. In Proceedings of the IEEE 8th International Conference on Properties & applications of Dielectric Materials, Bali, Indonesia, 26–30 June 2006; pp. 649–652. [Google Scholar]
  21. Zhang, J.; Wang, F.; Li, J.; Ran, H.; Huang, D. Influence of Copper Particle on Breakdown Voltage and Frequency-Dependent Dielectric Property of Vegetable Insulating Oil. Energies 2017, 10, 938. [Google Scholar] [CrossRef] [Green Version]
  22. Fahmi, D.; Negara, I.M.Y.; Asfani, D.A.; Hernanda, I.G.N.S.; Deliana, T.H.; Soebagio, J.C. Floating Metal Particle Motion Characteristics with Shape and Size Variation in the Oil Insulation Under DC Voltage. In Proceedings of the 2019 International Seminar on Intelligent Technology and Its Applications (ISITIA), Surabaya, Indonesia, 28–29 August 2019; pp. 259–264. [Google Scholar]
  23. Niasar, M.G.; Edin, H. Corona in Oil as a Function of Geometry, Temperature and Humidity. In Proceedings of the Annual Report Conference on Electrical Insulation and Dielectric Phenomena, West Lafayette, IN, USA, 17–20 October 2010. [Google Scholar]
  24. Xie, G.; Yang, Y.; Luo, J.; Guo, D.; Si, L. C Pulse Dielectric Barrier Corona Discharge over Oil Surfaces: Effect of Oil Temperature. IEEE Trans. Plasma Sci. 2013, 41, 481–484. [Google Scholar] [CrossRef]
Figure 1. Configuration of experiment.
Energies 14 03669 g001
Figure 2. Circuit test at the laboratory.
Energies 14 03669 g002
Figure 3. Electrodes system.
Energies 14 03669 g003
Figure 4. Shape and Size of Metallic particles.
Energies 14 03669 g004
Figure 5. Characteristics of corona inception and breakdown voltages of 5 mm symmetrical particle.
Energies 14 03669 g005
Figure 6. Characteristics of corona inception and breakdown voltages of 8 mm symmetrical particle.
Energies 14 03669 g006
Figure 7. Characteristics of corona inception and breakdown voltages of 10 mm of unsymmetrical particle.
Energies 14 03669 g007
Figure 8. The mechanism of corona on floating particle: (a) close to the grounded electrode; (b) at the middle of the gap.
Energies 14 03669 g008
Figure 9. Inception currents (a) 5 mm particles, (b) 8 mm particles, and (c) 10 mm particles with d = 2 mm.
Energies 14 03669 g009
Figure 10. Corona for 8 mm of particle size and d = 2 mm at voltage stress of 64.2 kV: (a) corona at the bottom of particle; (b) corona at the top of particle; and (c) simulation result of E-field distribution.
Energies 14 03669 g010
Figure 11. Corona for 8 mm of particle size and d = 2 mm at voltage stress of 75.6 kV: (a) corona at the top of particle; (b) corona at the bottom of particle; and (c) simulation result of E-field distribution.
Energies 14 03669 g011
Figure 12. Corona for 10 mm of particle size and d =2 mm at voltage stress of 59.4 kV: (a) corona at the bottom of particle; (b) corona at the top of particle; and (c) simulation result of E-field distribution.
Energies 14 03669 g012
Figure 13. Corona for 10 mm of particle size and d = 5 mm at voltage stress of 71 kV: (a) corona at the bottom of particle; (b) corona at the top of particle; and (c) simulation result of E-field distribution.
Energies 14 03669 g013
Figure 14. Corona for 10 mm of particle size and d = 8 mm at voltage stress of 60.3 kV: (a) corona at the bottom of particle; (b) corona at the top of particle; and (c) simulation result of E-field distribution.
Energies 14 03669 g014
Table 1. Specifications of High Voltage Generator.
ComponentSpecification
High Voltage Transformer100 kV, 10 kVA
High Voltage Diode140 kV, 20 mA
Smoothing Capacitor140 kV, 25 μF
Measuring Resistor140 kV DC, 280 mΩ
Resistor Damping6 kΩ
Control BoxOT276 dan DMI551
Secondary Part for RM (DC)75 Ω
Table 2. The Peak Value of Corona Current for Particle Size = 5 mm.
d (mm)Peak (mA)d (mm)Peak (mA)
00.3990.34
20.42110.38
40.47130.34
60.43150.44
7.50.40Average0.40
Table 3. The Peak Value of Corona Current for Particle Size = 8 mm.
d (mm)Peak (mA)d (mm)Peak (mA)
00.6380.61
20.55100.61
40.60120.54
60.62Average0.59
Table 4. The Peak Value of Corona Current for Particle Size = 10 mm.
d (mm)Peak (mA)d (mm)Peak (mA)
00.9060.99
20.9880.99
40.87101.05
50.85Average0.95
Table 5. The Average Value of Peak Corona Current at The Inception Voltage.
Particle Size (mm)Average Current Inception (mA)
50.4009
80.5945
100.9475
Publisher’s Note: MDPI stays neutral with regard to jurisdictional claims in published maps and institutional affiliations.

