Abstract
The installation of wind power technology is growing steadily and the trend can be expected to continue if the objectives proposed by the European Commission are to be achieved. In some countries a considerable percentage of installed wind power capacity is near the end of its useful lifetime. In the case of Spain, the figure is 50% within five years. Over the last 20 years, wind energy technology has evolved considerably and the expected capacity factor has improved, thus increasing annual energy production, and capital expenditure and operational expenditure have decreased substantially. This paper studies the optimal decision under uncertainty between life extension and full repowering for a generic wind farm installed in the Iberian Peninsula when the future hourly electricity prices and the capacity factor evolve stochastically and seasonally. The results show that in economic terms, full repowering is the best option, with a net present value of €702,093 per MW installed, while reblading is the second best option. The methodology can be transferred to other specific wind farms in different electricity markets and can be used to develop national wind energy policy recommendations to achieve projected shares in the electricity mix.
1. Introduction
The European Green Deal [1] is the European Commission’s strategy aligned with the Paris Climate Agreement [2] to tackle climate and environmental challenges, with the goal of zero net emissions of greenhouse gases by 2050. The Europe 2020 strategy includes a target of 20% of gross final energy consumption from renewable sources by 2020, and at least 32% by 2030. In 2018 the proportion of energy from renewable sources in gross final energy consumption was 18%. This is double the figure of 8.5% recorded in 2004 [3].
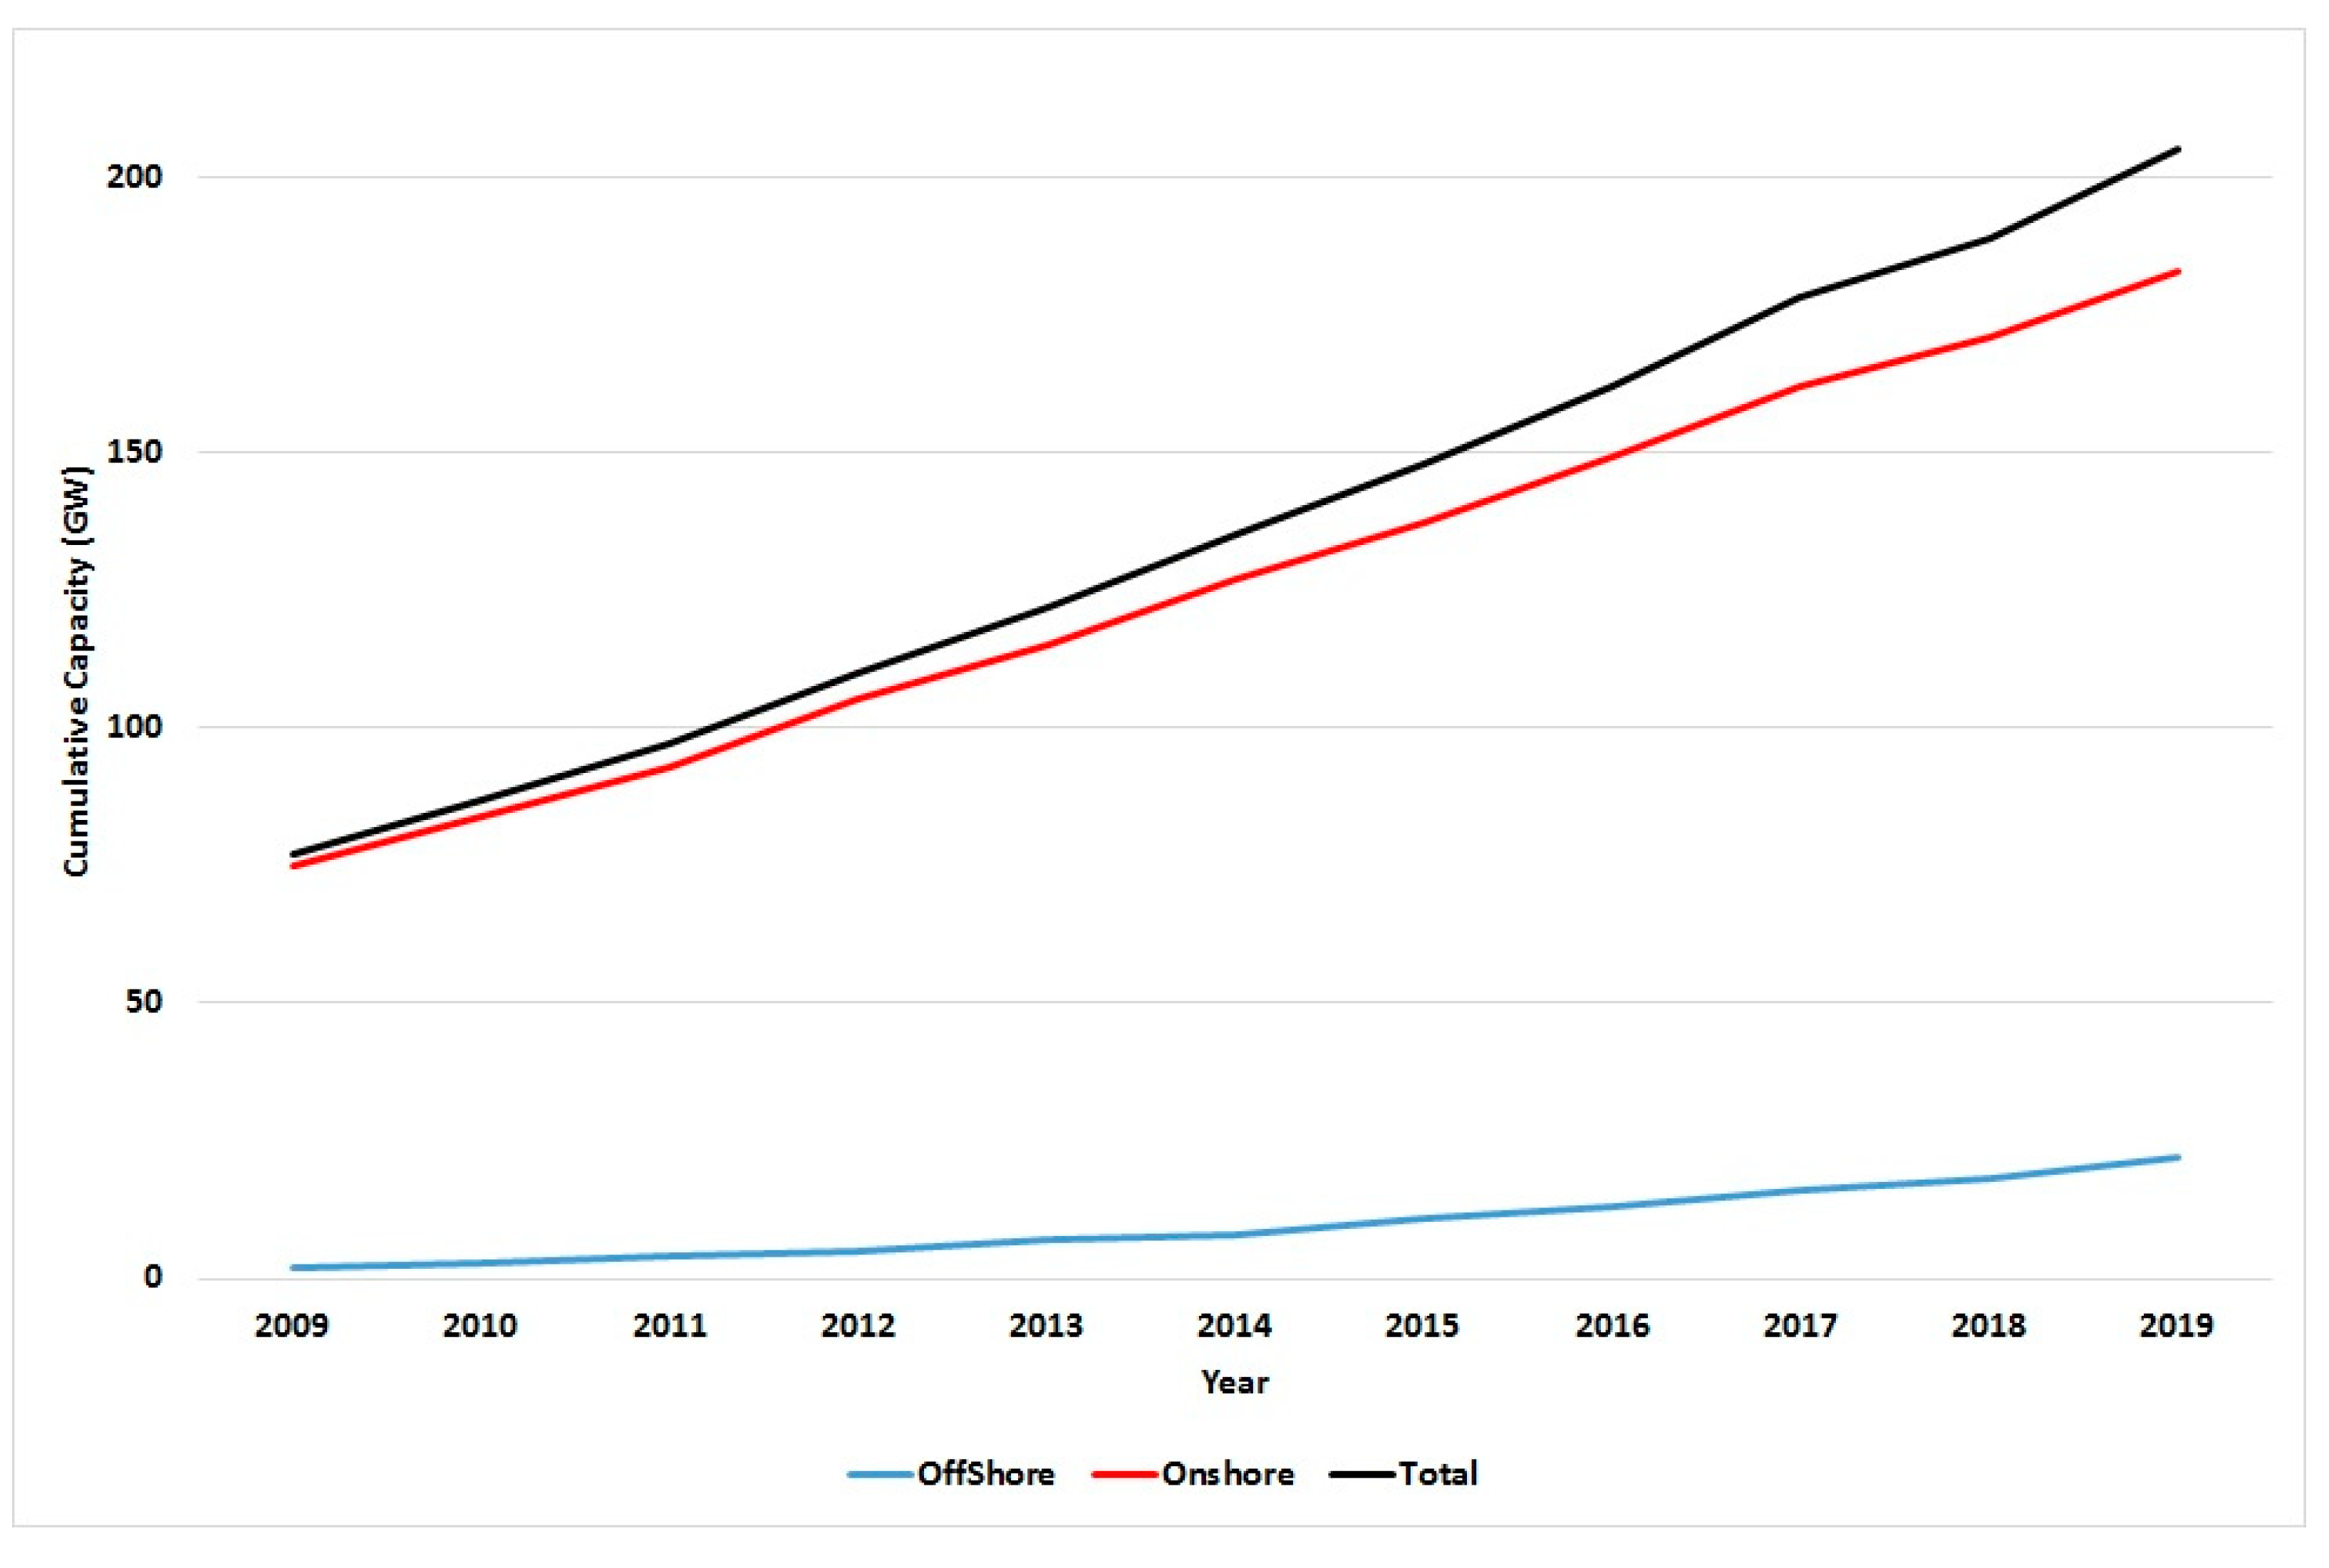
Wind power is one of the fastest growing renewable energy technologies, with a global increase of 16% from 2015 to 2016, which translates specifically to a worldwide growth of 130 TWh [4]. Figure 1 shows the trend in installed wind power capacity in Europe over the last ten years. Europe installed 15.4 GW of new wind capacity in 2019, bringing its total to 205 GW. Wind also accounted for 15% of the electricity consumed in the EU in 2019 [5]. The current stock of European wind farms is 10.7% offshore and 89.3% onshore. Offshore wind energy is obtained by taking advantage of high seas wind and onshore wind power refers to turbines that are allocated on land. Total wind-power capacity grew at an accumulated annual rate of 10.3% from 2009 to 2019.
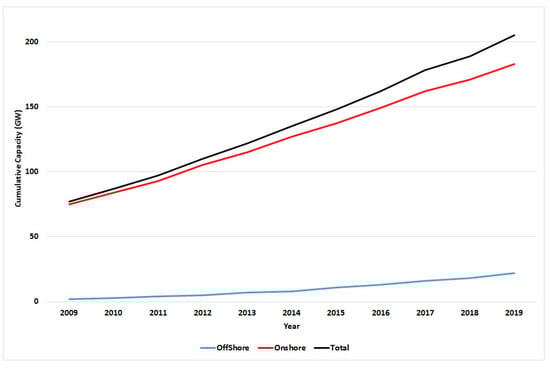
Figure 1.
Trend on installed onshore and offshore wind power capacity in Europe. Source: drawn up by the authors with data from [5].
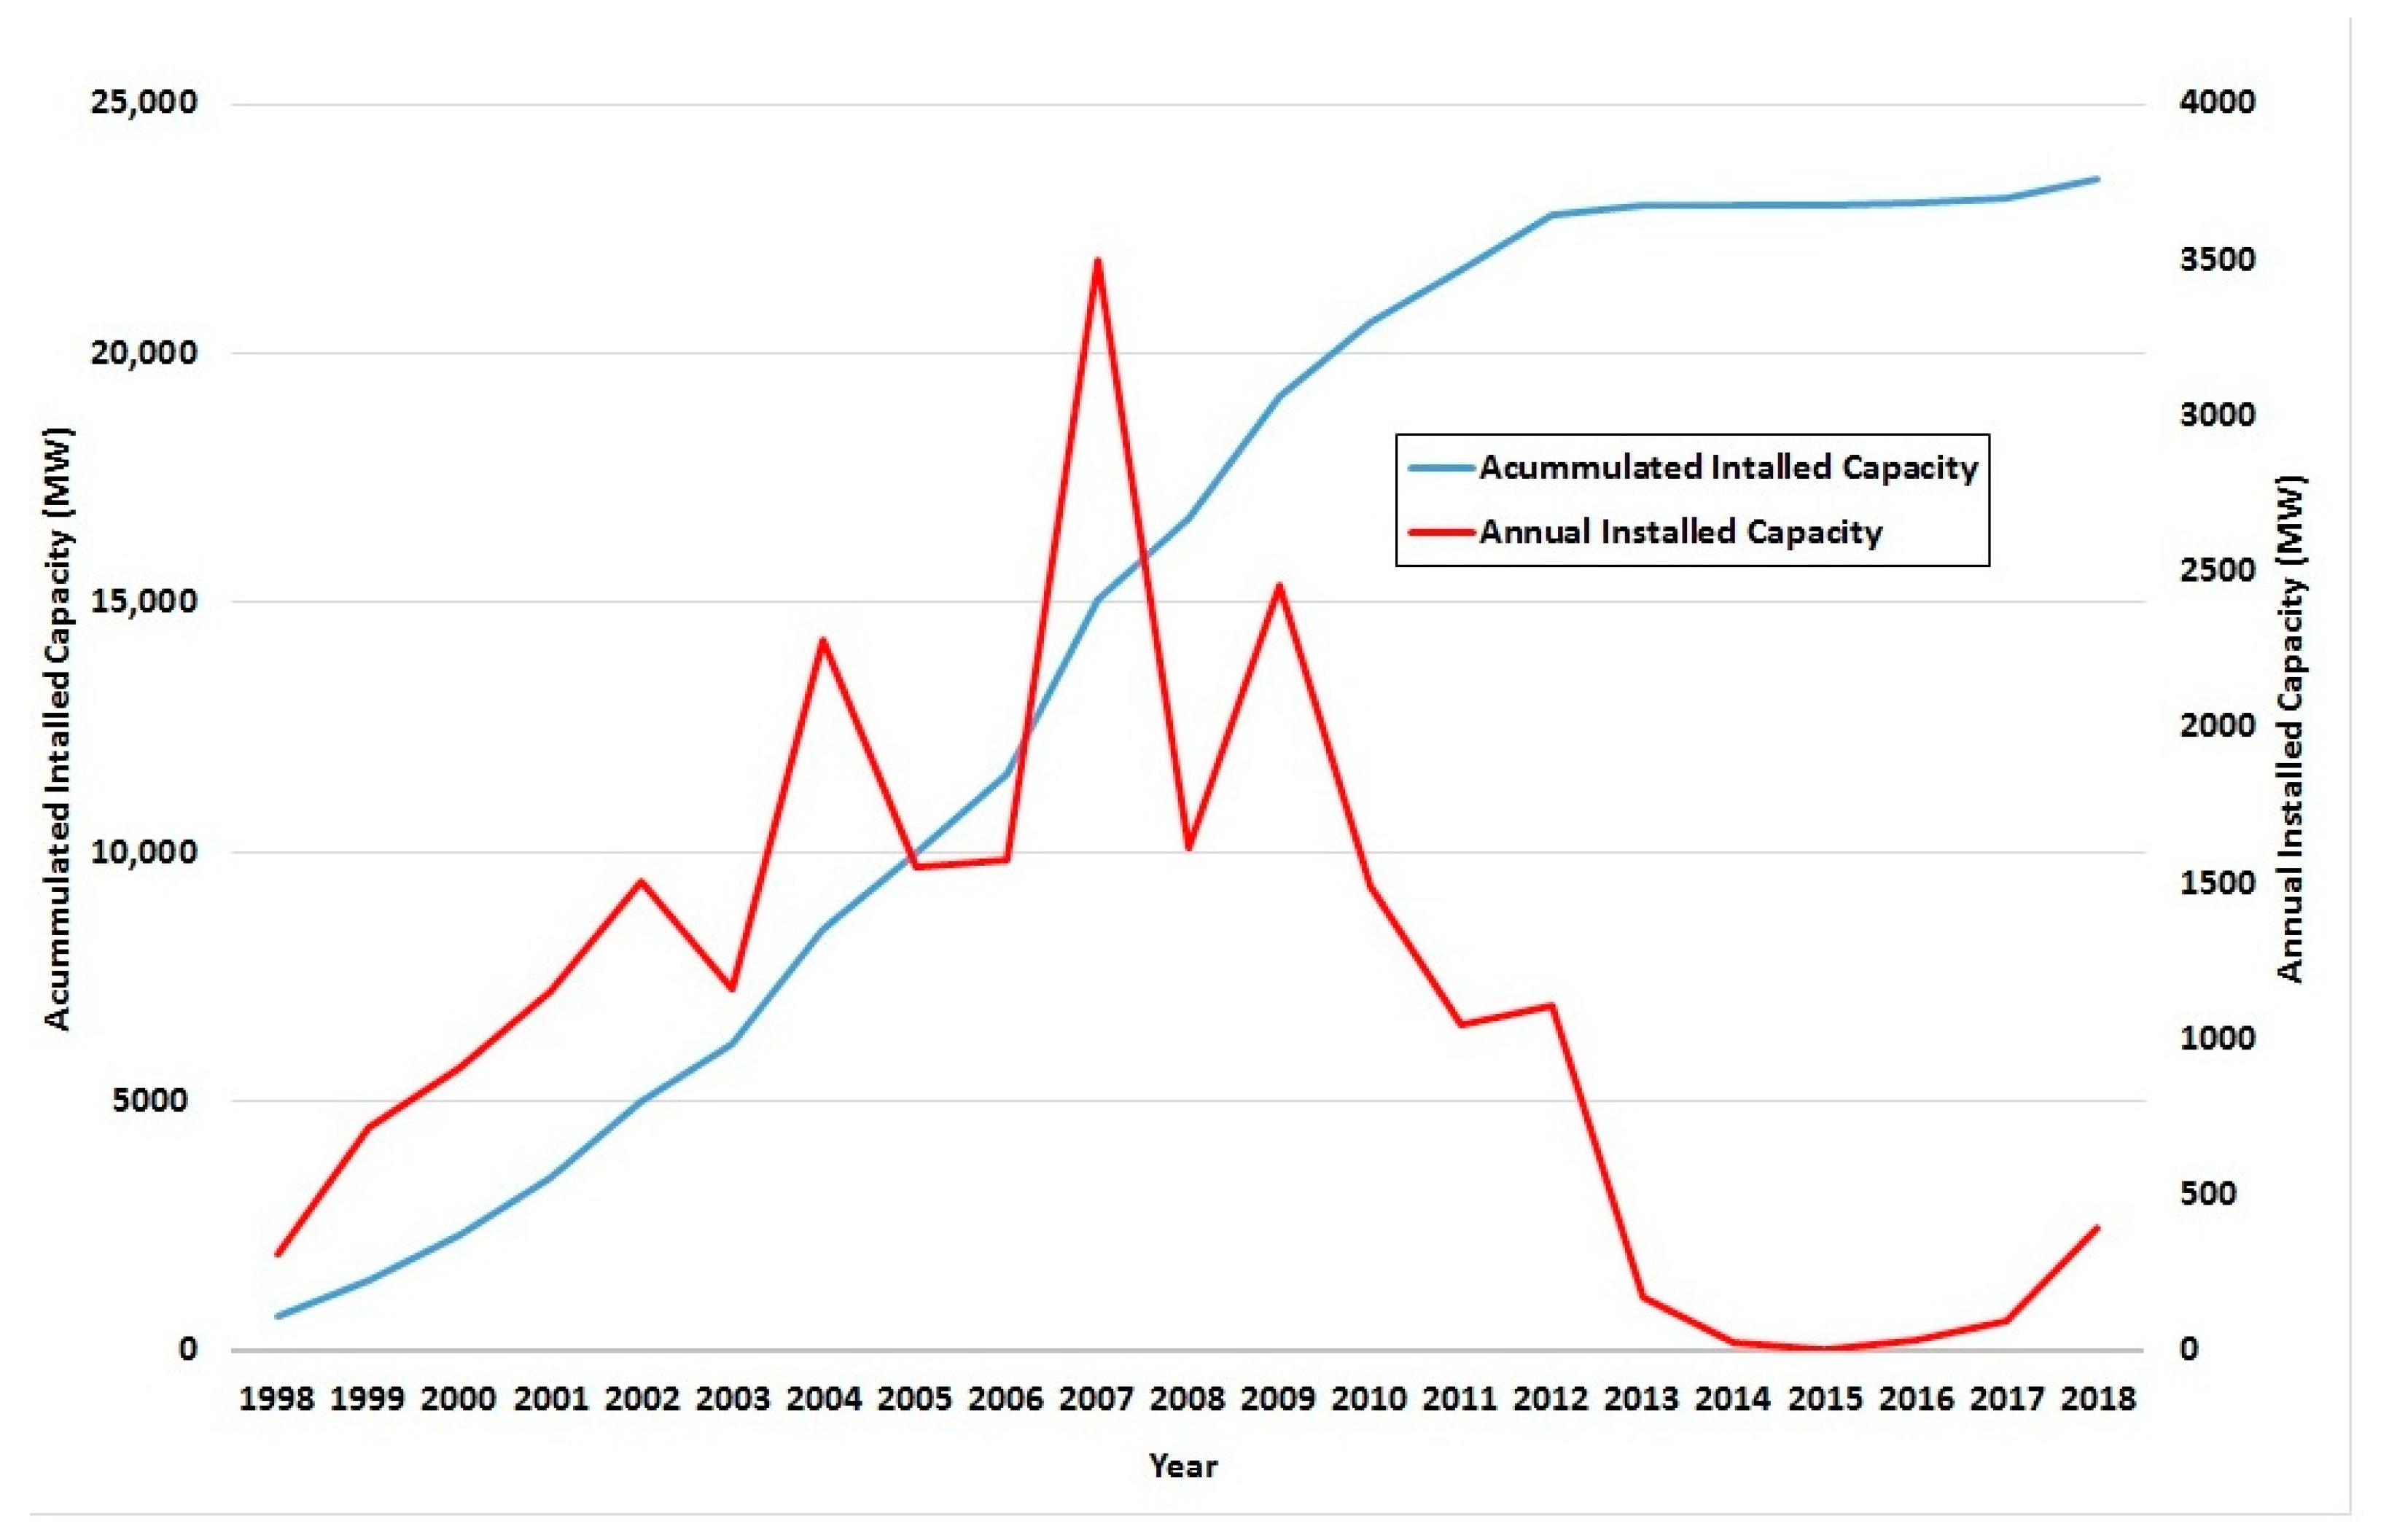
Figure 2 shows the annual and accumulated installed wind capacity in Spain. Continuous growth in installations can be seen in 1998 and 2007. The largest increase in capacity was between 2003 and 2009. From 2007 to 2013 a steady decrease in annual installed capacity can be seen. The determining factor of a considerable sharp drop during years 2013 and 2017 was due to a political decision to eliminate all economic incentives such as feed-in tariffs for new wind farms. The annual installed capacity curve shows a change in trend in the last two years with a positive growth of about 400 MW. Figure 2 also shows a stagnation in recent years in the total accumulated installed capacity in Spain.
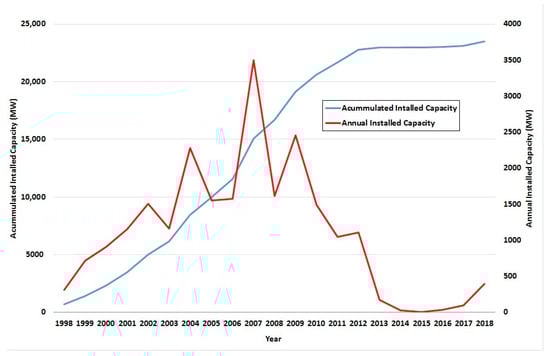
Figure 2.
Trend in annual and accumulated installed wind power capacity in Spain. Source: drawn up by authors with data from AEE [6].
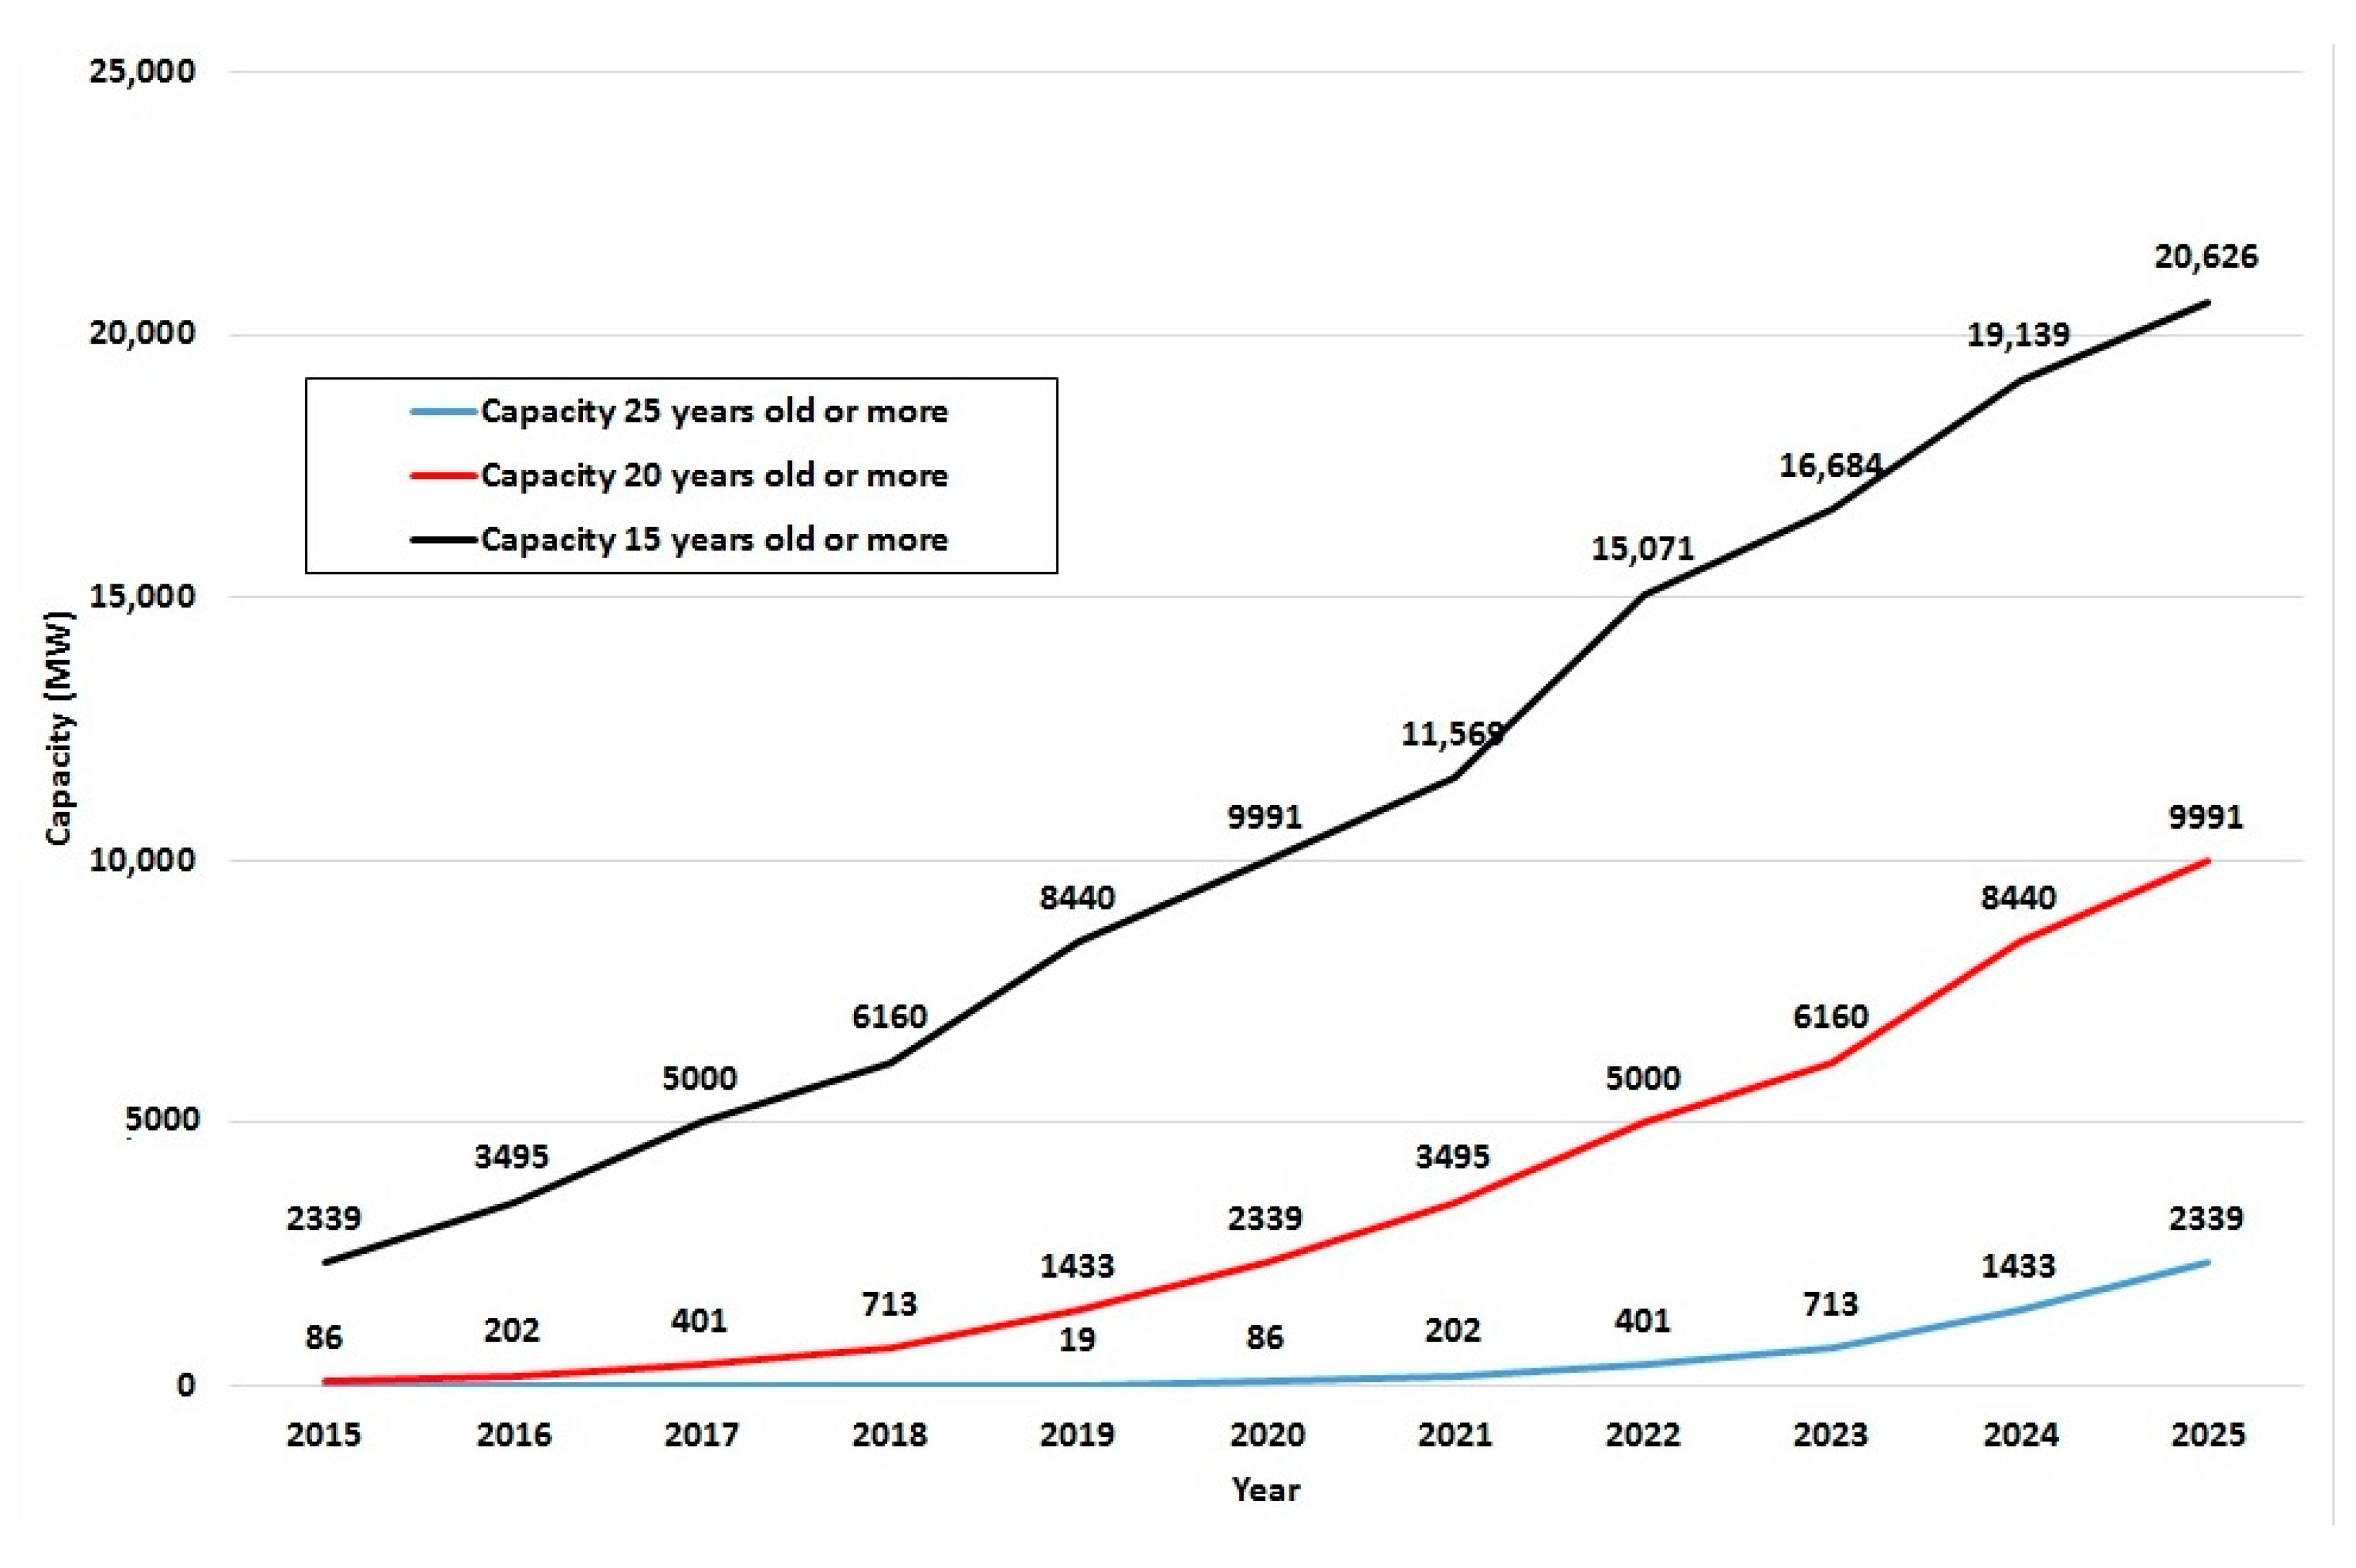
Figure 3 shows the trend in the age of Spanish wind farms, revealing that in the next five years nearly half of the installed capacity (10,000 MW) will be at least 20 years old and approaching the end of its operational lifetime, with 2300 MW already beyond its theoretical lifetime. It is noteworthy that because these were the first units to be installed, they are mostly located in the places with the best wind. Like Spain, other European countries such as Germany, Italy, Denmark, Portugal and France are currently in the same situation as regards asset ageing. The total installed onshore capacity in EU countries is currently 183 GW [5], with 40 to 80 GW potentially reaching the end of its lifetime by 2030 [7].
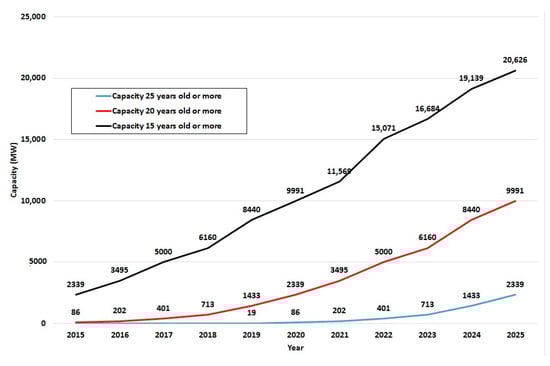
Figure 3.
Trend in the age of Spanish wind farms with installed capacity. Source: drawn up by authors with data from AEE [6].
Spain’s Integrated National Energy and Climate Plan (PNIEC) [8] defines the 2030 targets for the reduction of greenhouse gas emissions, the market penetration of renewable energies and energy efficiency. Specifically, those targets are 42% of total final energy consumption from renewable energy sources, a 39.5% improvement in energy efficiency and 74% of electricity generation from renewables. To that end, the plan provides for an increase in installed wind power capacity to 38 GW by 2030 in a scenario where no new policy recommendations are introduced, and to 50.3 GW by 2030 if the measures proposed in the PNIEC are applied (objective scenario). Table 1 shows these targets. It is estimated that an increase of 12.6 GW is needed in 2020–2025 and the repowering of old wind farms can help to meet this goal.

Table 1.
Spanish wind installed capacity in the objective scenario (GW).
Wind Europe draws up similar projections using a bottom-up approach and gathering data at country level for Europe [7]. For Spain, it recognizes an increase to 40 GW in a scenario where favorable market and policy conditions are assumed. However, according to the International Energy Agency (IEA), the Covid-19 pandemic situation is expected to delay the deployment of renewables [9].
In order to meet the European climate and energy goals, it is mandatory to develop a National Energy & Climate Plan (NECP) under the 2018 Clean Energy Package for each country, including a list of actions. Wind Europe [10] recognizes three key issues in this instrument: auction, electrification and permitting. Despite policies and measures, technically speaking it is clear that installed capacity must be increased considerably in the coming decades. A big increase in MW is needed and many more MW need to be repowered or refurbished. This paper analyses the optimal decision for an old wind farm. If it is close to the end of its lifetime and electricity and the capacity factor behave as stochastic variables, it can be complicated to determine whether life-extension or repowering is the more profitable solution. New technology installation is led by new-generation wind turbines and more technologically advanced components which considerably increase the capacity factor, thus improving Annual Energy Production (AEP) and decreasing Operation and Maintenance (O&M) expenses. Furthermore, if a wind farmer’s decision generates an increase in national installed wind capacity, this will clearly help to meet the goals of the Spanish PNIEC. In this paper, we do not take into account high-power purchase agreements per tariff such as feed-in tariffs or tax benefits.
The literature on repowering is diverse and includes papers that focus on technical, economic and regulatory mechanisms. There are also papers analysing wind farm repowering at global level, at country level and specific to particular wind farms. A range of different approaches and different model techniques can also be found. For example, Bórawski et al. [11] analysed the development of the wind power market in the European Union country by country and also examined its regulations, directives and laws. They asserted that installed capacity is likely to increase in most countries.
Other papers analyse equipment failures. Novaes et al. [12] present forecasting techniques and methods for estimating remaining useful lifetimes applied to components such as gearboxes and blades. Tchakoua et al. [13] review wind turbine condition monitoring, recognise that maintenance strategies and early failure detection reduce costs and state that a condition monitoring system would be highly useful for this. Kazemi et al. [14] assess life-extension based on fatigue of key structural components. Herbert et al. [15] analyse the failure, reliability and performance of wind farms and their financial implications, and find that ageing wind turbines lose performance and reliability. Merizalde et al. [16] review the maintenance of wind turbines and conclude that satisfactory maintenance management can extend the life cycle of a turbine by about 5–10%, and that most of the 60% of failures are attributable to the turbine. Wiser et al. [17] conduct a survey of wind industry experts on Opex and its influence in LCOE. Boccard [18] analyses the capacity factor and compares realized values with estimations, finding a difference between the assumed 30–35% range as per the name-plate capacity and the actual figure of 21%, confirming that this miscalculation can distort decision-making.
From the viewpoint of the technical and economic factors involved in repowering, Blanco [19] studies generation costs in different countries of Europe. Serri et al. [20] develop repowering scenarios and conduct a technical and economic assessment of Italian wind farms. They find that the issues that may affect repowering include high investment cost and a seemingly endless, complicated authorization process. Rubert et al. [21] analyse the life-extension of onshore wind turbines from an LCOE perspective and present a methodology for supporting economic lifetime-extension and investment decision-making.
Referring to policies and the design of regulatory elements for managing equipment at end-of-life, Madlener et al. [22] investigate the optimal timing of onshore wind repowering under the premium regime in Germany. Invernizzi et al. [23] provide foundations for incorporating circular economy principles into an integrated decommissioning policy to promote sustainable management in energy infrastructures. Glensk and Madlener [24] analyse ageing wind turbines in Germany, where one third of the total installed capacity is set to leave the feed-in funding tariff and conclude that the O&M costs are significant factors in decision making. Colmenar et al. [25] analyse the repowering scenario for Spain with no feed-in tariff and conclude that repowering is a profitable alternative.
Ziegler et al. [26] recognise that countries such as Denmark, Germany, the United Kingdom and Spain are in similar repowering situations and review life-extension for each country. They state that uncertainty as to future electricity spot market prices is crucial in determining what options are feasible. For the case of Spain, there are several papers, such as that of Santos et al. [27], who employ Markowitz’s portfolio theory and quadratic optimisation techniques to analyse different repowering scenarios and determine various efficient mixes for increasing productivity. Ramirez et al. [28] study the role of wind energy in Spain in meeting renewable energy production targets. They find that a minimum of 46% of repowering is required to achieve those targets. Calvo et al. [29] analyse the technical and economic determinants of wind energy repowering projects. They show that the most relevant variables are greater production efficiency, an increase in the installed capacity of wind farms and, to a lesser extent, capital expenditures. They affirm that in the case analysed repowering is not feasible due to the low level of feed-in tariffs. Villena et al. [30] also present a complete technical and economic report on a real repowering case in Spain, revealing that AEP doubles and it is profitable in economic terms even without subsidies. Simon et al. [31] analyse the repowering option through a novel model based on opportunity cost in Spain, and find that for more than 58% of wind farms repowering would be highly profitable. And Gutierrez et al. [32] analyse the expansion of wind farms in the Spanish region among the educational level of the population.
2. Materials and Methods
2.1. Life-Extension and Repowering Options
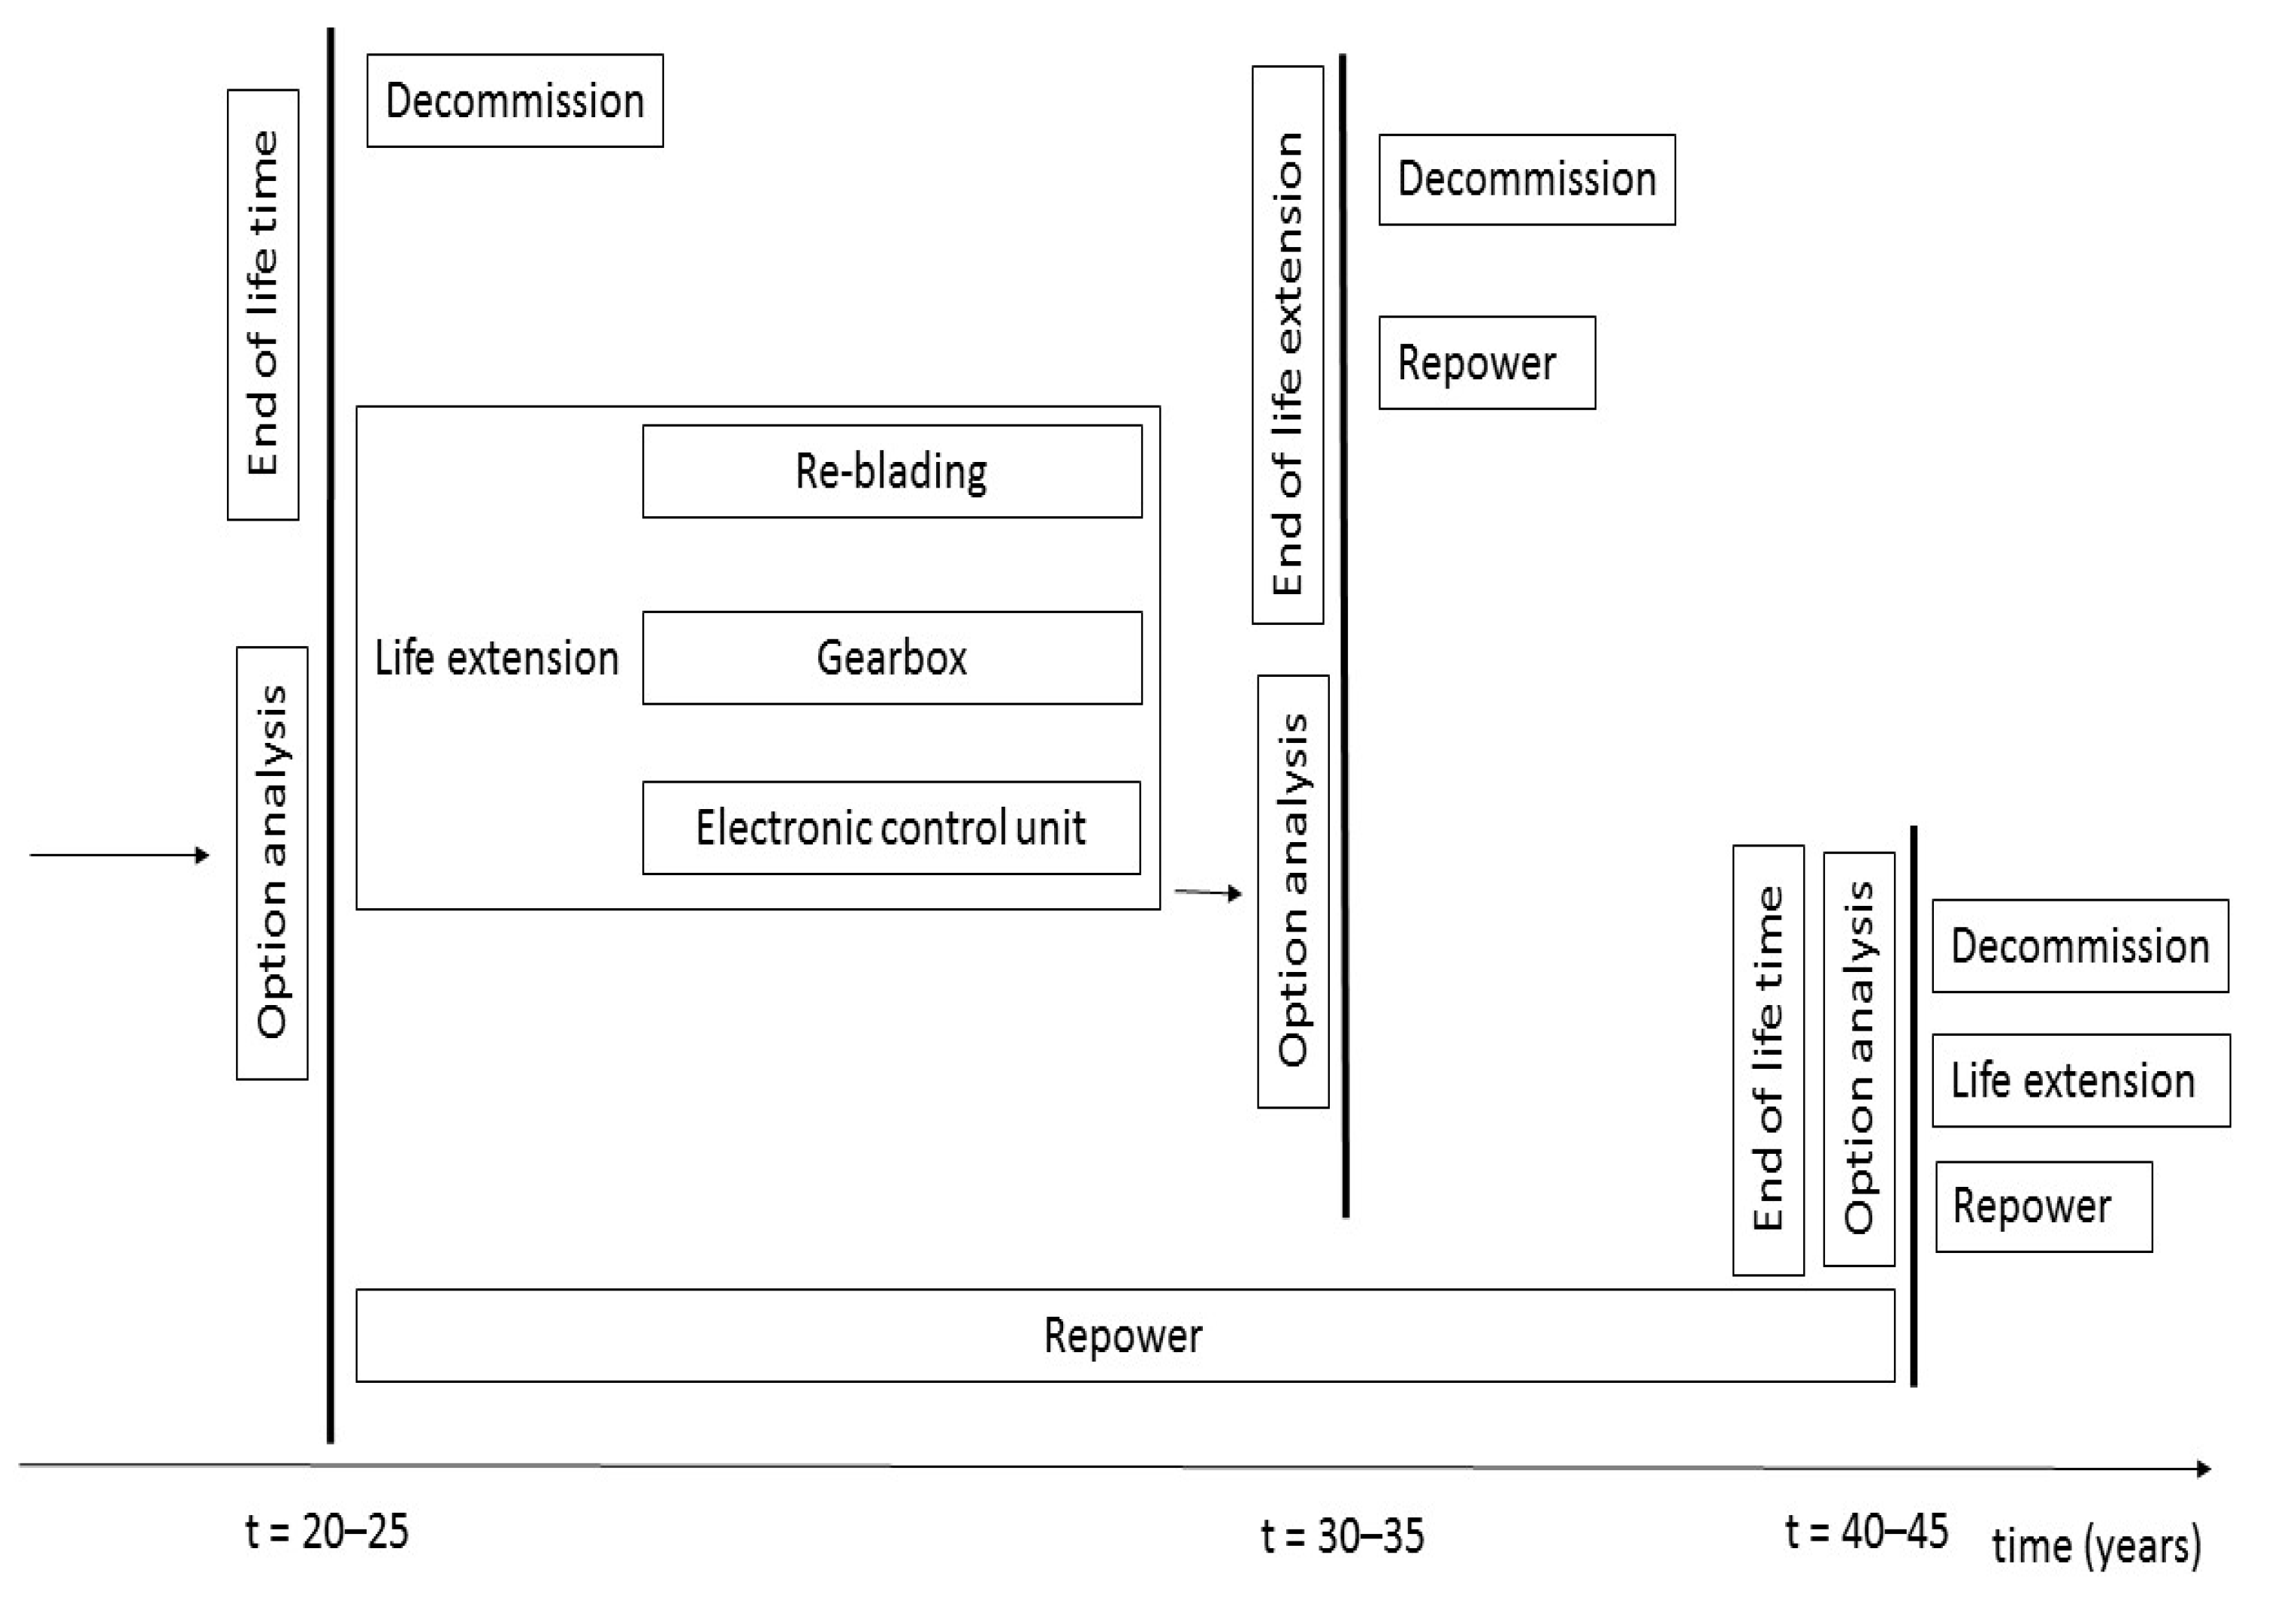
When a wind farm has been worked for nearly 20 years it is close to the end of its technical lifetime (the standard value in the literature is considered between 20 and 25 years) and its failure rate increases substantially. That rate depends on many factors, such as component design margins, wind farm siting, wind and weather conditions, the maintenance record and the fatigue cycles supported by the components. Good wind conditions, constant laminar flows, decrease failure rates and improve turbine production. On the contrary, turbulent wind conditions increase failures and the turbine generates less energy due to plant shutdowns. As wind farms age their performance decreases and the AEP obtained declines. Hughes [33] analyse this by studying age performance curves for wind farms in the UK and Denmark, and Olauson et al. [34] study capacity factor decrease at Swedish wind farms (See Section 2.4). Near the end of their useful lifetimes, year t = 20–25 in Figure 4, a wind farm owner can look at different options including decommissioning, life-extension and repowering. In case of deciding life-extension in year t = 30–35 the farm owner should choose between decommissioning and repowering. And, if in t = 20–25 decides repowering next decision making would be in year t = 40–45 as shown in Figure 4.
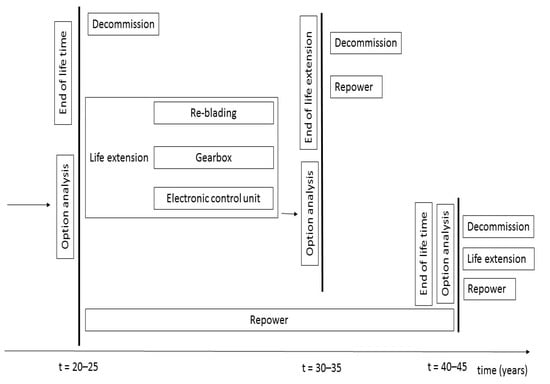
Figure 4.
Options associated with units near the end of their lifetimes.
Decommissioning is not a common option unless owners choose it or permits and licence expire. Life-extension means replacing some key older components and spending a relatively moderate Capital Expenditure (Capex) to reduce the Operational Expenditure (Opex) and improve AEP. Turbines built more than ten years ago were designed with higher safety coefficients than today’s, so they are relatively likely to reach useful lifetimes of thirty years by successfully passing external life-extension certificate tests. Full repowering means completely removing foundations, decommissioning old turbines and installing new ones. Turbine technology has improved considerably and Opex and Capex have decreased. In this case the improvements in Opex and AEP are greater than in the life-extension option, but unfortunately the Capex is also greater. Such decisions need to be taken again and again as units near the end of their lifetimes.
Investors need to know the profitability of each option. Retrofitting and repowering affect capacity factor and Opex to different extents, so the AEP obtained in each case also differs. In short, the aim is to increase AEP at a reasonable cost so as to improve the Levelised Cost of Energy (LCOE) [35]. Electricity prices follow a characteristic pattern determined by high volatility, seasonality, price jumps and mean reversion [36]. The amount of electricity generated depends on the capacity factor. Staffel and Pfenninger [37] analyse the improvement in Europe’s average capacity factor and confirm that it also follows a stochastic pattern. Stochastic modelling could therefore be a reasonable approach. We consider “life-extension” as entailing three types of retrofitting: replacement of blades, gearbox and electronic control unit.
2.2. Stochastic Model of Electricity Prices and Their Calibration
Electricity prices have seasonality, including hourly seasonality within each day, plus mean reversion, volatility and price spikes.
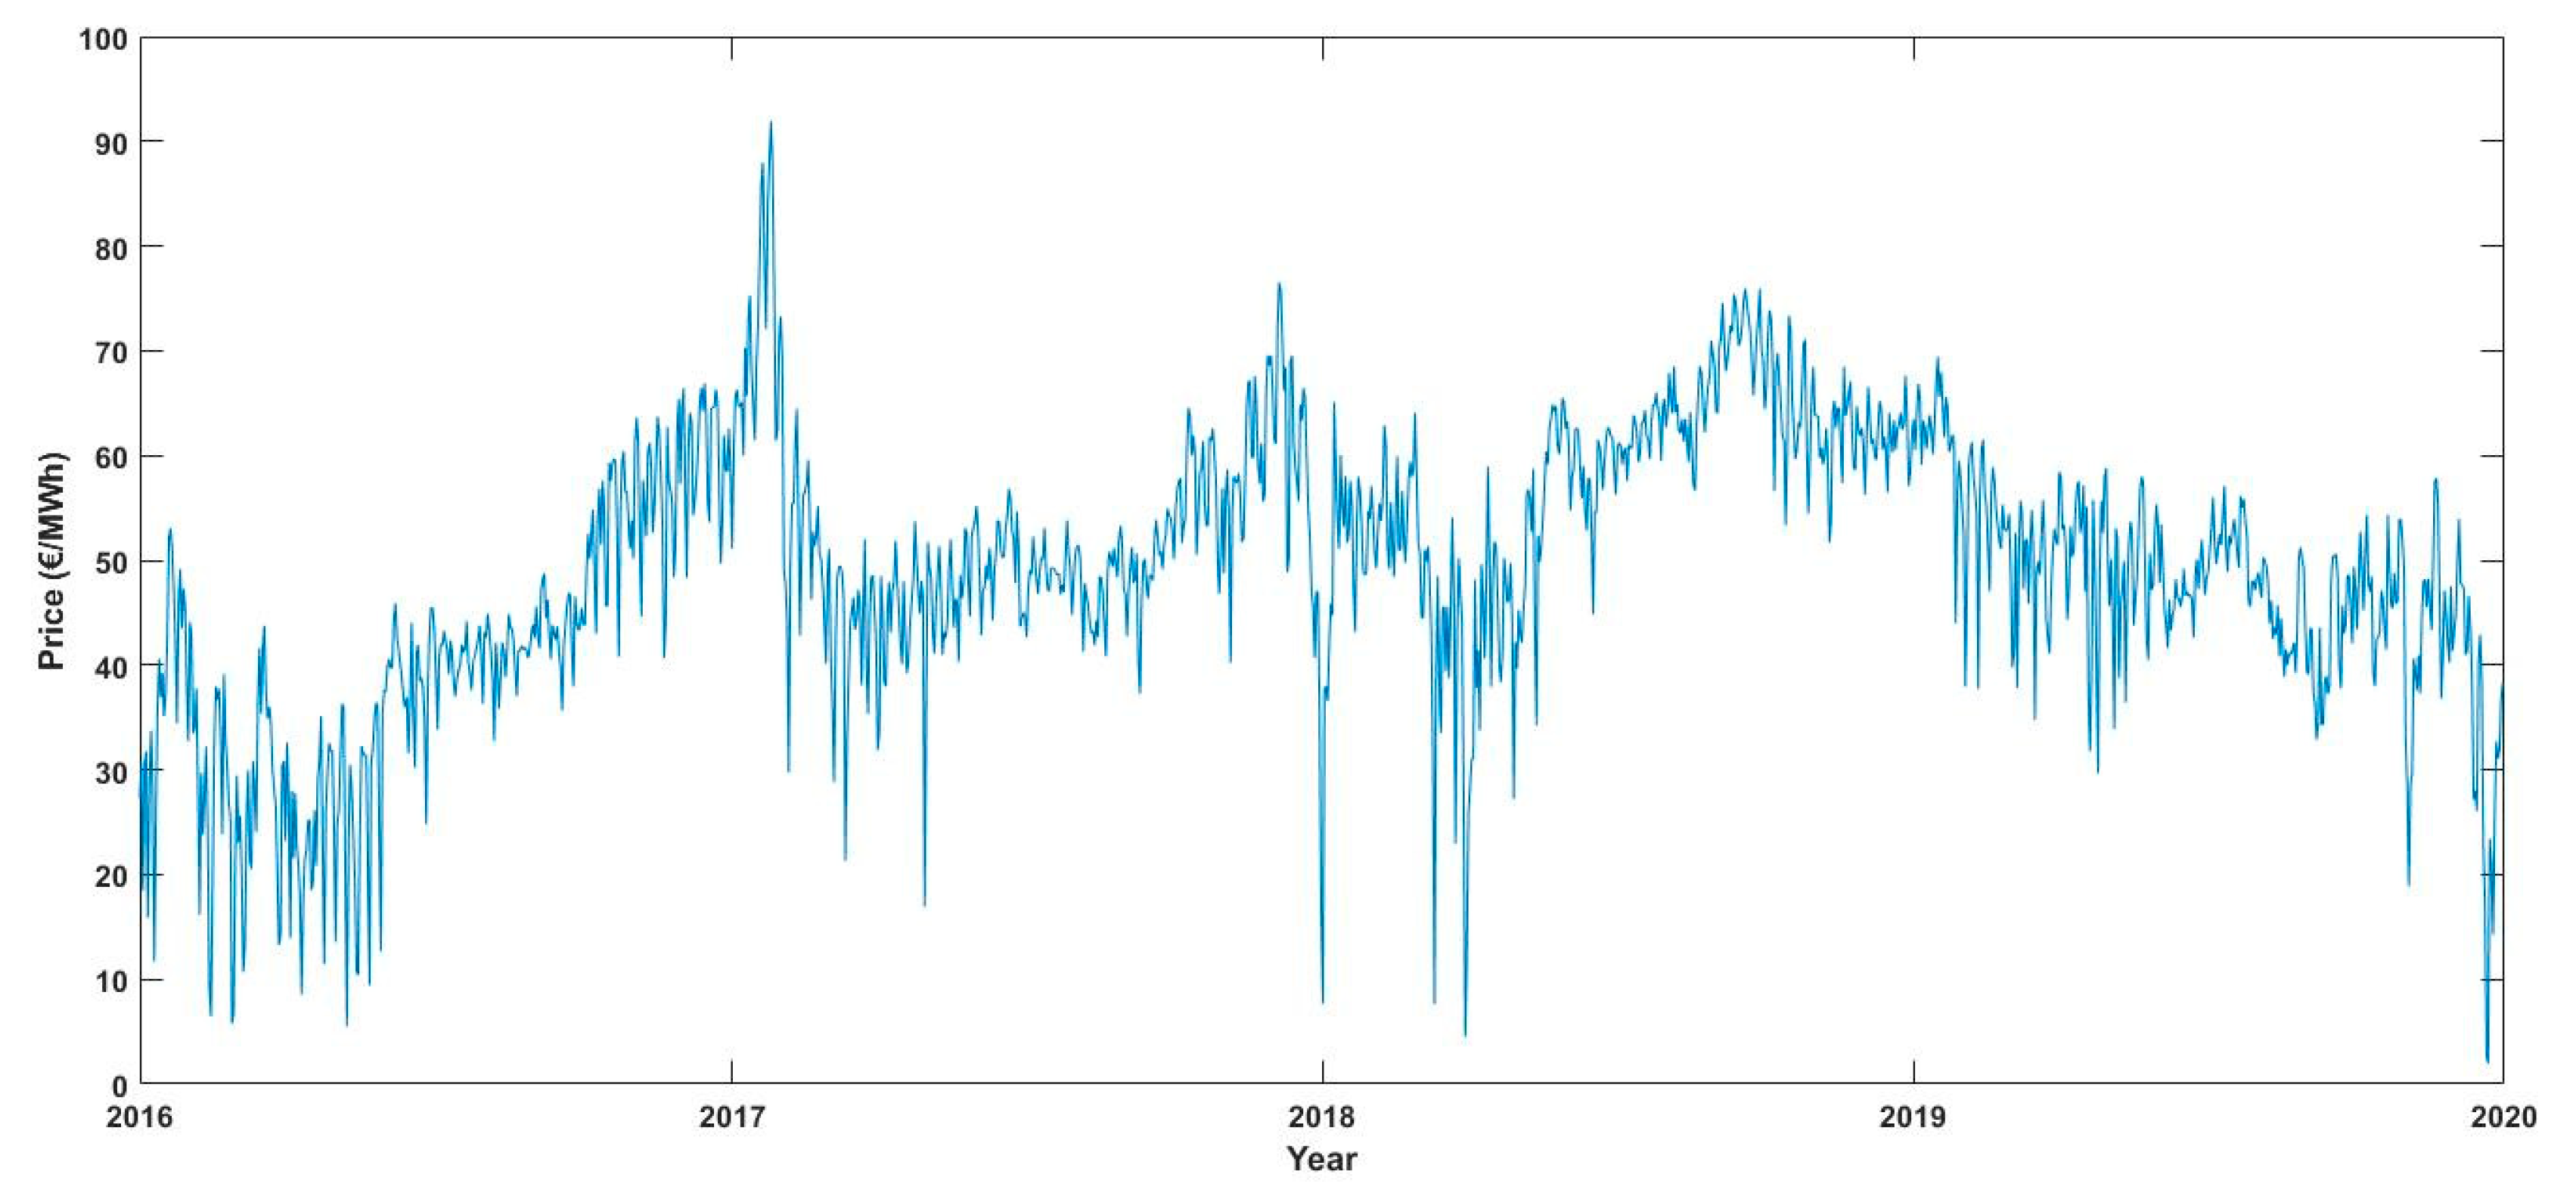
This paper uses spot prices for 1461 days, corresponding to four years (from 2016 to 2019) and 35,064 hourly prices [38]. This Subsection calibrates a stochastic electricity model. Spot prices are readily available, contain a lot of information and have enough liquidity.
It is assumed that companies that own a portfolio of generation assets have no policies that would prevent the maximum profitability of wind farms because of decisions as to which assets generate electricity at any given time. It is also assumed that there is no grid congestion and that wind farms can sell all the electricity it produces.
Figure 5 shows daily Spanish electricity spot prices for four years.

Figure 5.
Spanish daily electricity prices from 2016 to 2019.
Stochastic models of electricity prices include those of Escribano et al. [39], Lucia and Schwartz [40], Seifert and Uhrig-Homburg [41] and Villaplana [42]. We use a modified version of the stochastic model described in [43,44]. In this version we assume that there is no trend but include a non-working days effect.
Equation (1) describes the behaviour of the natural logarithm of spot prices as the sum of two components. The first part shown in Equation (2) is deterministic and contains the annual, semi-annual and hourly seasonality, plus a constant and the weekend effect.
The second part is a mean reverting jump diffusion stochastic part.
Equation (1) describes the behaviour of the natural logarithm of spot prices as the sum of two components. The first part shown in Equation (2) is deterministic and contains the annual, semi-annual and hourly seasonality, plus a constant, the weekend effect ( on non working days and otherwise) and 24 parameters corresponding to hourly seasonality
Table 2 shows the results of the calibration of the six first parameters with daily prices.
Table 2.
Deterministic parameters calculated with daily prices.
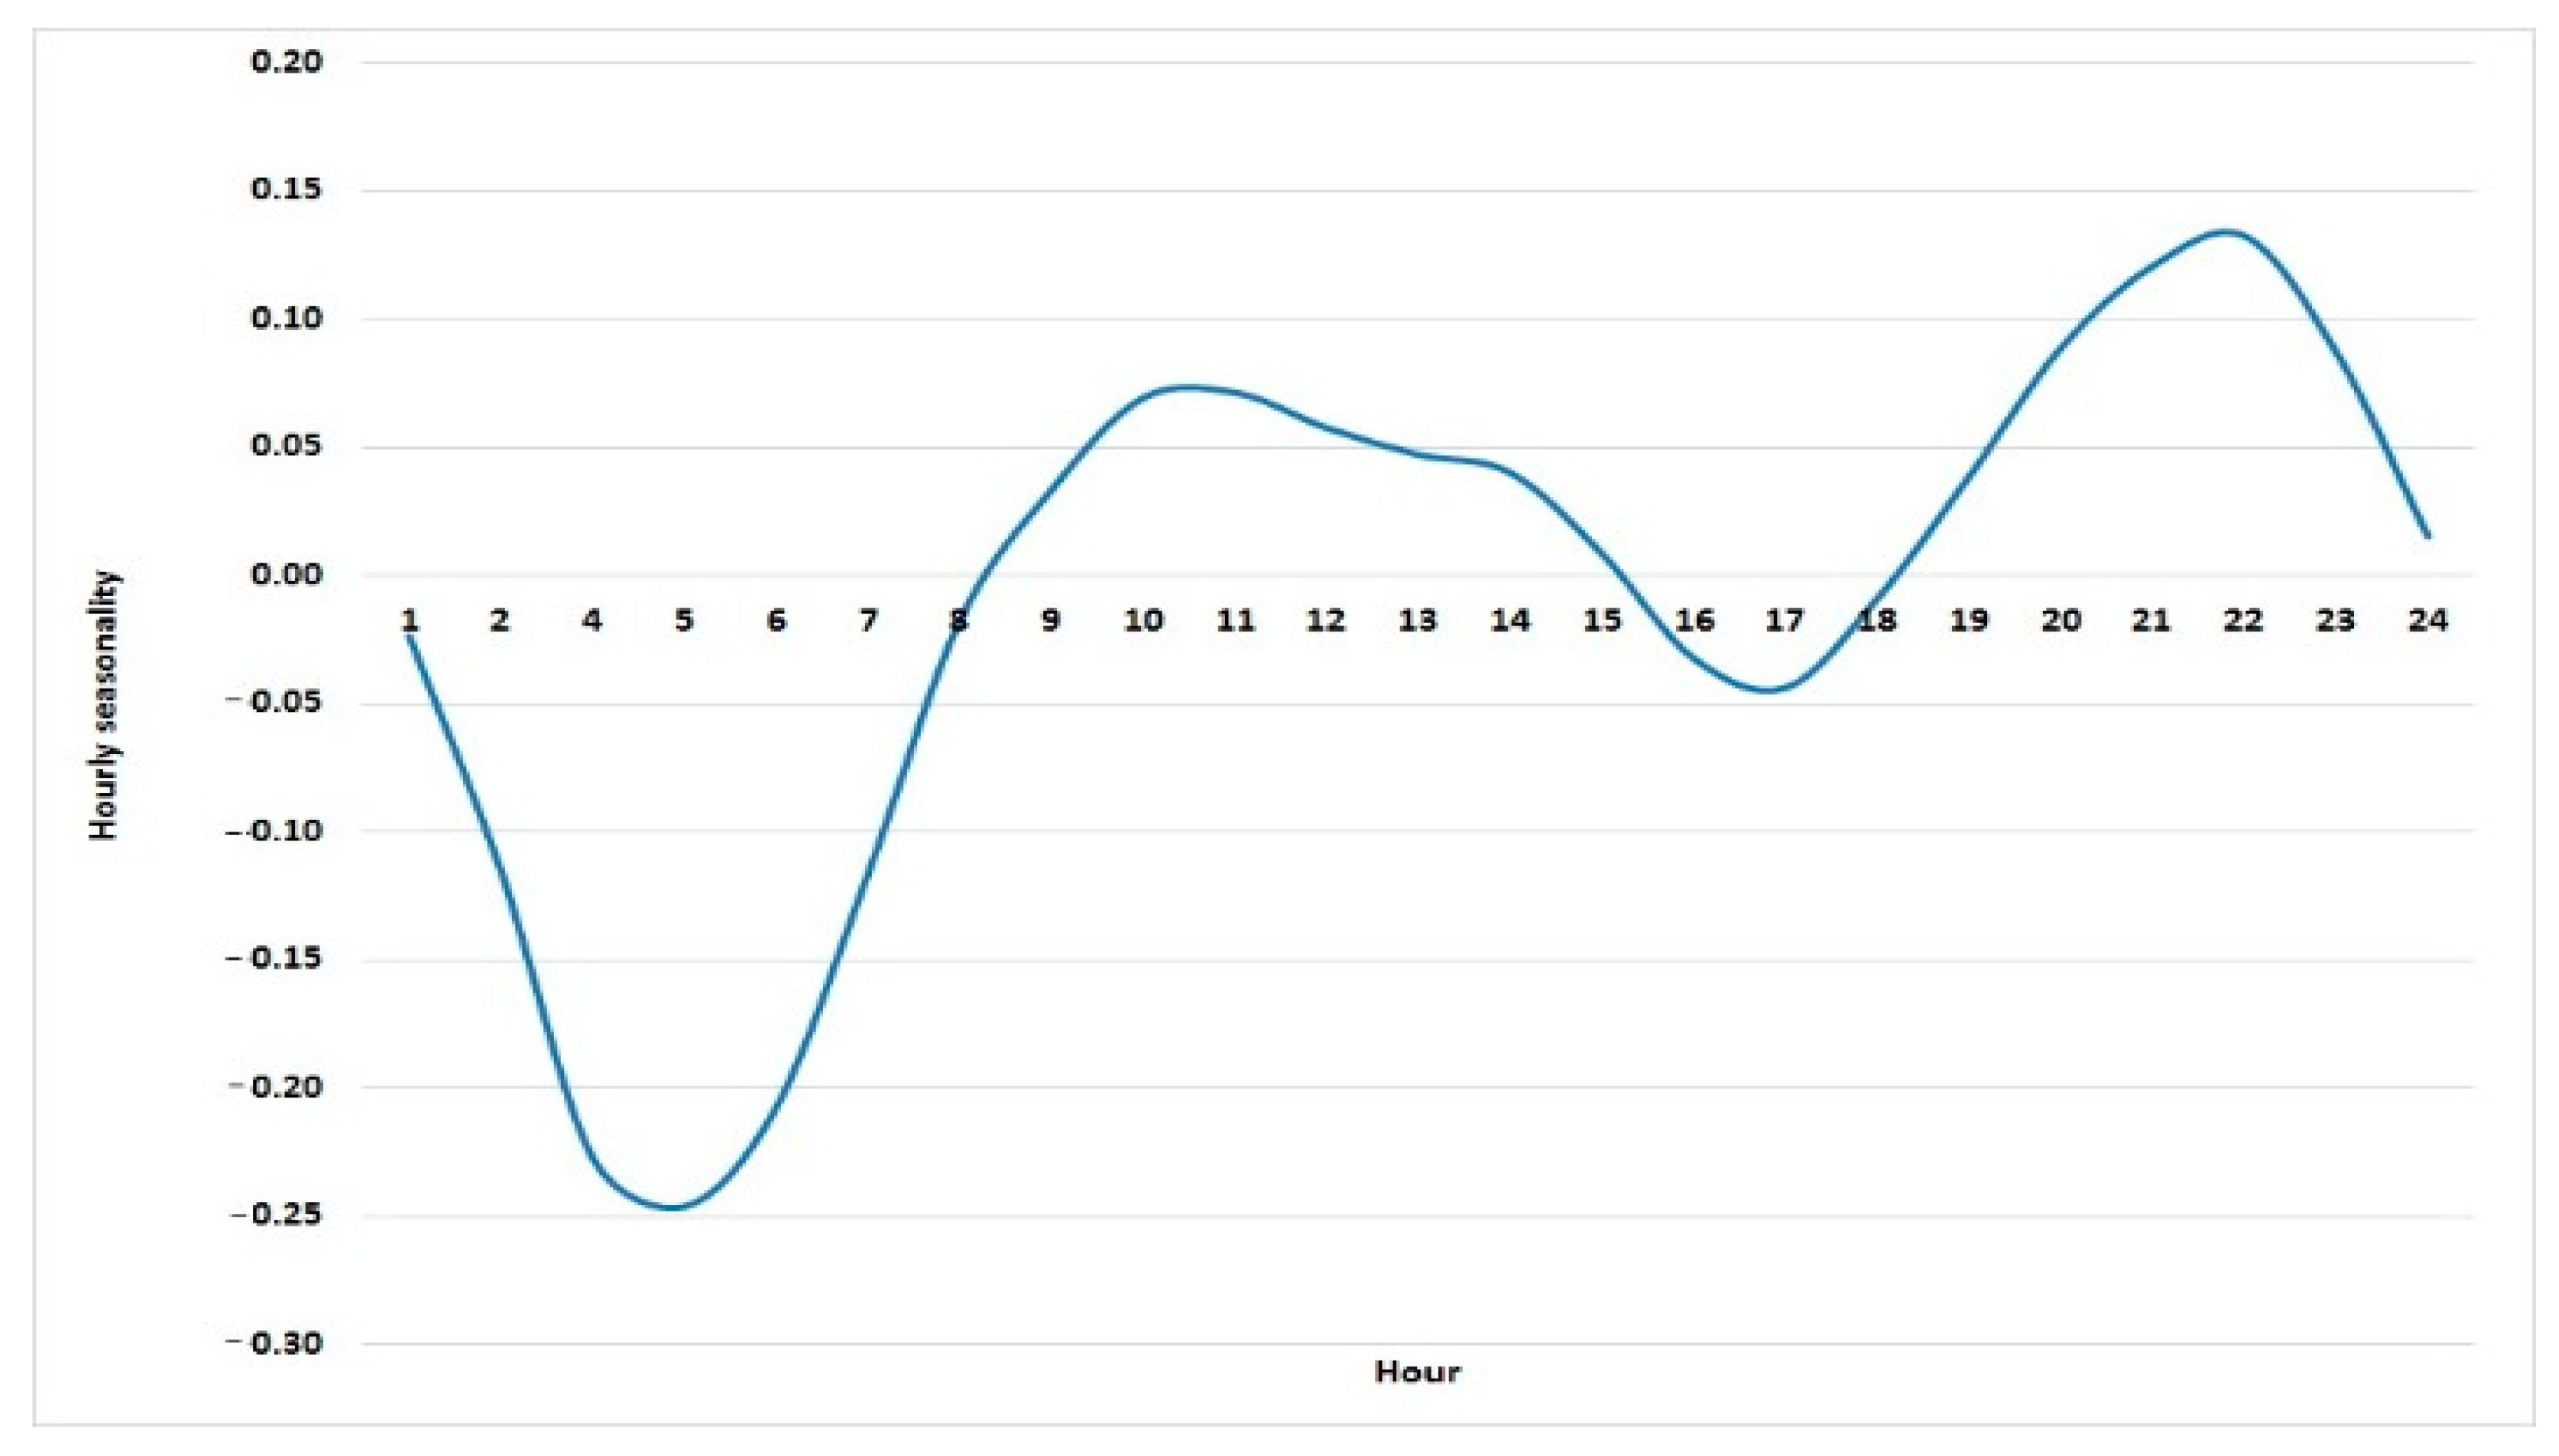
Figure 6 suggests that, all else being equal, wind farms can obtain the most profit if they produce electricity between the range hours from 9 to 15 and from 19 to 24, but that profit also depends on the capacity factor. Table 3 shows the values calculated for hourly seasonality.
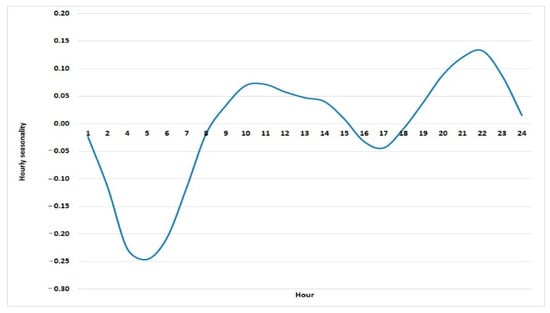
Figure 6.
Logarithm of hourly seasonality in electricity prices.
Table 3.
Deterministic parameters calculated with daily prices.
Equation (3) is the stochastic part of the logarithm of electricity prices. This Equation (3) is an Ornstein-Uhlenbeck mean reverting model with jumps.
The first term of Equation (3) shows that the current logarithm of electricity price tends in the long term to level α/κ, with κ reversion speed. But this behavior is altered by the two stochastic parts. The second term includes the volatility σ of the mean reverting part. The third term of Equation (3) is a Poisson process, if there is a jump its size is normally distributed with mean and volatility . The jump diffusion process intensity is λ, that is = 1 with probability λdt and = 0 with probability 1 − λdt. is the increment to a standard Wiener process.
Equation (3) allows negative values, as the natural logarithm of some low electricity prices can be negative. Using maximum likelihood estimation, the parameter values shown in Table 4 are obtained:
Table 4.
Parameters of Stochastic Equation.
2.3. Monte Carlo Simulation of the Stochastic Electricity Price Model
First the stochastic daily part is simulated and then the deterministic daily part is included with the seasonality (annual and semi-annual), weekend and holiday effects and a constant. The daily series simulated are converted into hourly series by applying the daily seasonality to each daily logarithmic price simulated, so 24 log prices are obtained for each day. Finally, the log prices are transformed into €/MWh prices. 25,000 simulations are obtained for the hours in a year.
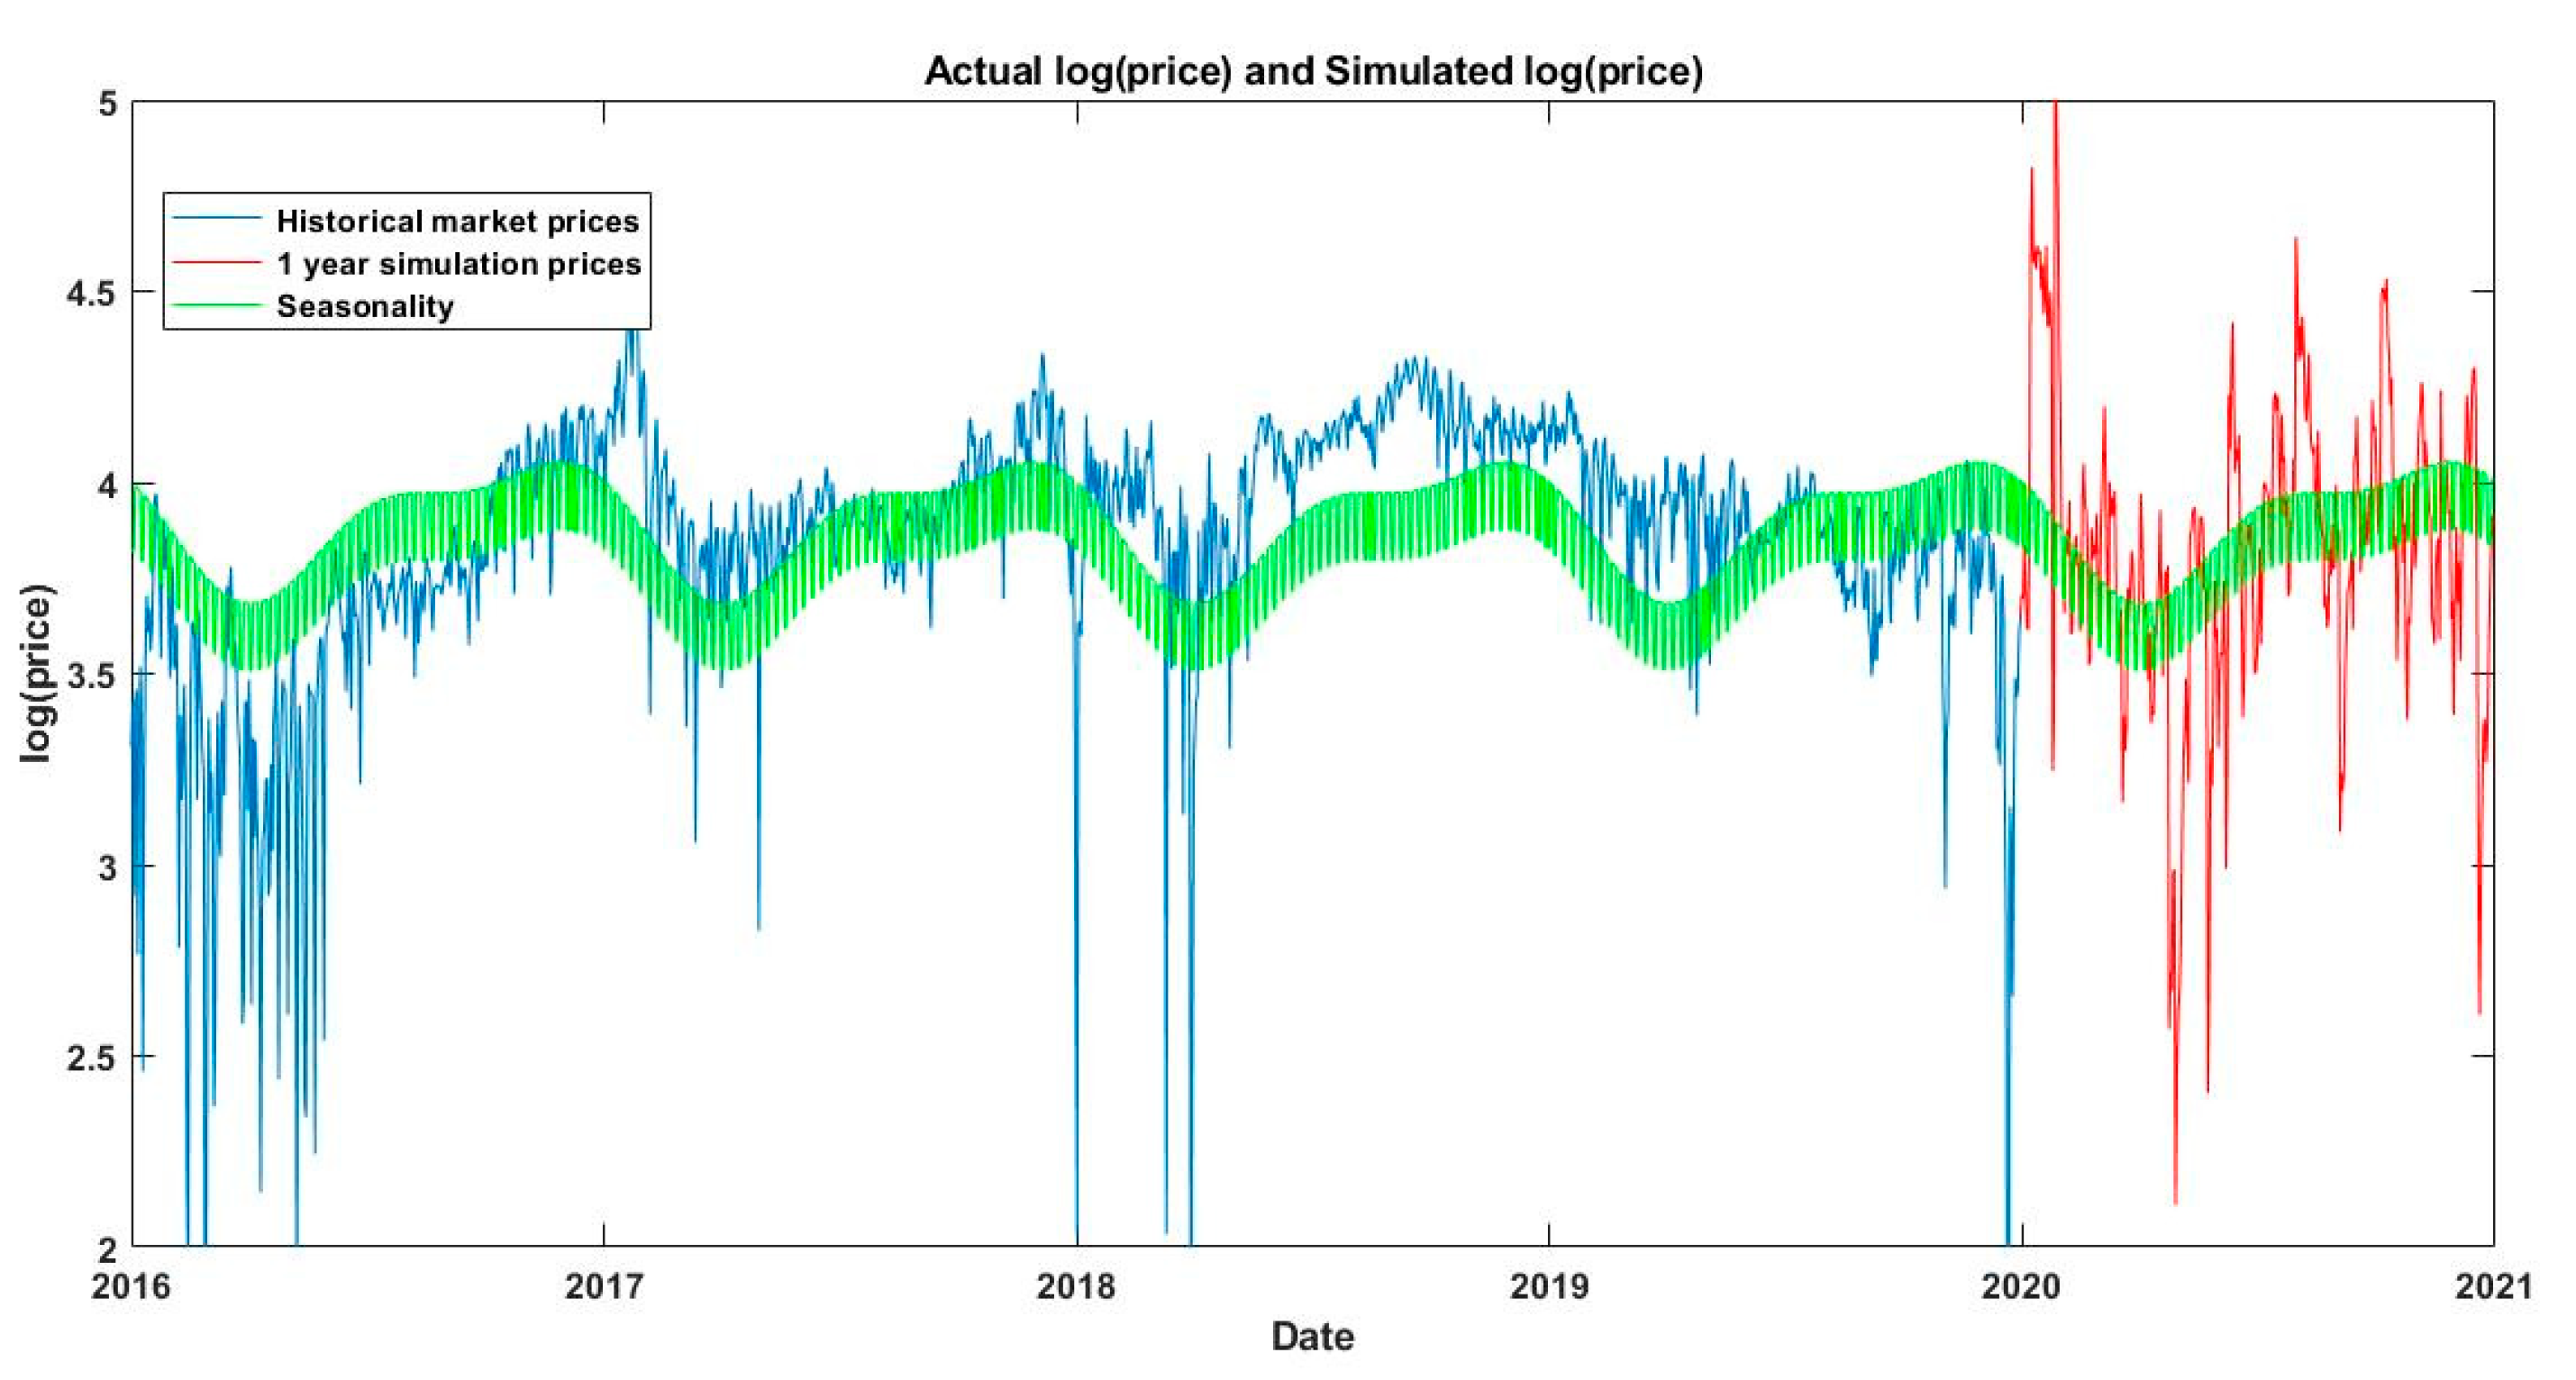
Figure 7 shows the historic path and one simulated path of electricity daily log prices, including their deterministic part.
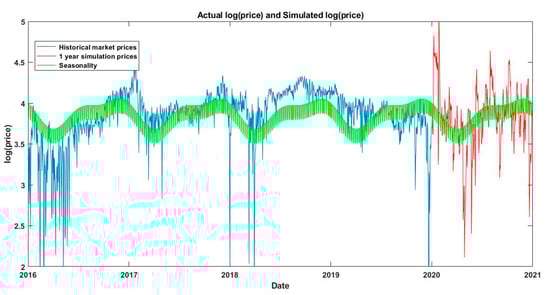
Figure 7.
Historic log prices and one simulated path of electricity daily prices.
2.4. Stochastic Model of Capacity Factor
The capacity factor of a wind farm is stochastic and also has seasonal behaviour depending on the month of year and the hour of the day.
Weibull distribution is used in the wind power industry to describe wind speed distributions, as the natural distribution often matches the Weibull shape. This distribution does not allow for negative values; this is convenient for us here because capacity factors are always zero or higher. We adopt this distribution for the capacity factor.
The Weibull probability density function (PDF) is shown in Equation (4).
where is the scale parameter and is the shape parameter. The cumulative density function (CDF) is shown in Equation (5).
the average is , where is the gamma function.
The daily and hourly electricity output of Spanish wind farms is used to calculate the capacity factor, along with the monthly installed capacity, which is linearly intercalated for the days of each month. With these data 1461 daily capacity factors are calculated. The specific parameters of the monthly Weibull distribution are shown in Table 5. It can be seen that in the electricity system in mainland Spain output is highest in the months from November to April. The mean annual capacity factor weighted by the number of days in each month is 0.2438%.
Table 5.
Wind power capacity factors: parameters of the Weibull distribution.
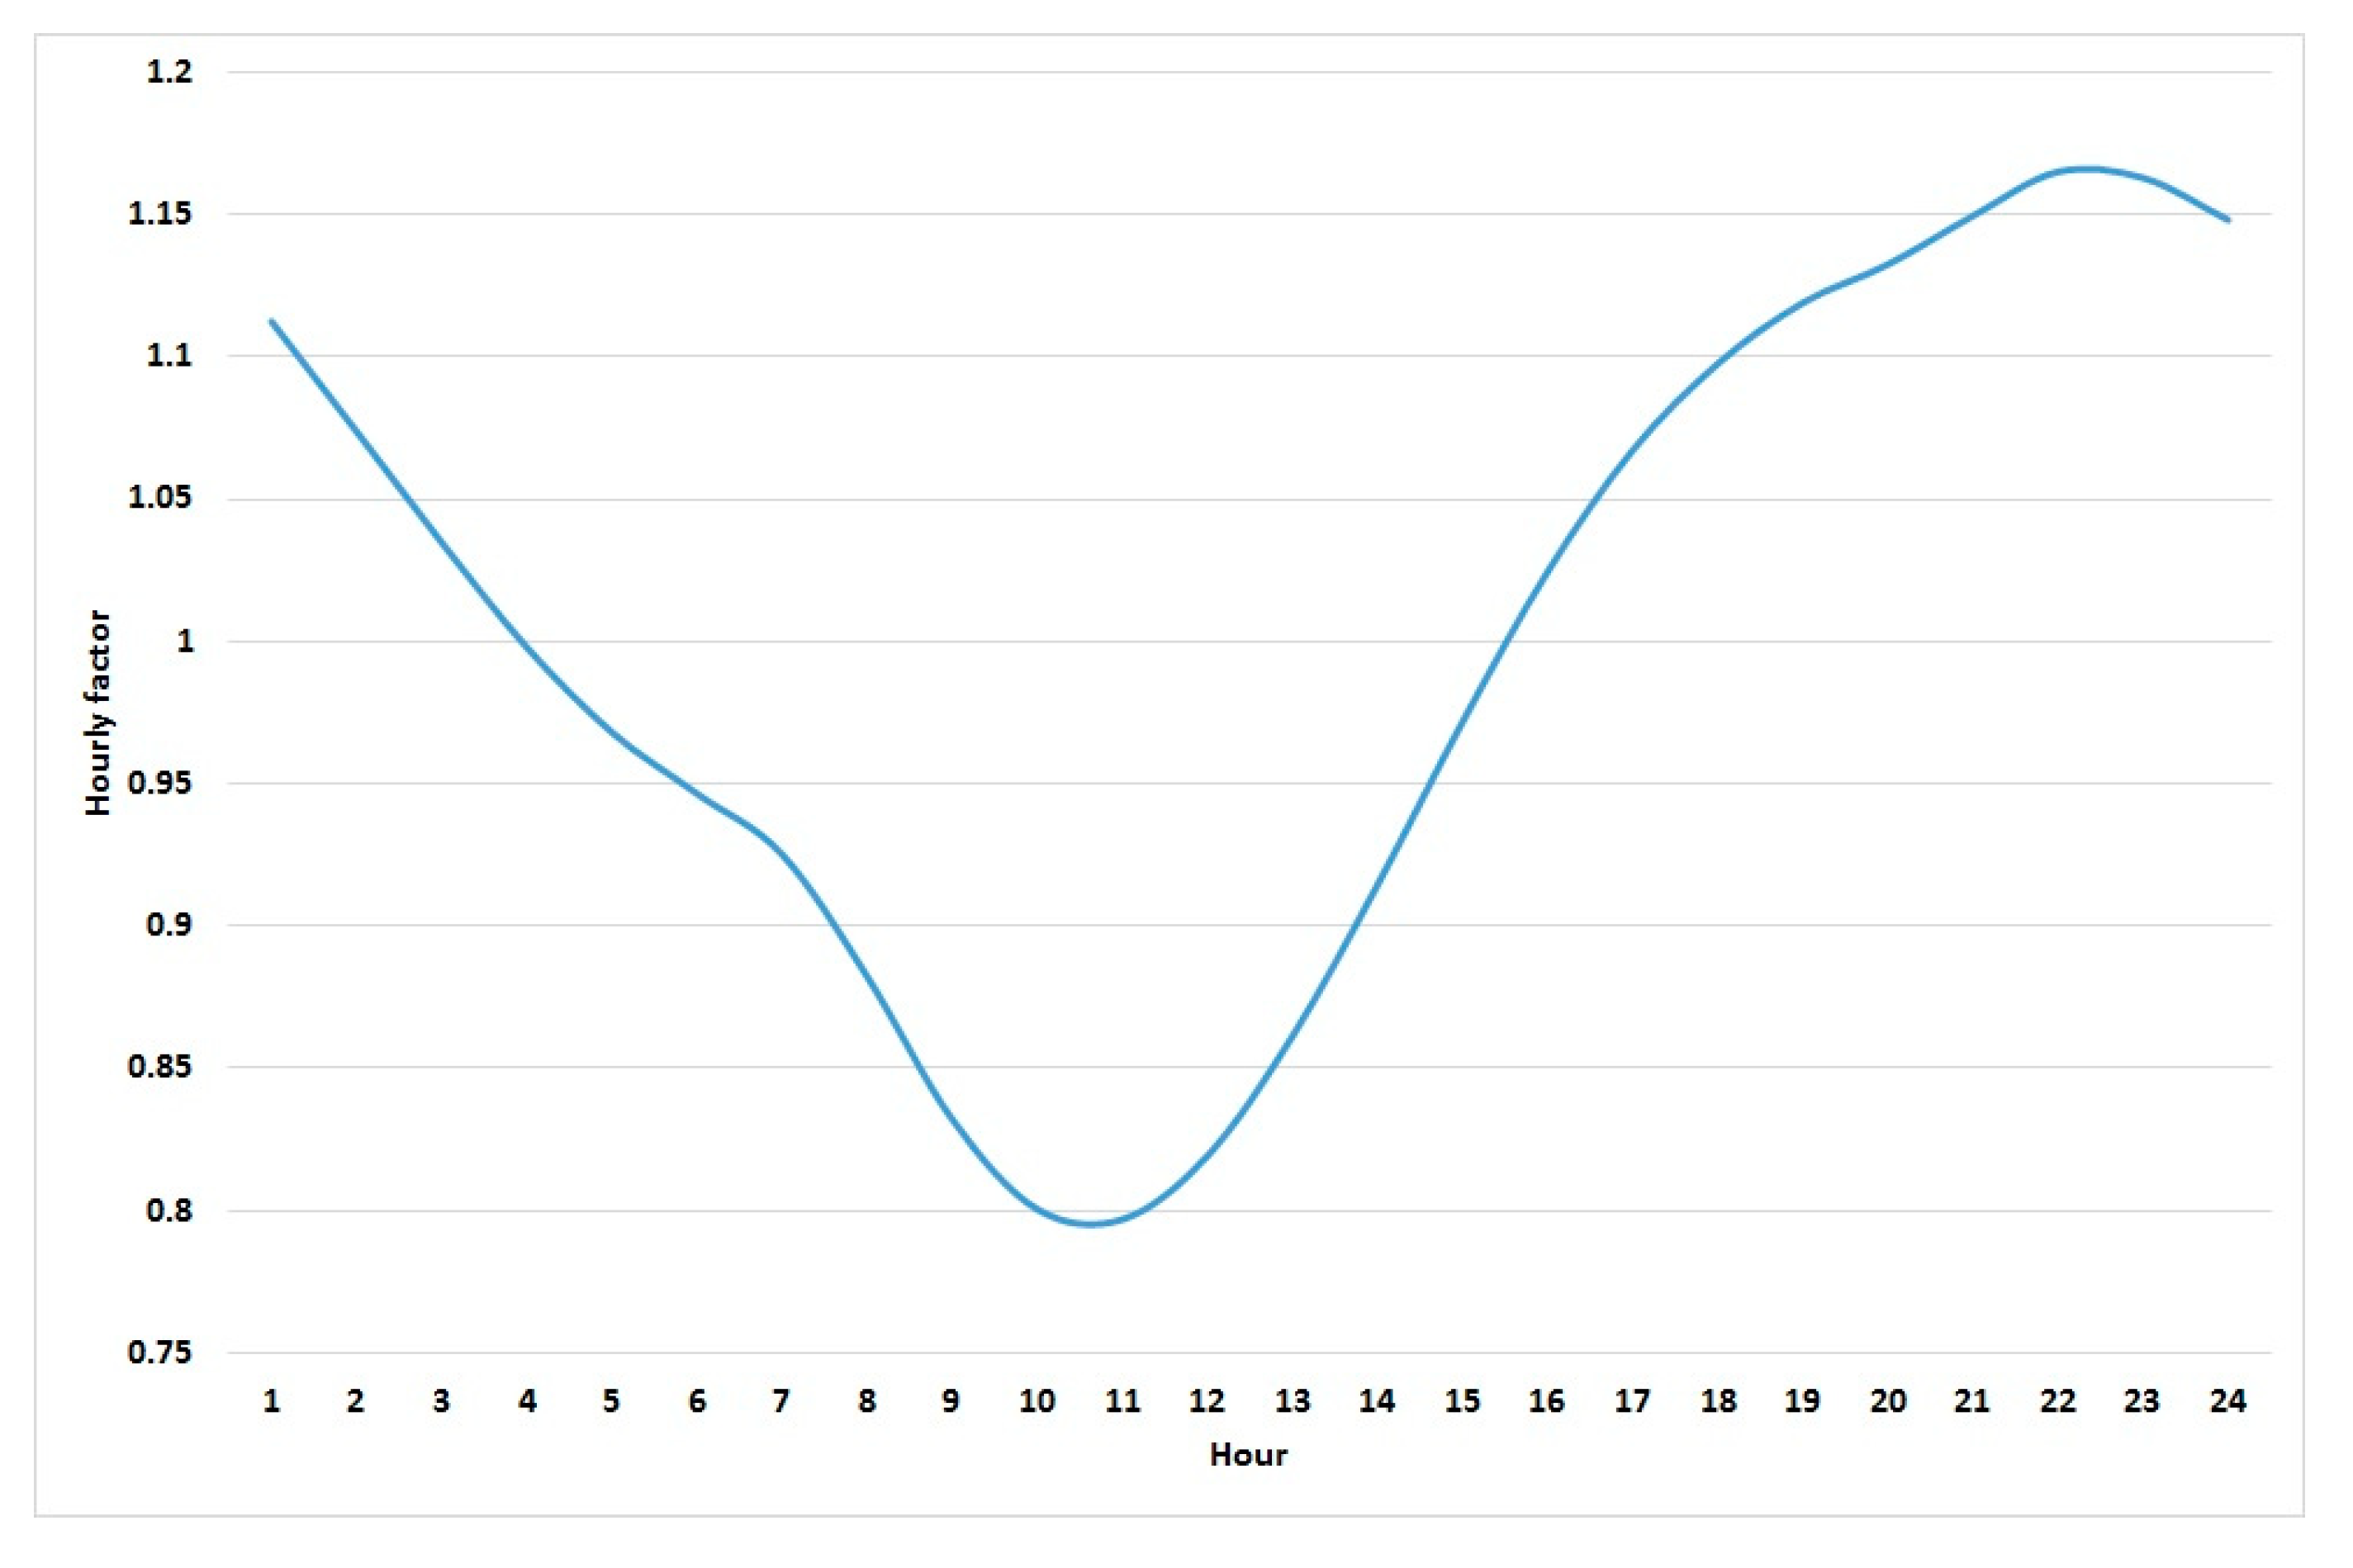
The hourly seasonality factors to be multiplied for the daily capacity factor are shown in Figure 8.
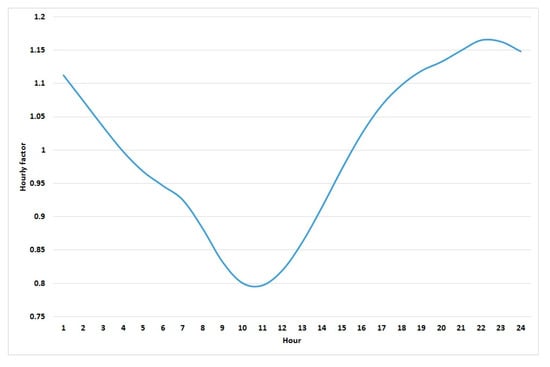
Figure 8.
Hourly capacity factor seasonality.
With the monthly Weibull distributions, 25,000 daily simulations are calculated. These daily simulations are converted into hourly simulations using the hourly factor shown in Figure 8. The simulated mean capacity factor is 0.2439, very near to the actual figure of 0.2438.
The relevant literature recognises that turbines behave like any other rotary machine, in that as they age their annual energy output decreases and consequently so does their load factor (also known as capacity factor, the average power output divided by its maximum power capability). Note that the capacity factor is calculated with real data and the Betz´s law sets the maximum theoretical limit of energy that can be extracted annually. A linear form of load factor decrease is assumed in [45]. These authors analyse the UK’s 282 wind farms and find that the capacity factor falls by 1.57% (0.41 percentage points per year). In this paper we use the ageing decline calculated by these authors, i.e., d = 0.16 per year for old farms. Staffel and Green [45] analyse the decline in capacity factor of the UK’s new turbines. They find that new-generation turbines also decrease but at a lower rate of 0.4–1.1% per year. That estimate is consistent with Germer and Kleidon [46], who study the current turbines in Germany and find a performance decrease of 0.63% per year. This paper assumes an average ratio of 0.75% per year for new turbines, d = 0.075. On the other hand, Hamilton et al. [47] study changes in wind project performance with age in the United States and find a lower level of performance decline than in Europe, specifically 0.6% per year.
2.5. Technical, Economic and Capacity Factor Specifications of Wind Turbines
2.5.1. Wind Turbines Installed
During the implementation of the Spanish Renewable Energy Plan (PER) for 2005–2010, the turbines installed increased from an unit power rating of 580 kW in 1999 to about 1100 kW in 2007, with rotor diameters between 52 and 80 m and hub heights between 55 and 80 m. The average size of wind farms also rose to around 25 MW in 2005. The current trend is to install 3–5 MW wind turbines with rotor diameters of 130–150 m and hub heights of around 100 m. For this study we therefore selected a prototype wind farm built in 2005 consisting of 30 Gamesa G-52/850 kW IEC class Ia turbines (Alava, Spain). This was the second most widely installed turbine model in Spain around 20 years ago and it currently accounts for nearly 20% of the turbines to be repowered in Spain [28]. The total installed power capacity of the wind farm is 25.5 MW. It has been producing electricity for fifteen years and as it nears the end of its lifetime it faces two options: life-extension or repowering.
The characteristics of the wind farm considered for repowering are set out in Table 6, which shows four main parameters of the machine: the installed capacity, the capacity factor, operational expenses (Opex) and decommissioning expenses (Decex). The useful life recognised in the wind industry for any turbine is twenty years.
Table 6.
Case 1—Characteristics of the old turbines installed (Gamesa G-58/850).
The capacity factor depends on the wind, on unplanned down time, on the turbine’s power curve and consequently varies from day to day. The literature gives various capacity factors, such as the figure proposed for the Gamesa G-850 kW (Alava, Spain) by Albani and Ibrahim [48] of 21.7%. Lacal et al. [49] analyse technological effects in wind turbine repowering in Denmark and Germany and give an average capacity factor of around 22% for turbines removed in 2015 and 42% for newly installed ones. Ramírez et al. [28] also study Spain’s wind power output, analysing different turbines at different sites including Gamesa G-850 kW turbines (Alava, Spain), and propose 23.4% in the Valencia region. All this is in line with the conclusions of Staffel and Green [45]: the average factor of a turbine can drop from 28% when new to 21% at the end of its lifetime. Here, we assume a capacity factor of 21.7%.
The literature uses different units for calculating O&M expenses (€/AEP, €/capacity, €/turbine) and different values. This data spread is due the fact that factors such as weather conditions and wind variations may differ significantly in specific locations, so the same equipment wears differently (constant laminar flow or gusty turbulent flow affects maintenance expenses). It also depends on the GDP of the reporting country, and perhaps even on whether data is reported by the owner or a consultant. It is also important to know what is classed as O&M costs. In the wind industry Opex is usually considered as the sum of expenses related to the turbine O&M and the expenses related to non-turbine technical expenditures such as land rental, insurance, administrative expenses, taxes and electrical grid connection. Wiser et al. [17] find, based on an industry survey, that these two drivers each account for close to 50%. This is in line with the assumptions in the PER when Gamesa G58-850 (Alava, Spain) wind farms were commissioned: O&M costs account for 57% of the total Opex and the rest comprises insurance and taxes (16%), land rental (14%) and general and administrative expenses (13%). Reporting Opex and not just O&M is very useful due to its connection with LCOE. Hand [50] overviews the European Union’s wind turbine development and proposes €28/kW per year of pure O&M expenses, so the average Opex is double that figure at €56/kW. This is consistent with the Opex of €55.1/kW reported by Ziegler et al. [26] in analysing onshore wind turbines in Spain.
In case of decommissioning or total repowering, wind farms must be dismantled, so in such cases Decex has to be taken in account. However, there are materials that can be recovered and recycled, and some machines can be reused in the second-hand market. For Spain the investment cost in 2007 was found to be around €1233/kW and the Decex was 3% of investment. This works out at €37/kW. Schwarz and Badia [51] study the costs and opportunities of decommissioning wind farms. To calculate the Decex they analyse decommissioning reports from three different countries: six in Germany, two in Spain and one in Romania. They find that the average cost is €50,000 per turbine and that there is not much discrepancy between different European countries. This means an estimate of around €55/kW. Rubert et al. [21] assume that Decex works out at zero due to income from scrap value. Jensen [52] analyses impacts of recycling wind turbines and affirms that 90% of the components are recyclable and revenues are heavily linked to the scrap material market. Colmenar et al. [25] acknowledge costs of €67.5/kW for pure dismantling and waste disposal cost and a turnover from recycled materials of 25.9, so the net dismantling cost is assumed to be €41.6/kW.
2.5.2. Life-Extension Options: Reblading, Gearbox and Electronic Control Unit Retrofitting
Blades and gearboxes have historically been considered as the parts that wear out the fastest [53]. Echavarria et al. [54] also find that these components are replaced more often than others. An interesting target for extending the life of turbines is replacing the electronic control unit. Advanced control algorithms and the latest sensors not only improve reliability and reduce down time but also increase the performance of turbines and provide predictive maintenance [16]. Thus, this paper analyses these three life-extension options. Retrofitting is intended to improve the capacity factor of wind farms, and AEP increases as a result in the retrofit life-extension time. In any event, investment clearly needs to be lower than the increase in income. In addition, retrofitting brings improvements in unexpected O&M costs and lower failure rates.
IRENA [55] gives a Capex breakdown of a wind turbine: the rotor blades account for 22% of the cost and the gearbox is the third most expensive component at 13%. These data can be used to estimate the Capex of replacing the blades and gearbox considering the current turbine price of €990/kW [56]. The figures obtained are €217.8/kW for blades and €128.7/kW for the gearbox. The range of Capex for reblading shown in the literature is quite wide, possibly due to the different blade lengths assumed (30–80 m) or to differences in aerodynamic profile design. The figures found in the literature include €129/kW [16] and £178,920 per wind turbine [57] (which works out to €233/kW at the exchange rate on August 2020 of 0.9008) and $200,000 [58]. A reasonable average value would be €110–140 K/WTG (personal interview). Wind turbine blades are exposed during their lifetimes to damage that can compromise efficient operation. Reasons for replacement may include by bird impact, lightning strike, cracks related to temperature gradient and, above all, wear over time due to leading edge erosion. Table 7 shows the reblading retrofit parameters assumed here.
In a typical multistage planetary gearbox, the main faults that may be expected are those related to the degradation and breakage of the gears and pinions [59]. Large numbers of moving parts combined with enormous torque forces can result in bearing failure caused by bending fatigue or plastic deformation. The Capex for a new gearbox and its replacement is assumed to be £110,760–184,600/WTG [57], which translated to an average of around €193/kW. We assume an initial figure of €128.7/kW, which is consistent with the figure of €135.29/kW obtained in a personal interview. Table 7 summarises the gearbox life-extension parameters.
Electronic control unit technology has improved in the last ten years, and its Capex has decreased considerably. The Supervisory, Control and Data Acquisition system (SCADA) manages and controls the turbine, seeking to keep the capacity factor as high as possible, by means of different functions such as pitch, torque and yaw control. The system also controls essential parameters for correct preventive maintenance and predicts incidents such as overheating, thus decreasing failure rates. Table 7 reflects these improvements.
Table 7.
Parameters assumed for each life-extension option.
Table 7.
Parameters assumed for each life-extension option.
| Parameter | Reblading Retrofit Parameters (i = reb) | Gearbox Retrofit Parameters (i = gea) | Electronic Control Unit Retrofit Parameters (i = ele) |
|---|---|---|---|
| €129/kW [16] | €128.7/kW [55] | €32.88/kW [16] | |
| 10 years [60] | 10 Years | 10 years | |
| 20% [61,62] | 3% | 2% [63] | |
| −€5/kW [61] | −€6/kW | −€2/kW [64] |
2.6. The Total Wind Farm Repowering Option
For total repowering, we consider the replacement of old wind turbines by new-generation Vestas V 150-4.2 MW IEC III/IECS units (Madrid, Spain) equipped with 73.7 m long blades. The worldwide average capacity factor has increased considerably in the last thirty years, and it is not unusual for a sample from a country to be above 30%. The U.S. Department of Energy proposes an average capacity factor of 41% for the U.S., and Lacal et al. [49] assume 41.1% for recently installed turbines in Denmark. Looking at Spain, Irena [65] recognises an increase of 16% (from 27% to 33%) in the weighted average capacity factors for new onshore wind projects from 2010 to 2016. This figure is in line with Hand [50], who reports 35%.
The Capex of turbines has fallen by 50% in the last ten years [65]. Blanco [19] confirms the turbine price in Europe in 2009 as €1100–1400/kW and Bloomberg NEF [56] gives an average price of around €1600/kW in Europe in the same year and a current turbine price of €990/kW. The Capex of the turbine selected is around €687/kW (personal interview) in Spain.
Current O&M estimates vary depending on the source, but most references recognise that there has been a substantial decrease due to more mature wind technology and improvements in O&M practices, resulting in improvements in Opex. Hand [50] estimates an improvement in O&M in Europe from €27/kW in 2008 to €22/kW in 2018. Here, we use the Opex data proposed by Wiser et al. [17], who reports $40/kW per year for projects built in 2018. This works out to €33.8/kW. When determining the future Decex for the Vestas turbines, we assume that there is no variation in costs in the next twenty years. In the repowering option we take into account the Decex for both the old and new wind farms. The technical and economic characteristics of the new machine are shown in Table 8. These deterministic costs are shown per MW installed and year in Figure A1 of the Appendix A.
Table 8.
Case 5: Turbine characteristics for full repowering (Vestas V 150-4.2).
In full repowering one can either maintain the old total installed power capacity or increase it. Villena et al. [30] present the main wind farm repowering projects executed in Europe, in which it can be observed that the total installed capacity has been substantially increased in almost all cases. Averaging out all those cases reveals a power increase of around 200%. If the switch from old to new turbines is done in a staggered manner and according to a properly designed schedule it can take as little as two months (personal interview). During that time the turbines are not producing electricity.
3. Results
3.1. Income in the Current Year
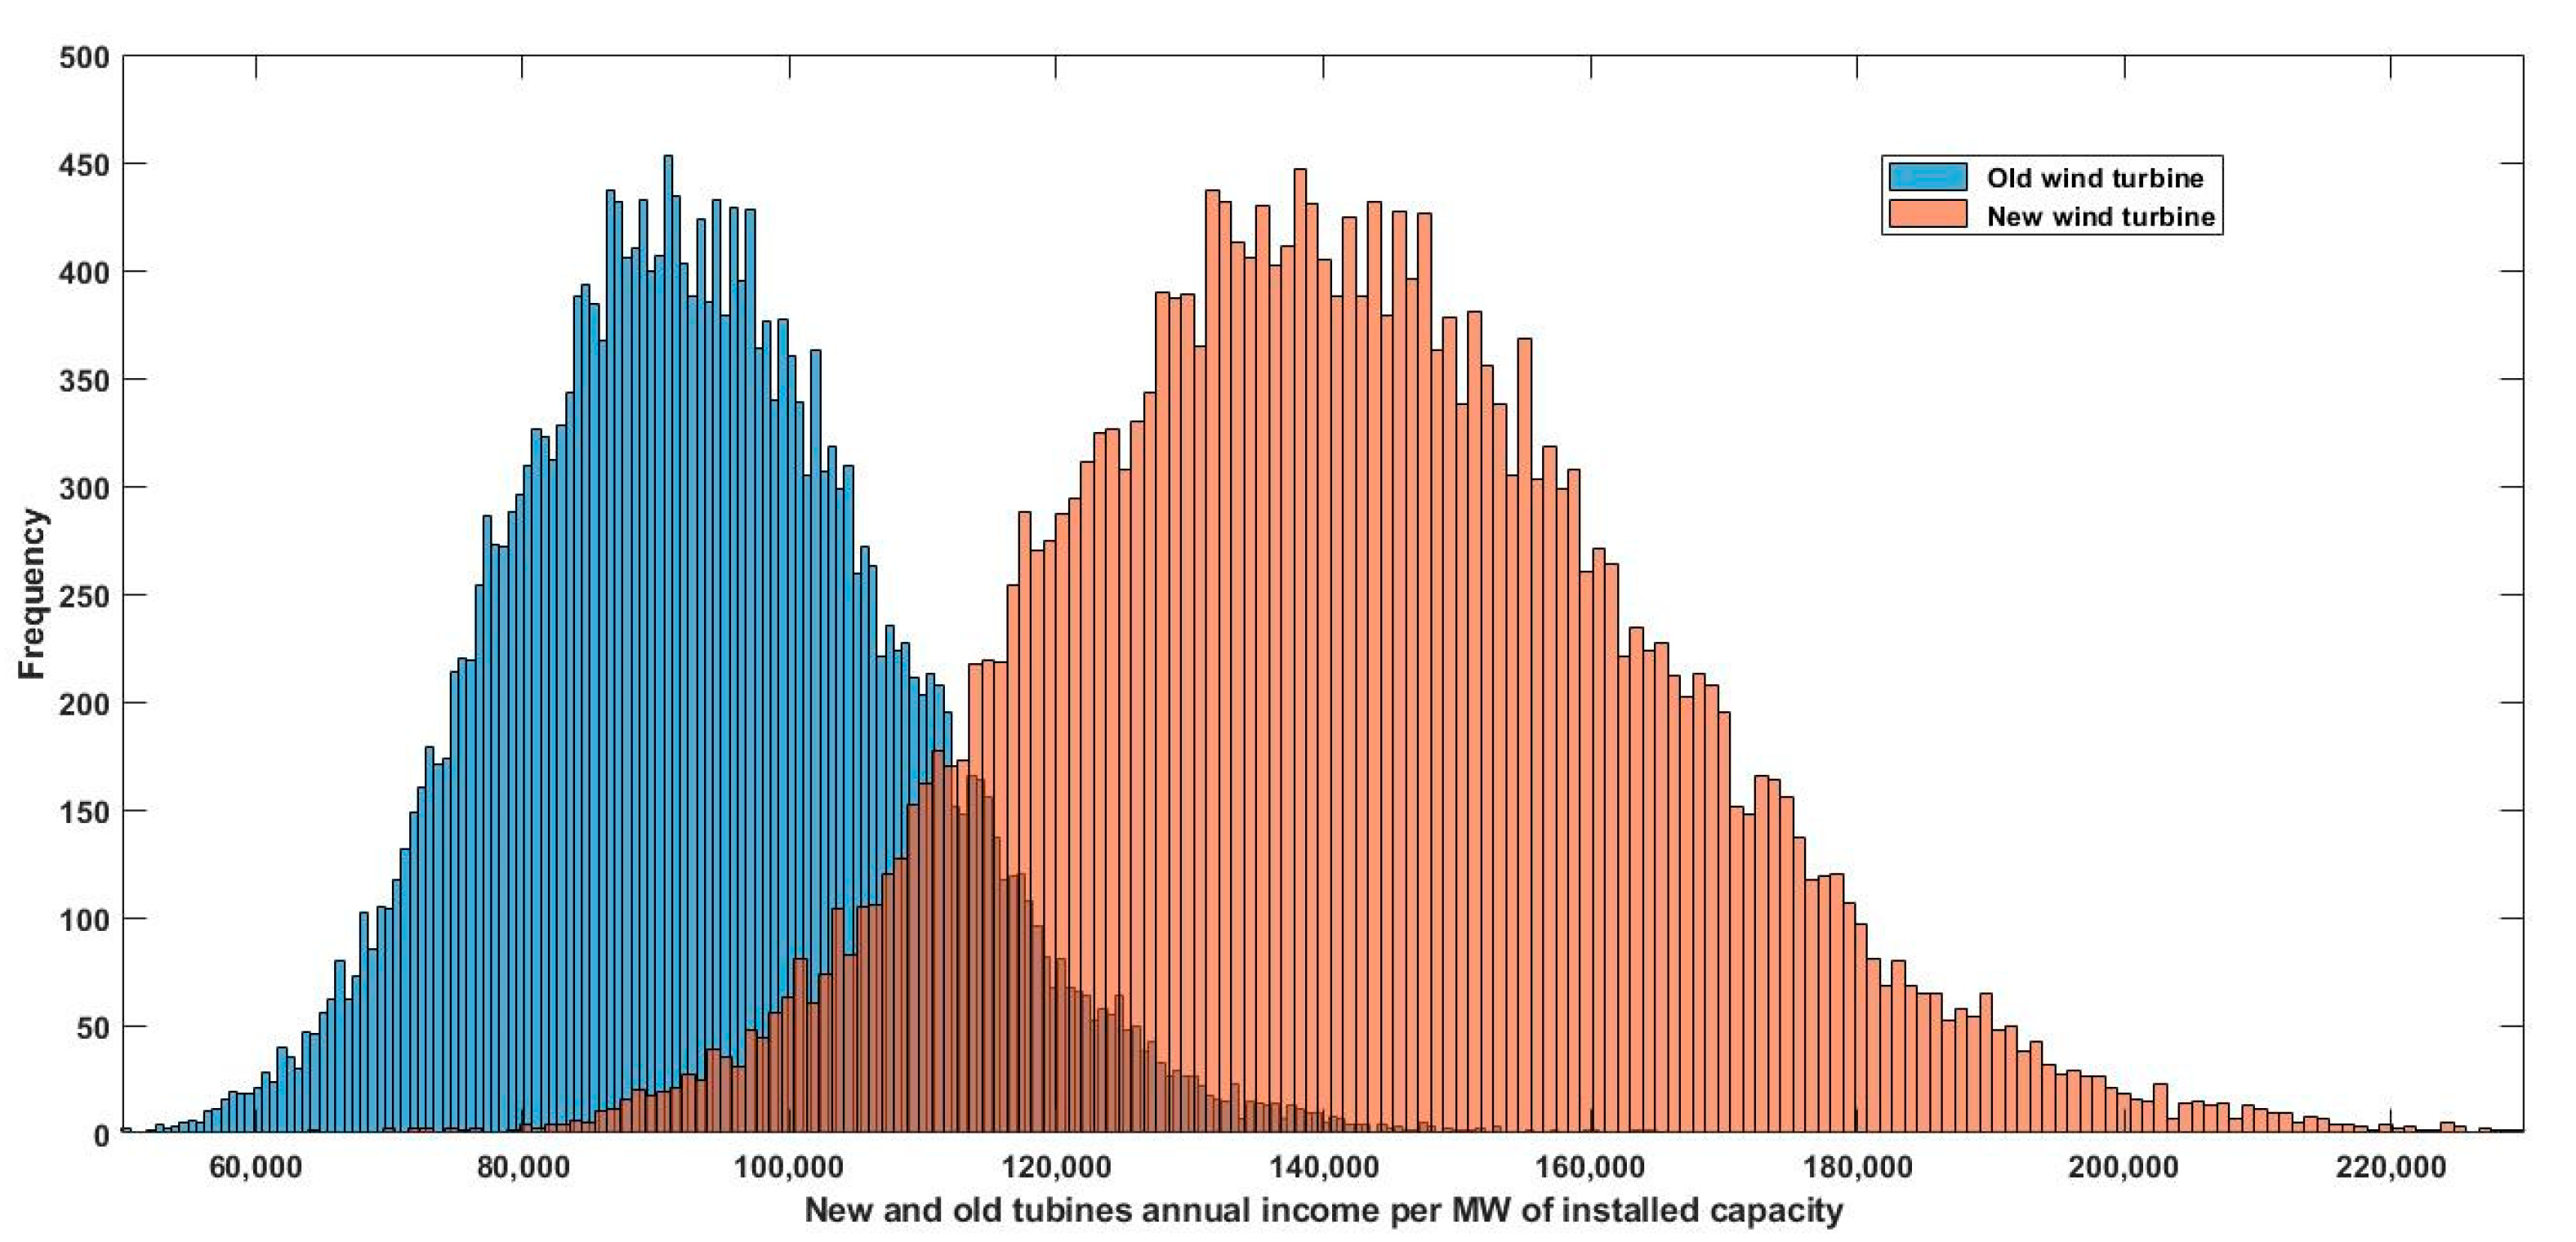
For the old wind farm it is assumed that the capacity factor figures behave as the simulated values do, multiplied by a factor of 21.7/24.39; for the new wind farm the factor is taken to be 33.0/24.39. Calculating the income and accumulating for each path, the annual expected values and distributions shown in Figure 9 are obtained per MW of installed capacity.
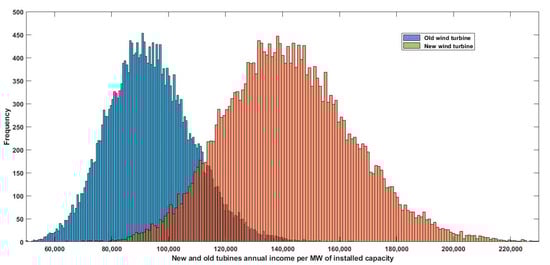
Figure 9.
Annual income per MW of installed capacity for new and old turbines.
Table 9 shows some statistical distributions in thousands of Euros per year and MW of installed capacity. The expected figure for an old turbine is €93.66 K and for a new one €142.43 K. In 80% of cases the annual income is between €75.43 K and €113.07 K for an old turbine and between €114.71 K and €171.95 K for a new one.
Table 9.
Income (k€) per MW of installed capacity.
3.2. Assessment of the Five Alternatives
Table 10 sums up the five alternatives with their corresponding parameters.
Table 10.
Parameters for all options.
Equation (6) shows the present value calculation for installed MW in all five cases. The certain flows, according to financial theory, must be discounted at the risk-free rate (in this case the rate of German 10-year debt) but this figure was −0.25% in 2019 [66]. Consequently, a null discount rate is chosen for certain flows. Because of this, the Capex, Decex and Opex are not discounted in this Equation.
However the electricity price is stochastic and the income must be discounted at a rate r that takes into account the market price of risk. A comparison of current values with future values as of 25 December 2019 [67] gives the discount rates shown in Figure 10. A figure of r = 0.027 is taken as representative for the remaining lifetimes of the five options.
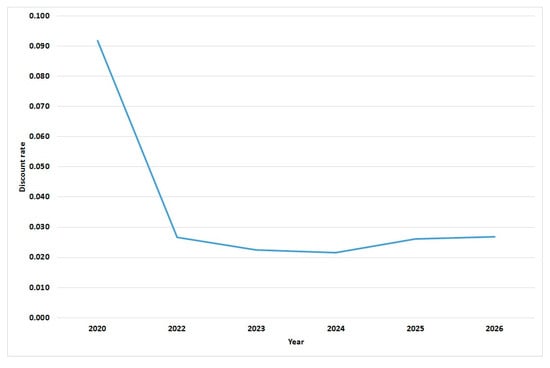
Figure 10.
Discount rates for electricity prices.
In Equation (6), is the annual income of the first production year before any possible effect of life-extension. Such effects are included using the multiplier The deterioration of the capacity factor over time is taken into account using the multiplier .
Table 11 shows the Net Present Value (NPV) results. It must be also taken into account that in some cases full repowering can double the capacity of a wind farm. The Appendix A, Figure A2 shows the breakdown of income by years. The expected yearly MWh production is shown in the Appendix A, Figure A3.
Table 11.
Net Present Value calculation (€).
In the full repowering case the useful lifetime is 20 years, but the NPV calculation is identical to a method in which the facility is sold for its residual value in year 10, because the effects of accounting and tax treatment on cash flows are not considered.
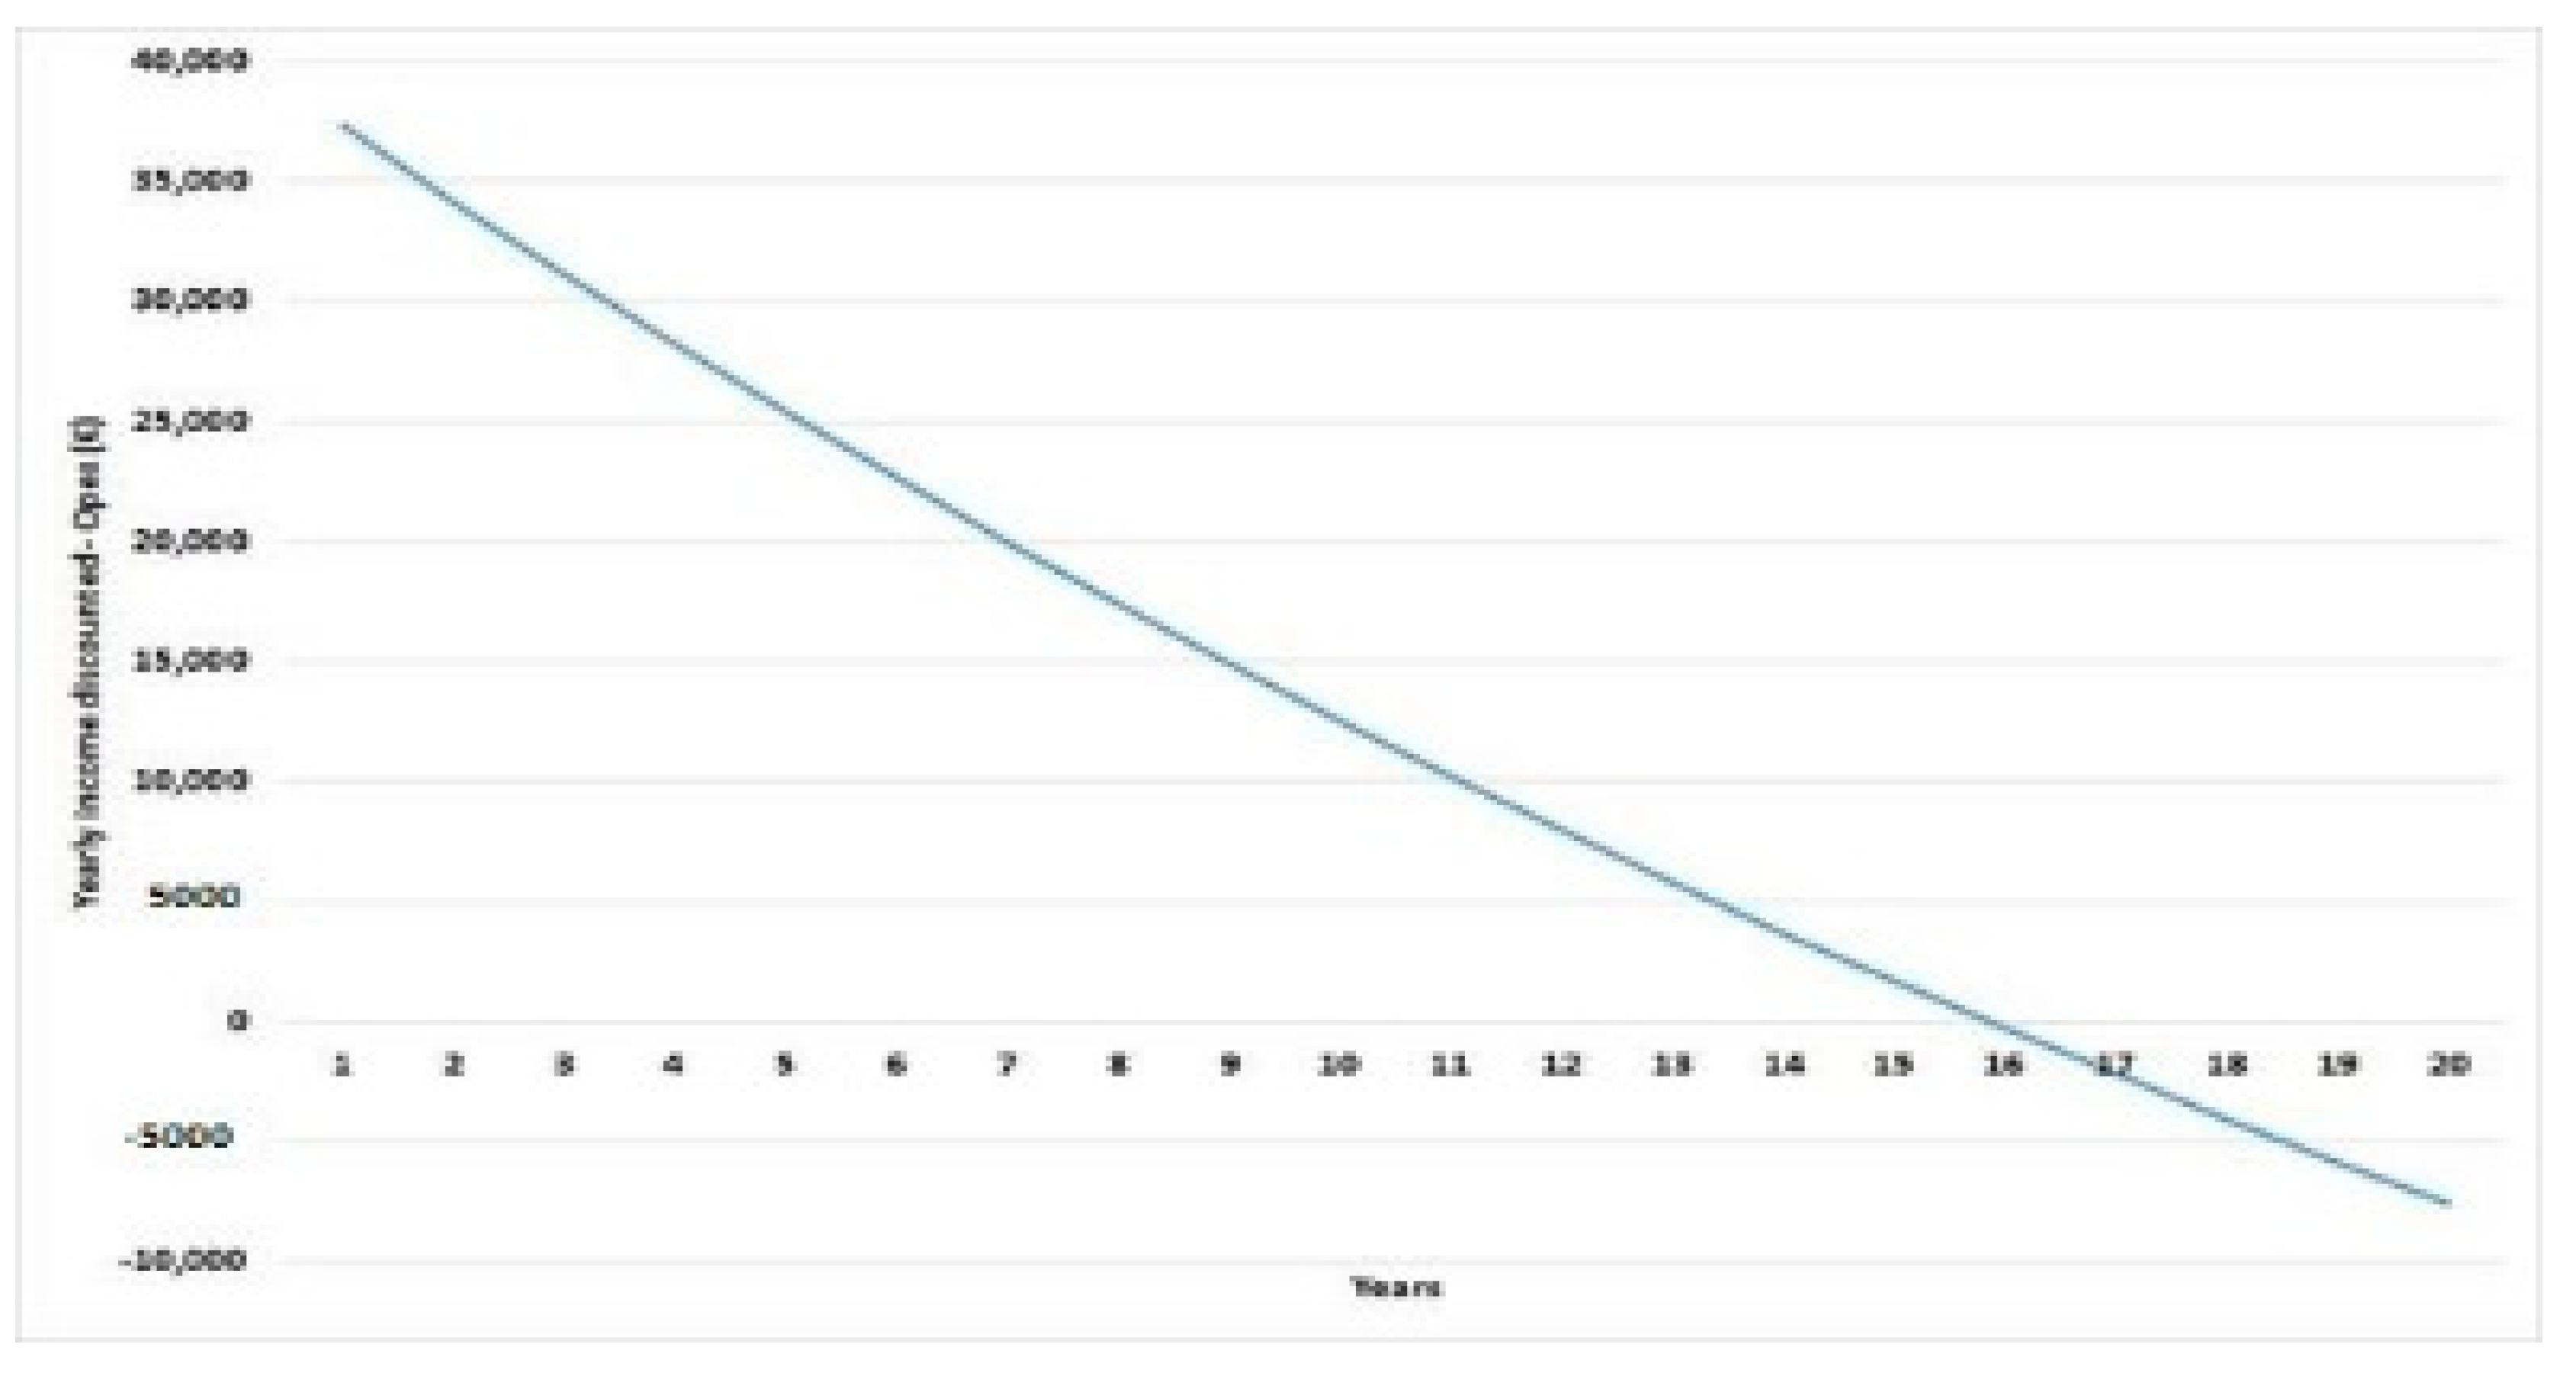
3.2.1. The Old Turbine Case
In the old turbine case with a remaining lifetime of 10 years a present value of €202,294 is obtained. Immediate decommissioning is not a good option because of the loss of income. It is optimal to continue using the facility so long as the present year income exceeds the Opex. If the only possibility is to keep the old wind farm, it would be optimal to operate the facility for the next 15 years and decommission it in year 16. Figure 11 shows the net of yearly income discounted and yearly Opex. This option would be reasonable if permission cannot be obtained for any of the other options.
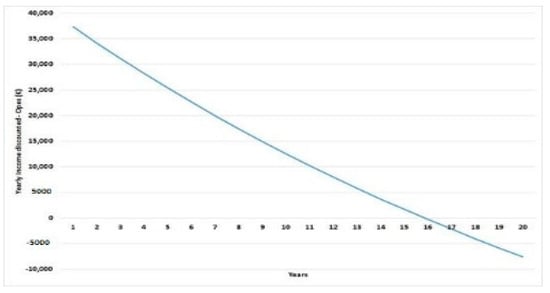
Figure 11.
Yearly variable income minus Opex in the old turbine case.
3.2.2. The Reblading Case
If the life of an old turbine is extended ten years by reblading, a present value of €282,273 is obtained. This is a better option than keeping the old turbine and not retrofitting. The 20% AEP improvement and the Opex reduction exceed the Capex. As in the old turbine case, it is optimal here to extend the useful lifetime after the planned 10 years.
3.2.3. The Gearbox Case
In the gearbox case, with ten years of lifetime remaining, a present value of €157,441 is obtained. The Capex investment exceeds the sum of the Opex saving and the AEP income increase. Comparatively, this is not a good option.
3.2.4. The Electronic Control Unit Case
In the electronic control unit retrofit case, the remaining lifetime is ten years and the present value obtained is €205,312. In this case the Capex is similar to the sum of the Opex saving and the AEP income increase.
3.2.5. The Full Repowering Case
If full repowering is possible with twenty years of useful lifetime a present value of €702,093 is obtained while maintaining the same installed capacity. If the wind farm owner has the permits required to double the installed capacity, the NPV is doubled.
3.3. Investment Risk
The decision criterion applied is based on the current value, but in practice it is possible to obtain higher or lower benefits.
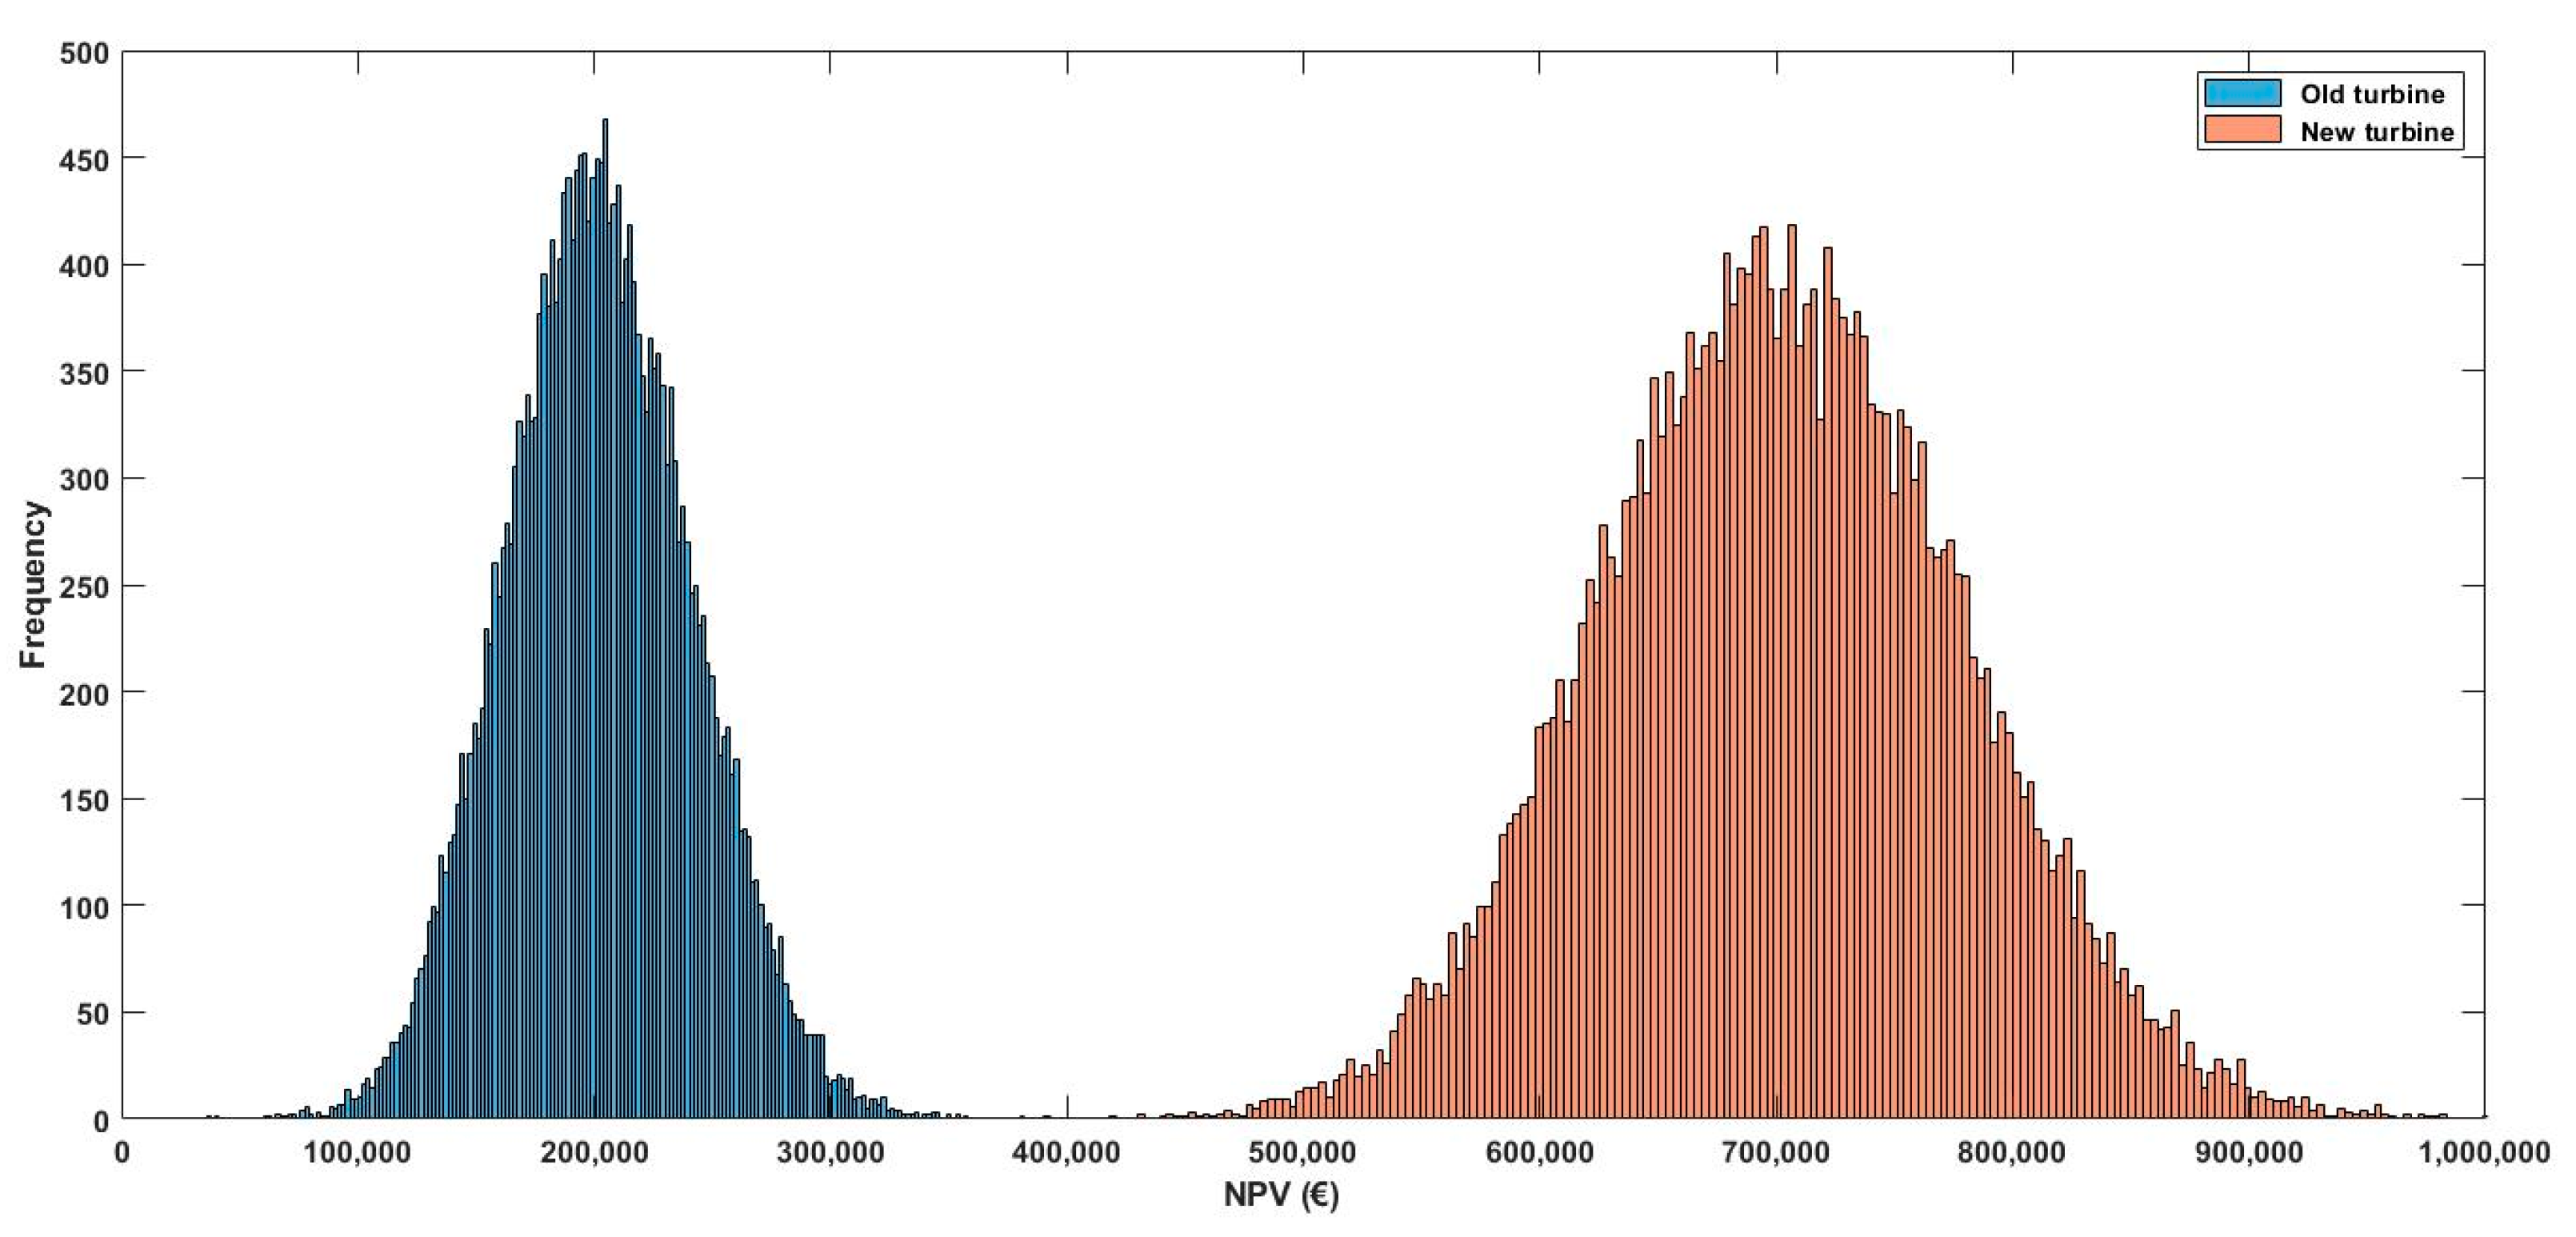
This subsection analyses the Net Present Value distribution in the old turbine and full repowering cases.
Two 10 × 25,000 income matrices are generated, one for the old turbine case and the other for the full repowering case. In these matrices each column is a possible behaviour pattern for the remaining lifetime. Note that after a year with any income the following year can have any income out of the 25,000 possibilities. That is, a year with low income can be followed by one with any type of income out of the 25,000 considered (low, medium, high).
Table 12 shows the 10% and 90% percentiles calculated using Monte Carlo simulation. For the old turbine case the net income in present value is less than €151.9 K in 10% of cases, and for the full repowering case it is less than €603.9 K in 10% of cases.
Table 12.
NPV(k€) per MW of installed capacity.
Note that the mean values in Table 12 resulting from Monte Carlo Simulations are almost the same as but not identical to those in Table 9. This is due to the use of a limited number of simulations (25,000 in this case) and the fact that the random numbers effect is not perfect.
Figure 12 shows the distribution of these possible NPV values.

Figure 12.
New and old turbine NPVs per MW of installed capacity.
3.4. Increase in Output and Installed Capacity
As mentioned, in the next five years nearly half of the installed capacity in Spain, i.e., 10,000 MW will reach at least 20 years of age.
In the old turbine case an annual decrease in power output is expected.
In the reblading case the installed capacity is the same but an increase of 20% in output can be expected, that is 381.18 MWh per MW installed. If it is decided to reblade all 10,000 MW, the annual power output could initially be increased by 3811.8 GWh.
In the full repowering case with the same installed capacity an increase of 52.7% in power output is obtained because of a better capacity factor of 992.47 MWh per MW installed. If it is decided to repower all 10,000 MW, the annual power output could initially be increased by 9924.7 GWh.
But in full repowering with the necessary permits it is possible to double the istalled capacity, adding 10,000 MW if wind farm owners opt for this in all cases. In this case the initial increase is 38,908.4 GWh (a 10,000 MW increase plus a further 10,000 MW due to the higher capacity factor).
4. Discussion and Conclusions
It is estimated that to meet the targets set in Spain’s Integrated National Energy and Climate Plan [8] an installed wind power capacity of 50,333 MW is needed by 2030. To reach this level, new investments are needed in both new and existing wind farms.
In many cases old wind farms are in the best possible locations. Moreover, a growing proportion of Spanish wind farms are reaching or are already close to the end of their useful lifetimes. How these old farms are managed is an important issue in reaching the desired levels of wind power output. Possible investment decisions are influenced by the current level of technology and by economic aspects such as income, Capex, Opex and Decex.
For income calculations two correlated stochastic models are calibrated: one for hourly electricity prices with seasonality, mean reversion, jumps and non-working days effects; and the other for hourly capacity factor, also with seasonality. Using the two correlated models, 25,000 simulations of hourly income are obtained for each day of year. These models could be used with data from other countries to obtain the expected incomes from the electricity production per MW of installed capacity. But income is uncertain, so electricity futures market prices are used to obtain an adequate discount rate. The model also includes a decrease in the capacity factor throughout the useful lifetime.
Figures taken from the relevant literature are used for Capex, Opex and Decex, but any different figures can easily be incorporated into the model to assess a facility with somewhat different characteristics. Subsidies and other aid are not taken into account. The calculations show, for all options, that these incentives are not necessary for wind farms to be profitable.
In some cases the possible options are limited due to the permits required. If those permits are obtained the best option is full repowering, with an estimated NPV of €702,093 for the 20-year useful lifetime. In this case electricity output increases due to a higher capacity factor. It may also be possible to increase wind farm capacity, in some cases doubling it, with an increase of 38,908.4 GWh of annual output.
If full repowering is not possible, the best option is life-extension with reblading. In this case the NPV for 10 years of remaining lifetime is €282,273, with an increase of 20% in electricity generation. Changing the electronic control unit does not generate significant results compared to keeping old turbines unchanged. A gearbox change only seems beneficial if trouble makes it necessary.
But the NPV of the options is not the only important factor. In this paper the distribution of possible NPV is calculated and it is shown that in 10% of cases net income in present value with the old turbine will be less than €151.9 K, and in the full repowering case will be less than €603.9 K in 10% of cases.
As future research, it is interesting to expand the proposed repowering model including energy storage. This line requires important additional developments for choosing optimal loading and unloading periods. Another research line concerns exploring other options apart from full repowering and life extension, such as investing in another electricity generation technologies other than wind power.
Author Contributions
Writing—original draft preparation, L.M.A. and N.G.; writing—review and editing, N.G. and L.M.A.; model calculations, L.M.A. Both authors have read and agreed to the published version of the manuscript.
Funding
This research was funded by the Basque Government through the BERC 2018–2021 programme and by the Spanish Ministry of the Economy and Competitiveness (MINECO) through BC3 María de Maeztu excellence accreditation MDM-2017-0714. Further support is provided by the MINECO project RTI 2018-093352-B-I00. All authors have read and agreed to the published version of the manuscript.
Data Availability Statement
Not applicable.
Acknowledgments
Special thanks are due to Borja Vallejo from Vestas, Madrid, Spain, and Javier Echarte from GE Renewable Energy, Barcelona, Spain, for their guidance in understanding the wind turbine industry.
Conflicts of Interest
The authors declare no conflict of interest.
Appendix A
The deterministic costs (Opex, Capex and Decex) for the full repowering case are shown per MW installed and year in Figure A1.
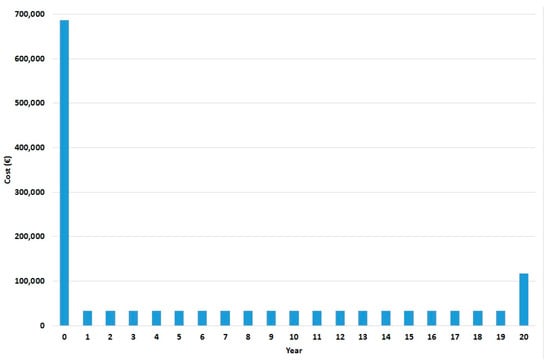
Figure A1.
Deterministic costs for the full repowering case per MW installed and year.
Figure A1.
Deterministic costs for the full repowering case per MW installed and year.

The yearly expected net present value of income are shown in Figure A2. This figure shows the discount effect and also the decease capacity factor effect.
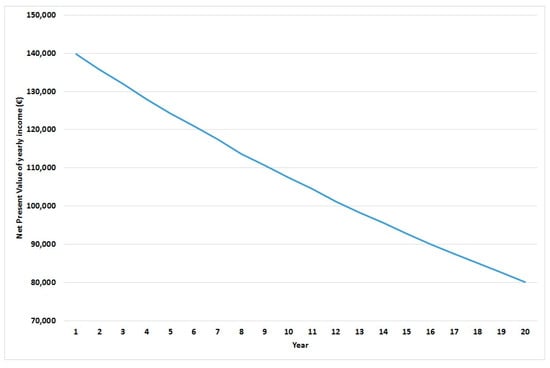
Figure A2.
Income net present value for year and per MW of installed capacity.
Figure A2.
Income net present value for year and per MW of installed capacity.
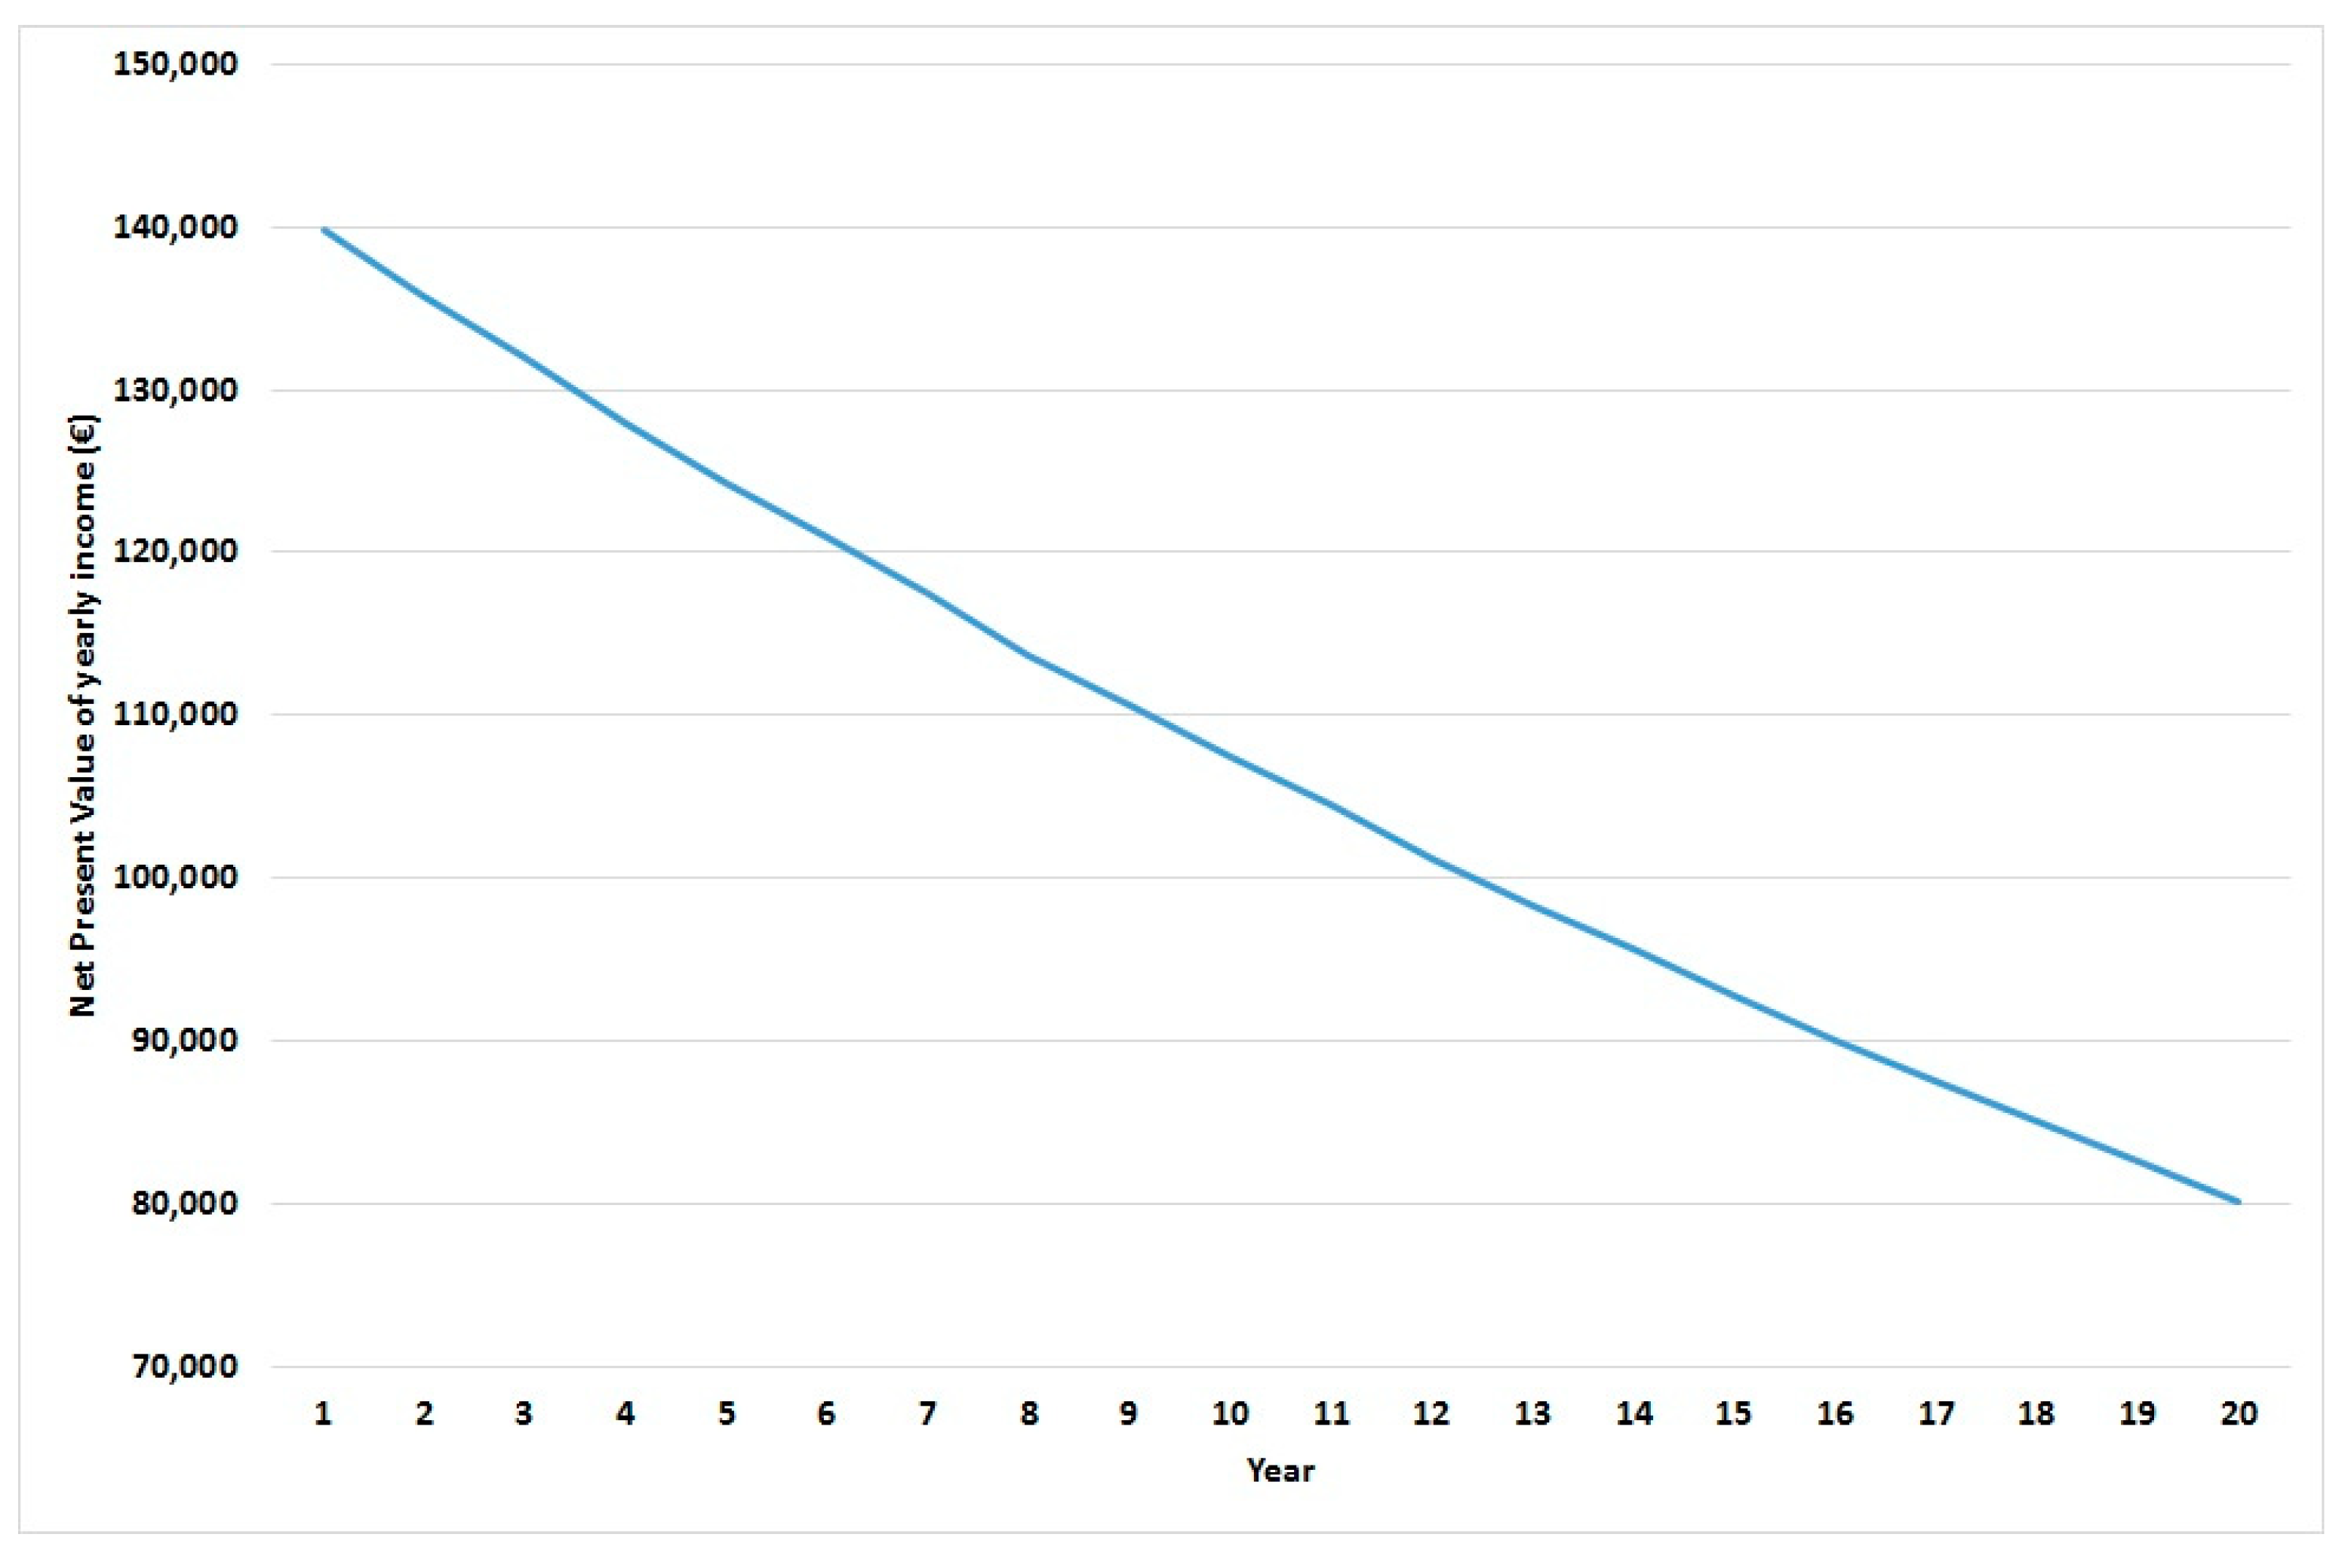
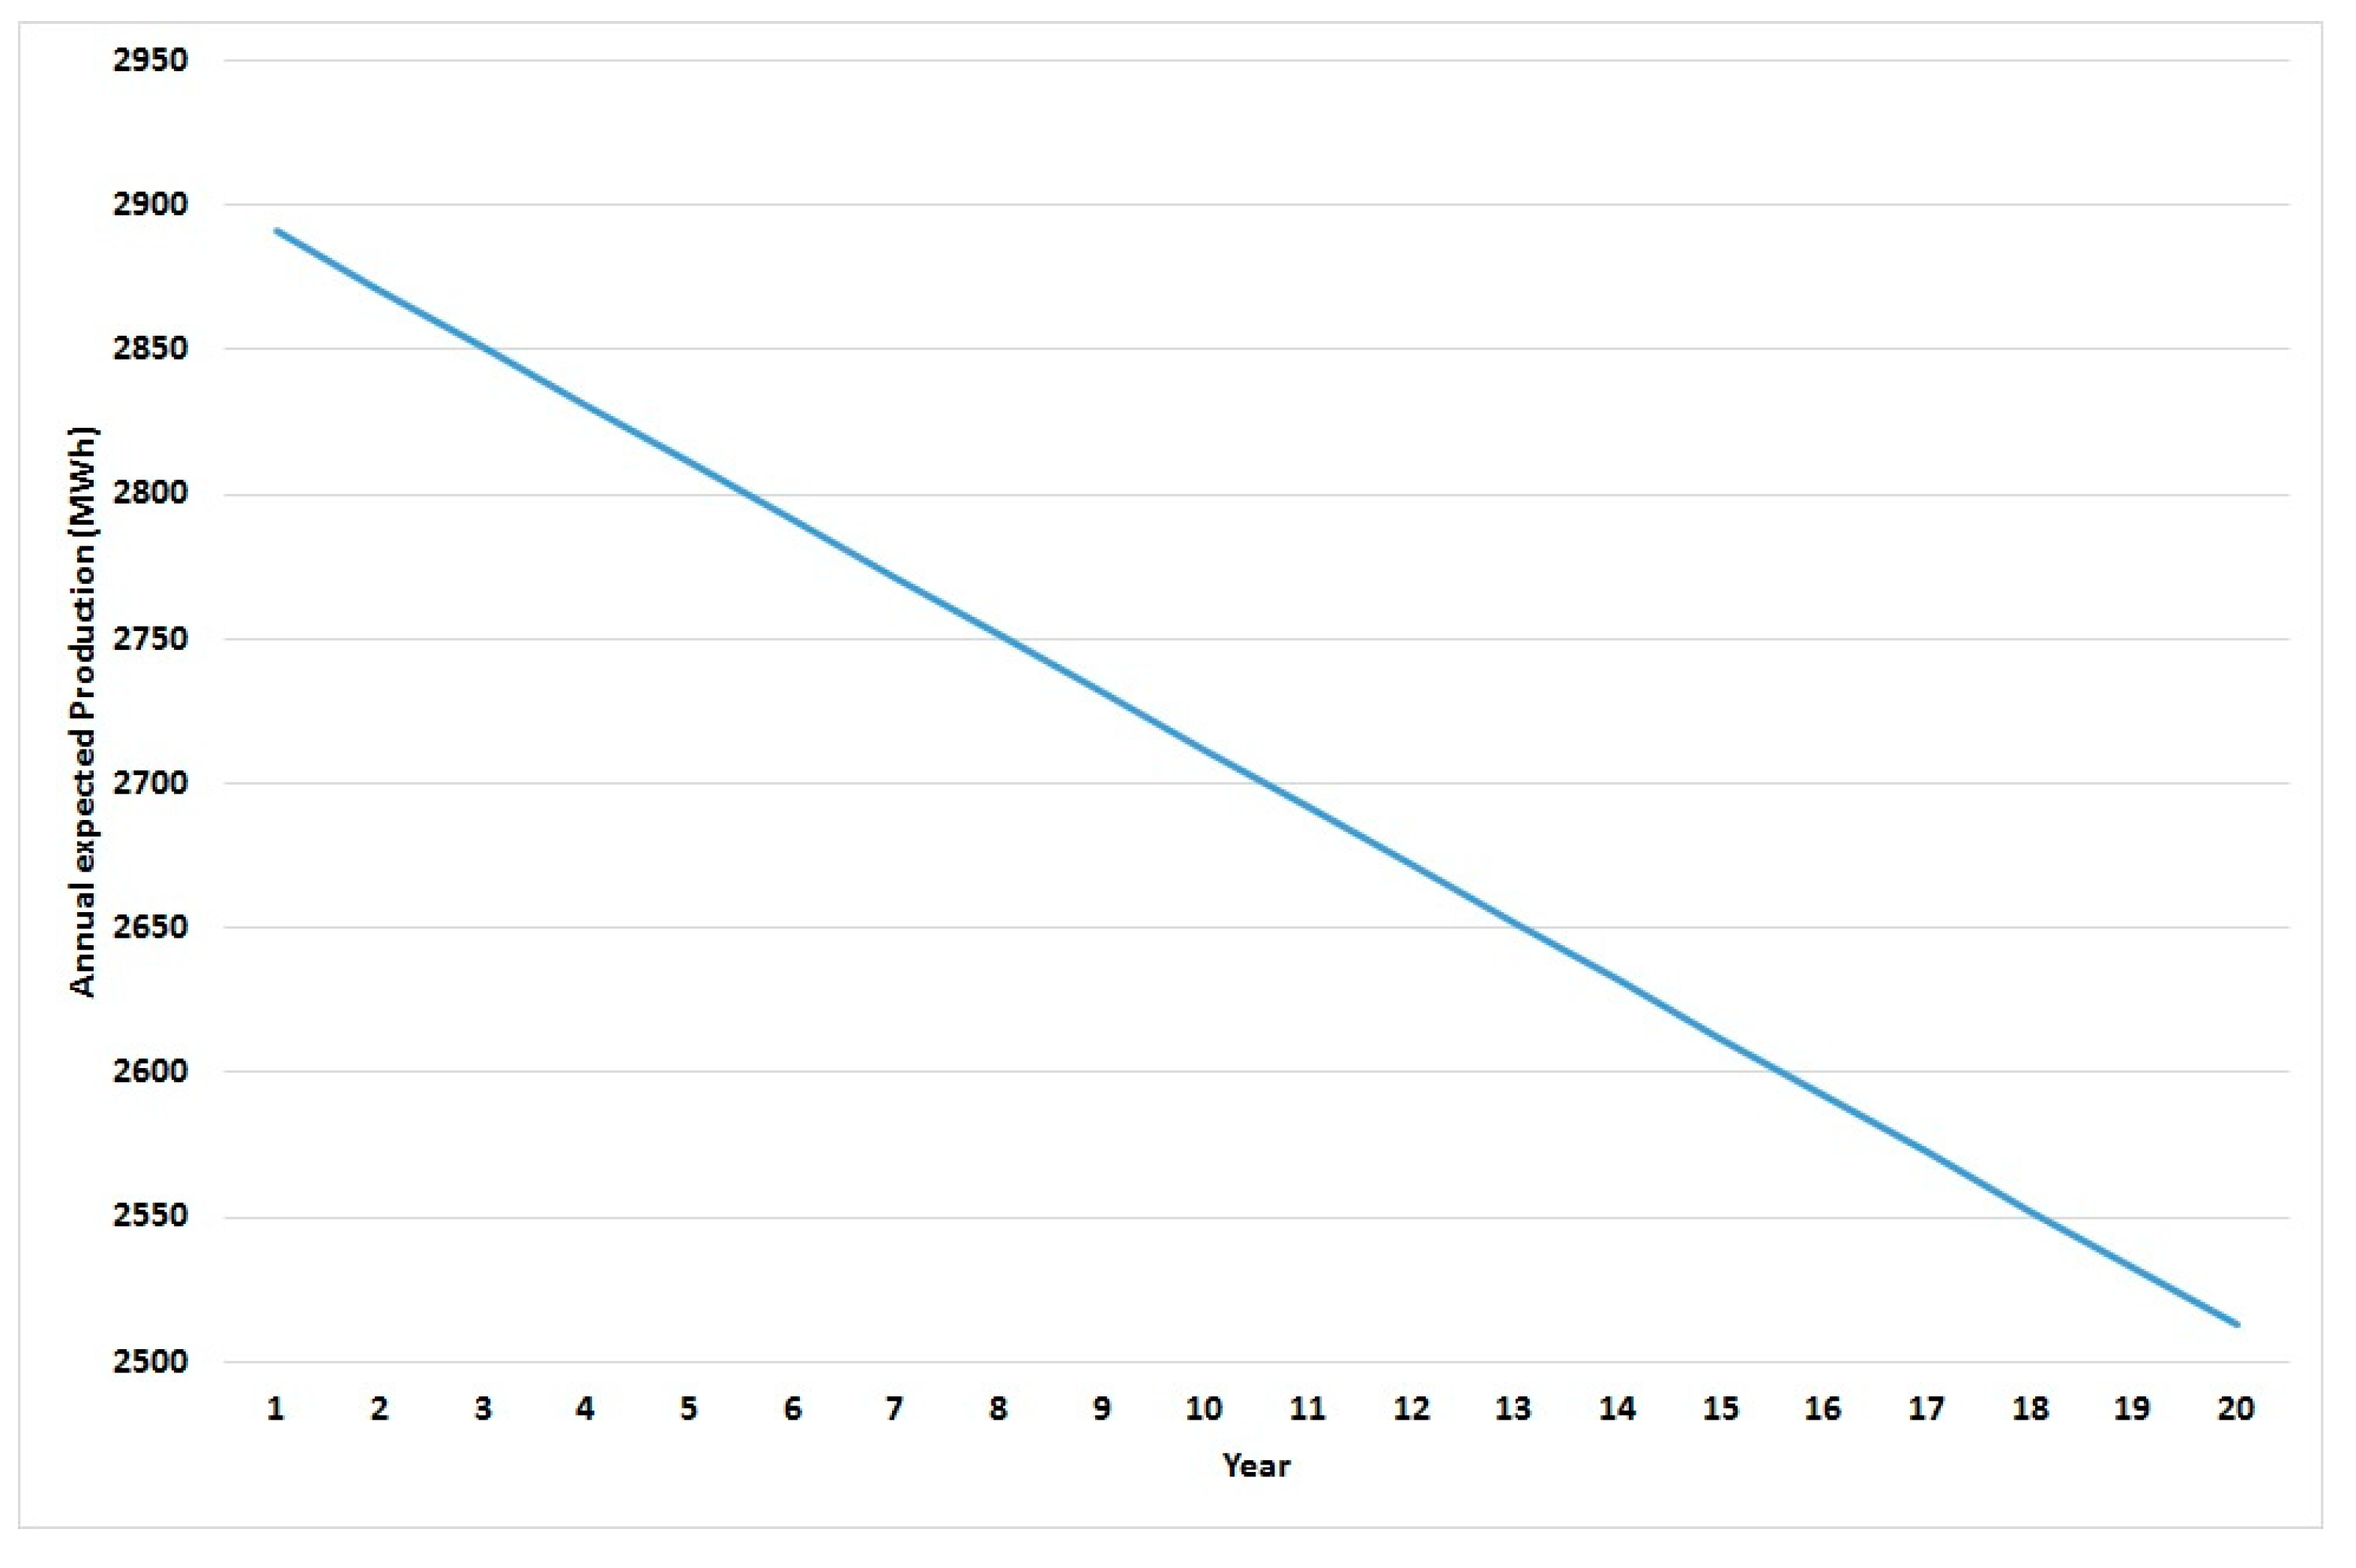
Figure A3 shows the expected yearly MWh production, the decreasing shape is caused by the lower capacity factor over time.
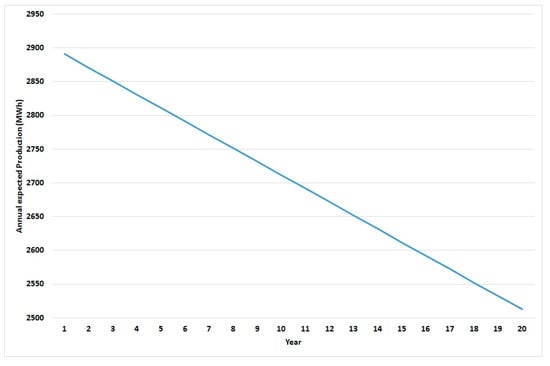
Figure A3.
Expected yearly production (MWh) per MW installed.
Figure A3.
Expected yearly production (MWh) per MW installed.
References
- The European Commission Green Deal Document. Available online: https://ec.europa.eu/info/sites/info/files/european-green-deal-communication_en.pdf (accessed on 15 May 2020).
- United Nations. Paris Agreement. Available online: https://unfccc.int/process-and-meetings/the-paris-agreement/what-is-the-paris-agreement (accessed on 12 May 2020).
- Eurostat. Available online: https://ec.europa.eu/eurostat/documents/2995521/10335438/8-23012020-AP-EN.pdf (accessed on 22 May 2020).
- IRENA. Renewable Energy Highlights. Available online: https://www.irena.org/-/media/Files/IRENA/Agency/Publication/2018/Jul/IRENA_Renewable_energy_highlights_July_2018.pdf?la=en&hash=F0E22210DEB43512673D6A573C1879F10CFC41D0 (accessed on 22 September 2020).
- Wind Energy in Europe in 2019. Trends and Statistics. Available online: https://windeurope.org/wp-content/uploads/files/about-wind/statistics/WindEurope-Annual-Statistics-2019.pdf (accessed on 22 September 2020).
- AEE Asociación Empresarial Eólica Anuario Eólico. La voz del Sector. Available online: https://aeeolica.org/comunicacion/publicaciones-aee/anuarios/3868-anuario-eolico-19-toda-la-informacion-del-sector-en-el-ano-2018 (accessed on 12 September 2020).
- Wind Europe. Wind Energy in Europe: Scenarios for 2030. Available online: https://windeurope.org/wp-content/uploads/files/about-wind/reports/Wind-energy-in-Europe-Scenarios-for-2030.pdf (accessed on 29 September 2020).
- PNIEC 2020. Integrated National Plan of Energy and Climate. Available online: https://www.miteco.gob.es/es/prensa/pniec.aspx (accessed on 28 May 2020).
- IEA. Renewable Energy Market Update. Available online: https://www.iea.org/reports/renewable-energy-market-update/covid-19-impact-on-renewable-energy-growth (accessed on 22 September 2020).
- Wind Europe. Overview of the Targets and Measures in the Final 2030 National Energy and Climate Plans. Available online: https://windeurope.org/2030plans/ (accessed on 25 September 2020).
- Bórawski, P.; Beldycka, A.; Jankowski, K.J.; Dubis, B.; Dunn, J.W. Development of wind energy market in the European Union. Renew. Energy 2020, 161, 691–700. [Google Scholar] [CrossRef]
- Novaes, G.; Maurício, A.; Carvalho, P.A. Prognostic techniques applied to maintenance of wind turbines: A concise and specific review. Renew. Sustain. Energy Rev. 2018, 81, 1917–1925. [Google Scholar] [CrossRef]
- Tchakoua, P.; Wamkeue, R.; Ouhrouche, M.; Slaoui-Hasnaoui, F.; Andy, T.; Ekemg, G. Wind turbine condition monitoring: State-of-the-Art review, new trends, and future challenges. Energies 2014, 7, 2595–2630. [Google Scholar] [CrossRef] [Green Version]
- Kazemi, A.; Kazacoks, R.; Mc Millan, D.; Feuchtwang, J.; Leithead, W. Farm-wide assessment of wind turbine life time extension using detailed tower model and actual operational history. J. Phys. Conf Ser. 2019, 1222, 012034. [Google Scholar] [CrossRef]
- Herbert, G.M.J.; Iniyan, S.; Goic, R. Performance, reliability and failure analysis of wind farm in a developing country. Renew. Energy 2010, 35, 2739–2751. [Google Scholar] [CrossRef]
- Merizalde, Y.; Bonilla, L.M.; Hernandez, L.; Duque, O. Wind turbine maintenance: A review. Dyna 2018, 93, 435–441. [Google Scholar] [CrossRef] [Green Version]
- Wiser, R.; Bolinger, M.; Lantz, E. Assessing wind power operating costs in the United States: Results from a survey of wind industry experts. Renew. Energy Focus 2019, 30, 46–57. [Google Scholar] [CrossRef]
- Boccard, N. Capacity factor of wind power realized values vs. estimates. Energy Policy 2009, 37, 2679–2688. [Google Scholar] [CrossRef]
- Blanco, M.I. The economics of wind energy. Renew. Sustain. Energy Rev. 2009, 13, 1372–1382. [Google Scholar] [CrossRef]
- Serri, L.; Lembo, E.; Airoldi, D.; Gelli, C.; Beccarello, M. Wind energy plants repowering potential in Italy: Technical-economic assessment. Renew. Energy 2018, 115, 382–390. [Google Scholar] [CrossRef]
- Rubert, T.; Mc Millan, D.; Niewczas, P. A decision tool to assist with lifetime extension of wind turbines. Renew. Energy 2018, 120, 423–433. [Google Scholar] [CrossRef] [Green Version]
- Madlener, R.; Glensk, B.; Gläsel, L. Optimal timing of onshore wind repowering in Germany under policy regime changes: A real option analysis. Energies 2019, 12, 4703. [Google Scholar] [CrossRef] [Green Version]
- Invernizzi, D.C.; Locatelli, G.; Velenturf, A.; Love, P.; Purnell, P.; Brookes, N.J. Developing policies for the end-of-life of energy infrastructure: Coming to terms with the challenges of decommissioning. Energy Policy 2020, 144, 111677. [Google Scholar] [CrossRef]
- Glensk, B.; Madlener, R. Energiewende@ risk: On the continuation of renewable power generation at the end of public policy support. Energies 2019, 12, 3616. [Google Scholar] [CrossRef] [Green Version]
- Colmenar, A.; Campiñez, S.; Pérez, C.; Mur, F. Repowering: An actual possibility for wind energy in Spain in a new scenario without feed-in-tariffs. Renew. Sustain. Energy Rev. 2015, 41, 319–337. [Google Scholar] [CrossRef]
- Ziegler, L.; Gonzalez, E.; Rubert, T.; Smolka, U.; Melero, J.J. Lifetime extension of onshore wind turbines: A review covering Germany, Spain, Denmark, and the UK. Renew. Sustain. Energy Rev. 2018, 82, 1261–1271. [Google Scholar] [CrossRef] [Green Version]
- Santos, F.J.; Thomaidis, N.S.; Usaola, J.; Ruiz, J.A. Exploring mean-variance portfolio optimization approach for planning wind repowering actions in Spain. Renew. Energy 2017, 106, 335–342. [Google Scholar] [CrossRef]
- Ramírez, F.J.; Honrubia, A.; Gomez, E.; Pham, D.T. The role of wind energy production in addressing the European renewable energy targets: The case of Spain. J. Clean. Prod. 2018, 196, 1198–1212. [Google Scholar] [CrossRef]
- Calvo, A.; Iglesias, G.; Rio, P. Analysing the techno-economic determinants for the repowering of wind farms. Eng. Econ. 2013, 58, 282–303. [Google Scholar] [CrossRef]
- Villena, R.; Ramírez, F.J.; Honrubia, A.; Gomez, E. A techno-economic analysis of a real wind farm repowering experience: The Malpica case. Energy Convers. Manag. 2018, 172, 182–199. [Google Scholar] [CrossRef]
- Simón, M.; De la Puente, A.; Borge, D.; Ciria, T.; Gonzalez, A. Wind energy planning for a sustainable transition to a decarbonized generation scenario based on the opportunity cost of the wind energy: Spanish Iberian Peninsula as case study. Energy Procedia 2019, 157, 1144–1163. [Google Scholar] [CrossRef]
- Gutiérrez, M.J.; Ruiz, M.J.; Tarancón, M.A. Regional factors driving the deployment of wind energy in Spain. Energies 2020, 13, 3590. [Google Scholar] [CrossRef]
- Hughes, G. The Performance of Wind Farms in the United Kingdom and Denmark—London Renewable Energy Foundation. Available online: http://tinyurl.com/cn5qnqg (accessed on 15 September 2020).
- Olauson, J.; Edström, P.; Rydén, J. Wind turbine performance decline in Sweden. Wind Energy 2017, 20, 2049–2053. [Google Scholar] [CrossRef]
- Abadie, L.M.; Chamorro, J.M. Levelised cost of electricity: Key drivers and valuation methods. Dyna 2019, 94, 656–661. [Google Scholar] [CrossRef] [Green Version]
- Swider, D.J.; Weber, C. Extended ARMA models for estimating price developments on day-ahead electricity markets. Electr. Pow. Syst. Res. 2007, 77, 583–593. [Google Scholar] [CrossRef]
- Staffel, I.; Pfenninger, S. Using bias-corrected reanalysis to simulate current and future wind power output. Energy 2016, 114, 1224–1239. [Google Scholar] [CrossRef] [Green Version]
- ESIOS. e-Sistema de Información del Operador del Sistema. Available online: https://www.esios.ree.es/es (accessed on 2 October 2020).
- Escribano, A.; Peña, J.I.; Villaplana, P. Modelling electricity prices: International evidence. Oxf. B Econ. Stat. 2011, 73, 622–650. [Google Scholar] [CrossRef] [Green Version]
- Lucia, J.J.; Schwartz, E.S. Electricity prices and power derivatives: Evidence from the Nordic power exchange. Rev. Deriv. Res. 2002, 5, 5–50. [Google Scholar] [CrossRef]
- Seifert, J.; Uhrig-Homburg, M. Modelling jumps in electricity prices: Theory and empirical evidence. Rev. Deriv. Res. 2007, 10, 59–85. [Google Scholar] [CrossRef]
- Villaplana, P. Pricing Power Derivatives: A Two-Factor Jump-Diffusion Approach EFMA 2004 Basel Meetings. Available online: http://dx.doi.org/10.2139/ssrn.493943 (accessed on 2 October 2020).
- MathWorks. Simulating Electricity Prices with Mean-Reversion and Jump-Diffusion. Available online: https://es.mathworks.com/help/fininst/examples/simulating-electricity-prices-with-mean-reversion-and-jump-diffusion.html (accessed on 15 October 2019).
- Abadie, L.M. Energy market prices in times of COVID-19: The case of electricity and natural gas in Spain. Energies 2021, 14, 1632. [Google Scholar] [CrossRef]
- Staffel, I.; Green, R. How does wind farm performance decline with the age? Renew. Energy 2014, 66, 775–786. [Google Scholar] [CrossRef] [Green Version]
- Germer, S.; Kleidon, A. Have wind turbines in Germany generated electricity as would be expected from the prevailing wind conditions in 2000–2014? PLoS ONE 2019, 14, e0211028. [Google Scholar] [CrossRef]
- Hamilton, S.D.; Millstein, D.; Bolinger, M.; Wiser, R.; Jeong, S. How does wind project performance change with age in the United States? Joule 2020, 4, 1004–1020. [Google Scholar] [CrossRef]
- Albani, A.; Ibrahim, M.Z. Wind potential and power law indexes assessment for selected near-coastal sites in Malaysia. Energies 2017, 10, 307. [Google Scholar] [CrossRef] [Green Version]
- Lacal-Arántegui, R.; Uihlein, A.; Yusta, J.M. Technology effects in repowering wind turbines. Wind Energy 2019, 23, 660–675. [Google Scholar] [CrossRef]
- Hand, M.M. NREL/TP-6A20-71844 IEA Wind TCP Task 26-Wind Technology, Cost, and Performance Trends in Denmark, Germany, Ireland, Norway, Sweden, the European Union, and the United States: 2008–2016. Available online: https://www.nrel.gov/docs/fy19osti/71844.pdf (accessed on 2 July 2020).
- Schwarz, C.; Badia, E. Decommissioning of Wind Farms: Costs and Opportunities. Available online: https://www.academia.edu/40226067/DECOMMISSIONING_OF_WIND_FARMS_COSTS_AND_OPPORTUNITIES (accessed on 12 November 2020).
- Jensen, J.P. Evaluating the environmental impacts of recycling wind turbines. Wind Energy 2018, 22, 316–326. [Google Scholar] [CrossRef]
- WMI. Operational and Maintenance Costs for Wind Turbines. Available online: http://www.windmeasurementinternational.com/wind-turbines/om-turbines.php (accessed on 30 May 2020).
- Echavarria, E.; Hahn, B.; Bussel, G.J.W.; Tomiyama, T. Reliability of wind turbine technology through time. J. Sol. Energy Eng. 2018, 130, 031005. [Google Scholar] [CrossRef]
- IRENA. Renewable Energy Technologies: Cost Analysis Series. Available online: https://www.irena.org/publications/2012/Jun/Renewable-Energy-Cost-Analysis—Wind-Power (accessed on 28 June 2020).
- Bloomberg NEF. 2H2017 Wind Turbine Price Index. Available online: https://about.bnef.com/blog/2h-2017-wind-turbine-price-index/ (accessed on 16 June 2020).
- Rubert, T.; Zorzi, G.; Niewczas, P.; McMillan, D.; McAlorum, J.; Perry, M. Renewable Energy Wind turbine lifetime extension decision-making based on structural health monitoring. Renew. Energy 2019, 143, 611–621. [Google Scholar] [CrossRef]
- Mishnaevsky, L.; Thomsen, K. Cost of repair of wind turbine blades: Influence of technology aspects. Wind Energy 2020, 12, 2247–2255. [Google Scholar] [CrossRef]
- Salameh, J.P.; Cauet, S.; Etien, E.; Sakout, A.; Rambault, L. Gearbox condition monitoring in wind turbines: A review. Mech. Syst. Signal Pr. 2018, 111, 251–264. [Google Scholar] [CrossRef]
- Sandoval, D.; Leturiondo, U.; Pozo, F.; Vidal, Y.; Salgado, O. Revision of the condition based monitoring techniques of the pitch bearings from wind turbines. Dyna 2019, 94, 636–642. [Google Scholar] [CrossRef]
- Durante, C. Achieving Superior Performance and Extended Asset Life Cycle on Aging Wind Assets through Re-Blading. Wind Europe-EWEA Technology Workshop: Analysis of Operating Wind Farms. Available online: http://www.ewea.org/events/workshops/past-workshops/analysis-of-operating-wind-farms-2016/posters/#038 (accessed on 28 June 2020).
- Sareen, A.; Sapre, C.A.; Selig, M.S. Effects of leading edge erosion on wind turbine blade performance. Wind Energy 2014, 17, 1531–1542. [Google Scholar] [CrossRef]
- Wagner, R.; Courtney, M.; Gottschall, J.; Lindelöw-Marsden, P. Accounting for the speed shear in wind turbine power performance measurement. Wind Energy 2011, 14, 993–1004. [Google Scholar] [CrossRef] [Green Version]
- Nilsson, J.; Berling, L. Maintenance management of wind power systems using condition monitoring systems–life cycle cost analysis for two case studies. IEEE Trans. Energy Conver. 2007, 22, 223–229. [Google Scholar] [CrossRef]
- IRENA. Renewable Power Generation Costs in 2017. Available online: https://www.irena.org/publications/2018/Jan/Renewable-power-generation-costs-in-2017 (accessed on 27 July 2020).
- Banco de España. Economic Indicators. Available online: https://www.bde.es/f/webbde/SES/Secciones/Publicaciones/InformesBoletinesRevistas/BoletinEstadistico/20/Fich/ie_septiembre2020_es.pdf (accessed on 20 September 2020).
- OMIP. Available online: https://www.omip.pt/es/dados-mercado?date=2019-12-25&product=EL&zone=ES&instrument=FTB&maturity=YRl (accessed on 28 June 2020).

Publisher’s Note: MDPI stays neutral with regard to jurisdictional claims in published maps and institutional affiliations. |
© 2021 by the authors. Licensee MDPI, Basel, Switzerland. This article is an open access article distributed under the terms and conditions of the Creative Commons Attribution (CC BY) license (https://creativecommons.org/licenses/by/4.0/).