Article

Detailed Injection Strategy Analysis of a Heavy-Duty Diesel Engine Running on Rape Methyl Ester

1
National Research Center “NAMI”, 125438 Moscow, Russia
2
Faculty of Engineering and Environment, Northumbria University, Newcastle upon Tyne NE1 8ST, UK
*
Authors to whom correspondence should be addressed.
Energies 2021, 14(13), 3717; https://doi.org/10.3390/en14133717
Submission received: 27 May 2021 / Revised: 13 June 2021 / Accepted: 16 June 2021 / Published: 22 June 2021

Abstract

:
Using biodiesel fuel in diesel engines for heavy-duty transport is important to meet the stringent emission regulations. Biodiesel is an oxygenated fuel and its physical and chemical properties are close to diesel fuel, yet there is still a need to analyze and tune the fuel injection parameters to optimize the combustion process and emissions. A four-injections strategy was used: two pilots, one main and one post injection. A highly advanced SOI decreases the NOx and the compression work but makes the combustion process less efficient. The pilot injection fuel mass influences the combustion only at injection close to the top dead center during the compression stroke. The post injection has no influence on the compression work, only on the emissions and the indicated work. An optimal injection strategy was found to be: pilot SOI 19.2 CAD BTDC, pilot injection fuel mass 25.4%; main SOI 3.7 CAD BTDC, main injection fuel mass 67.3% mg; post SOI 2 CAD ATDC, post injection fuel mass 7.3% (the injection fuel mass is given as a percentage of the total fuel mass injected). This allows the indicated work near the base case level to be maintained, the pressure rise rate to decrease by 20% and NOx emissions to decrease by 10%, but leads to a 5% increase in PM emissions.

1. Introduction

The application of biofuels in internal combustion engines (ICEs) is today a relevant issue as these types of engines are widely used for stationary power plants and in the transport sector. The main task for researchers today is to search for advanced combustion concepts [1,2,3] and alternative fuels to face the issues impacted by the traditional technologies [4,5].
There are several types of advanced combustion strategies which are given below. For example, the low temperature combustion (LTC) concepts, which include reactivity-controlled compression ignition (RCCI), homogeneous charge compression ignition (HCCI) and partially premixed combustion (PPC). The PPC concept is able to simultaneously reduce the NOx and soot emissions, decrease the combustion duration and reduce heat transfer losses in the coolant system and with exhaust gases [6,7].
A promising approach is to combine the use of oxygenated alternative fuels (ethanol, methanol, biodiesel, etc.) which show the simultaneous improvements in efficiency, NOx and soot emissions [7,8,9] as with the advanced combustion strategies. The most suitable alternative fuel is a biodiesel fuel, because its physical and chemical properties do not differ much from fossil diesel fuel (DF), and it can be blended with DF easily. Biodiesel from rapeseed and sunflower can lower CO2 emissions by up to 65% compared to those of fossil diesel fuel (DF). If the biodiesel fuel is produced from used cooking oil, the decrease in CO2 emissions can be up to 85% [10,11]. Biofuel produced from palm oil, for example, could cause much higher carbon dioxide emissions than fossil fuels [12,13]. Biodiesel is only one alternative fuel that has successfully passed the Health Effects Testing requirements (Tier I and Tier II) of the Clean Air Act (1990). Biodiesel can reduce the tailpipe particle matters (PM), and the small particles of solid combustion products on vehicles with particulate filters by 20% compared with low-sulfur DF.
In the last 10 years, an increase in the production of biofuels has been seen. This became possible because of support from government policies and energy security concerns. The increase was 24% over the forecast in the period from 2019 to 2024 combined with higher shares of biofuels for electricity generation [14].
The relatively large number of different biofuels requires extensive research to study and improve the combustion process of ICEs fueled with these fuels. The investigation processes in ICE, such as scavenging, fuel injection, fuel evaporation, mixture preparation, combustion, emissions formation, and heat transfer can be identified using CFD modeling. The simulations can provide a reduction in cost with comparable accuracy to experimental investigations, so a detailed understanding of the flow and combustion processes is required to improve the performance of the ICE.
The aim of this work is to define and investigate the fuel injection parameters such as the pilot, main and post injections and their interactions to decrease NOx and PM emissions and to increase the efficiency simultaneously on the biodiesel fueled diesel engine. The main idea is to use the low temperature combustion in combination with oxygenated biofuel–rape methyl ester. This is expected to reduce the NO emissions via an advanced injection strategy and reduce the soot emissions via the oxygen content. The present work describes the investigation of the fuel injection parameters affecting the combustion process on one load, as an example. It is a well-known fact that biodiesel fuel increases NOx and decreases particulate matter (PM) emissions. It is a real challenge to decrease NOx and PM emissions and to increase the efficiency simultaneously. One of the ways to fulfill such requirements is to optimize the injection strategy [15]. Moreover, such a method does not imply changes in the diesel engine design. It is important to note that there are no significant changes that can be made in a diesel engine to make it operate on biodiesel except the optimization of fuel injection and replacing the sealing materials in the fuel supply line.

2. Materials and Methods

The object of the investigation was a four-stroke heavy duty V6 diesel engine YAMZ-6566 with displacement 12 L, bore/stroke 130/140 mm, compression ratio 17.5, rated power 197 kW at 1900 rpm, maximum torque 1124 Nm in range from 1100 rpm to 1500 rpm operating on diesel fuel. The maximum fuel injection pressure was 1600 bar, the maximum boost absolute pressure was 1.85 bar, and the fuel temperature before the high-pressure pump was 20 ± 4 degrees °C. The investigation was completed at 1450 rpm and at 25% of the full load and at the full load. In this article only one regime is described. The loads were chosen according to the ESC cycle of UN49-06 regulation.
The engine test was made on the test bench in a FSUE “NAMI” equipped with measuring equipment according to the UN Regulations №24, №85 and №49. The indicating equipment AVL Indiset Gigabit was used, the high-pressure transducer range was up to 250 bar (AVL GH14D), low pressure transducers were used for the intake and an exhaust pressure measuring with pressure range up to 10 bar was used (AVL LP11DA). The AVL 365C angle encoder was used to measure the rotational speed in CAD.
The CFD simulation model was created in AVL Fire and mesh–in ESE Diesel (AVL List GmbH, Graz, Austria), so the calculation was completed on the sector of the 1/7 volume of the combustion chamber (CC). The calculation was completed only for the compression and expansion strokes from when the intake valve closed (IVC) (570 CAD) to when the exhaust valve opened (EVO) (840 CAD), so the pumping and friction losses were not taken into account, and there was an assumption that the boundary conditions were constant.
The purpose of the investigation was the improvement of the combustion process (CP) via an optimization of the parameters for the split injection strategy. For example, the 1st and the 2nd pilot start of injection (SOI), the pilot injection fuel mass, and the same parameters for post injection. So, it was necessary to use spray zone refinement in the ESE Diesel, to increase the calculation accuracy (the area before and after top dead center). It was expected to reduce the NOx and PM emissions and increase the efficiency simultaneously.
The ECFM-3Z (Extended coherent flame model 3 zone) [16] model was chosen to describe the combustion process. This combustion model is based on a flame surface density transport equation and a mixing model [17,18]. Frolov’s model of drop heating and evaporation [19] was chosen to describe evaporation. This model has been developed recently as a reference model for the novel correction function approach to overcome the various simplifications of the standard evaporation models by various correction functions. K-zeta-f was used as a model of turbulence [20,21,22]. To describe a break-up process, the WAVE model with child breakup was chosen [23]. To make the approach more realistic, the piecewise parabolic cumulative function was used to correct the size distribution between the minimum stable diameter and the parent drop diameter. To describe the spray-wall interaction, the Walljet1 model was chosen. The wall interaction of liquid droplets can play a major role in diesel engines. This influences the combustion process and consequently the production of emissions, as an incomplete combustion near the wall will result in high HC and PM emissions. This model in principle is based on the spray/wall impingement model of Naber and Reitz [24]. The Extended Zeldovich-Prompt-Fuel model was chosen to calculate the NOx emissions. This mechanism is defined according to the chemical equilibrium assumption, which means that only atomic nitrogen (N) is needed as an additional intermediate species [16]. The Kinetic Soot Model was chosen to calculate the soot emissions. The basis of this model is described by Agafonov G. L. et al., Appel J et al., Krestinin A. V. [25,26,27].
The combustion and emission models have a strong interaction with each other, and this combination of the combustion and NO emissions was chosen because of the recommendation of the developer, and the second reason was the utility and versatility of the models. The versatility of the models was proved by the combustion kinetics basement of these models and was required for the investigation of the injection parameter influence on the combustion process. An ECFM-3Z model is capable of describing the premixed and non-premixed combustion; that is usual for diesel engines. The breakup, evaporation, and spray-wall interaction models were chosen to have the best alignment between the measured and simulated pressure curves.
During the analysis of the fuel injection process and the injector design, the difference between the pilot and main injection was found out. The time range the needle goes up and down on the seat of injector nozzle for the pilot and the main injection is different, hence the constants for the combustion model and the breakup models for the pilot and main injections should be different. The injection rate was defined based on the oscilloscope experiment data for the pilot and main injections and loaded in the model.
In Figure 1 the mesh that was used for the calculation can be seen. The mesh was divided into 4 blocks: 1-injector block, 2-fuel jet block, 3-buffer lawyer, 4-combustion chamber block. The local grid refinement was used for the fuel jet block in the range of 80 CAD BTDC to 40 CAD ATDC to increase the accuracy of the calculation for the spray break-up and evaporation processes. The mesh contained 286,106 cells.
The CFD model was verified by the experiment data and operated on DF at 1450 rpm and loads of 25%, 50%, 75% and 100% of the full load. The properties of DF for combustion and liquid spray were taken from the AVL Fire library, and for the experiment the properties of DF corresponded to EN 590:2009 standard. Later, the model was verified on B100 as well as on the same operating modes. The B100 used for the experiment and the simulation is rape methyl ester (DIN EN 14214-2014).
The optimization investigation of the fuel injection strategy was made on a verified model and the results were compared with the base case injection (2-stage injection: 1 pilot and 1 main injections). The start of injection (SOI) for the pilot was 19.2 crank angle degrees (CAD) before top dead center (BTDC), for the main–3.7 CAD BTDC, and the mass injection was 14 mg and 34.2 mg, respectively.
Researchers Myung et al. [28] investigated the biodiesel split injection strategy and its influence on the combustion process, including the rate of the heat release process on the emission analysis. The results were compared to one stage injection. Similar work has been completed by other researchers [29,30,31,32,33].
Nakagome et al. [34], Najt et al. [35], and Gajendra et al. [36] investigated the HCCI combustion process to reduce the emissions. The main characteristic was a highly advanced SOI and a long time needed for preparing the air-fuel mixture. A high amount of premixed charge allows the NOx and PM emissions to be reduced simultaneously.
It was found out that most perspective strategies include several pilots (more often two pilots), one main and several post injections (more often one post injection). It was decided to add the second pilot injection and one post injection.
The varying injection parameters were:
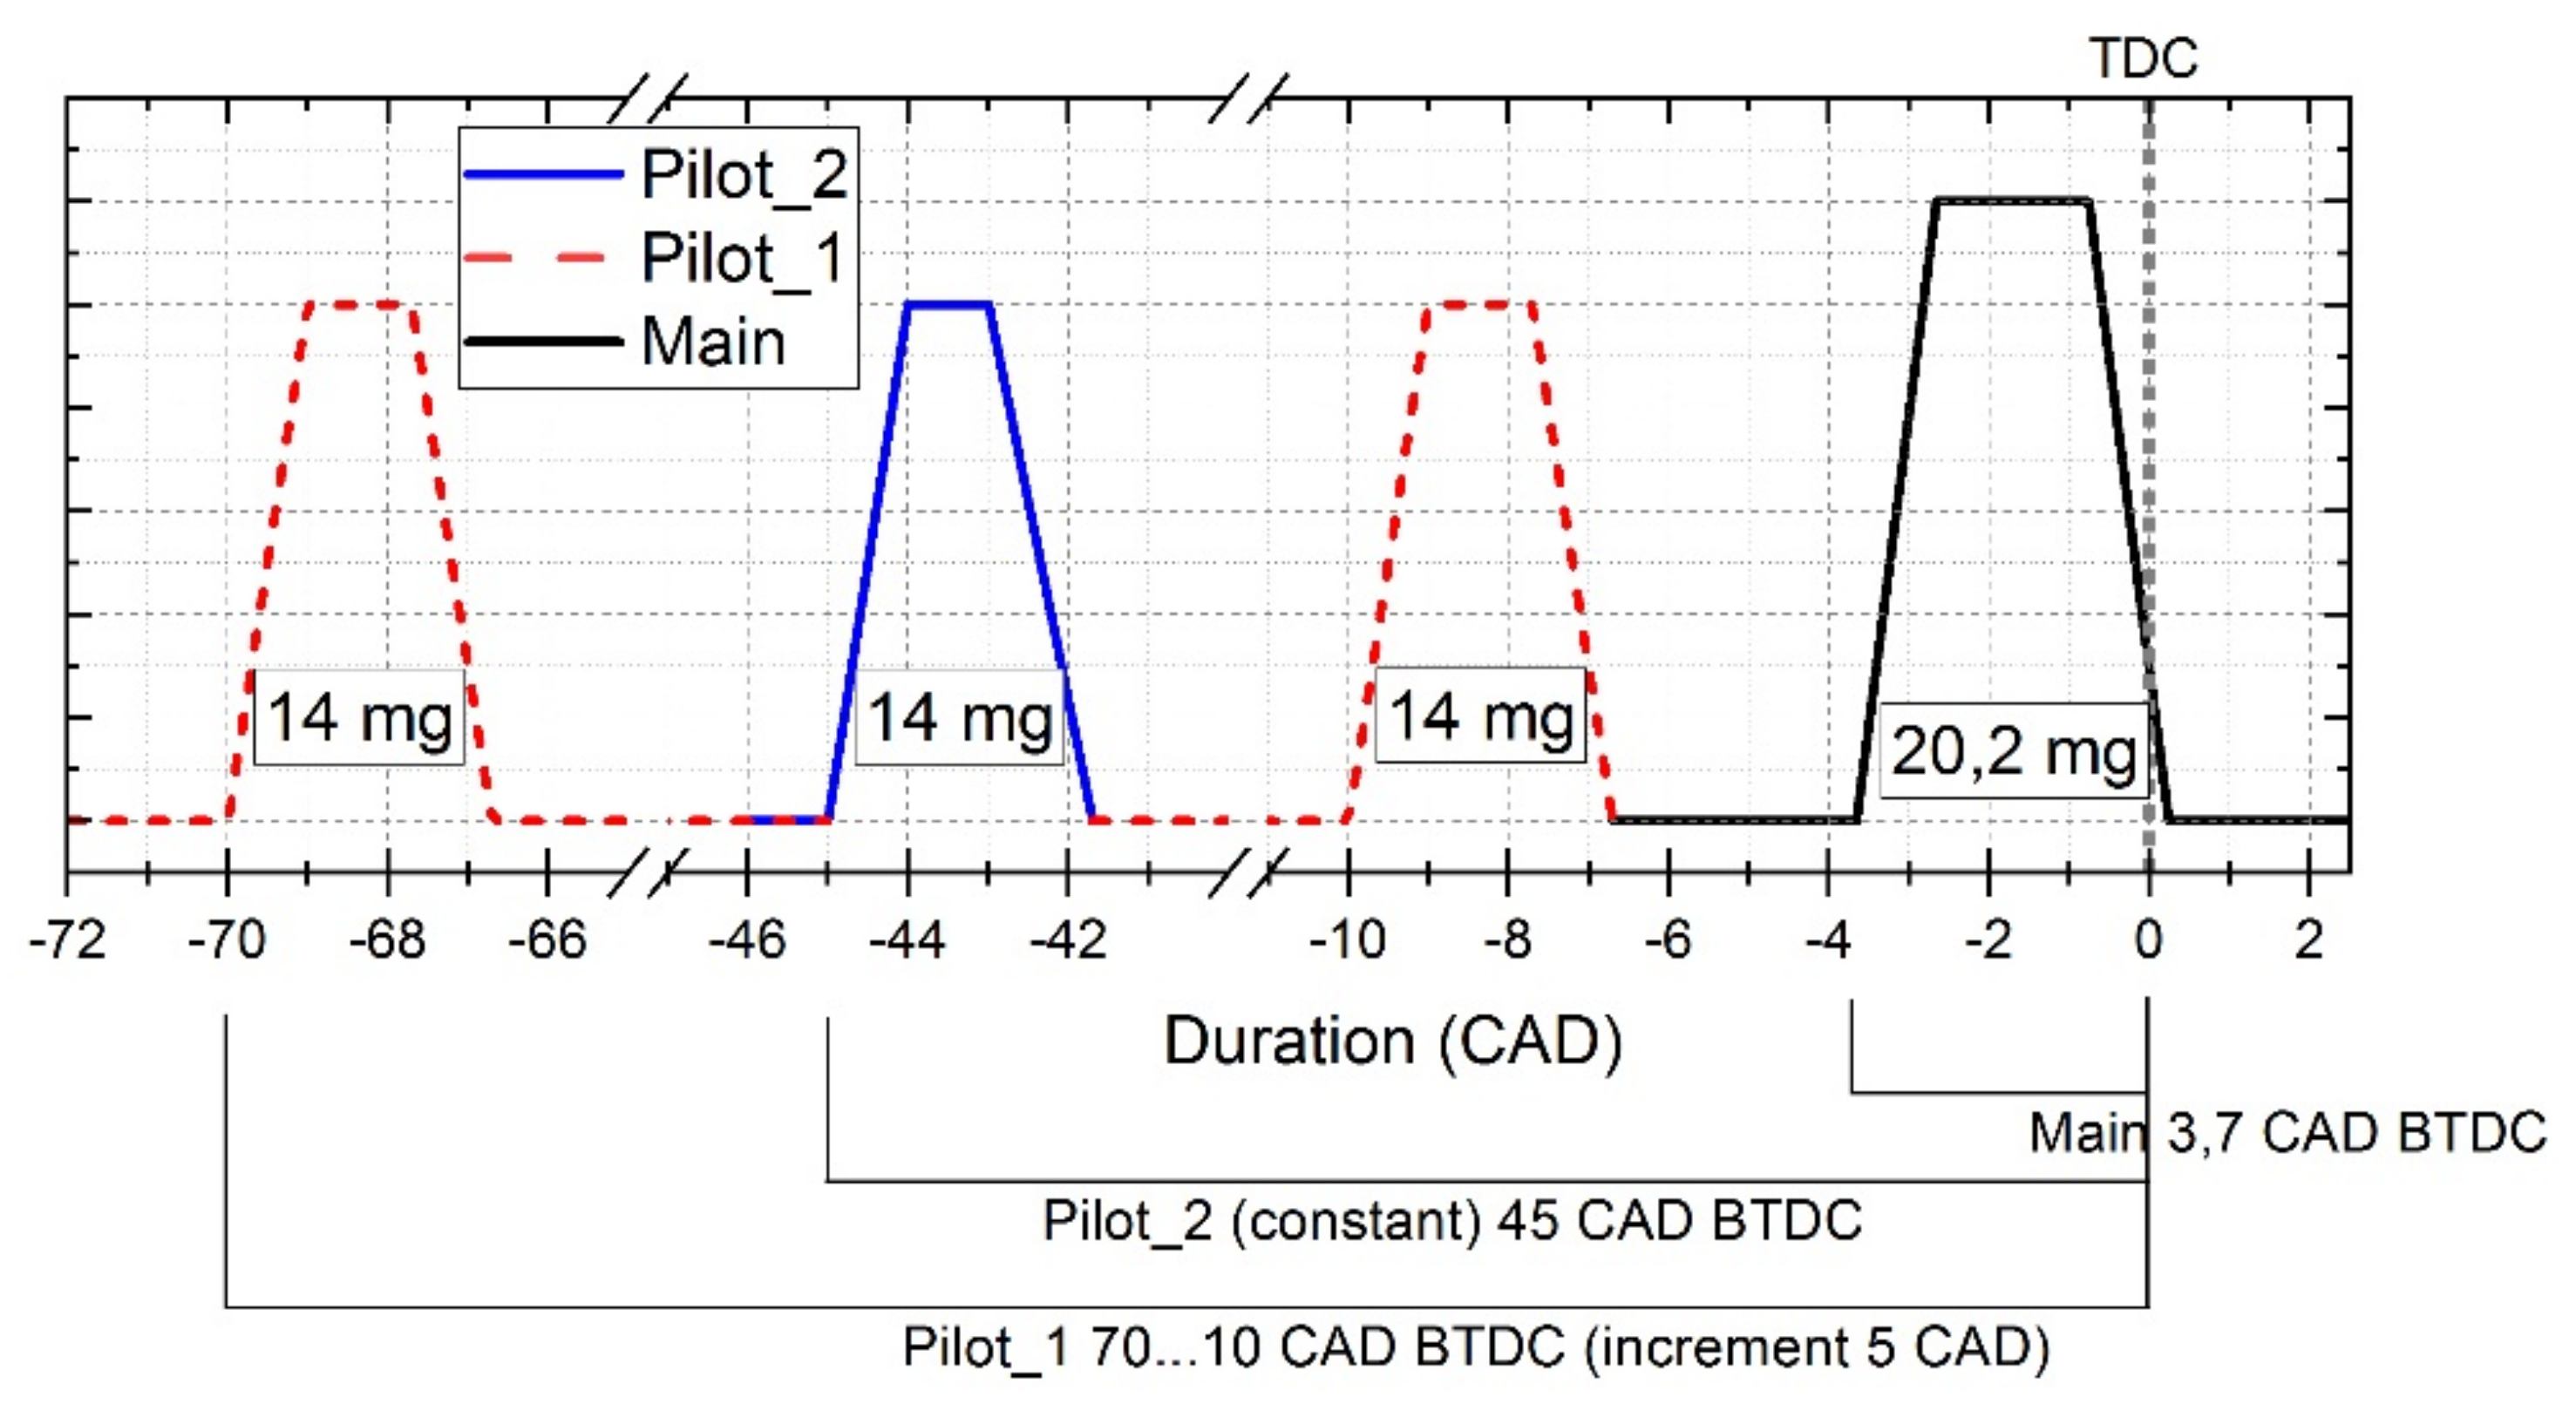
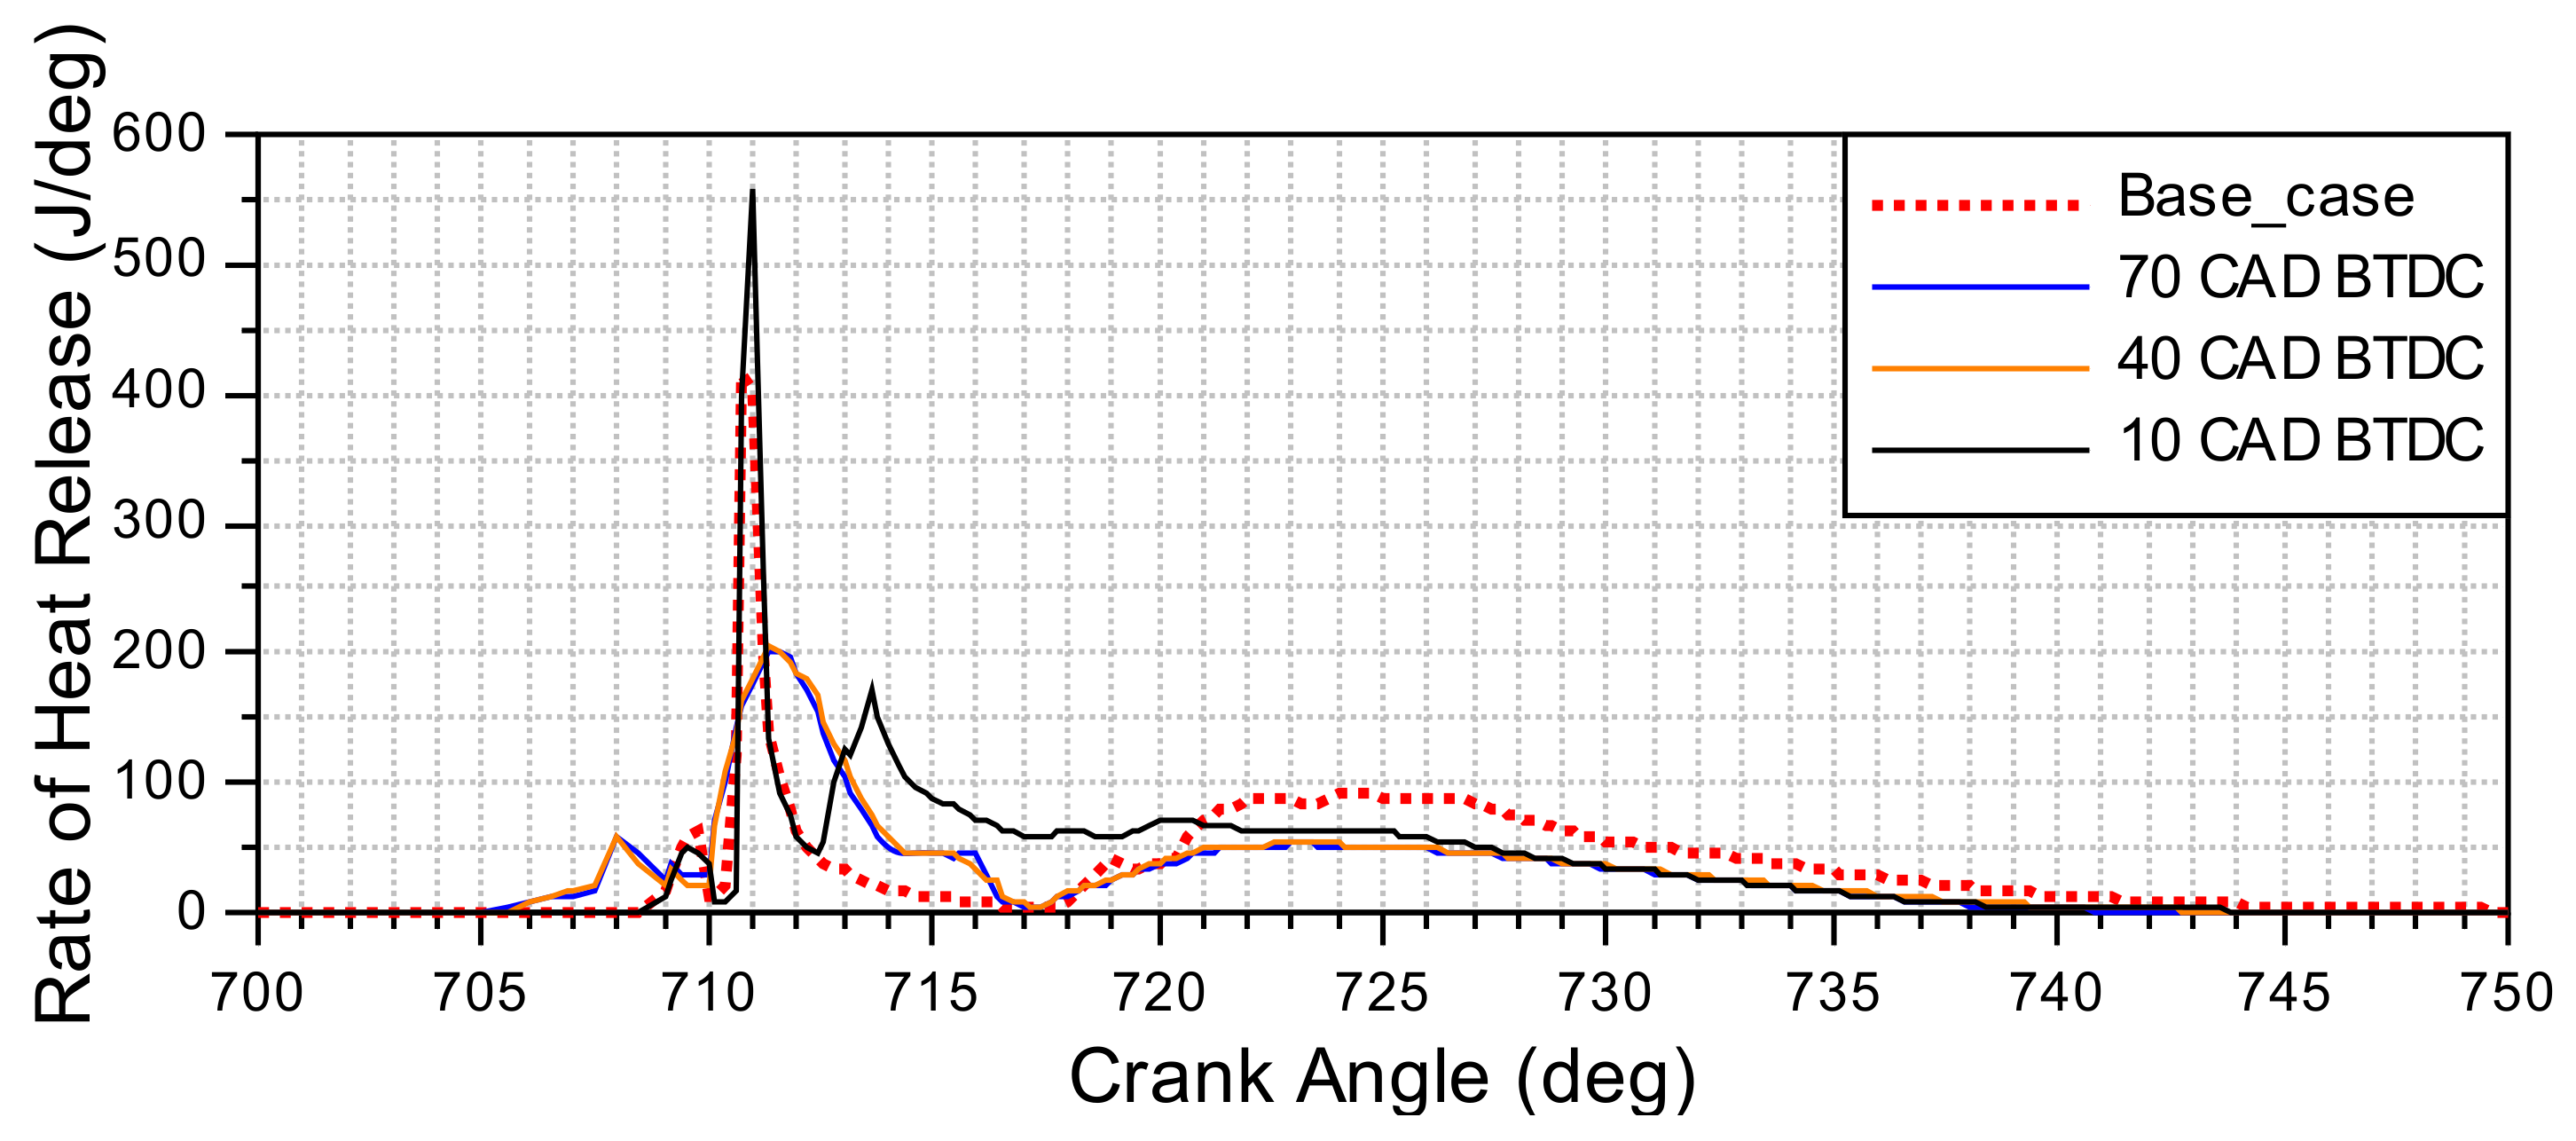
  • Varying the 1st and the 2nd pilot SOI in the range from 70 CAD BTDC to 10 CAD BTDC with 5 CAD increments;
  • Varying the pilot injection fuel mass in the range from 1.75 mg to 15.75 mg with increments of 1.75 mg, when the first pilot mass is equal to the second one;
  • Varying the post SOI in the range from 0 CAD after top dead center (ATDC) to 30 CAD ATDC with increment of 5 CAD;
  • Varying the post injection fuel mass in the range from 3.5 mg to 14 mg with increments of 1.75 mg.
The ranges and increments of all the varying parameters can be changed depending on the influence on a combustion process.
The evaluated parameters were: indicated work by percentage compared to the base case value (Ai), the pressure rise rate (dp/dφ, MPa/CAD), NOx and PM concentrations and for the combustion process, the rate of heat release (ROHR), the accumulated heat release (AHR), the CO mole fraction, the combustion duration (CD), and the start of the injection (SOI). During the CFD optimization only one injection parameter was varied and the others were set constant.
The methodology of the optimization described in the present work may be used for other ICEs, other alternative fuels, and other optimization parameters.
The methodology consisted of several steps:
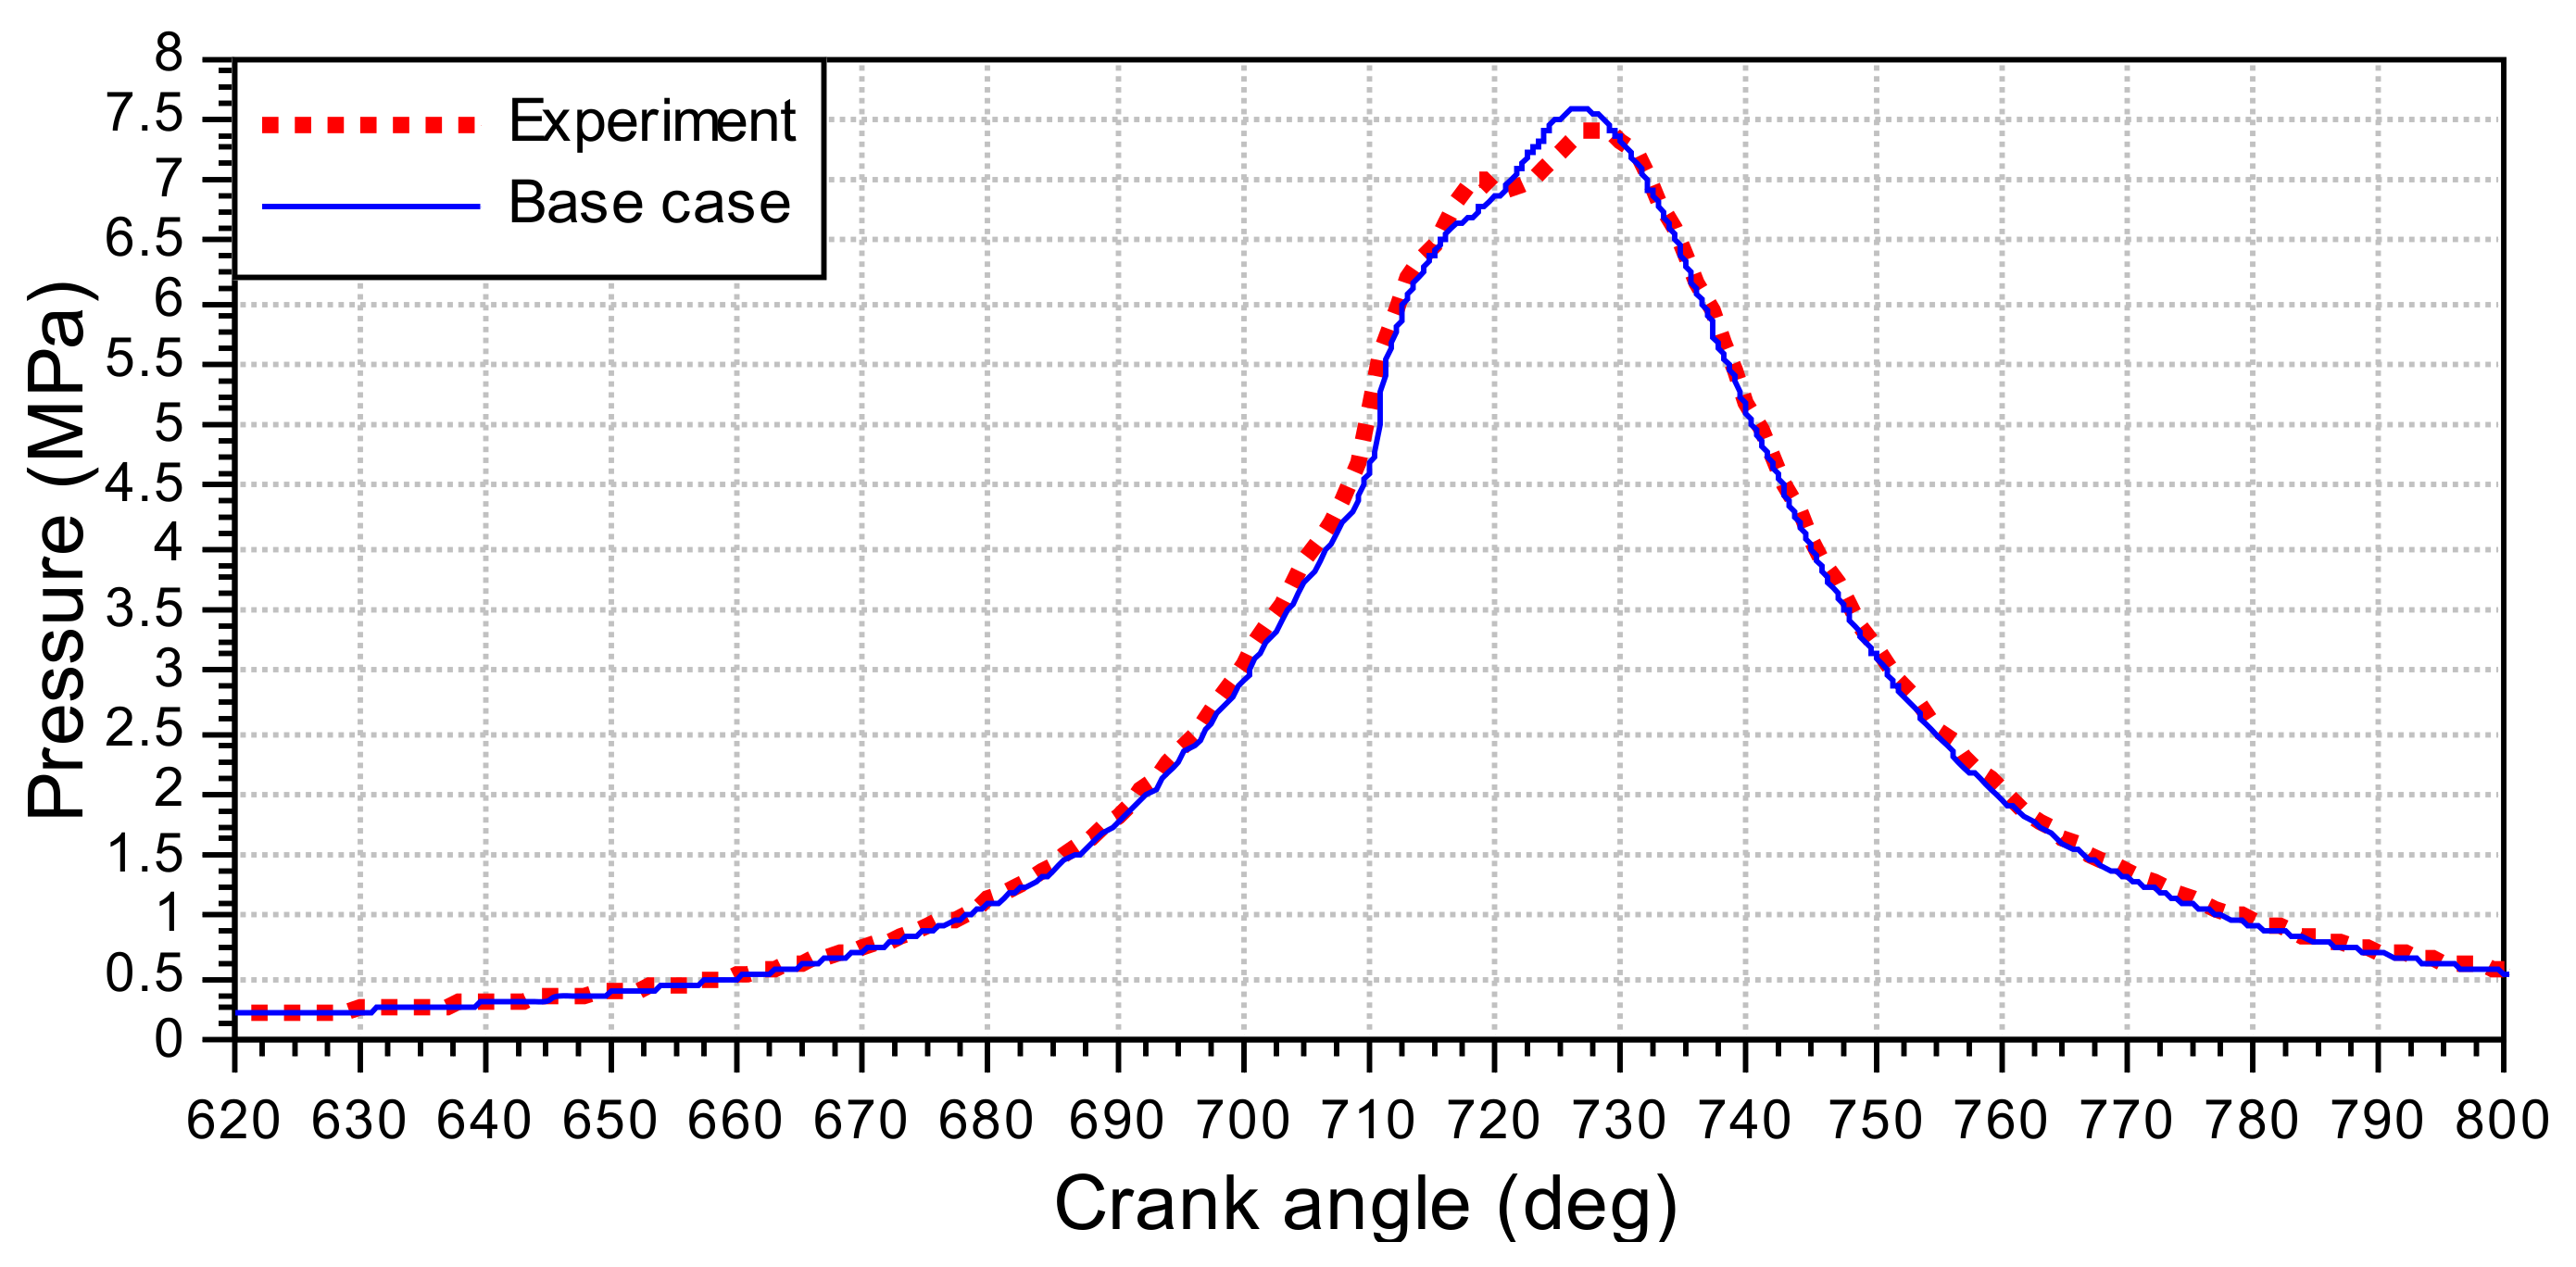
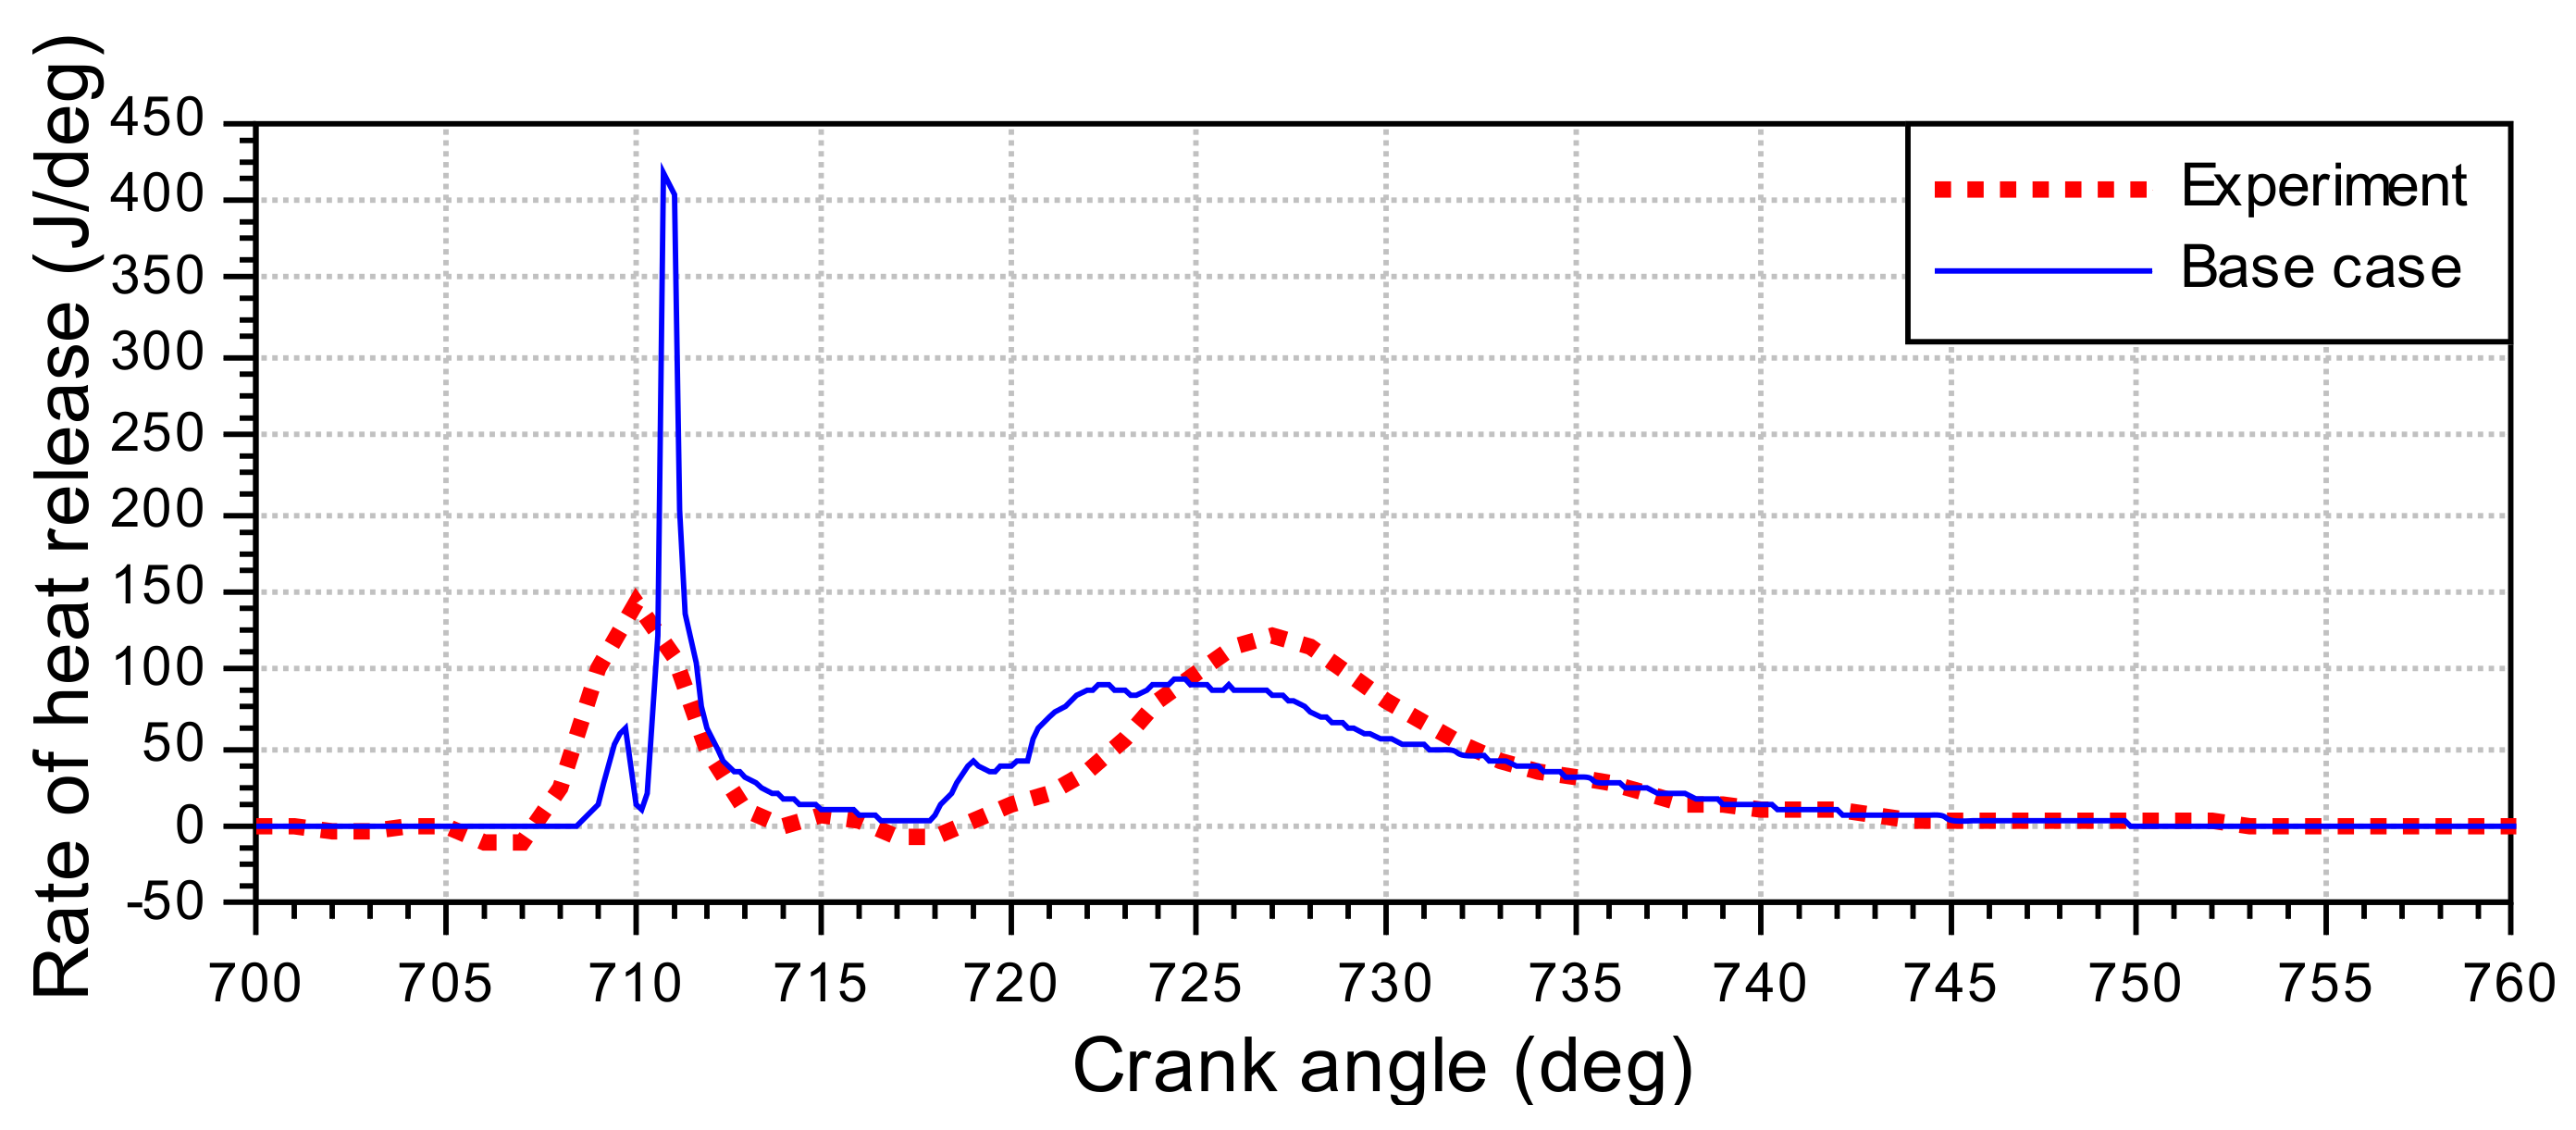
  • Verifying the model on fossil DF, using experiment data (verifying the model on alternative fuel experiment data, if possible);
  • Making a plan of the optimization experiment;
  • Defining the output evaluating parameters;
  • Setting optimization parameters and making the calculation grid;
  • Changing the type of fuel if desired (if necessary) and run the optimization;
  • Processing of calculation results.
The injection strategy optimization should be completed manually in Fire DVI, not in the way of automatic optimization. The combustion process should be evaluated through several parameters: emissions (NOx, PM), pressure rise rate and indicated work. Indicated work cannot be found in automatic mode. All other parameters (combustion analysis) should be evaluated manually.

3. Results and Discussions

The main evaluating parameters for comparing the experiment and calculated data (base case) are described in the Table 1. The difference between the calculated and measured results can be explained by the peculiar properties and assumptions of the emission calculating models. The main evaluating parameters are the pressure and the ROHR curves, and the alignment between the experiment and the calculation is satisfying. The base case is a two-stage injection case (one pilot injection, one main injection), with the same settings as for diesel fuel by default.
The results of the investigation of the combustion process of biodiesel in an operating diesel engine are described below. A good alignment of the calculated and experiment pressure curves can be seen in Figure 2. The area under the curves does not differ more than 3%. This parameter is used as an evaluation and characterizes the full cycle work.
From the ROHR curve, displayed in Figure 3, SOC can be detected. The difference in the SOC parameter for the pilot and the main injections between the calculation and the experiment results does not exceed 1 CAD.
The difference in the ROHR for the pilot injection can be explained by the low sensitivity of the combustion model to low fuel injection mass. The difference between the square under the calculated and experiment ROHR curves (means AHR) does not exceed 5%. The maximum value of the ROHR for the main injection does not differ much for the experiment and calculated curves.
It is important to note that both ROHR curves are calculated and that is because the main and the dominating criterion for the validation is the pressure curve as the measured value. Nevertheless, the alignment of the curves is satisfying; for example, the authors in [37] have a similar alignment.

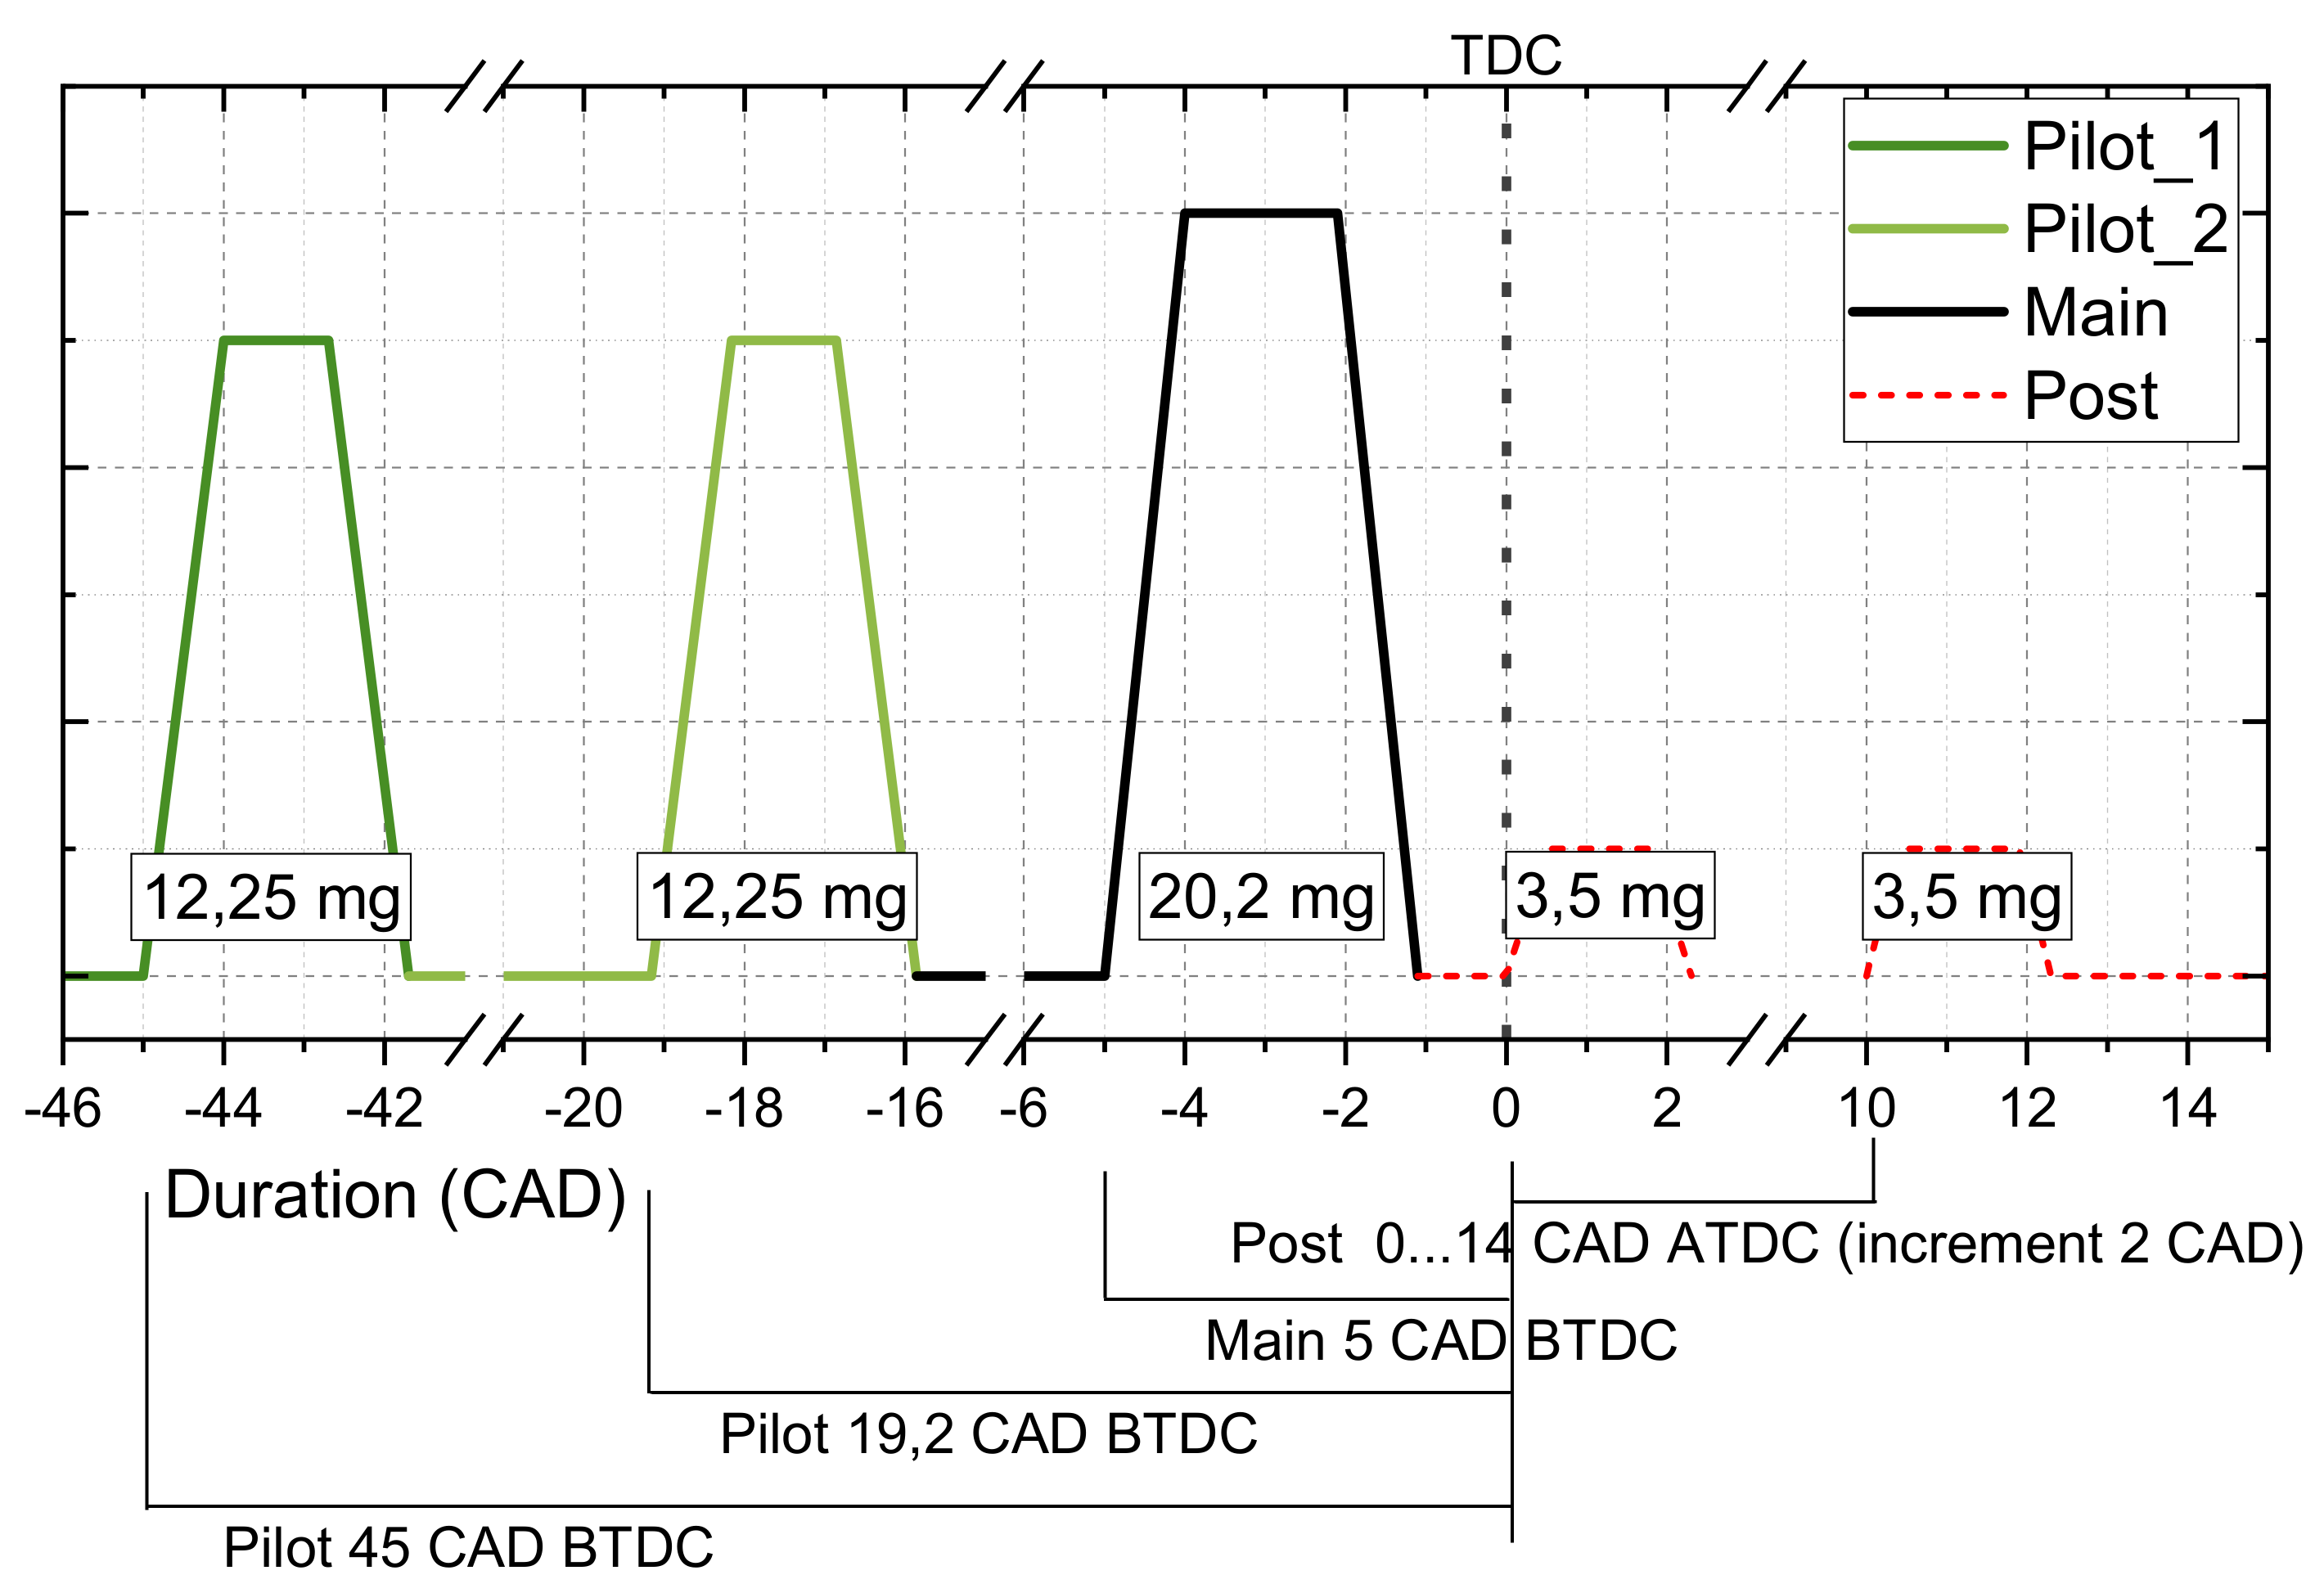
3.1. Two Pilot Injections

3.1.1. First Pilot SOI Optimization

The first and the second pilot injection masses were the same and equal to 14 mg/cycle as can be seen in Figure 3, Figure 4 and Figure 5, where the three-stage injection strategy is depicted. There were three constant SOI values chosen for the second pilot: 45 CAD BTDC, 19.2 CAD BTDC and 10 CAD BTDC shown in Figure 3, Figure 4 and Figure 5, respectively.
The first pilot (variable) is shown by red dashed line, the SOI range is from 70 CAD BTDC to 10 CAD BTDC with an increment of 5 CAD. The fuel mass for each injection is shown in Figure 4 and is constant. It is interesting to note that the authors in [38] investigated split injection strategies with varying pilot SOI (one pilot injection) in the range from 30 CAD BTDC to 15 CAD BTDC, and they did not notice a significant influence of the pilot SOI on the emissions.
In Figure 5 the injection strategy for the second pilot SOI 19.2 CAD BTDC is depicted (orange line). The dashed red line is chosen to mark the first pilot SOI variable and the range is the same as for the previous case.
In Figure 6 the injection strategy for the second pilot (green line) SOI 10 CAD BTDC is depicted in a similar way as for the two previous cases. The main SOI is depicted as a constant in Figure 3, Figure 4 and Figure 5. The colors for the second pilot injection correspond to the colors in Figure 7. In Figure 7, an indicated work, the pressure rise rate, and NOx and PM emissions are depicted.
The reference value for each parameter (base case value) is marked by a dashed red line. Each of three lines on the graph in Figure 7 correspond to the SOI of the second pilot (the values are shown in legend and on Figure 3, Figure 4 and Figure 5).
An increase in indicated work retarding the first pilot SOI can be seen. The base value of indicated work for the second pilot SOI is equal to 45 CAD BTDC and at the first pilot the SOI is equal to 10 CAD BTDC, but NOx emissions exceeded the base case level. This tendency can be seen for other fixed SOI values of the second pilot injection. The main purpose of the optimization was to decrease the NOx emissions, which strongly depend on the local temperature in CC, by retarding the pilot SOI.
Advancing the SOI of the first pilot injection decreases NOx and increases PM emissions, as can be seen below in Table 2 and Table 3. Advancing the first pilot SOI leads to an increase in the CO mole fraction and a decrease in AHR. This means that the combustion process becomes less efficient. It can be assumed that this is due to a relatively low efficiency evaporation process because of the low temperature and pressure values at the SOI. Moreover, advancing the first pilot SOI means the compression work increases. It is not possible to simultaneously decrease the emissions and increase the efficiency of the combustion process at any time during the first pilot SOI, or at least save the fuel efficiency at the base case level.
On lower loads, the pilot injection mass is comparable to the main injection mass, hence the influence of the compression work on the indicated work should be much more significant. However, to analyze the reasons for the change of indicated work, it is necessary to describe the combustion process in detail. The main parameters of CP for the second pilot SOI 45 CAD BTDC are displayed in Table 2. Ai means the indicated work, and Acompr means the compression work (work BTDC), these parameters and AHR and CO mole fraction are relative. The start of combustion (SOC) for all cases of the three-stage injection is the same. It is important to note that the TDC of the compression stroke is at 720 CAD. The three stage injection reduces the AHR and increases the CO mole fraction. This means that the use of fresh charge becomes less efficient with the addition of the second pilot injection and the advancement of the SOI of the first pilot.
The indicated work increases when the SOI of the first pilot is retarded and becomes almost equal to the base case value despite an increasing CO mole fraction, combustion work, CD and a decreasing of the AHR. This can be explained by the earlier end of combustion (EOC) that causes decreased heat loss through exhaust gases and through the cooling system.
The main parameters of CP for the case with the second pilot SOI 10 CAD BTDC are described in Table 3. The combustion process is much more efficient with the increase in AHR and indicated work and the decrease in the CO mole fraction, CD, compression work with the SOI retarded. The EOC does not exceed the base case level.
There are two main parameters which influence the indicated work: the compression work and the efficiency of the combustion process. The first parameter depends on the SOC and the amount of fuel–air mixture ready to burn, the premixed charge, and the quantity of the air–fuel mixture burned before TDC (AHR before TDC). The second depends on the parameters displayed in Table 2 and Table 3.
The ROHR for the second constant pilot SOI 19.2 CAD BTDC is depicted in Figure 8.
The ROHR peak value decreases in the case of the three-stage injection compared with the base case (two stage injection). The burning of the pilot injection fuel mass becomes smoother when the first pilot SOI is advanced.
In the range from 705 CAD to 710 CAD we can see the burning of the premixed charge for the three-stage injection (two cases with two pilot injections and one main; the first pilot SOI 70 CAD BTDC and 40 CAD BTDC and the second is fixed at 19.2 CAD BTDC for both). In the range from 708 CAD to 710.5 CAD we can see the burning of the premixed charge for the base case and for the three-stage injection with the first pilot SOI 19.2 CAD BTDC and the second pilot SOI 10 CAD BTDC. In the last case, the burning of the pilot injection fuel mass is combined with burning the main injection fuel mass.
The maximum value of the ROHR can be decreased with advanced injection timing and by adding the second pilot injection. Similar results have been described in the research [39] where the influence of multiple injections on the ROHR curve were investigated.
The first pilot SOI was varied in the range from 70 CAD BTDC to 10 CAD BTDC with increments of 5 for three different constant values of the second pilot SOI, and there was no opportunity to reduce the emissions and increase or save on the base case level of the efficiency. Therefore, the simulation strategy should be changed. The design of an experiment with a relatively large parameter grid should be created to evaluate all the SOI variations of the first and the second pilots, and their influence on each other.

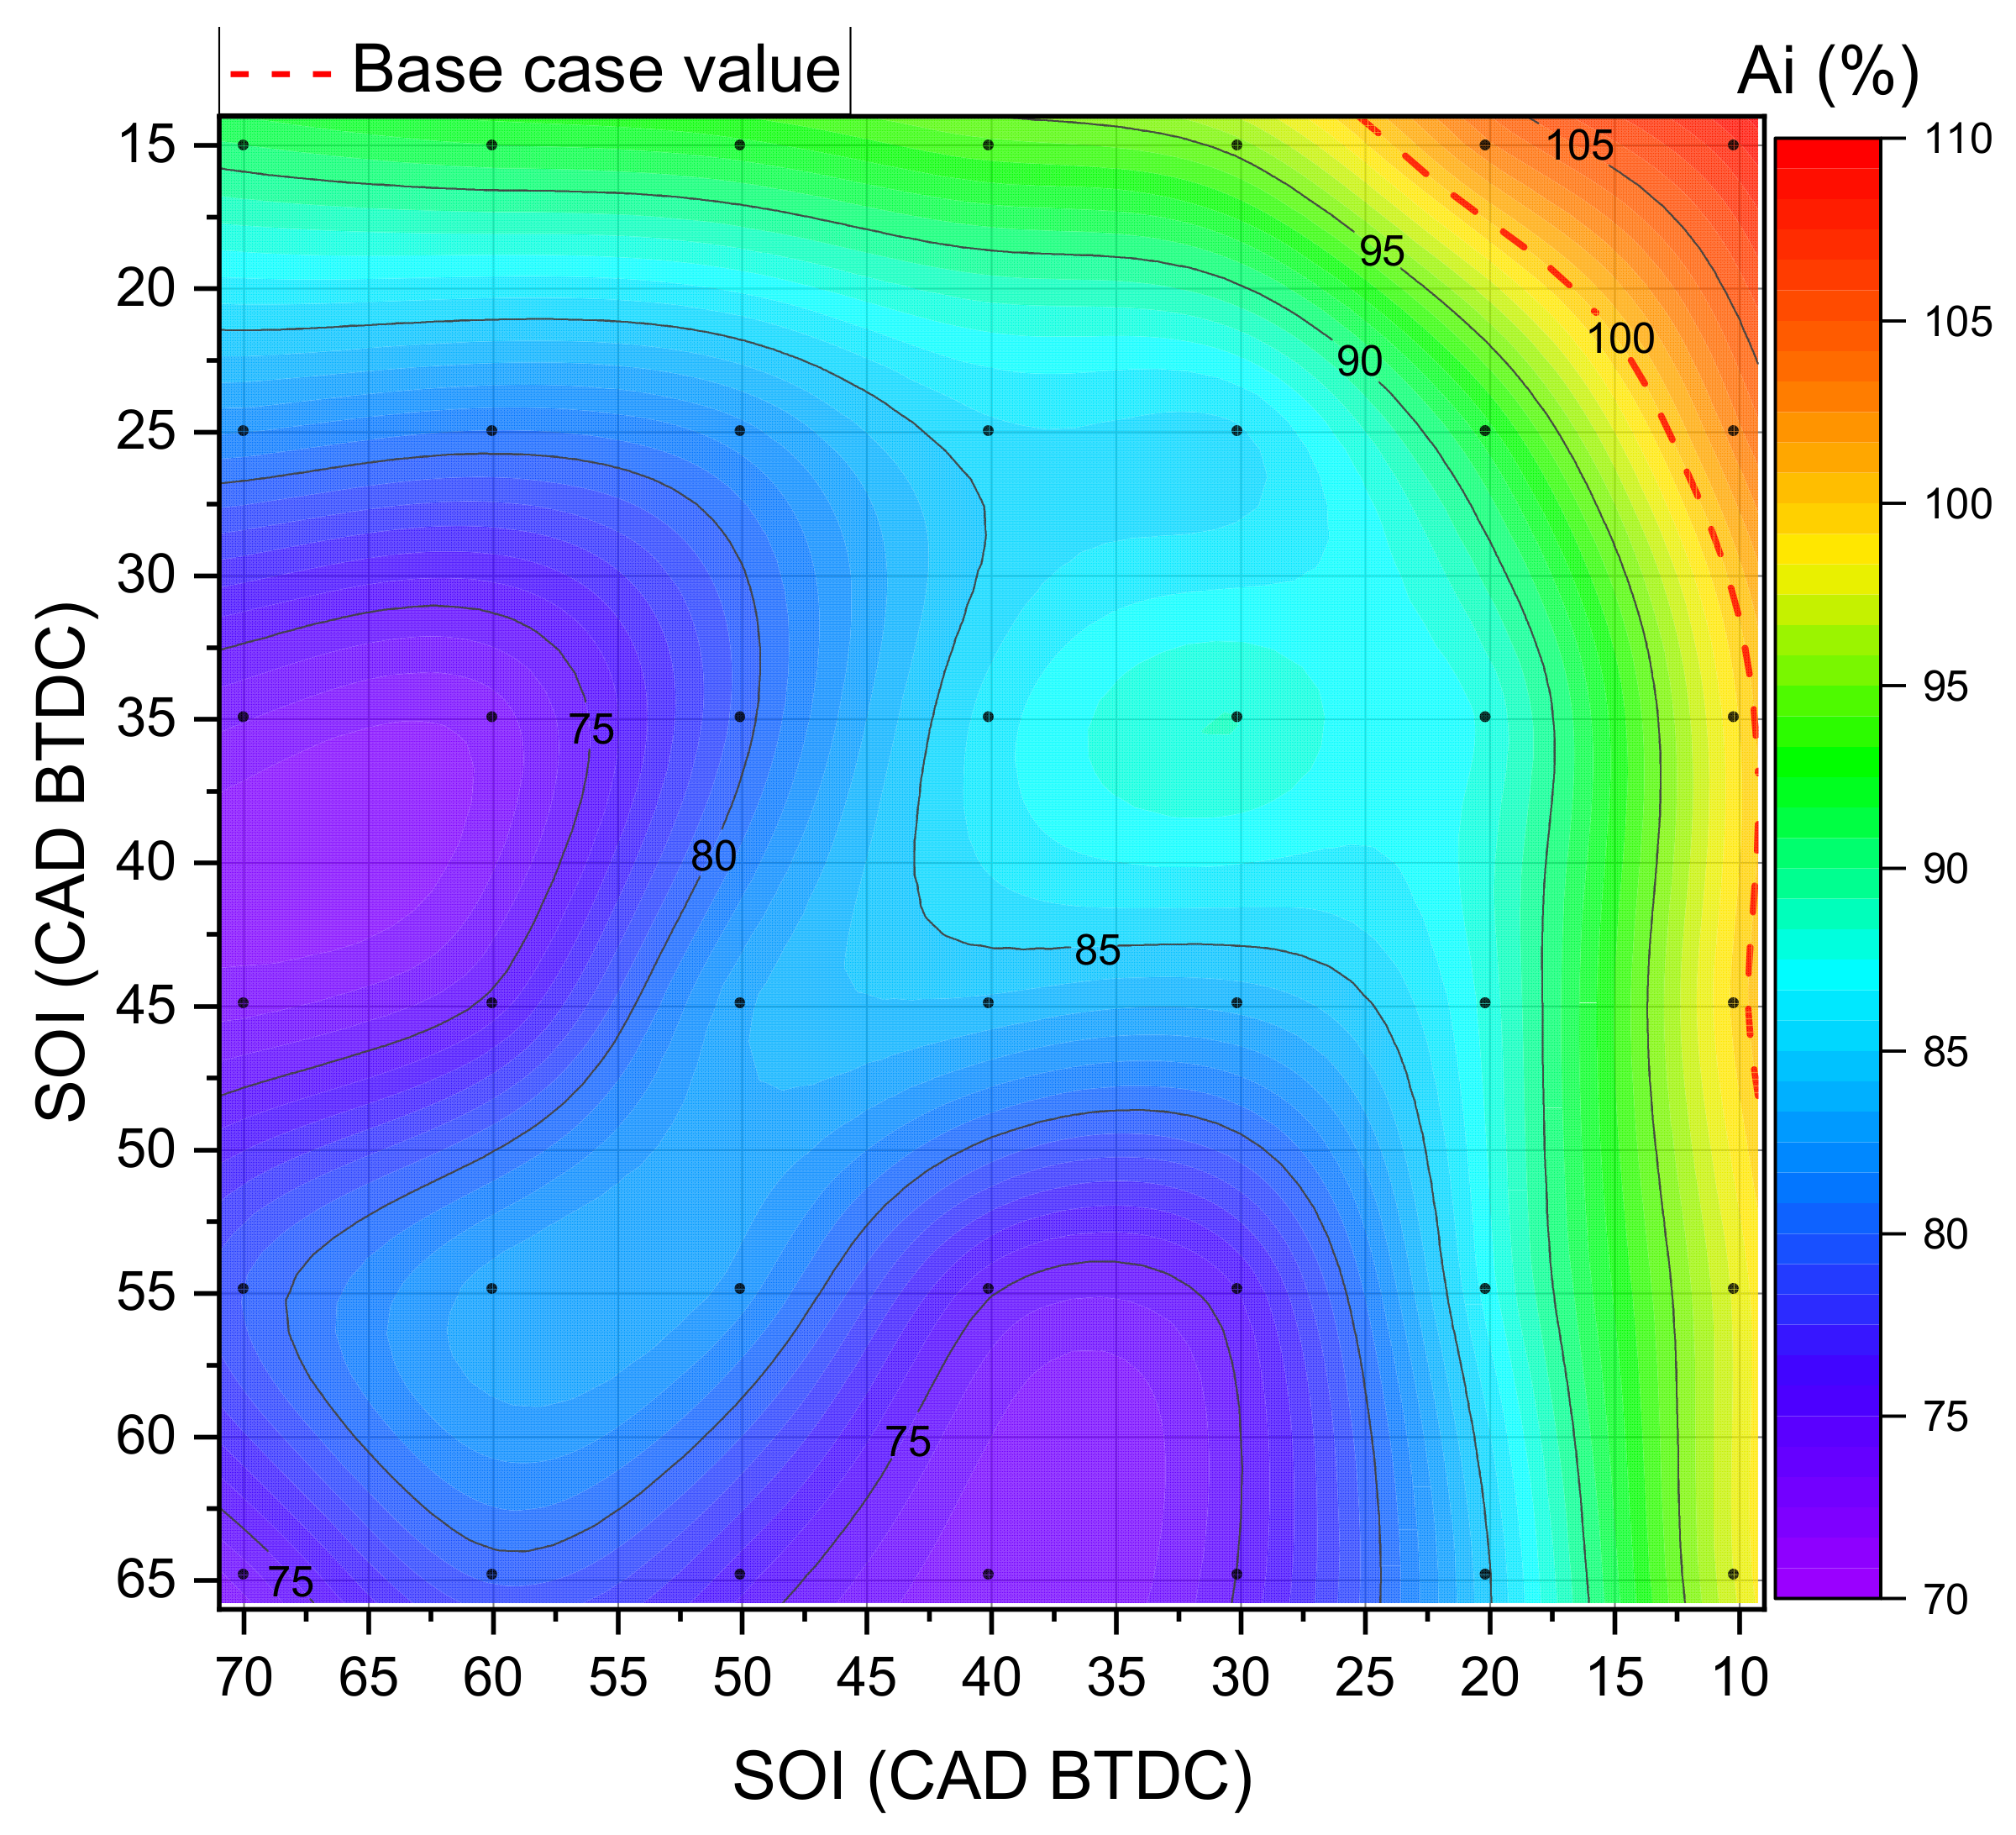
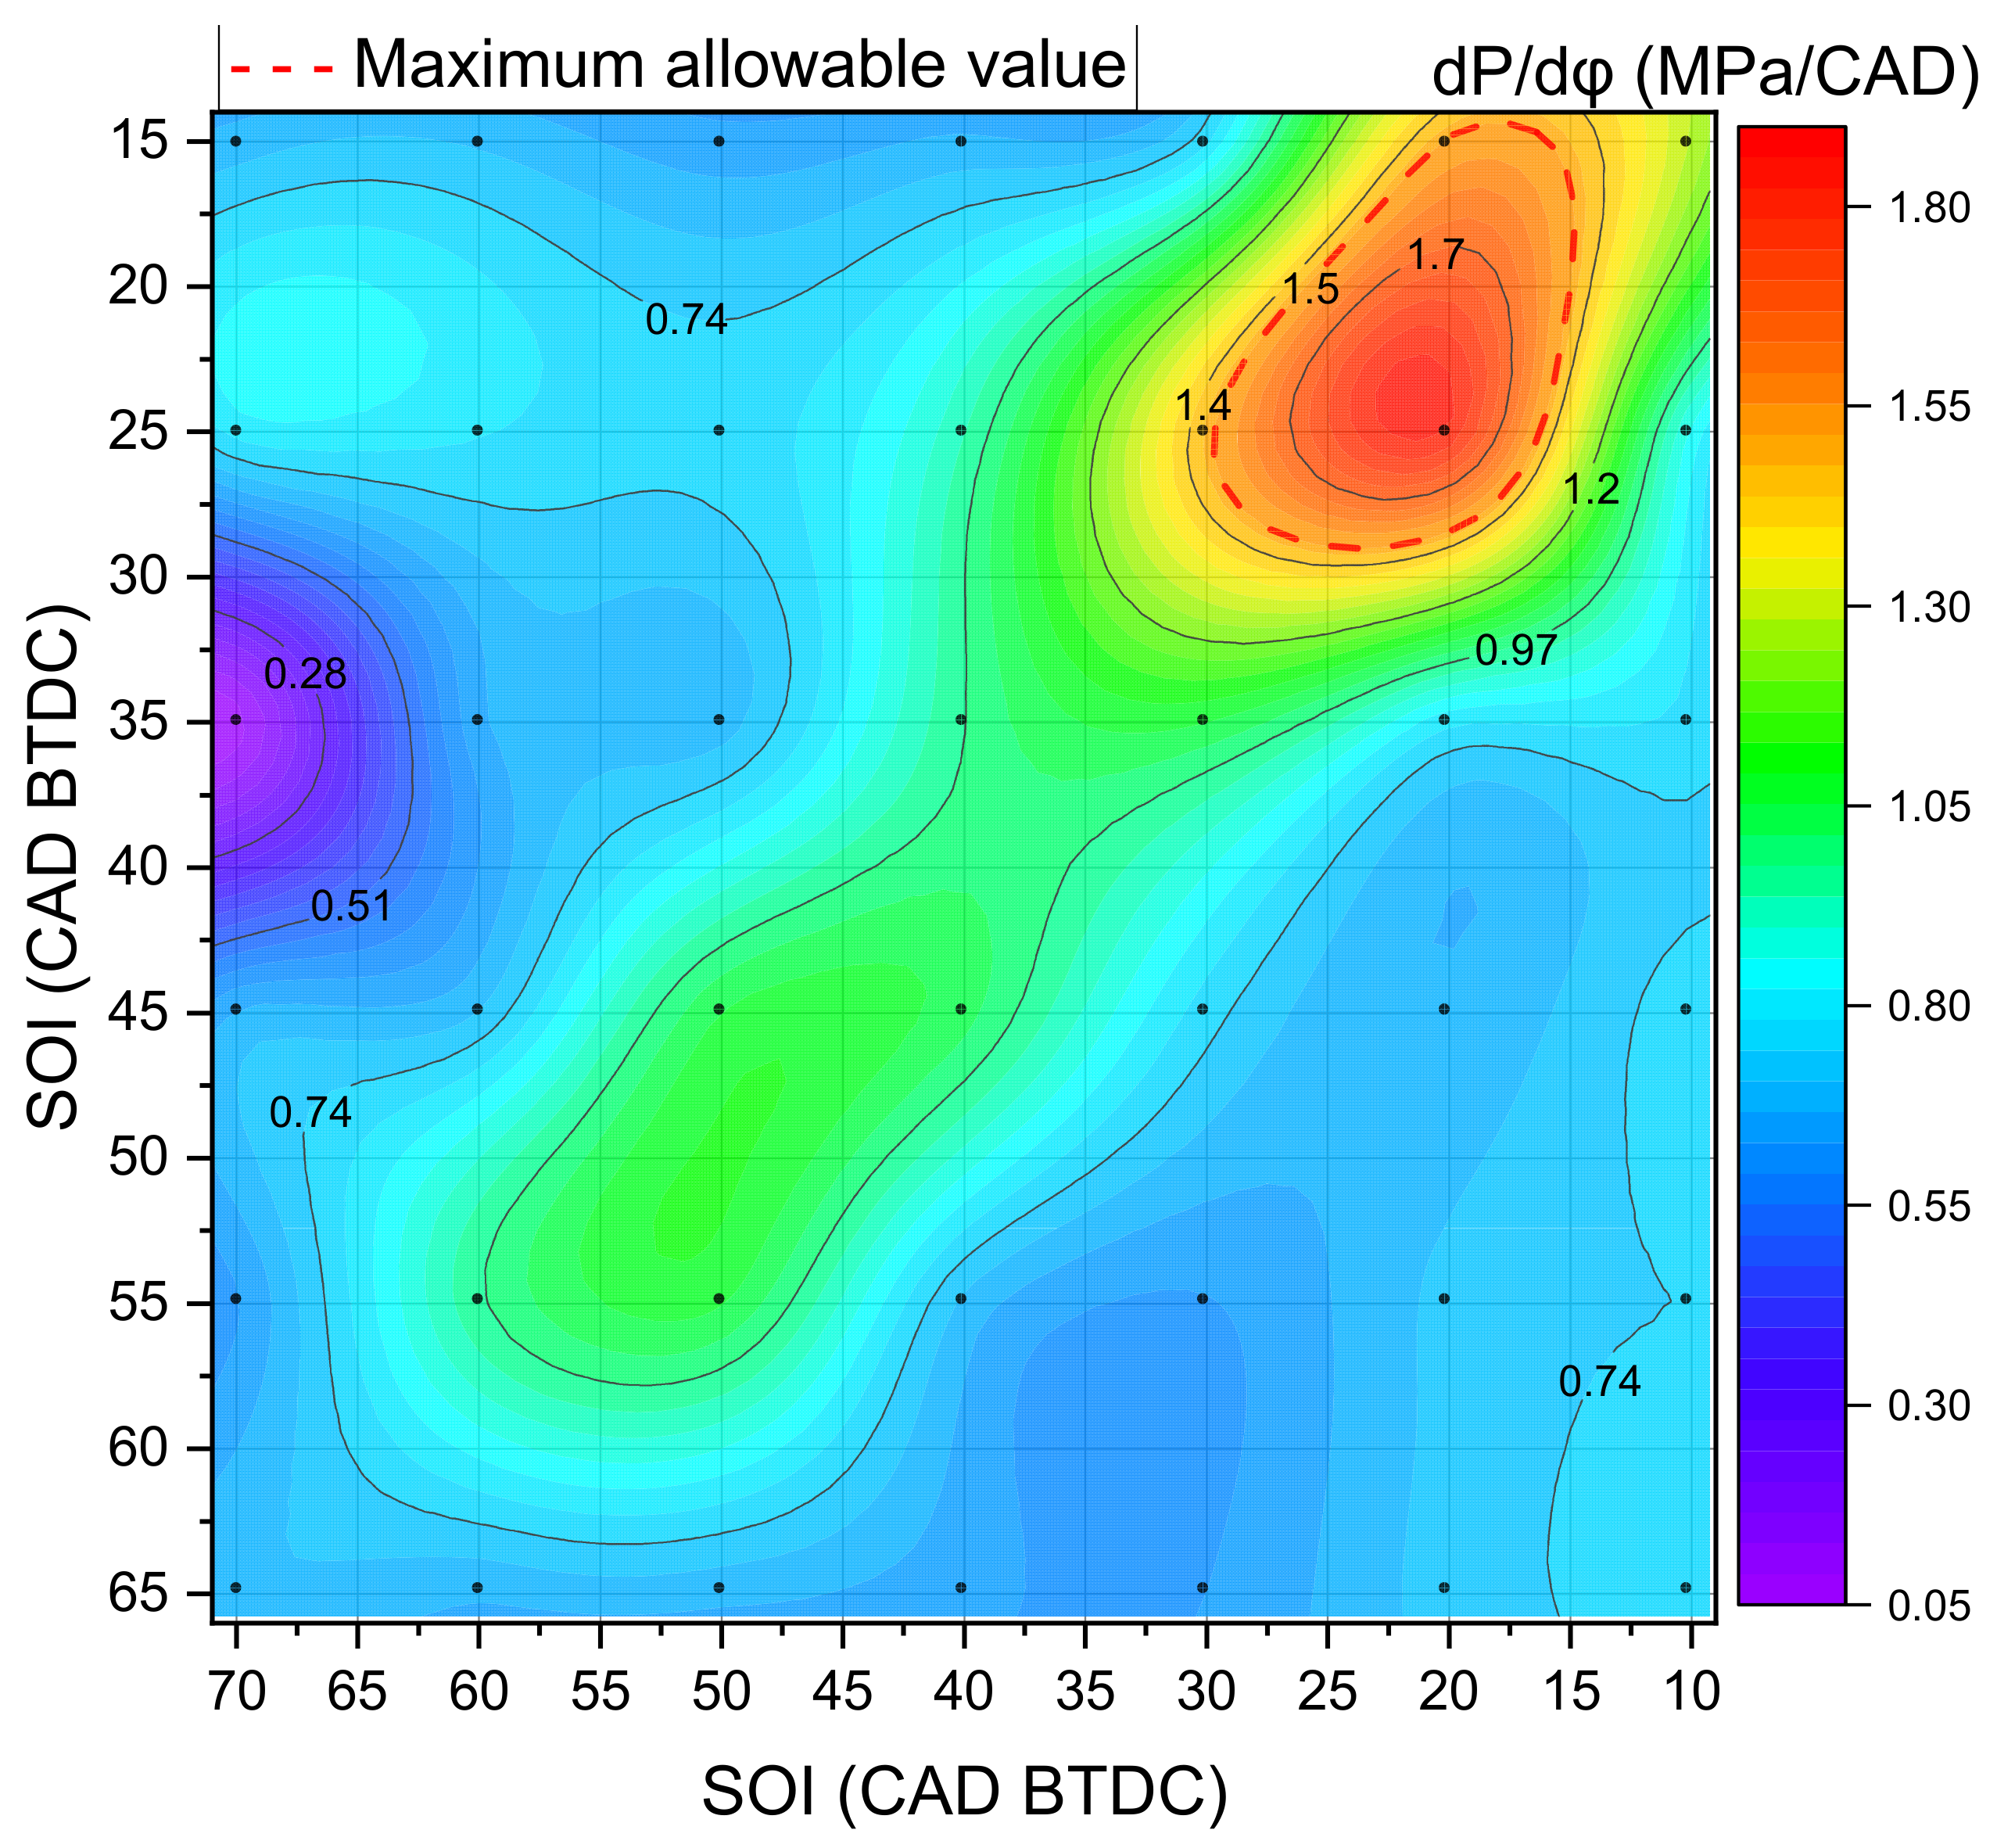
3.1.2. The Design of the Experiment Simulation

In Figure 9 an indicated work contour plot in dependence of the SOI for the first and second pilot injections is depicted. The range for the first pilot SOI is from 70 CAD BTDC to 10 CAD BTDC with increments of 5 CAD. For the second pilot it is from 65 CAD BTDC to 15 CAD BTDC with increments of 5 CAD. Increasing or saving the indicated work base case level is possible using a retarded SOI for both pilot injections simultaneously. The red-dotted reference line can be seen (base case level), and further on each contour plot.
The pressure rise rate field (Figure 10) shows that exceeding the critical value of 1.5 MPa/ACD is possible at a SOI range from 30 CAD BTDC to 15 CAD BTDC for both pilot injections. It is important to note that the red-dotted reference line on this figure means the highest allowable value for a diesel engine.
To decrease the PM emissions, the SOI range for the first pilot injection should be in the range from 37 CAD BTDC to 10 CAD BTDC (Figure 11). At the same time, the SOI for the second pilot injection should not be less than 20 CAD BTDC (more retarded than 20 CAD BTDC).
NOx emissions exceeding the base case level can be achieved earlier than when the indicated work reaches the base case level, as it can be seen in Figure 12. The decrease in NOx emissions lower than the base case level can be achieved in the range of the SOI more than 20 CAD BTDC to 25 CAD BTDC for both pilot injections.
In conclusion, there is no such combination of SOI for both pilots at which the decreasing of the NOx emissions, PM and at least saving the base level of efficiency can be achieved. Researchers [40] have investigated the influence of the multiple injection strategies on the emissions. They have used two pilot injections with SOI variable from 38 CAD BTDC to 28 CAD BTDC with increments of 5 degrees. They also varied the pilot mass injection. The researchers marked a decrease in the NOx and a slight decrease in the soot emissions with an improving combustion process.

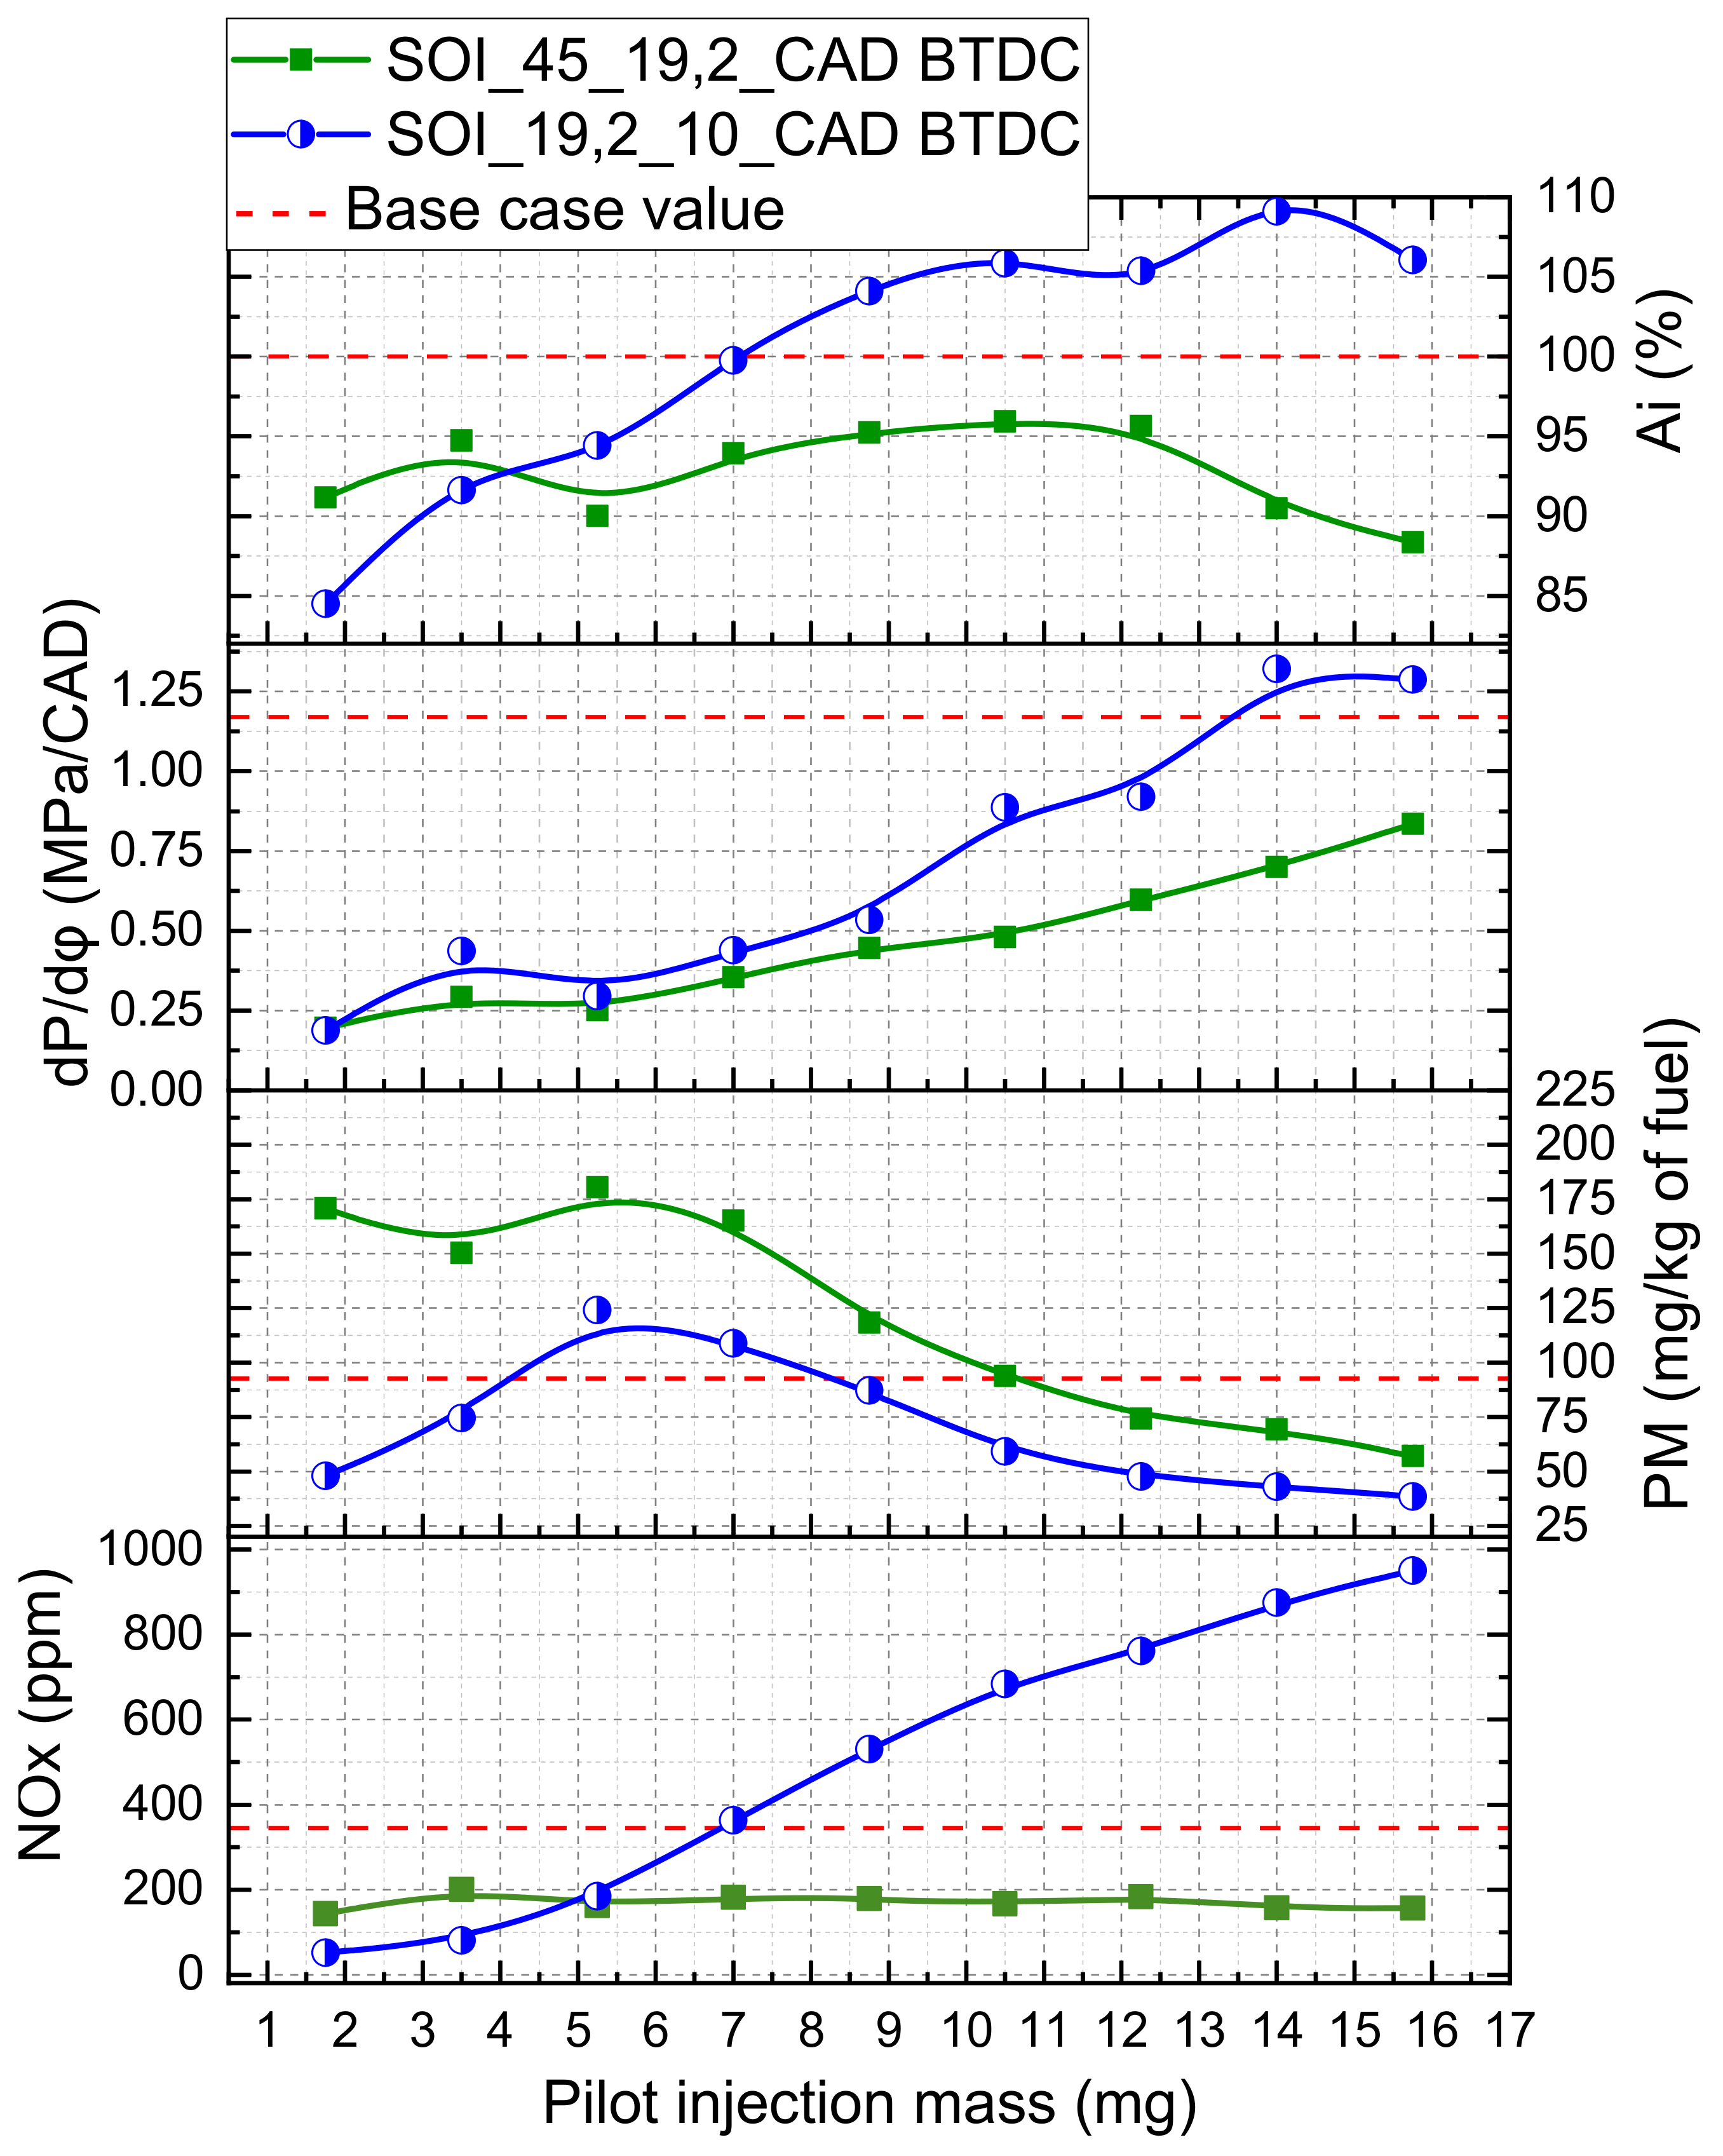
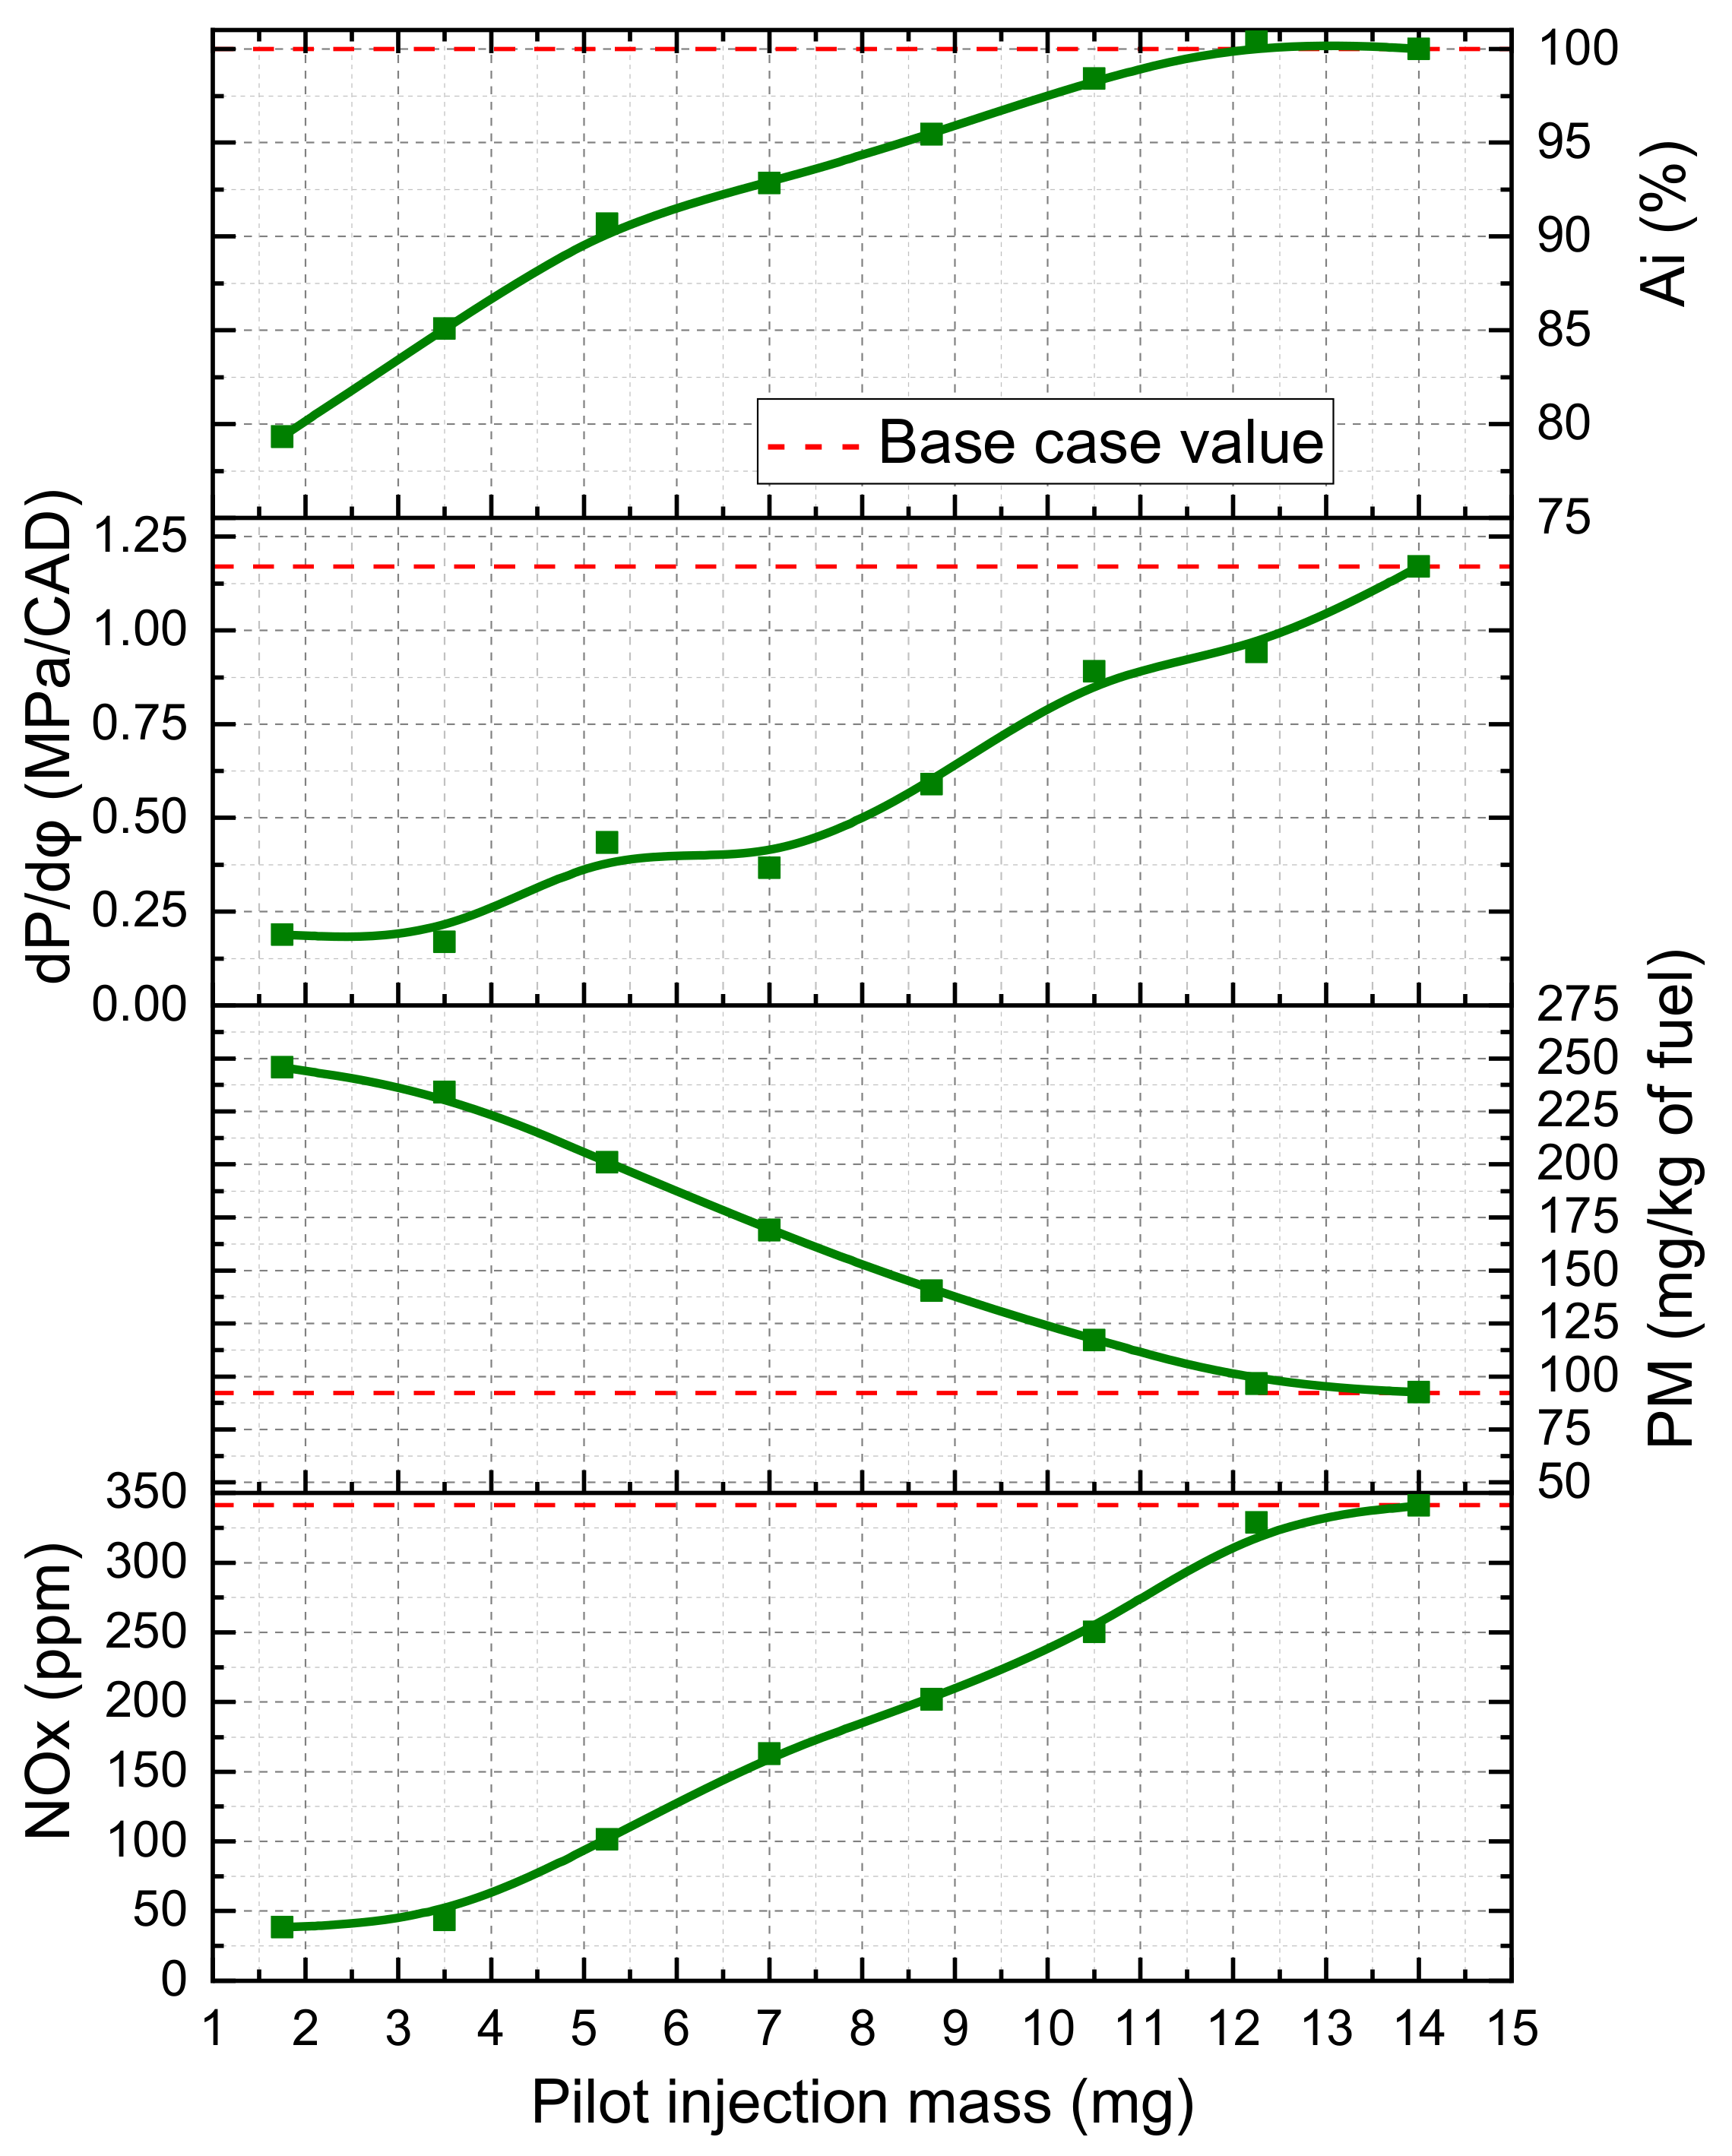
3.1.3. Pilot Injection Fuel Mass Optimization

The next step should be the optimization of the pilot injection fuel mass for two combinations of SOI:
1–the first pilot injection: SOI 45 CAD BTDC, the second: 19.2 CAD BTDC. The lowest NOx emissions and a relatively low indicated work value are achieved. It is expected that the indicated work will increase due to the reduction in the compression work value via the decreasing the fuel mass injected BTDC, but still the reserve of NOx emissions is necessary.
2–the first pilot injection: SOI 19.2 CAD BTDC, the second: 10 CAD BTDC. It is expected to decrease the NOx emissions due to a decrease in the pilot injection fuel mass. As was mentioned above the fuel mass of the pilot injection is close enough to fuel the mass of the main injection in case of a three-stage injection. The pilot injections play an important role in the combustion process, and probably have the main influence on the local temperature in CC as long as the fresh oxidizer is available for the first pilot injection predominantly. Further, the first and the second SOI pilot injection sets.
The results of the simulation are depicted in Figure 13. The first pilot injection mass fuel is equal to the second. The varying range is from 3.5 mg to 15.75 mg with increments of 1.75 mg. The fuel mass for both pilot injections is the same.
For the first SOI pilot injection set an indicated work is lower than the base case value in the range from 5% to 9%. A decrease in the rate of the pressure rise with a decrease in the pilot injection fuel mass can be seen. The PM emissions are higher than the base level in the range of the pilot injection fuel mass from 1.75 mg to 10.5 mg, and the increase in the pilot fuel mass injection decreases the PM emissions. The NOx emissions are lower than the base case level in the whole pilot fuel mass injection varying range, divided by factor 1.5.
In the second SOI pilot injection set the indicated work value is lower than base case level in the range of the fuel mass pilot from 1.75 mg to 7 mg, the increase in the pilot injection fuel mass leads to an increase in indicated work. The pressure rise rate does not exceed the critical value of 1.5 MPa/CAD. The PM emissions has a higher base case level in the range of the pilot injection fuel mass in a range from 3 mg to 9 mg. The NOx emissions lower base case level is in the range from 1.75 mg to 7 mg of the pilot injection fuel mass. Later increases in pilot injection fuel mass leads to an increase in NOx emissions.
The authors in [41,42] conducted an investigation where the analyses of multiple injection strategy on the combustion process was described. They mention that emissions strongly depend on the engine load.
The varying of the pilot injection fuel mass does not allow the purpose of the optimization to be reached.

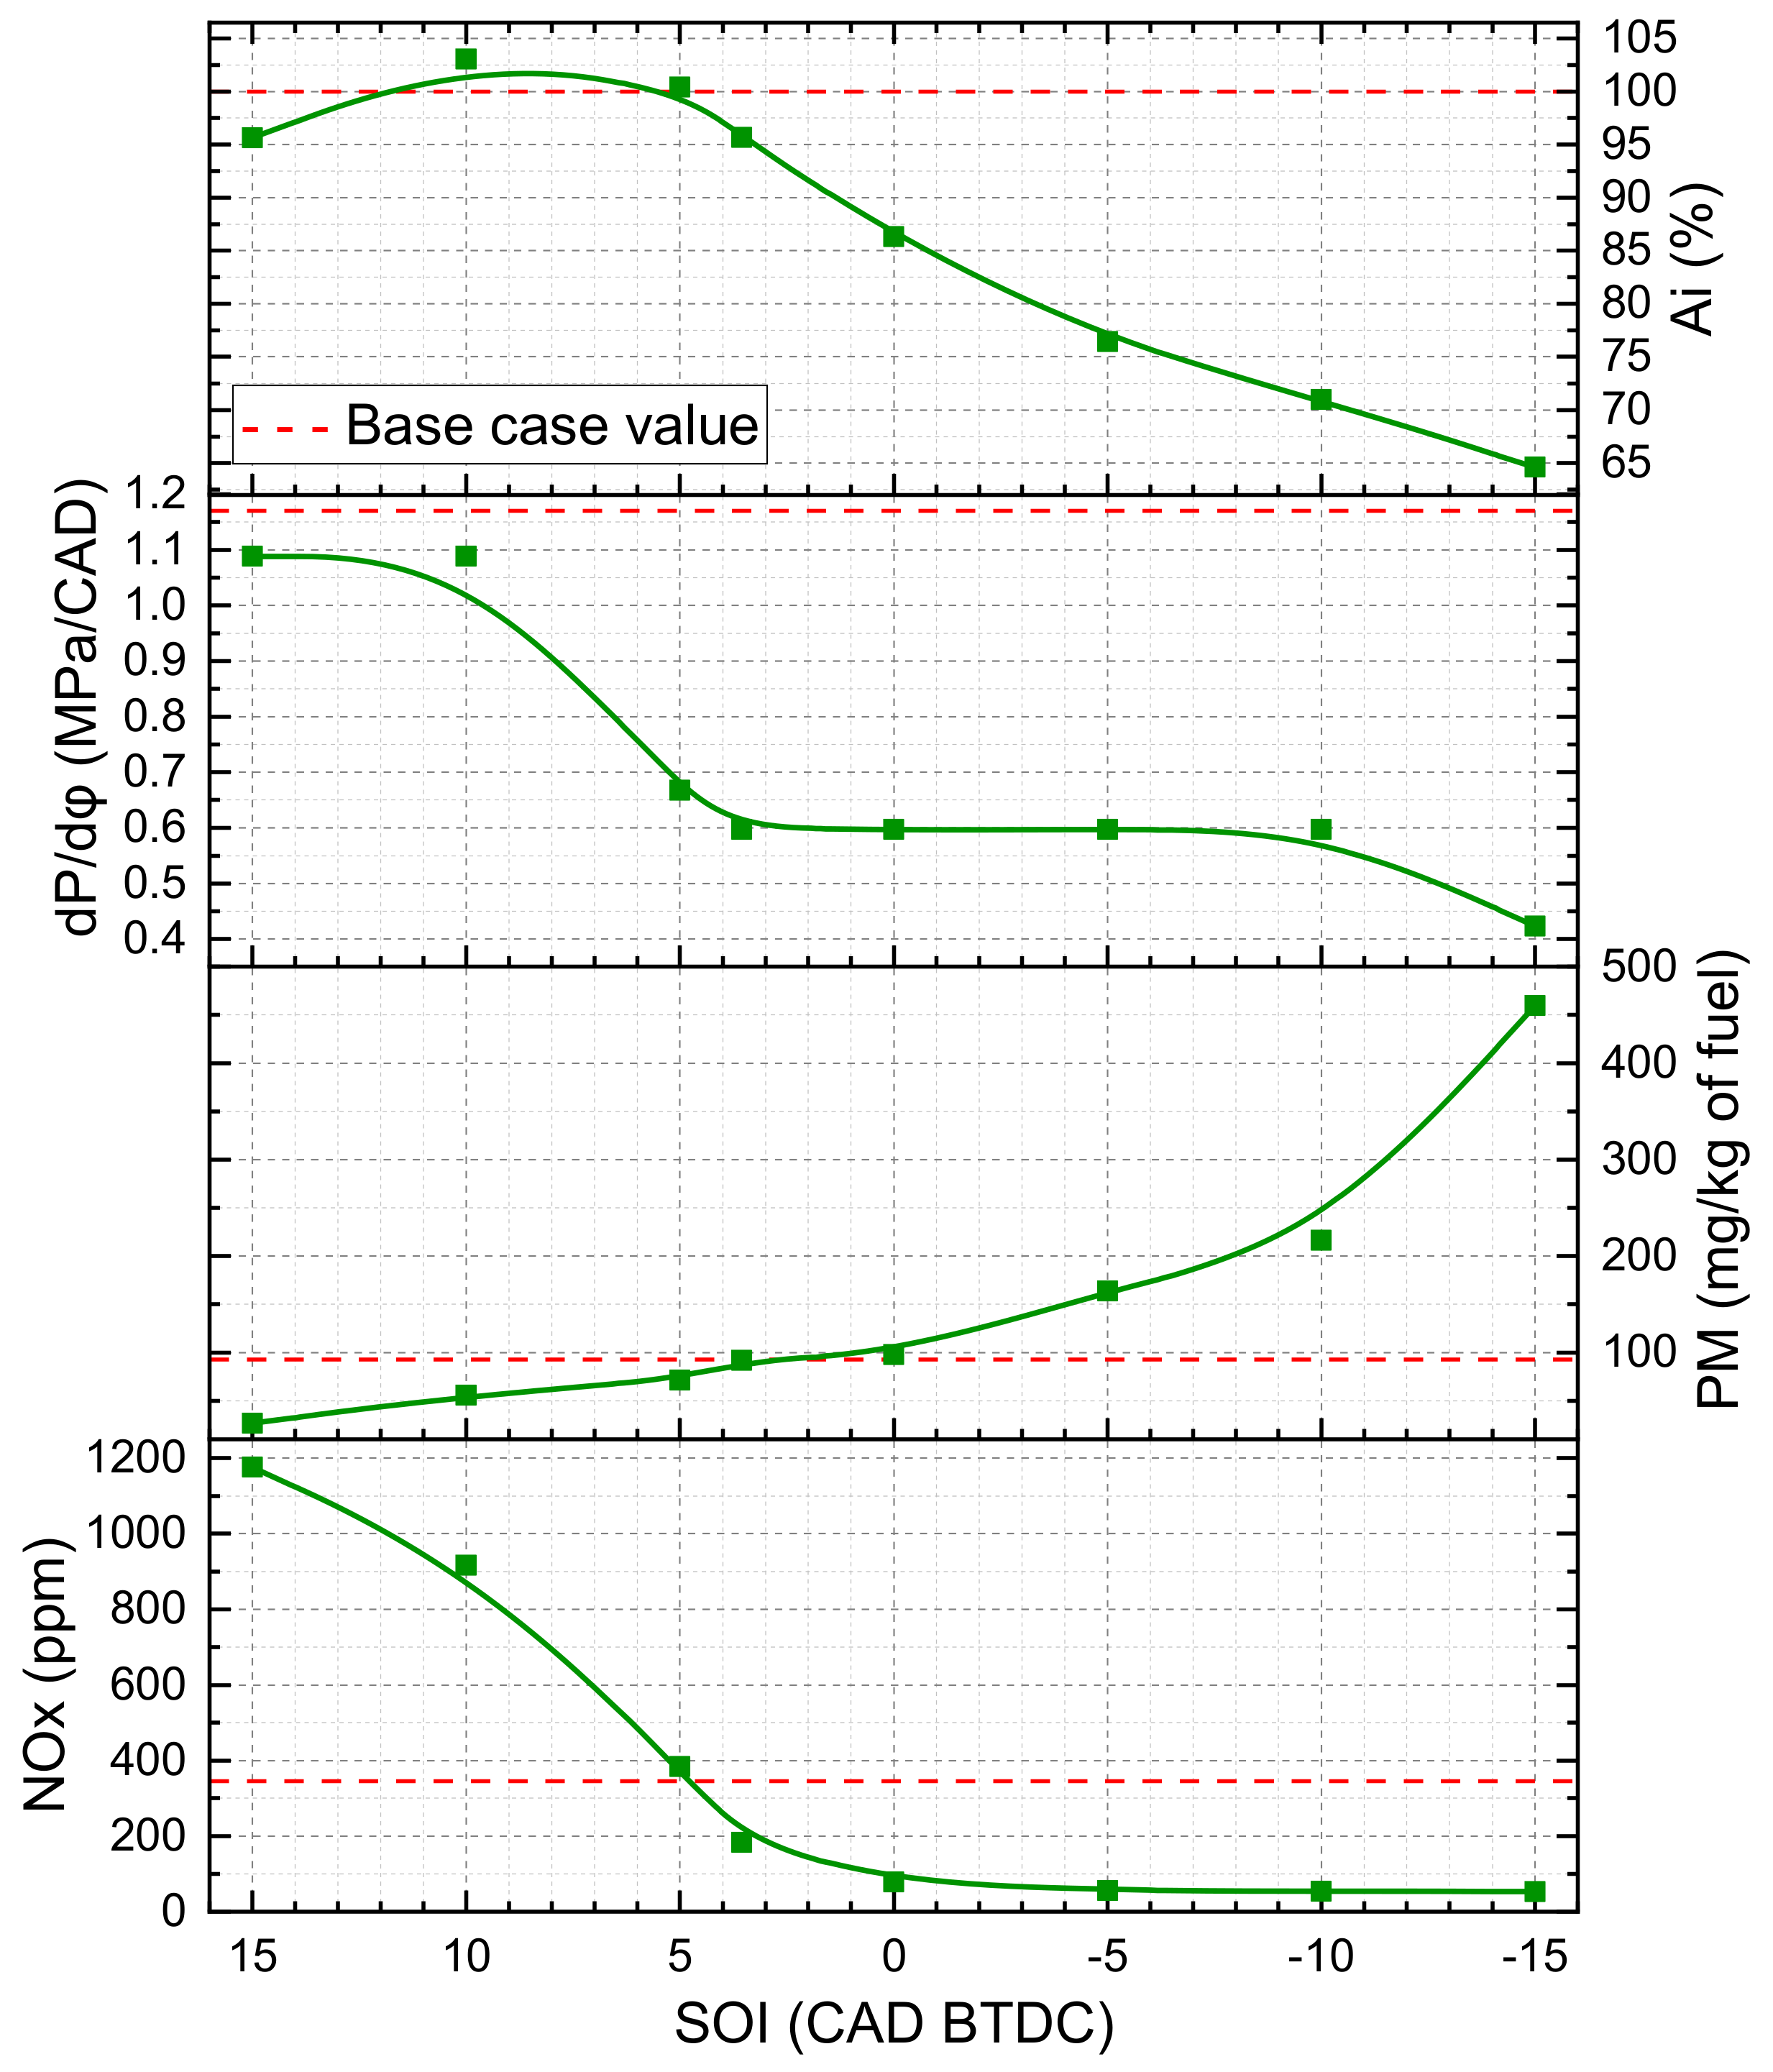
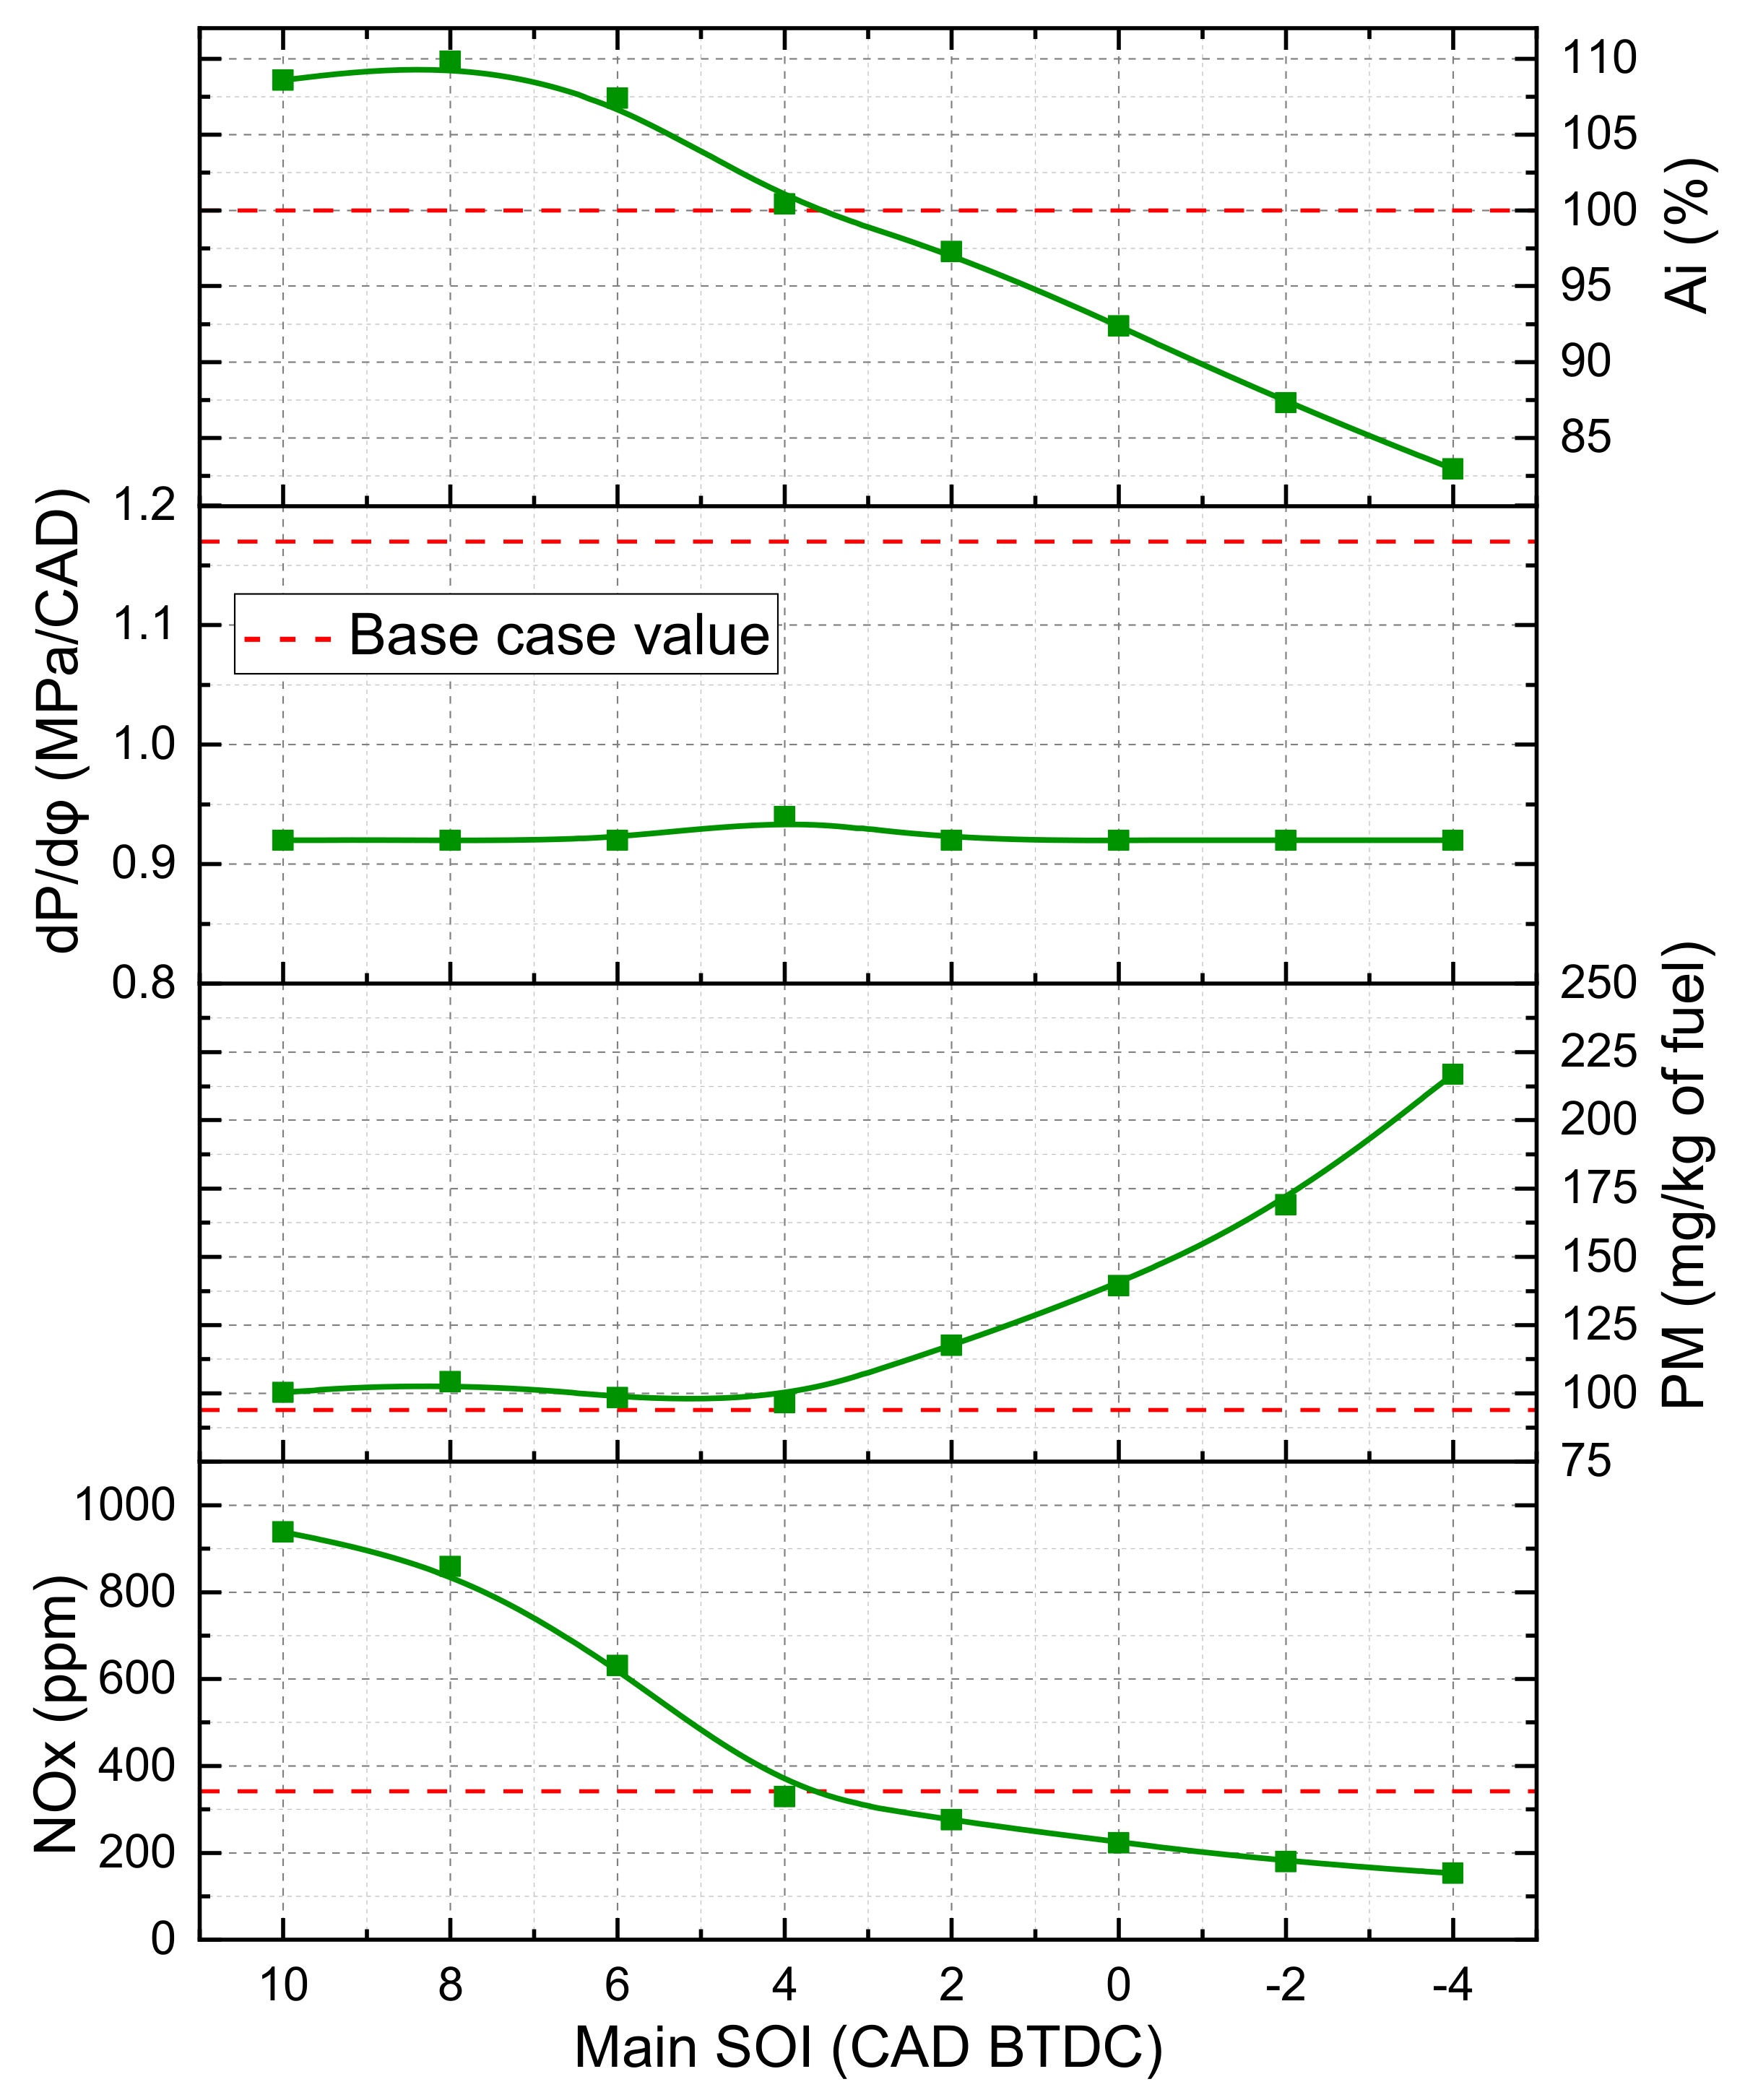
3.1.4. Main Injection SOI Optimization

The next step of the optimization is to vary the main SOI. The main SOI optimization simulation should be completed with other injection parameters set constant. Thus, the first pilot SOI is fixed at a value of 45 CAD BTDC, the second pilot SOI is fixed at a value 19.2 CAD BTDC, the first and the second pilot injection fuel masses are set equal to 12.25 mg. This is expected to increase the indicated work by advancing the main SOI in the range from 15 CAD BTDC to 15 CAD ATDC with increment 5 CAD, as shown in Figure 14.
The negative SOI value on this figure means the injection ATDC. The optimal SOI range to increase the indicated work is from 11 CAD BTDC to 5 CAD BTDC compared with the base case level. Advancing the SOI out of the described range decreases the indicated work by 5% and retarding the SOI out of range decreases the indicated work by 35%. The highly advanced SOI leads to an increase in compression work, and a highly retarded SOI leads to significant heat losses.
Varying the main SOI does not lead to an exceeding of the allowable level of pressure rise rate. To decrease the PM emissions, the main SOI range from 15 CAD BTDC to 0 CAD BTDC should be chosen. The maximum decrease is 71% compared with the base case level at 15 CAD BTDC. To decrease the NOx emissions, the advancing main SOI should not be more than 5 CAD BTDC. The optimal value of the main SOI should be chosen to be equal to 5 CAD BTDC. The 23% reduction in PM emissions can be achieved, as well as the base case level of the indicated work and the increase in NOx emissions by 20%. It is expected to reduce the NOx emissions through engaging the post injection. In general, advancing the main SOI leads to an increase in NOx emissions and a decrease in PM emissions. Similar results are described by the authors in [43]. The authors in [44,45] investigated the influence of advanced injections strategies with EGR on the combustion process. The main idea was to split the main injection and to investigate the dwell between the last main and post injection. It was verified that the three-split strategy in combination with 20% of EGR led to most of the investigated cases being within a narrow range of NOx concentrations without an increase in the soot emissions. It was found that the injection strategy seems to have a great impact in soot emission reduction for the cases characterized by 80% fuel injected through main pulses.

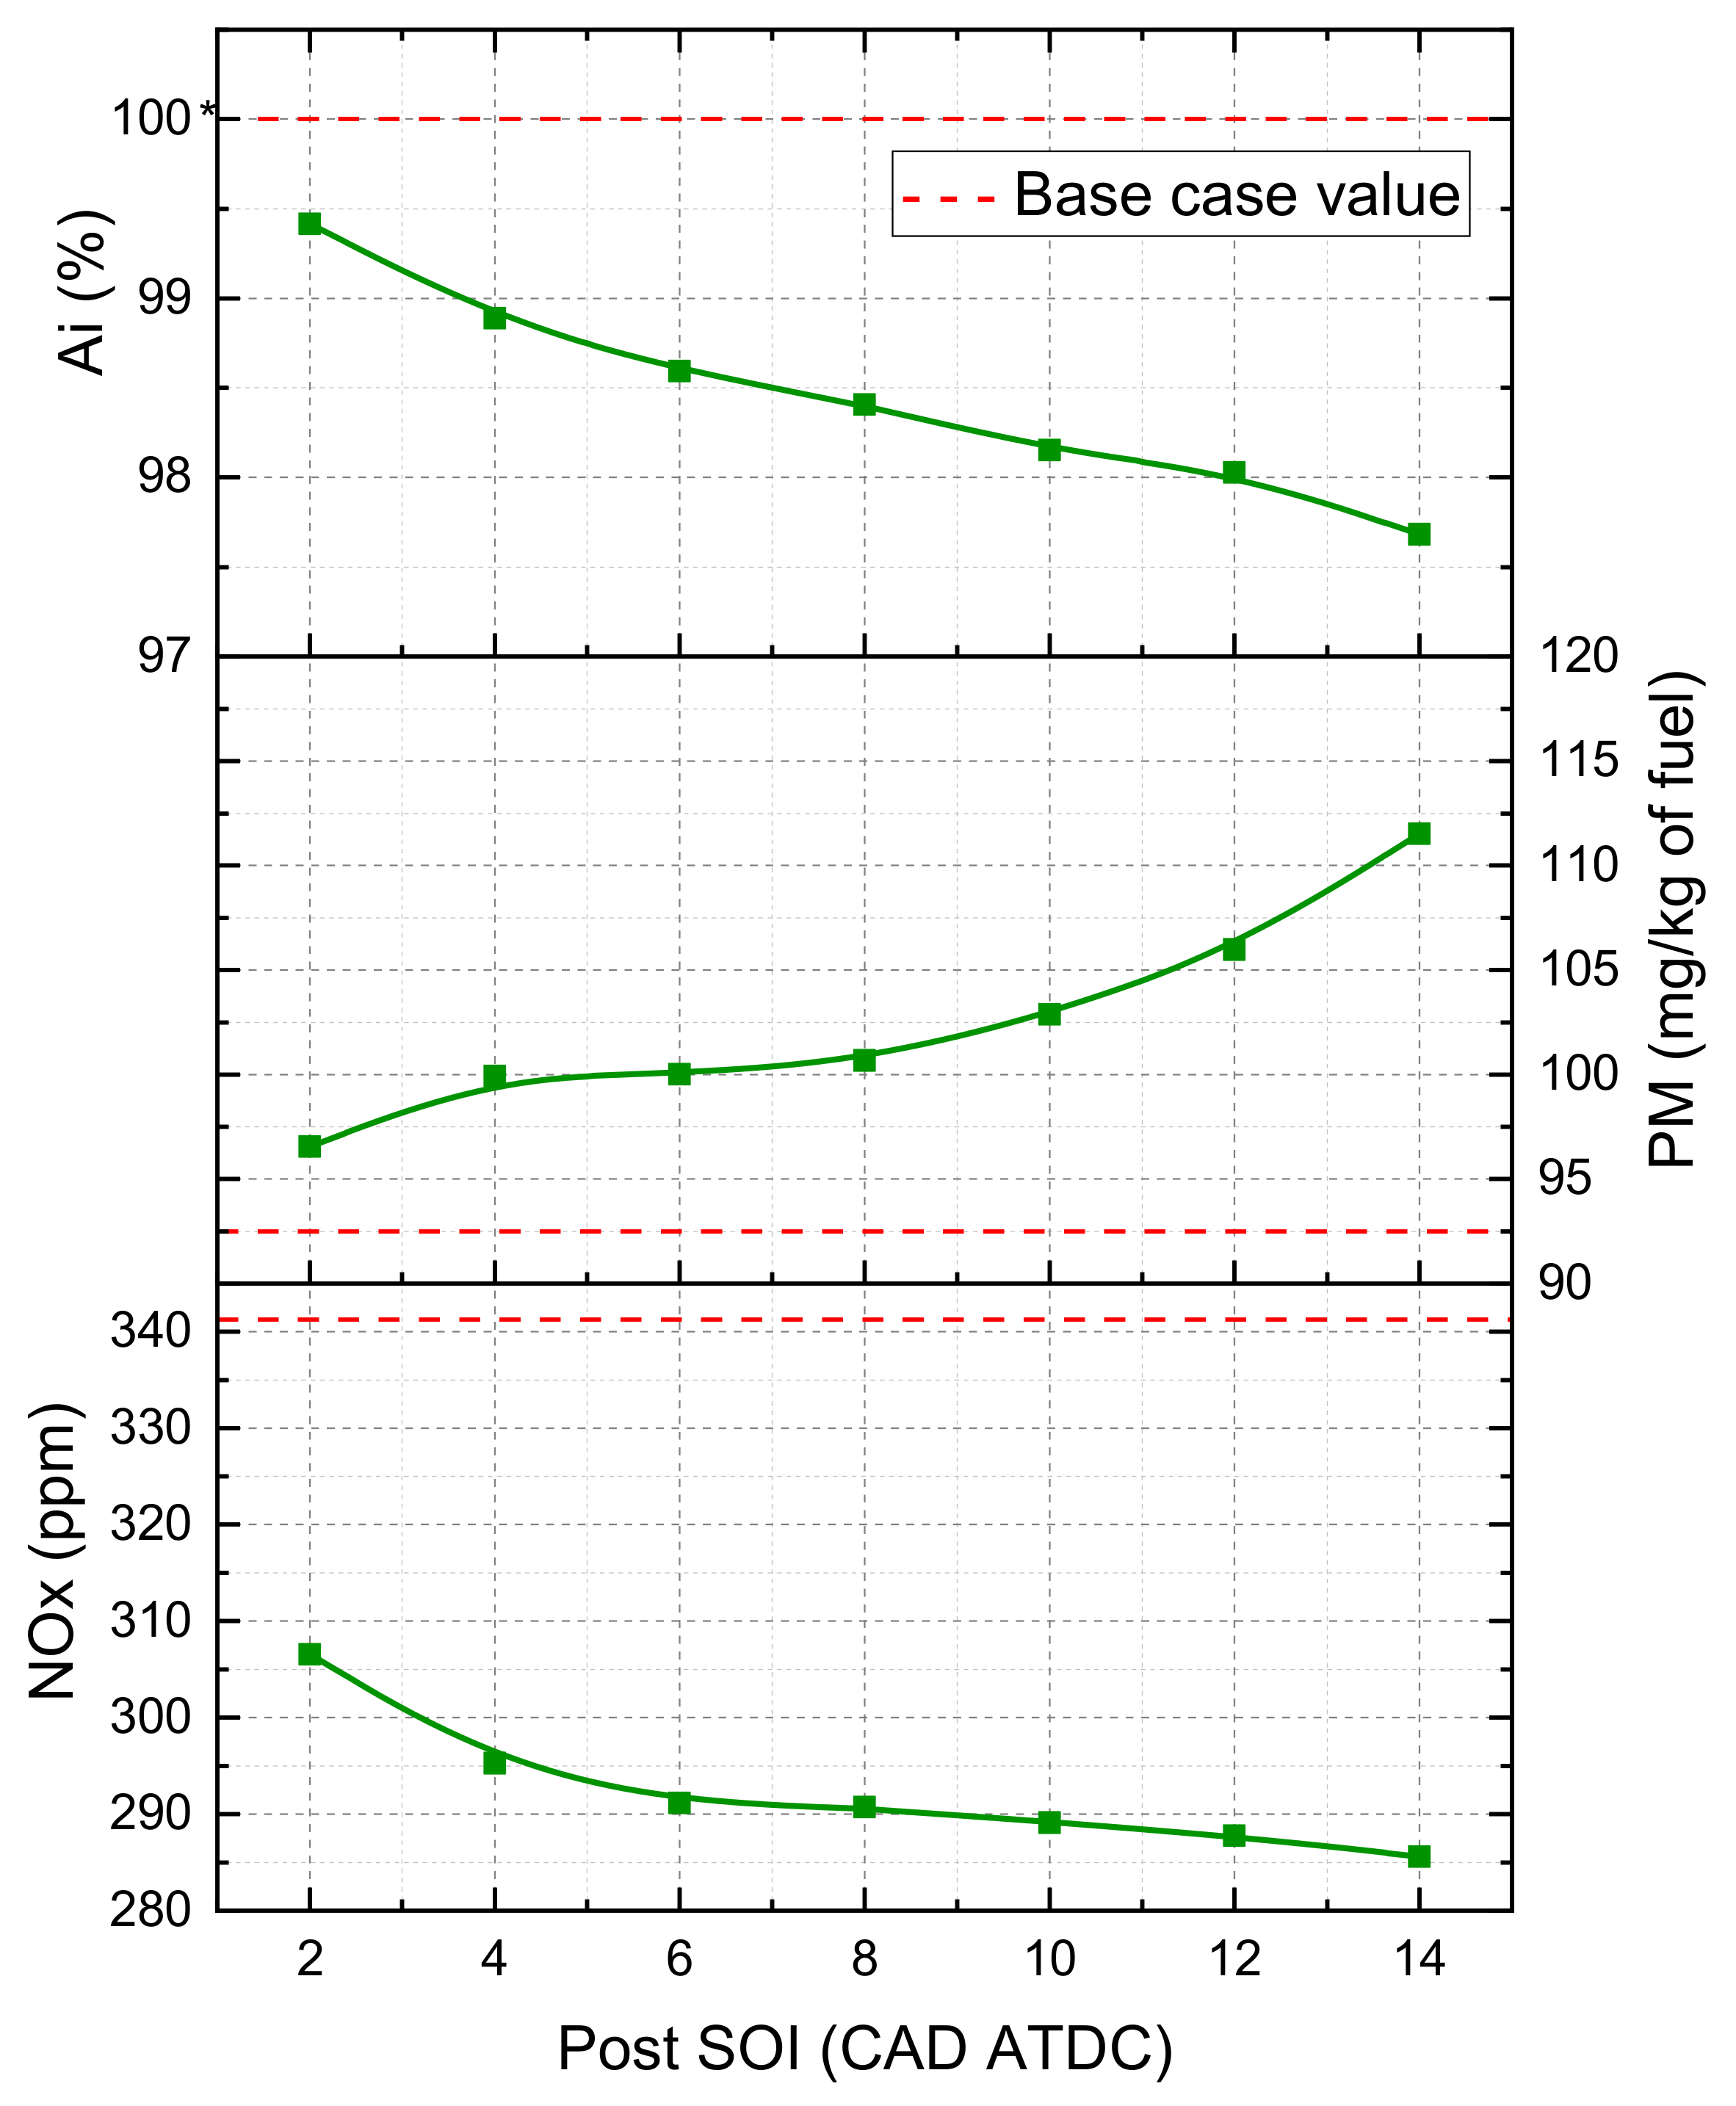
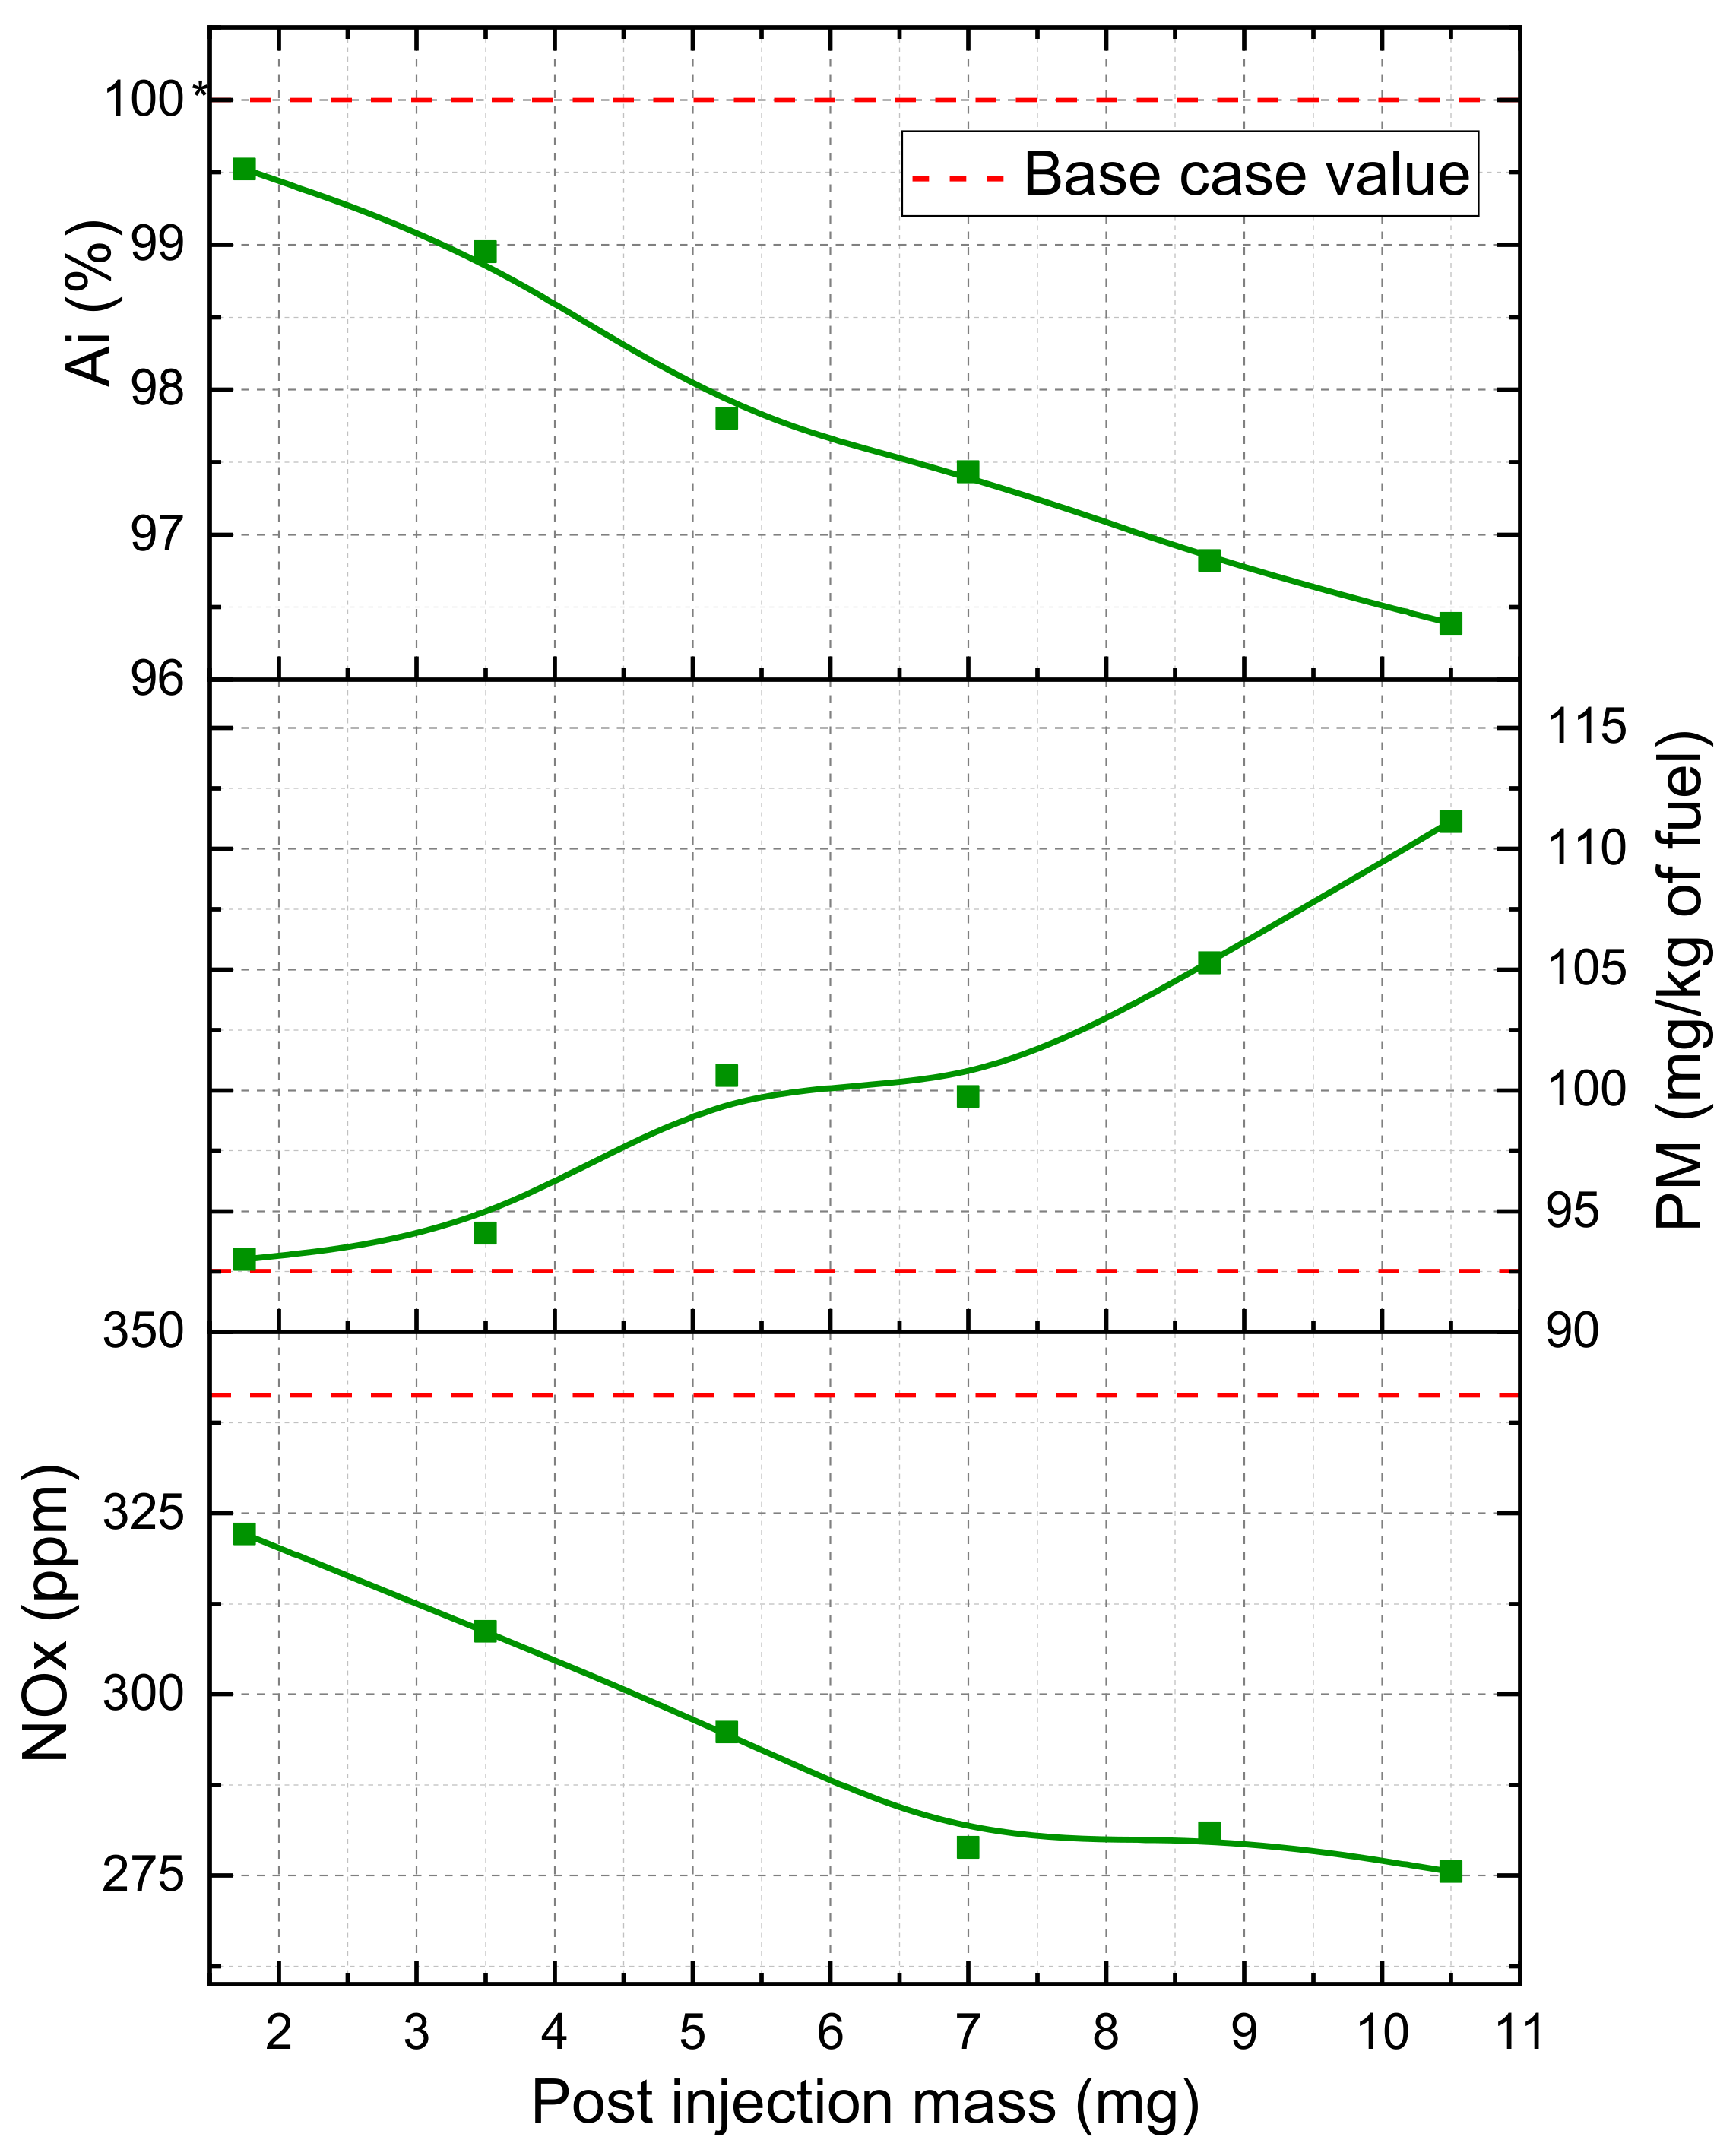
3.1.5. Post Injection Parameters Optimization

The range and increment of post SOI (red-dashed line) is shown in Figure 15, as well as the parameters for the pilot and main injections.
In Figure 16, the indicated work dependence of the post SOI can be seen. The addition of post injection reduces the indicated work. The indicated work decreased with a retarding of the post injection SOI. The NOx emissions decreased also. It is important to notice that when the NOx emissions reach the base case level, the indicated work is 3% lower than for the base case level.
The addition of the second pilot injection, a variation of the pilot injections mass, and the addition of the post injection do not allow the purpose of investigation to be achieved. As an assumption, the excessive increase in CD via a splitting of the two-stage injection to four deteriorates the evaporation and combustion process or increases NOx emissions and increases the heat losses to the cooling system and to exhaust gases. There is no need to increase the CD at low load conditions, because there is a lot of oxidizer in the combustion zone. It is still important to study the influence of another injection strategy on the CP. The decision is to exclude the second pilot injection.

3.2. Single Pilot Injection

3.2.1. Pilot Injection Optimization

The pilot SOI optimization is the first step of this optimization. The range of the pilot SOI is from 70 CAD BTDC to 10 CAD BTDC with increments of 5 CAD. The results of the variation of the pilot SOI are presented in Figure 17. There are two injections–one pilot injection and one main injection.
The reference dashed line displays the base case level. The advancing pilot SOI decreases the indicated work. To maintain the indicated work not lower than base case level, the pilot SOI should be in the range from 20 CAD BTDC to 10 CAD BTDC. The maximum value of the pressure rise rate does not exceed the critical value of 1.5 MPa/CAD, so there is no limitation. The dependence of the pressure rise rate on the pilot SOI looks similar to that of the indicated work. The PM emission decreases with a retarding of the pilot SOI. Exceeding the base value can be seen in the range from 70 CAD BTDC to 20 CAD BTDC. The NOx emissions look fairly constant in the range of pilot SOI from 70 CAD BTDC to 30 CAD BTDC. Retarding the pilot SOI increases the NOx emissions; a maximum of 400 ppm is achieved at 10 CAD BTDC. Increasing the local temperature leads to increasing NOx emissions, because of the local enrichment of the air–fuel mixture (the pilot injection becomes closer to main injection). The second reason is more efficient combustion due to a higher temperature and pressure at SOI. As in can be seen from Figure 17, the optimal value of the pilot SOI is at 19.2 CAD BTDC.

3.2.2. Pilot Injection Fuel Mass Optimization

The second step of the optimization is to vary the pilot injection mass in the range from 1.75 mg to 14 mg with increments of 1.75 mg. To exceed the pilot injection fuel mass value of 14 mg is not rational due to the increased compression work as the pilot injection fuel mass is increased. The results are presented in Figure 18. As can be seen, the indicated work increases with the increase in the pilot injection mass. The maximum value reaches 12.25 mg of pilot injection mass; it is slightly higher (1.5%) than the base case value.
To understand the CP in detail, the main parameters of combustion are presented in Table 4. The influence of the varying pilot injection fuel mass on a CP is complex. On the one hand, there is an increase in the compression work via an increase in the amount of the fuel burned before TDC. On the other hand, the temperature and pressure at the SOI are optimal for the fast evaporating and burning of the fuel. The fast evaporation leads to an increase in the premixed combustion part, hence this makes faster burning possible. The CD decreases, as well as the heat loss. Faster combustion is possible via the excessive amount of oxidizer. The detailed combustion process of the pilot and main injections is described above (Figure 8), here the process is similar and there is no need to describe it once again.
For the pilot injection fuel mass 12.25 mg (Table 4), the CD is almost the same as for the base case, but the increase in the AHR and the decrease in the compression work, as well as the CO mole fraction compared with the base case leads to an increase in the indicated work.
The main influence on the combustion process is the use of the oxidizer in the burning zone which is characterized by the CO mole fraction and AHR. A higher AHR value or/and a lower CO mole fraction value means that the combustion process is more efficient.
The increasing of the pilot injection fuel mass increases the pressure rise rate via increasing the amount of the fuel burned BTDC. The increasing of the pilot injection mass decreases the PM emissions, from the maximum value of 225 mg/kg of fuel at the pilot injection fuel mass equal to 1.75 mg to 92 mg/kg of fuel at the pilot injection mass of 14 mg. The NOx emissions increase with an increasing pilot injection mass; the reason for this is the more efficient use of the oxidizer, hence the local temperatures in CC increase. The pilot injection fuel mass is 12.25 mg. The 1.5% increase in the indicated work, the base case level of PM emissions, the 20% decrease in the pressure rise rate and the 4% decrease in the NOx emissions can be achieved compared with the base case level.

3.2.3. Main SOI Optimization

The next step of the optimization is to vary the main SOI with the constant pilot SOI 19.2 CAD BTDC and a pilot injection mass of 12.25 mg. Figure 19 displays the results of the simulation.
The range of varying the main SOI is from 10 CAD BTDC to 4 CAD ATDC (-4 CAD BTDC on the Figure 19) with increments of 2 CAD. The negative SOI value on this figure means the injection ATDC. The values of all the estimated parameters at main SOI 4 CAD BTDC are almost equal to those at the base case. Advancing the main SOI increases the indicated work and NOx emissions by 10% and 100%, respectively. There is no influence on the PM emissions and the pressure rise rate. The main SOI retarding up to 4 CAD ATDC leads to an 18% decrease in the indicated work, a 52% decrease in NOx emissions, and about a doubled increase in PM emissions. There is no influence of the main SOI on the pressure rise rate. From the description above it can be seen that optimal main SOI is 3.7 CAD BTDC.

3.2.4. Post Injection Parameters Optimization

The range of post injection SOI is from 2 CAD ATDC to 14 CAD ATDC with increments of 2 CAD. The results of the numerical investigation are displayed in Figure 20. There wasn’t any pressure rise, because the post injection parameters have no influence on it.
The retarding of post SOI decreases the indicated work and NOx emissions. The increasing of the PM emissions with advancing the post SOI can be seen, but in the range 2…8 CAD ATDC the PM are almost constant and equal to 100 ppm. It is important to note that the PM emissions are quite low due to the biodiesel fuel, but the addition of the post injection increases the PM emissions.
For the next variable parameter (the mass of the post injection), the post SOI should be taken equal to 2 CAD ATDC. The 10% decrease in NOx emissions, the 20% decrease in pressure rise rate, the 4% increase in PM emissions and the saving of the base level of indicated work can be received. In Figure 21, the post injection fuel mass variable is displayed. The decrease in indicated work and NOx emissions with an increasing of the post injection mass can be seen. At post injection the fuel mass is equal 10.5 mg. An almost 4% decrease in indicated work and a 20% decrease in NOx emissions, but a 20% increase in PM emissions can be seen. The received results look similar to other researchers [45,46,47,48].
At the post injection, a fuel mass of 1.75 mg, an almost base case level of indicated work and PM emissions, and a 5% decrease in NOx emissions can be seen. The parameters of the post injection have no influence on the pressure rise rate. In light of the above description, the 3.5 mg post injection fuel mass can be chosen as optimal.
In Figure 22, an optimal injection strategy is depicted and the parameters of the three-stage injection can be seen.
In Figure 23 the pressure curves for the base case and the optimal case are presented. The peak firing pressure for the three-stage injection is a little bit lower at 7.24 MPa, and the base case value is equal to 7.56 MPa. Post injection is burned during the expansion stroke, which is taken from the main injection fuel mass.
A little bit later combustion with an increasing of CD can be seen in Figure 24. The pilot ROHR is lower than the base case, because the pilot fuel mass injection is lower.
In Table 5 the combustion parameters are presented.
As it can be seen, the CD became longer, but the combustion became more efficient (AHR increased and CO mole fraction decreased) but the heat losses to cylinder head and liner wall increased, because the value of the indicated work was equal to 99% compared with the base case level despite a decrease in compression work.

4. Conclusions

During the numerical investigation, the optimal injection strategy was found: pilot SOI 19.2 CAD BTDC; pilot injection fuel mass 12.25 mg; main SOI 3.7 CAD BTDC; main injection fuel mass 32.4 mg; post Ai 2 CAD ATDC, post injection fuel mass 3.5 mg (as can be seen in Figure 22). A three-stage injection strategy allows the indicated work near the base case level to be maintained, the pressure rise rate to decrease by 20% and the NOx emission to decrease by 10%. The 5% increase in PM emissions does not seem to be a significant drawback of the chosen injection strategy, because the biodiesel fuel reduces PM emission drastically due to its chemical properties (it contains the oxygen).
The most significant influence on the combustion process has the pilot injection parameters: the pilot SOI and the pilot injection fuel mass. The pilot SOI has a significant influence on the type of combustion (premixed/non premixed) of the pilot injection, so there is opportunity to control the ignition delay. The parameters described above have an influence on the compression work, mostly via the AHR BTDC and the CO mole fraction, as there is a lot of fresh oxygen in the CC.
During the combustion of the pilot injections, the fuel mass, the temperature and the pressure in the combustion chamber increase and the evaporating of the main injection fuel mass and the mixture preparation becomes faster, and the combustion of the main portion becomes fuller, hence the increase in the premixed combustion. Therefore, the pilot injection parameters control the temperature and pressure values for burning the main injection and can influence the ignition delay via the break-up and evaporation processes of main injection.
The post injection parameters mostly influence the emissions and the indicated work via the heat losses through the exhaust gases and through the cooling system.
Splitting the injection allows the fuel portions to be burned separate from each other and improves the mixing and the oxygen use. In particular, it is important in the case of high loads when the amount of cycle injection is high.
The process of determining the optimal injection strategy is described above in detail and can be used for other ICEs, and other alternative fuels. The optimization of the injection strategy and the application of alternative fuels in conjunction is a powerful tool to improve the combustion process of any engine without changing the design of the engine itself or its systems. Further improvement of the results can be obtained with the minor change of the ICE design. For example, the optimization of the combustion chamber shape or the optimization of the injector nozzles. All these changes can be simulated using CFD models.

Author Contributions

Conceptualization, A.K.; methodology, A.K. and N.Z.; validation, A.K.; formal analysis, N.Z. and A.K.; investigation, N.Z.; resources, N.Z.; data curation, A.K.; writing—original draft preparation, N.Z.; writing—review and editing, A.K. and U.A.; visualization, N.Z.; supervision, A.T.; project administration, A.T. and K.K.; funding acquisition, U.A., A.T. All authors have read and agreed to the published version of the manuscript.

Funding

This research received no external funding.

Institutional Review Board Statement

Not applicable.

Informed Consent Statement

Not applicable.

Data Availability Statement

Not applicable.

Conflicts of Interest

The authors declare no conflict of interest.

References

  1. Kobashi, Y.; Wang, Y.; Shibata, G.; Ogawa, H.; Naganuma, K. Ignition control in a gasoline compression ignition engine with ozone addition combined with a two-stage direct-injection strategy. Fuel 2019, 2491, 154–160. [Google Scholar] [CrossRef]
  2. Shim, E.; Park, H.; Bae, C. Comparisons of advanced combustion technologies (HCCI, PCCI, and dual-fuel PCCI) on engine performance and emission characteristics in a heavy-duty diesel engine. Fuel 2020, 26215, 116436. [Google Scholar] [CrossRef]
  3. Jafari, H.; Yang, W.; Ryu, C. Evaluation of a distributed combustion concept using 1-D modeling for pressurized oxy-combustion system with low flue gas recirculation. Fuel 2020, 2631, 116723. [Google Scholar] [CrossRef]
  4. Gohn, J.; Gainey, B.; Zainul, S.; Lawler, B. Wet ethanol in LTC: How water fraction and DTBP affect combustion and intake temperature at naturally aspirated and boosted conditions. Fuel 2020, 2671, 117094. [Google Scholar] [CrossRef]
  5. Belgiorno, G.; Di Blasio, G.; Shamun, S.; Beatrice, C.; Tunestål, P.; Tunér, M. Performance and emissions of diesel-gasoline-ethanol blends in a light duty compression ignition engine. Fuel 2018, 217, 78–90. [Google Scholar] [CrossRef]
  6. Benajes, J.; Pastor, J.V.; García, A.; Monsalve-Serrano, J. The potential of RCCI concept to meet EURO VI NOx limitation and ultra-low soot emissions in a heavy-duty engine over the whole engine map. Fuel 2015, 159, 952–961. [Google Scholar] [CrossRef]
  7. Tripathi, G.; Sharma, P.; Dhar, A.E. Effect of methane augmentation on combustion stability and unregulated emissions in compression ignition engine. Fuel 2020, 2631, 116672. [Google Scholar] [CrossRef]
  8. Calam, A.; Aydoğan, B.; Halis, S. The comparison of combustion, engine performance and emission characteristics of ethanol, methanol, fuel oil, butanol, isopropanol and naphtha with n-heptane blends on HCCI engine. Fuel 2020, 2615, 117071. [Google Scholar] [CrossRef]
  9. Benajes, J.; García, A.; Monsalve-Serrano, J.; Villalta, D. Benefits of E85 versus gasoline as low reactivity fuel for an automotive diesel engine operating in reactivity controlled compression ignition combustion mode. Energy Convers. Manag. 2018, 159, 85–95. [Google Scholar] [CrossRef]
  10. Mortimer, N.D.; Cormack, P.; Elsayed, M.A.; Horne, R.E. Evaluation of the Comparative Energy, Global Warming and Socio-Economic Costs and Benefits of Biodiesel. UK Department for Environment, Food and Rural Affairs (DEFRA), Sheffield Hallam University. 2003. Available online: http://sciencesearch.defra.gov.uk/Default.aspx?Menu=Menu&Module=More&Location=None&Completed=0&ProjectID=10701 (accessed on 20 March 2021).
  11. Well-to-Wheels Analysis of Future Automotive Fuels and Powertrains in the European Context. Joint Research Centre, EUCAR & CONCAWE. 2007. Available online: https://publications.jrc.ec.europa.eu/repository/handle/JRC65998 (accessed on 22 March 2021).
  12. European Environment Agency. Transport and Environment: Facing a Dilemma: TERM 2005: Indicators Tracking Transport and Environment in the European Union; European Environment Agency: Copenhagen, Denmark; Luxembourg, 2006. [Google Scholar]
  13. Kozlov, A.V.; Terenchenko, A.S.; Sister, V.G.; Ivannikova, E.M.; Eliseeva, O.A. A mathematical model for the complete life cycle of biodiesel fuel. Chem. Pet. Eng. 2009, 45, 301–307. [Google Scholar] [CrossRef]
  14. IEA Renewables. 2019. Available online: https://www.iea.org/reports/renewables-2019/transport#abstract (accessed on 25 February 2021).
  15. Han, Z.; Uludogan, A.; Hampson, G.; Reitz, R. Mechanism of Soot and NOx Emission Reduction Using Multiple-injection in a Diesel Engine. SAE Tech. Pap. 1996, 12, 960633. [Google Scholar]
  16. FIRE. Users Manual; Version 2019.R2; AVL List GmbH: Graz, Austria, 2019. [Google Scholar]
  17. Azimov, U.B.; Kim, K.S.; Jeong, D.S.; Lee, Y.G. Evaluation of low-temperature diesel combustion regimes with n-Heptane fuel in a constant-volume chamber. Int.J. Automot. Technol. 2009, 10, 265–276. [Google Scholar] [CrossRef]
  18. Azimov, U.; Ki-Seong, K.; Choongsik, B. Modeling of flame lift-off length in diesel low-temperature combustion with multi-dimensional CFD based on the flame surface density and extinction concept. Combust. Theory Model. 2010, 14, 155–175. [Google Scholar] [CrossRef]
  19. Frolov, S.M.; Frolov, F.S.; Basara, B. Simple model of transient drop vaporization. J. Russ. Laser Res. 2006, 27, 562–574. [Google Scholar] [CrossRef]
  20. Duzynski, A. (Ed.) Proceedings of the VI International Scientific Conference GAS ENGINES, Czestochova, Poland, 16–18 October 2003; p. 751.
  21. Eichlseder, H.; Klell, M. Wasserstoff in der Fahrzeugtechnik. Erzeugung, Speicherung, Anwendung; Vieweg—Teubner Verlag: Wiesbaden, Germany, 2008; Volume 288. [Google Scholar]
  22. Eichlseder, H.; Spuller, C.; Heidl, R.; Gerbig, F.; Heller, K. Konzepte für die Dieselähnliche Wasserstoffverbrennung. MTZ 2010, N1, 60–66. [Google Scholar] [CrossRef]
  23. Liu, A.B.; Reitz, R.D. Modeling the Effects of Drop Drag and Break-up on Fuel Sprays. SAE Tech. Pap. 1993, 17, 930072. [Google Scholar]
  24. Naber, J.D.; Reitz, R.D. Modeling Engine Spray/Wall Impingement. SAE Tech. Pap. 1988, 22, 880107. [Google Scholar]
  25. Agafonov, G.L.; Nullmeier, M.; Vlasov, P.A.; Warnatz, J.; Zaslonko, I.S. Kinetic Modeling of Solid Carbon Particle Formation and Thermal Decomposition during Carbon Suboxide Pyrolysis behind Shock Waves. Combust. Sci. Technol. 2002, 174, 1–29. [Google Scholar] [CrossRef]
  26. Appel, J.; Bockhorn, H.; Frenklach, M. Kinetic Modeling of Soot Formation with Detailed Chemistry and Physics: Laminar Premixed Flames of C2 Hydrocarbons. Combust. Flame 2000, 121, 122–136. [Google Scholar] [CrossRef]
  27. Krestinin, A.V. Detailed Modeling of Soot Formation in Hydrocarbon Pyrolysis. Combust. Flame 2000, 121, 513–524. [Google Scholar] [CrossRef]
  28. Myung, Y.K.; Seung, H.Y.; Chang, S.L. Impact of Split Injection Strategy on the Exhaust Emissions and Soot Particulates from a Compression Ignition Engine Fueled with Neat Biodiesel. Energy Fuels 2008, 22, 1260–1265. [Google Scholar]
  29. Kweon, C.; Foster, D.E.; Schauer, J.J.; Okada, S. Detailed chemical composition and particle size assessment of diesel engine exhaust. SAE Pap. 2002, 2002, 17. [Google Scholar]
  30. Kholghy, M.R.; Weingarten, J.; Sediako, A.D.; Barba, J.; Lapuerta, M.; Thomson, M.J. Structural effects of biodiesel on soot formation in a laminar coflow diffusion flame. Proc. Combust. Inst. 2017, 36, 841–851. [Google Scholar] [CrossRef]
  31. Hampson, G.J.; Reitz, R.D. Two-color imaging on in-cylinder soot concentration and temperature in a heavy-duty DI diesel engine with comparison to multidimensional modeling for single and split injections. J. Eng. 1998, 107, 659–682. [Google Scholar]
  32. Reitz, R.D. Controlling DI diesel engine emissions using multiple injections and EGR. Combust. Sci. Technol. 1998, 138, 257–278. [Google Scholar] [CrossRef]
  33. Nakagome, K.; Shimazaki, N.; Niimura, K.; Kobayashi, S. Combustion and Emission Characteristics of Premixed Lean Diesel Combustion Engine. J. Eng. 1997, 106, 1528–1536. [Google Scholar]
  34. Najt, P.M.; Foster, D.E. Compression-Ignited Homogeneous Charge Combustion. SAE 1983, 20, 830264. [Google Scholar]
  35. Gajendra, S.; Akhilendra, P.S.; Avinash, K.A. Experimental investigations of combustion, performance and emission characterization of biodiesel fueled HCCI engine using external mixture formation technique. Orig. Res. Artic. Sustain. Energy Technol. Assess. 2014, 6, 116–128. [Google Scholar]
  36. Mathivanan, K.; Mallikarjuna, J.M.; Ramesh, A. Influence of multiple fuel injection strategies on performance and combustion characteristics of a diesel fueled HCCI engine—An experimental investigation. Orig. Res. Artic. Exp. Ther. Fluid Sci. 2016, 77, 337–346. [Google Scholar] [CrossRef]
  37. Kuleshov, A.S. Use of Multi-Zone DI Diesel Spray Combustion Model for Simulation and Optimization of Performance and Emissions of Engines with Multiple Injection. SAE Tech. Pap. Ser. 2006. [Google Scholar] [CrossRef]
  38. Karra, P.K.; Veltman, M.K.; Kong, S.-C. Characteristics of Engine Emissions Using Biodiesel Blends in Low-Temperature Combustion Regimes. Energy Fuels 2008, 22, 3763–3770. [Google Scholar] [CrossRef]
  39. Punov, P.; Gechev, T.; Mihalkov, S.; Podevin, P.; Barta, D. Experimental study of multiple pilot injection strategy in an automotive direct injection diesel engine. MATEC Web Conf. 2018, 234, 03007. [Google Scholar] [CrossRef]
  40. Mei, D.; Yu, Q.; Zhang, Z.; Yue, S.; Tu, L. Effects of Two Pilot Injection on Combustion and Emissions in a PCCI Diesel Engine. Energies 2021, 14, 1651. [Google Scholar] [CrossRef]
  41. Park, S.H.; Yoon, S.H.; Lee, C.S. Effects of multiple-injection strategies on overall spray behavior, combustion, and emissions reduction characteristics of biodiesel fuel. Appl. Energy 2011, 88, 88–98. [Google Scholar] [CrossRef]
  42. Akhilendra, P.S.; Avinash, K.A. Fuel-Injection Strategy for PCCI Engine Fueled by Mineral Diesel and Biodiesel Blends. Energy Fuels 2017, 31, 8594–8607. [Google Scholar]
  43. Meloni, R.; Naso, V. An Insight into the Effect of Advanced Injection Strategies on Pollutant Emissions of a Heavy-Duty Diesel Engine. Energies 2013, 6, 4331–4351. [Google Scholar] [CrossRef] [Green Version]
  44. Horibe, N.; Bao, Z.; Taguchi, T.; Egoshi, K.; Kawanabe, H.; Ishiyama, T. Improvement of Thermal Efficiency in a Diesel Engine with High-PressureSplit Main Injection. SAE Tech. Pap. 2018. [Google Scholar] [CrossRef] [Green Version]
  45. O’Connor, J.; Musculus, M. Post injections for soot reduction in diesel engines: A review of current understanding. SAE Int. J. Eng. 2013, 6, 400–421. [Google Scholar] [CrossRef] [Green Version]
  46. Jeftic, M.; Zheng, M. A study of the effect of post injection on combustion and emissions with premixing enhanced fueling strategies. Appl. Energy 2015, 157, 861–870. [Google Scholar] [CrossRef]
  47. Bobba, M.; Musculus, M.; Neel, W. Effect of post injections on in-cylinder and exhaust soot for low-temperature combustion in a heavy-duty diesel engine. SAE Int. J. Eng. 2010, 3, 496–516. [Google Scholar] [CrossRef]
  48. Desantes, J.; Arregle, J.; Lopez, J.; Garcia, A. A comprehensive study of diesel combustion and emissions with post-injection. SAE Pap. 2007, 116, 542–550. [Google Scholar]
Figure 1. Mesh used in CFD model.
Energies 14 03717 g001
Figure 2. Calculated and experiment pressure curves for biodiesel in an operated diesel engine at 1450 rpm and 25% of the full load mode.
Energies 14 03717 g002
Figure 3. Calculated and experiment ROHR curves for biodiesel in an operated diesel engine at 1450 rpm and 25% of the full load mode.
Energies 14 03717 g003
Figure 4. The injection strategy for the second pilot SOI 45 CAD BTDC.
Energies 14 03717 g004
Figure 5. The injection strategy for the second pilot SOI 19.2 CAD BTDC.
Energies 14 03717 g005
Figure 6. The injection strategy for the second pilot SOI 10 CAD BTDC.
Energies 14 03717 g006
Figure 7. The first pilot SOI variable influence on combustion process and emissions.
Energies 14 03717 g007
Figure 8. ROHR for the 1st pilot SOI optimization.
Energies 14 03717 g008
Figure 9. Indicated work contour plot.
Energies 14 03717 g009
Figure 10. Pressure rise rate contour plot.
Energies 14 03717 g010
Figure 11. Particulate matter contour plot.
Energies 14 03717 g011
Figure 12. NOx concentration contour plot.
Energies 14 03717 g012
Figure 13. The pilot injection fuel mass variable influence on combustion process and emissions.
Energies 14 03717 g013
Figure 14. The main SOI variable influence on combustion process and emissions.
Energies 14 03717 g014
Figure 15. The four-stage injection strategy with post injection SOI variable.
Energies 14 03717 g015
Figure 16. The post SOI variable influence on combustion process and emissions.
Energies 14 03717 g016
Figure 17. The pilot SOI variable influence on combustion process and emissions.
Energies 14 03717 g017
Figure 18. The pilot injection fuel mass variable influence on combustion process and emissions.
Energies 14 03717 g018
Figure 19. The main SOI variable influence on combustion process and emissions.
Energies 14 03717 g019
Figure 20. The post SOI variable influence on combustion process and emissions.
Energies 14 03717 g020
Figure 21. The post injection fuel mass variable influence on combustion process and emissions.
Energies 14 03717 g021
Figure 22. The fuel injection diagram at 25% load condition.
Energies 14 03717 g022
Figure 23. The pressure curve for the optimal three-stage injection strategy compared to base case.
Energies 14 03717 g023
Figure 24. The rate of heat release curve for the optimal three-stage injection strategy compared to the base case.
Energies 14 03717 g024
Table 1. Verification results of CFD model operating on biodiesel fuel.
Type of ResultsSOI Pilot, CAD BTDCPilot Injection Mass, mgSOI Main, CAD BTDCMain Injection Mass, mgNOx, ppmPM, mg/kg FuelΔp/Δφ, MPa/CADAi, %
Experiment19.2143.734.16280 0.6102.3
Base case19.2143.734.16341.392.51.15100
Table 2. Combustion parameters for the 2nd pilot SOI 45 CAD before TDC.
1-st Pilot SOISOC, CADCD, CADEOC, CADAHR, %CO, %AiAcompr
Base case708.522.91731.4100100100100
7070521.45726.572.9609.176.7104.0
4070521.7726.783.4412.185.7104.7
1070523.4728.494.4236.9100.1101.9
Table 3. Combustion parameters for the 2nd pilot SOI 10 CAD before TDC.
1-st Pilot SOISOC, CADCD, CADEOC, CADAHR, %CO, %AiAcompr
Base case708.522.91731.4100100100100
7070522.65727.792.6268.598.5102.4
4070523.25728.395.0223.6100.4101.9
15710.818.6729.4102.869.7107.2101.1
Table 4. Combustion parameters for the pilot injection fuel mass variation.
Pilot Mass, mgSOC, CAD BTDCCD, CADAHR, %CO, %Acompr, %Ai, %
14 (base case)11.522.9100.0100.0100.0100.0
1.75120.191.9295.493.279.3
71025.497.4148.495.592.9
12.251123.1100.398.098.8101.5
Table 5. Combustion parameters for the optimal injection strategy compared with the base case.
Pilot Mass, mgSOC, CAD BTDCCD, CADAHR, %CO, %Acompr, %Ai, %NOx, %PM, %
Base case11.522.9100.0100.0100.0100.0100.0100.0
3 stage optimal1125100.494.898.799.090105
Publisher’s Note: MDPI stays neutral with regard to jurisdictional claims in published maps and institutional affiliations.

