1. Introduction
Devastating impacts of fossil fuels on environments have been reported and recognized as a global issue [
1]. This issue has been frequently discussed and it is highly critical to moderate the use of them [
2,
3]. In response to the increasing demand of reducing dependence on fossil fuels, renewable energy draws growing attention [
4,
5]. Building a stable energy storage system has been recognized as a key advance in maximizing renewable energy use by neutralizing the intermittent and inconsistent nature of renewable energy sources [
6,
7,
8]. Compressed air energy storage (CAES) stores air in the form of compressed air and restores the energy by the air expansion. It is considered as one of the promising bulk-scale energy storage options, owing to its economic and environmental advantages [
9]. The operation of two CAES systems in Huntorf, Germany, and McInosh, Alabama, over decades proves the validity of the system [
10,
11]. Integrating wind energy into CAES has been discussed and it makes CAES a more attractive energy storage option [
12,
13,
14,
15]. In order to extend the application of CAES, a variety of approaches have been explored. In an open accumulator system, air is drawn from the atmosphere for gas compression and stored in the accumulator [
16]. This concept was further studied in [
12], which presents a control strategy for an open accumulator CAES. Ocean compressed air energy storage (OCAES) where the storage vessel is placed on the seabed was designed and studied [
8,
17,
18,
19]. Placing the storage tank underwater lessens safety and environmental concerns. Moreover, [
20] reported that underwater CAES can achieve better efficiency over underground CAES for advanced adiabatic type CAES.
CAES systems currently in operation have a drawback in terms of the system efficiency because the heat energy generated during the gas compression is wasted, resulting in energy loss [
21]. Isothermal CAES (I-CAES), in which the temperature change does not occur during the gas compression and expansion processes, has recently gained much attention as a way to minimize the heat energy loss during the compression. For an I-CAES system to show consistently a better overall efficiency over diabatic and adiabatic CAES systems, the gas compression process should be kept close to the isothermal process by maximizing the heat transfer during the compression [
15,
19,
21,
22,
23]. The open accumulator and OCAES systems can also benefit from the isothermal operation [
16,
19].
A liquid piston compressor is a novel gas compression technique to achieve a near-isothermal compression. The compressor works in the same manner as a conventional reciprocating piston compressor, except that a liquid replaces the solid piston of the conventional compressor. A moving liquid column presses the gas inside the compression chamber [
23]. The compression time is a significant factor that affects compression efficiency. The variation of the compression stroke time was experimentally inspected in [
24] and the compression/expansion trajectories of a liquid piston were also optimized in [
25]. Owing to the conformity of a liquid, a chamber with more complicated geometry can be used, and heat transfer enhancement can be achieved, which will lead to the improvement of isothermal efficiency. The shapes of the liquid piston compressor were simulated. In [
26], it was discovered that the length and changes in cross-section diameter are beneficial factors with regard to improving the compression efficiency. Putting an insert into the liquid piston compression is a validated way by simulation and experiments to enlarge the surface area to enhance heat transfer [
27,
28,
29,
30,
31,
32]. Because of the conformity of liquid, a liquid piston compressor allows for the use of inserts even with complex geometry. In [
27], a CFD simulation model of a tube with a greater length compared to its diameter was designed and tested. By vertically arranging a number of tubes, a structure whose cross-section looks like a honeycomb can be designed as an insert for a liquid piston. Inserts comprised of plates that can function as a heat exchanger for a liquid piston were also modeled by simulation and experimentally tested in [
28]. In [
29], the effects of adding porous media during the liquid piston compression/expansion process are experimentally tested. Aluminum foams with 10 and 40 pores per inch and interrupted plates with different parameters were employed. With the use of the inserts, the improvement of power density was observed when the efficiency is the same. The opposite is also true. For the same power density, the addition of porous media leads to higher efficiency. In [
30], the effectiveness of porous media was experimentally validated in a compression process for a 210 bar target pressure. A partial use of porous media in the chamber was also tested. The axial location of porous media was varied from the bottom to the top of the compression chamber. When the location is close to the top of the chamber, better compression efficiency was observed than compression with the porous media at the bottom/near-bottom. For energy storage purpose, Ren proposed a novel isothermal compressor concept that takes advantage of a liquid and a porous medium for gas compression [
33]. Instead of a typical liquid piston compression mechanism in which the water column moves upwards, the downward movement of a solid piston compresses a gas in a chamber filled with a liquid. The existence of a metal porous medium of the system allows improved heat transfer and reduces the compression work input. For compression to achieve a pressure ratio of 5, about 19.3% reduction in work input was observed.
Apart from the porous media inserts, metal wire mesh played the role of an insert to enlarge the surface area in the liquid piston gas compression. With the addition of an extra surface area, temperature abatement enhancement was observed, and up to 90% of isothermal efficiency was reached with the use of the metal wire mesh insert [
31]. In this study, metal wire mesh structures made of copper and aluminum were tested to investigate the impact of different materials. Both of them showed similar effectiveness. The diameter of the wire mesh was also varied. A wire with a larger diameter helps achieve higher isothermal efficiency than a wire with a smaller diameter. It implies that surface area is not the only factor determining compression efficiency and in that the thermal energy storage capacity of metal wire mesh also affects the results. Hollow spheres floating on the liquid piston surface were studied by simulation as well as experiments. Same as the other inserts introduced above, the addition of the inserts aided in achieving improved isothermal efficiency [
32].
Liquid-based techniques were employed in order to improve the isothermal efficiency of liquid piston gas compression or a similar system [
34,
35,
36,
37]. Spray injection is a representative liquid-based heat transfer enhancement technique that can be used for compressed gas-based storage systems, and its efficacy has been proved and reported [
34,
35,
36]. Ref. [
34] defines the mass loading by the ratio of the mass of injected water to the mass of air in a compression chamber. Higher mass loading results in better compression efficiency. The size of droplets is also a critical factor used to affect the compression efficiency improvement. At a fixed level of mass loading, to some degree, smaller droplets lead to better compression efficiency. Further, down to 20 micrometers, decreasing the droplet size is found to be beneficial in terms of achieving higher isothermal efficiency. However, below this point, a further decrease does not bring about noticeable extra improvement because the droplets approach a thermal equilibrium with the gas due to the shortened thermal response time of a droplet [
34]. An experimental investigation has also been carried out. The injection pressure of water spray was varied. At the higher injection pressure, the higher flow rate is reached, and it enhances heat transfer [
35]. Aqueous foam is another liquid-based heat transfer enhancement technique. The foams provide an additional surface area, which helps achieve the improvement of liquid piston compression efficiency. The effectiveness of aqueous foam has also been experimentally proven [
37]. Among the methods introduced above, the spray injection method is proven to achieve the high compression efficiency. It also has an advantage of easy integration into a liquid piston system. Because the water for injection can be drawn directly from the water column and the injected droplets fall back into the piston, a closed-loop system that does not need an external water source or a drain system for the injected water during compression cycles can be built.
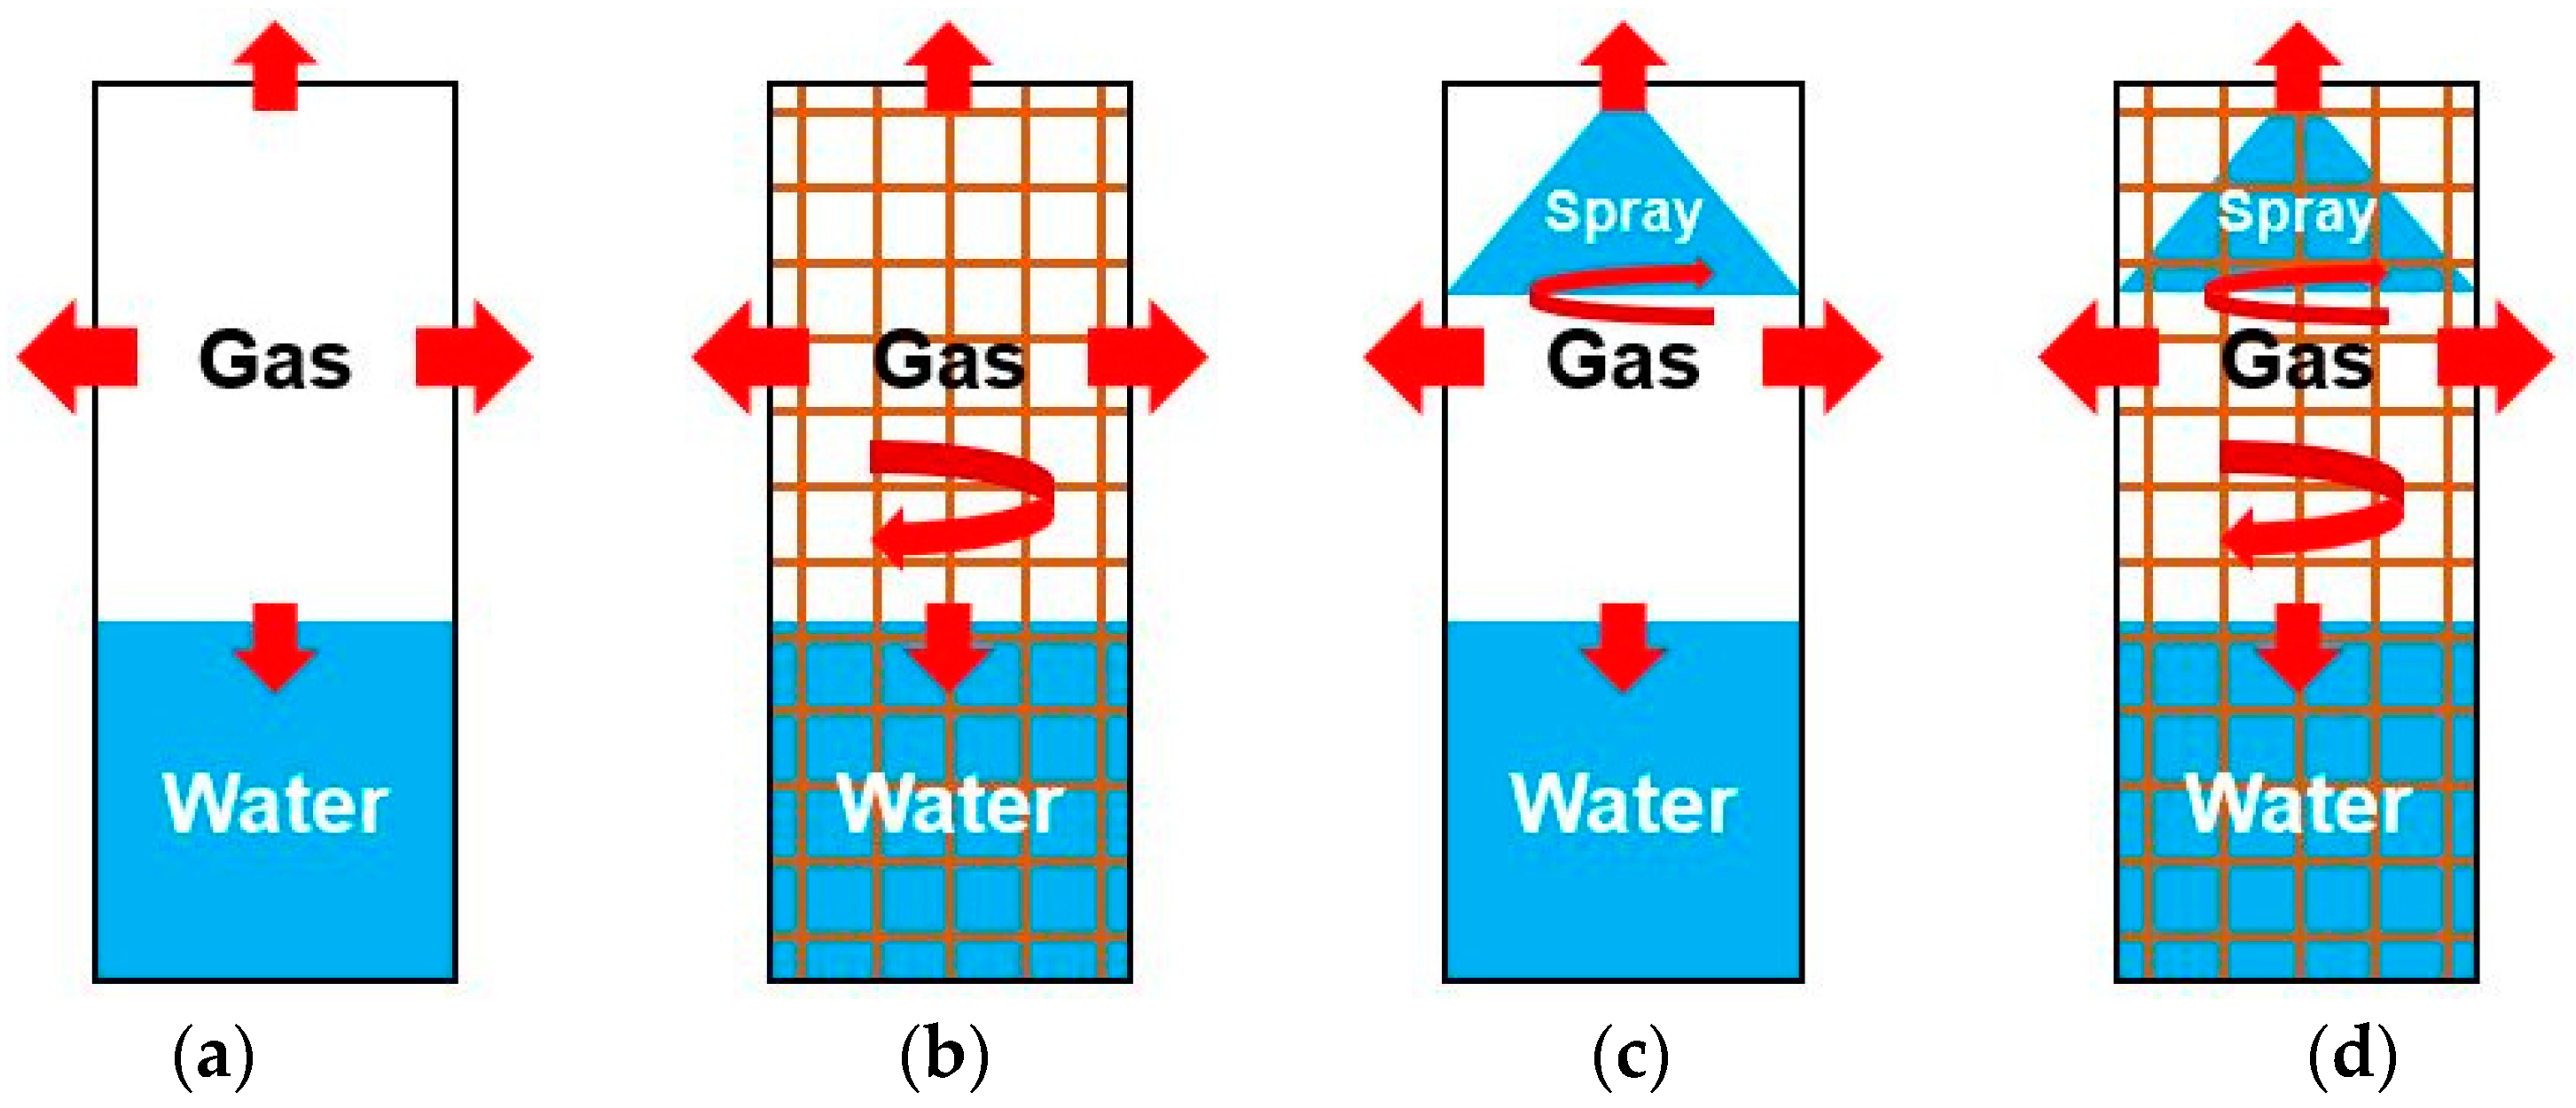
In this study, a feasibility of integrating extra heat transfer enhancement techniques along with spray injection in liquid piston compression is experimentally studied. Spray injection and metal wire mesh inserts in Archimedean spiral form are used together in order to investigate whether the simultaneous use of the techniques can lead to further efficiency improvement over compression with a single technique. The following section illustrates the heat transfer modeling of liquid piston compression and droplets. Next, detailed description about experimental setup employed in this work will be provided in the materials and methods section. Experimental results are displayed in the results section, and interpretation and analysis of the results are presented in the discussion section. Then, in the last section, the conclusion of the present work is given.
3. Materials and Methods
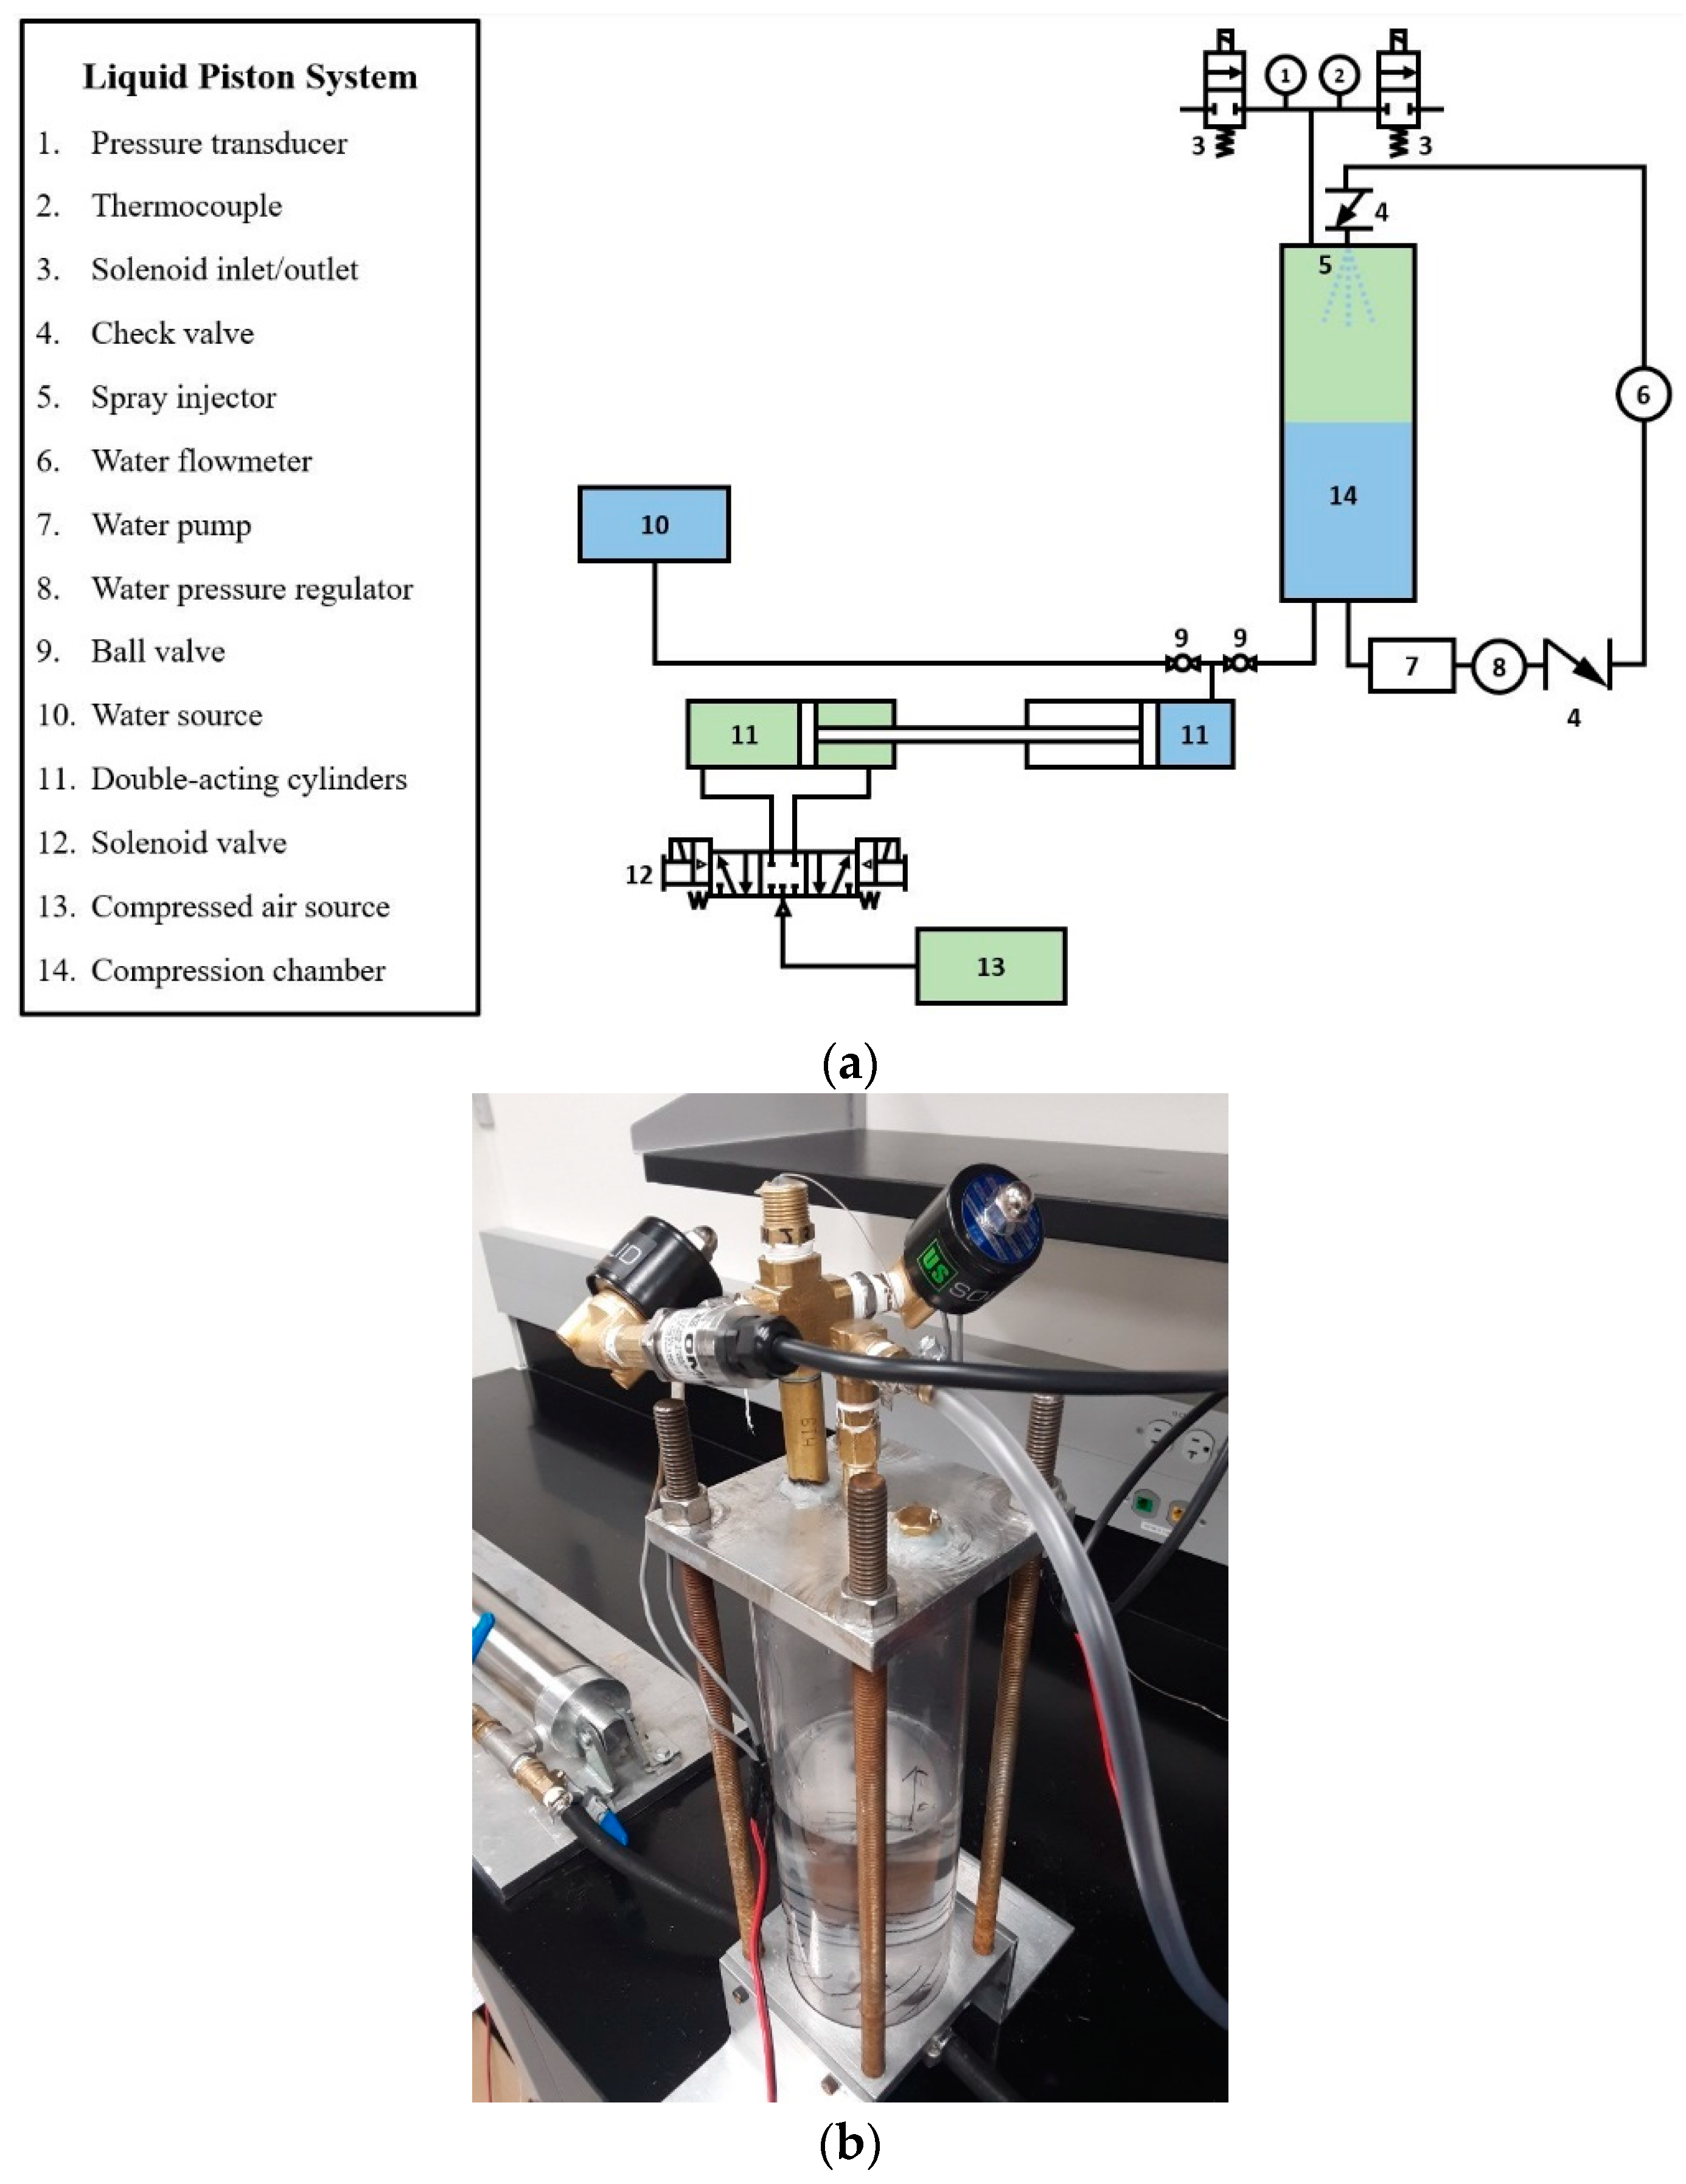
A liquid piston was built on a tabletop.
Figure 3a schematically describes the system and the picture of the liquid piston chamber is presented in
Figure 3b. A 1-foot (304.8 mm) long transparent polycarbonate cylinder with 3.75 in (95.25 mm) inner diameter and 4 in (101.6 mm) outer diameter works as a compression chamber. The top and bottom of the cylinder are sandwiched by two aluminum plates. There is a pipe connected to the top aluminum plates for thermocouple and pressure sensor installation. A K-type thermocouple is used to measure the temperature of the chamber inside. The wire gauge of the thermocouple is 40 AWG (0.08 mm diameter), which is able to ensure fast response time and measurement of rapid temperature changes. The tip of the thermocouple is located near the lower part of the pipe with a cap-like supporting structure so that it can measure the temperature changes of the main chamber. Although this design enables the measurement of the local temperature near the main chamber, the effects of indirect touching of droplets and thermal gradient due to the supporter may be inevitable. Two solenoid valves share the pipe with the sensors. The role of the solenoid valves is to work as an outlet to the atmosphere and an inlet for an exterior gas to enter the chamber so that the inside gas pressure can be reset per cycle. Seal tapes and epoxy resin were used to minimize the air leak during compression. Two pneumatic cylinders function as a water pump. One of them is filled with water before a compression process begins. During the compression, as the other cylinder moves, the stored water is pushed into the compression chamber through a hose connected to the bottom plate of the chamber and compresses the gas residing in the chamber. Although minor water/air leaks were observed in the system, it was assumed to be negligible as the overall target pressure was consistently achieved.
A commercial water pump is installed for spray operation. It draws water directly from the water column that works as a piston. The other end of the pump is connected to the spray so that injected droplets fall into and are combined back with the liquid piston. The water injection pressure is manually adjusted by a pressure regulator (Norgren R91W-2AK-NLN) and a pressure gauge (Ashcroft pressure gauge 0–100 psi) reads the pressure. On the ceiling of the chamber inside, a spray injector, Bete Fog Nozzle—1/8″ pipe, 90° spray angle was installed at the center in a downward direction so that water droplets can fall from top to bottom. A check valve is connected to the spray inlet to prevent the backflow of air when the inside pressure goes up high. Prior to the check valve and spray injector, a water flowmeter measures the flowrate of water. Due to a possible calibration error of the flowmeter and inherent errors of the flow control system, the actual flowrate and injection pressure can be slightly different from the measured or intended values. Nevertheless, the differences are minor such that the overall values of measurements are reasonable.
Two power supplies with 12 V and 24 V capacity were used to provide power to solenoid valves and measuring devices. A data acquisition device collects the data measured by the sensors. An Arduino controller was designed to automate the system. The model names of sensors used in this experimental apparatus are indicated in
Table 1.
For the insert material, copper was chosen to be consistent with our previous work [
31]. Wire mesh sheets made up of more than 99% pure copper with a wire diameter of 0.7112 mm are used, and they have eight wires per inch. The sheets were rolled in the form of an Archimedean spiral. The outer diameter of the inserts was about 95.25 mm so that the inserts fit snugly into the chamber. Three inserts with three different numbers of turns, two, three, and four, were made. The lengths of the sheets were about 350 mm for 2-turn wire mesh, 495 mm for 3-turn wire mesh, and 641 mm for 4-turn wire mesh. All three have the same height slightly shorter than the carbonate cylinder so that the inserts may fit into the chamber. Screws and nuts were used to hold the shape of the spiral.
Figure 4 presents the inserts used in this work.
4. Results
Compressions were carried out with and without the use of the techniques. Possible combinations have been tried switching the inserts and varying the spray injection pressure. For spray and the Archimedean spiral insert mesh cases, each compression process took about 5 s and at least six strokes were performed for each case. The first stroke was to stabilize all the conditions, and the measured data from the next strokes were used to calculate an averaged single stroke. The point right before the start of compression is set to be 0 in the data processing procedure. The initial level of the water was set near the middle of the chamber and the target pressure at the end of compression was in a range of about 260 kPa–290 kPa. As long as the final pressure is in the range with the same initial water level, the volume of the air inside the chamber was assumed to be well controlled. For each insert case, the gauge pressure of the water injection was varied from 0 to 60 psi with 20 psi interval, which are about 0, 138, 276, and 414 kPaG in SI unit.
4.1. Baseline Compression
Figure 5a shows the pressure and temperature data of six cycles of the baseline compression. In data processing, the procedures for initialization of the system were excluded such that the data starting near the first compression is displayed. As the compression begins, the pressure and temperature of the gas start to increase. When the compression is finished, the outlet solenoid valve opens to the atmosphere. Then, the compressed air expands and the air cools down. Thus, the drop of the temperature that follows the compression process is displayed in
Figure 5a. The temperature and pressure data for a single stroke are shown in
Figure 5b, which is extracted by averaging the five cycles from the second to the sixth stroke. For the averaged single stroke, the data starts to be collected ahead of the beginning of each compression process and the collection is finished before it reaches the peak. In the baseline compression, the pressure of the baseline compression is about 273.31 kPa and the temperature reaches about 338.65 K at the end of the process.
4.2. Compression with Spray Injection
In order to test the effectiveness of water droplets in abating temperature rise, spray injection method was used. The injection pressure was varied from 0 (without water pump operation for spray), 138, 276, to 414 kPaG. The flowrate of the water is given in
Figure 6. For no injection case (0 kPaG), the water pump for spray injection was not operated and flowrate data not collected. For 138 kPaG spray injection, water flowrate was about 0.8 L/min. For 276 and 414 kPaG spray injection, flowrates were slightly higher than 1.0 and 1.2 L/min, respectively. During the compression process, the flowrates drop as the pressure difference between the chamber and the water pump becomes smaller.
Figure 7 compares results of the compression with and without the use of water spray injection.
Figure 7a,b shows pressure and temperature change during the six strokes. For a single stroke averaged from the second to the sixth stroke, temperature, pressure, and normalized temperature-pressure data are displayed in
Figure 7c–e. The final pressures of the average single stroke for all the four cases are in a range of 255–275 kPa.
Table 2 shows the temperature increase, the difference between the final temperature and the initial temperature, and
Table 3 shows the temperature ratio to the initial temperature at the pressure ratio to the initial pressure of 2.5. Without the injection of water droplets, the temperature increase of about 43.19 K was observed for the baseline compression. With spray injection, an increase of 16.80 K at 138 kPaG injection, 3.59 K increase at 276 kPaG, and less than 2.47 K increase at 414 kPaG were observed. The spray injection technique clearly showed a temperature abatement effectiveness, and the effect was more significant at a higher injection pressure because the larger amount of spray enters the chamber and provides a larger surface area.
Since the final pressures are slightly different from one another due to the resetting experimental conditions over repeated cycles, a plot for normalized temperature and normalized pressure was also drawn in
Figure 7e. When the ratio of the pressure to the initial pressure is about 2.5, the temperature ratios to the initial temperature were measured and are shown in
Table 3. Because the data logging the frequency of the DAQ system is not fast enough to capture every specific pressure level, the measured pressure ratio close to 2.5 was used. When the pressure ratio approaches 2.5, a higher injection pressure showed a smaller increase in temperature ratio.
4.3. Compression with Copper Wire Mesh Inserts
The impact of metal wire mesh inserts with different dimensions on temperature abatement was examined in this section. Copper wire mesh inserts in the form of Archimedean spiral with two, three, and four turns were put into the liquid piston chamber, and their results were compared with the results of the baseline compression. Same as the previous experiments, at least six strokes of compression were performed, and the five strokes from the second to the sixth strokes were considered to obtain temperature and pressure data of an averaged single stroke.
Figure 8 compares results of the compression with and without the use of the AS formed copper wire mesh inserts. For a single stroke averaged from the second to the sixth stroke, the figure presents normalized temperature-pressure profiles.
Table 4 shows the temperature difference between the final and initial temperature while
Table 5 shows the comparison of the temperature ratios to the initial temperature at the pressure ratio of 2.5. All cases with an insert showed a smaller temperature increase than the baseline compression, which was expected. For AS wire mesh inserts, since each wire has the equal wire diameter and the same number of wires per inch, volume and surface area comparison can be easily made. The surface area and volume of an insert are proportional to the number of turns. In Equation (6), the heat transfer term is larger if an insert with a larger surface area is provided. The results are also in good agreement in that the 4-turn wire mesh, which has the largest surface area among the inserts, showed smaller temperature increase than the two other AS cases. Consistently, the 3-turn wire mesh showed better temperature abatement than the 2-turn wire mesh. For all cases, the final pressure level was similar. A normalized pressure-normalized temperature plot also showed a similar trend. All the insert cases came to have a smaller temperature ratio increase than the baseline case at the pressure ration of 2.5 because of the extra surface areas provided by the addition of the inserts. In this normalized pressure-temperature analysis, at the ratio of 2.5, more turns of AS mesh lead to better temperature abatement effect.
4.4. Compression with the Simultaneous Use of Spray and Wire Mesh Insert
This section is dedicated to presenting the results of the simultaneous use of spray injection and copper wire mesh inserts. Same as in the previous experiments, to figure out the effect of spray injection alone, the water injection pressure was varied from 0 (no spray injection), 138, 276, to 414 kPaG for the AS inserts.
Figure 9 shows the normalized temperature-pressure profiles of the simultaneous use of the 2-turn AS insert and spray injection techniques. The results for 3-turn AS insert and 4-turn AS insert with spray injection are given in
Figure 10 and
Figure 11, respectively. For all the cases, the temperature increase data are summarized in
Table 6, and the normalized temperature ratio data at the pressure ratio of 2.5 are given in
Table 7. For all the cases, whether the compression was performed with or without an insert, spray injection helped suppress the temperature rise. Compared to compression without spray injection, all the simultaneous use of the two techniques showed improved temperature abatement. Same as the compression with spray injection and no insert, less temperature increase was observed at higher injection pressure for the most cases.
Table 6 summarized the temperature increase results for all the cases. Comparing the results in the
Table 6, the additional temperature abatement effect following the injection pressure increase turned out to be dependent on the insert. Typically, the increase in spray injection pressure affected the results of without-insert cases more significantly than in with-insert cases. For instance, for no insert compression, about 43.2 K temperature increase for the baseline compression drops to about 16.8 K with 138 kPaG spray injection. For the 2- and 3-turn wire mesh inserts, 138 kPaG spray injection led to 4.67 K and 2.57 K of decrease from the inserts alone. For the 4-turn wire mesh insert,
Figure 11 illustrates that the addition of 138 kPaG spray is effective in the early stage of compression. At the end of the process, the temperature increase from the beginning of the compression is nearly same as the insert alone. When the spray injection pressure is low, the addition of an AS wire mesh insert typically achieved better isothermal compression efficiency than spray injection alone. At 138 kPaG of spray injection, the wire mesh cases showed less temperature increase of 13.75 K, 12.99 K, and 13.70 K with the 2-, 3-, and 4-turn AS inserts than 16.80 K observed in compression with 138 kPaG spray injection alone without an insert. When spray injection pressure is 276 kPaG, 2-turn AS insert showed the smallest temperature increase among all the other cases with 276 kPaG injection. Interestingly, no insert case showed less increase than the 3- and 4-turn inserts. At 414 kPaG of spray injection pressure, only 2-turn wire mesh showed less temperature increase of 2.23 K than 2.47 K increase observed in the spray injection alone, while the other two showed more than 3 K of the increase. Among the cases tested, 414 kPaG spray injection with 2-turn AS wire mesh inserts showed the least temperature increase during the compression. It was about 2.23 K. Moreover, 414 kPaG spray with no insert and 2-turn mesh showed highly promising results, which are even better than the 414 kPaG injection with the larger volume inserts.
Figure 9,
Figure 10 and
Figure 11 show the normalized pressure-normalized temperature plots at the pressure ratio of 2.5, and the numerical results are arranged in
Table 7. As confirmed in the previous case, more turns of the inserts provide a larger surface area and better temperature abatement when spray injection is not employed. However, it is interesting to note that, with spray injection, larger inserts do not necessarily guarantee a better temperature abatement. For example, at 138 kPaG of spray injection, the 2-turn AS mesh showed the smallest increase of temperature ratio of 1.037. At 276 kPaG and 414 kPaG of spray injection, all the other three cases showed a same or smaller temperature ratio increase than the 4-turn insert. These results also support that the combination of the highest flowrate, and the largest insert does not simply lead to the best isothermal efficiency. This implies that the use of a larger insert may adversely affect the temperature abatement benefit from water droplets.
5. Discussion
Despite the simultaneous use of the two proven techniques, the experimental results show that the temperature abatement impacts can be hindered compared with using the spray technique alone. In order to account for the reduced heat transfer analytically, the heat transfer coefficients of the free-falling and stationary droplets are estimated by employing Equations (10)–(13). For the volume of the gas calculations, the gas inside the transparent cylinder part was only considered because the volume of the upper pipe that has complex geometry is relatively small compared with the main chamber. When using Equation (9) with the baseline compression data, the average water piston surface velocity during the compression is 0.0171 m/s in the upward direction. The velocity of the gas at the liquid piston surface is the same as the piston velocity and the speed of the gas at the ceiling of the chamber is zero. As a result, is set to be 0.0086 m/s. The droplet speed data was provided by the manufacturer. Due to the short droplet travel time in this experiment, the velocity of the droplet is assumed to be the same throughout the falling travel. The actual velocity of each droplet may be different from the velocity, given that the direction of droplets, extra atomization of aloft droplets as they travel in the air, inherent characteristics of the injector, and varying pressure of the chamber are the factors that affect the velocity of each droplet. However, since the goal of the present work is to compare the techniques and to point out the reason for the observed experimental results, the assumptions to simplify the model have been adopted.
For the calculations, air properties around 295K are selected. Parameters adopted for the calculations are given in
Table 8. For
at each pressure, volume median droplet diameter (DV0.5) data from the manufacturer have been used.
Reynolds number, Nusselt number, and heat transfer coefficient for a single droplet are calculated based on the parameters shown in
Table 8 using Equations (10), (12) and (13). The results are displayed in
Figure 12, and the specific values are summarized in
Table 9.
Figure 12 and
Table 9 compare the results of a free-falling droplet in the air and a stationary droplet remaining on the surface of an insert.
For all three injection cases, the free-falling droplet cases with much higher velocities than the stationary droplet lead to larger Reynolds numbers. As a result of the larger Reynolds number and Nusselt number, the heat transfer coefficients of a free-falling droplet are about 3.95–4.22 times as large as those of a stationary droplet at each pressure level. For the injection at the higher pressure, the gap between free-falling and stationary droplets becomes larger. Despite the decrease in the droplet diameters at the higher injection pressure, which leads to the decrease in Reynolds number, the gain from the increase of droplet velocity is greater and results in higher Reynolds number. At the higher pressure, the sizes of droplets are smaller while the flowrates are higher. As a result, the number of droplets entering the chamber is also larger. Therefore, it is reasonable to conclude that the amount of the loss of droplet heat transfer due to the presence of an insert may be more significant at the higher spray pressure.
This explanation is in good agreement with the experimental results of the present work. The results displayed in
Table 6 and
Table 7 show that, the addition of all the inserts results in better temperature abatement at 0 and 138 kPaG spray injection pressures, whereas the 3- and 4-turn AS wire mesh inserts, which provide relatively more distraction, showed noticeably less temperature abatement at 276 and 414 kPaG spray injection pressures than the cases with spray injection alone and spray with the 2-turn AS wire mesh insert.
In conclusion, for the cases that showed more temperature abatement when the two techniques are used, the benefit from the addition of the insert was greater than the loss from the decrease of heat transfer coefficient resulting from some droplets adhering to the insert surface. Among the tested cases, the best result was observed with the combination of the 2-turn AS insert and spray injection at 414 kPaG injection pressure. As can be seen in
Table 7, the 0.7% increase of normalized temperature ratio was achieved when the pressure ratio reached 2.5. Compared to the 13% increase for the baseline compression case, this result shows that temperature abatement improved significantly with the use of the techniques. On the contrary, a simultaneous use of the two methods proved to be less effective than spray injection alone in some cases. For example, the spray injection at 414 kPaG without an insert leads to 0.8% increment of temperature ratio, which is better than 1.2% increment with the use of the 414 kPaG spray and 4-turn AS insert at a time. This is consistent with the conclusion that having an insert can compromise some portion of the temperature abatement effect resulting from free-falling water droplets.
6. Conclusions
Achieving a near-isothermal compression process can play a crucial role to improving the overall efficiency of the CAES system because it can lessen the waste of energy that occurs through the temperature rise during compression in commercialized CAES systems. Enhancement of heat transfer is key to increasing isothermal efficiency of a gas compression process by abating temperature rise during compression. In this work, a simultaneous use of two proven efficiency enhancement techniques in a liquid piston compressor, spray injection and a metal wire mesh insert, was experimentally investigated. Metal wire mesh inserts with three different geometries were used in addition to a spray injection technique. Copper wire mesh inserts in the form of the Archimedean Spiral (AS) of two, three, and four turns were used in order to examine how quantitative changes in geometries affect the isothermal compression efficiency and the results were compared.
When water droplets through spray injection were incorporated into compression with AS wire mesh inserts, more temperature abatement was observed over the use of the inserts alone. This is because the additional surface area provided by droplets beyond that provided the mesh inserts. However, using the two methods together did not always result in enhanced efficiency compared to spray injection alone. In the experiments with the utilization of the AS inserts and spray injection, the largest surface area from the use of water spray injection can be provided at 414 kPaG of the injection pressure. For the AS wire mesh inserts, 4-turn wire mesh has the largest surface area among the AS inserts. When both are used simultaneously, about 1.2% of temperature increase was observed from the initial temperature, whereas 2-turn AS mesh, which adds smaller surface area, with 414 kPaG spray case showed about 0.7% of temperature increase from the initial absolute temperature when the normalized pressure ratio was at 2.5. Furthermore, spray at 414 kPaG without any insert also resulted in 0.8% of temperature increment from the initial temperature, which was even better than the use of 414 kPaG spray with 3- and 4-turn wire mesh insert cases. Although it is a small difference, it leads to a conclusion that the combination of the best conditions from each technique does not always result in the best temperature abatement. This is because not all droplets were allowed to have their full length of travel due to the existence of the inserts, which ended up compromising the temperature abatement from droplets. Once some droplets adhere to the inserts and stay on the surface, the heat transfer coefficient between stationary droplets and the gas being compressed is less than the heat transfer coefficient of freefalling droplets.
Despite the partial loss in the effectiveness of droplets, there are combinations of spray injection pressures and mesh inserts that showed less temperature increase than the use of spray injection or wire mesh inserts alone. This can happen when the gain of temperature abatement from the two techniques is larger than the loss of temperature abatement due to the intrusion by the inserts. Otherwise, when an insert takes much space and distracts the full travel of droplets, the loss of droplet heat transfer was observed to be more notable. Reynolds number, Nusselt number, and heat transfer coefficient of a free-falling droplet and a stationary droplet are estimated in order to analytically interpret the compromised heat transfer portion in the compression with the two techniques. Because of the higher speed of free-falling droplets, they have greater heat transfer coefficients than stationary droplets. At 138 kPaG injection pressure, the heat transfer coefficient of a free-falling droplet is 3.95 times as great as that of a stationary droplet, 4.12 times for 276 kPaG injection, and 4.22 times for 414 kPaG injection.
The current work leaves room for improvements. It does not satisfactorily explain to what extent the temperature abatement of spray is affected by the existence of inserts. For the experimental setup, since the thermocouple measures the local temperature of the upper part that has a complex geometry, it does not represent the overall temperature of the gas temperature during the compression. Nevertheless, the present setup was able to perform a comparative study to examine the feasibility of further improvement using the multiple heat transfer enhancement techniques at a time. The results show that there can be a sweet spot that maximizes the temperature abatement, whereas compromised results can also be observed even with the two techniques simultaneously applied. Furthermore, the current study investigates how the injection pressures affect droplet transfer dynamics in order to analytically interpret the compromised temperature abatement portion. Because the trade-off relationship between the size and the speed of a droplet with pressure variations was taken into account, it paves a way to further analysis of the spray injection cooling technique at various injection pressures or under a pressurized condition.


