Abstract
Electric vehicle (EV) use is growing at a steady rate globally. Many countries are planning to ban internal combustion engines by 2030. One of the key issues needed to be addressed before the full-scale deployment of EVs is ensuring energy security. Various studies have developed models to simulate and study hourly electricity demand from EV charging. In this study, we present an improved model based on discrete event simulation, which allows for modeling characteristics of individual EV users, including the availability of electric vehicle supply equipment (EVSE) outside homes and the charging threshold of each EV user. The model is illustrated by simulating 1000 random electric vehicles generated using data from an actual survey. The results agree with previous studies that daily charging demands do not significantly vary. However, the results show a significant shift in charging schedule during weekends. Moreover, the simulation demonstrated that the charging peak demand can be reduced by as much as 11% if EVSEs are made more available outside homes. Interestingly, a behavioral solution, such as requiring users to fully utilize their EV’s battery capacity, is more effective in reducing the peak demand (14–17%). Finally, the study concludes by discussing a few potential implications on electric vehicle charging policy.
1. Introduction
The use of electric vehicles (EVs) coupled with the utilization of renewable energy can significantly reduce emissions and improve air quality. In fact, the use of the electric drivetrain on its own can already significantly reduce energy consumption per kilometer traveled due to its superior efficiency [1]. This is encouraging policymakers to eagerly promote electric vehicles. Various countries have been targeting to have a significant EV volume within the next decades. China, which has the largest deployment of EVs globally, projects to extend the volume of EV units to 5,000,000 by 2020. The United States’ EV industry aims to own half of the automobile market share by 2050. The Netherlands and Slovenia aim to make all new vehicle sales by 2030 electric [2]. The same will be implemented by France and Great Britain by the year 2040. Germany intends to ban internal combustion engines by 2030 [3]. Norway targets all their cars to be either an EV or a plug-in hybrid electric vehicle (PHEV) by 2025. These targets and projections assert that the electrification of vehicles is already in progress and is on its way to dominating the operation of transportation globally. This majorly affects car manufacturers because they will need to adapt to new policies, which means that they will need to invest in EVs. Some of the car manufacturers that are on their way to being fully electric or zero-emission are Jaguar, Bentley Motors, and General Motors [4]. The California Air Resources Board pushed for the Zero-Emission Vehicle (ZEV) Program which aims to lessen the number of vehicles that depend on petroleum fuel by transitioning to battery electric vehicles (BEVs), PHEVs, and hydrogen fuel cell vehicles (HFCVs). In the ZEV program, auto manufacturers are obligated to produce ZEVs and PHEVs on the basis of the percentage of total car sales. Other states also adopted California’s ZEV program [5]. Countries such as France, the United Kingdom, the United States, Japan, and China are giving incentives to those who use EVs or vehicles that emit less carbon dioxide (CO2). In China, license plates are assured to be given to EV users with no payment [6].
Due to these trends, one of the issues that needs to be understood better is the impact of EVs to the electricity grid. This is in addition to other relevant issues such as range anxiety [7] and accurate estimation of energy consumption [8]. Forecasts on the future electricity demand from EV charging should be made to prevent power shortages from happening in the future.
In this study, a novel approach based on discrete event simulation (DES) was developed to model the hourly electricity demand from EV charging. A detailed literature review is presented on the next section to support this claim. DES was previously used by Darabi and Ferdowski [9] to simulate the electricity demand from EV charging. In the aforementioned study, EVs are required to line up and wait until there is a vacant charging outlet on a single destination, significantly limiting the possibilities in the simulation. In this present study, the type of destination (e.g., work, home, other) and time of charging were determined stochastically using the charging threshold of the individual, the state of charge (SOC) of the EV, and of the availability of charging in the individual’s current location, among others. By using a Monte Carlo approach, we integrated into the model the statistical distribution of departure time, destination, and distance per trip, as well as the number of hours spent in the office per individual, among other factors. Weekday and weekend demand comparisons are also presented in this study.
The manuscript is organized as follows: a literature review is discussed in the next section, followed by methods and data, results and discussion, and conclusions.
2. Literature Review
The literature on electric vehicle charging primarily investigates charging schedule and peak demand levels. A few studies also look into the characteristics and behavior of EV users. Specific details are discussed below.
With regards to charging times, the trend is generally the same—charging peaks in the evening and is lowest in the morning. In Ireland, real-time data showed that the EV charging demand simultaneously peaks with the general electricity demand [10]. Tiantian [11] used Monte Carlo and binomial distribution methods to translate the charging model of a single EV into a large-scale model. The EV model used is a Nissan Leaf with the following specifications: power consumption of 0.15–0.30 kWh/km, battery capacity of 24 kWh, and endurance mileage of 160 km under normal climate and driving conditions. The electricity consumption by EV charging was simulated for both work and home charging. Three cases for each way were done: no traffic jam and no air-conditioning, with traffic jam and with a temperature of 35 °C, and no traffic jam with a temperature of −10 °C. The three cases affected the results for work-based charging, while home-based charging showed little to no response to them. In Camus et al. [12], limiting charging to off-peak hours was explored. The results showed that significant demand during the peak period can be shaved off with this approach. In Schey et al. [13], the time with the highest variation during weekdays took place from 00:00 to 05:00 and the lowest demand occurred from 06:00 to 12:00. Residential charging was low in the daytime and started to increase in the evening, then maintained a high demand at night. The peak demand happens at 19:00 during weekdays. In Ireland, a study collected actual utilization data on various charging points. A standard charge point that had a nominal power of 22 kW was highly used during the daytime, while a fast charger with a nominal power of 43 or 50 kW was highly used during evening and night. The duration of home charging was higher than public standard charging. The largest percentage of home charging was executed in the evening [14].
A model based on real-world EV charging data in Ireland showed that the percentage of EV charging increased from 0% at about 6:00 a.m. to approximately 27% at 7:00 p.m., after which the charging percentage gradually decreased [15]. Moreover, a survey in California was conducted from 2016 to 2017 for PEV owners. It was found out that the number of BEV and PHEV owners who charge at home is not affected by the day of the week. Furthermore, the highest percentage of PEV charging occurs at home [16]. Mallig et al. [17] validated that the major peak hour is around 18:00 to 19:00. According to Moon et al. [18], the majority of EV users (60%) in Korea charge at nighttime. The other 40% prefer to charge during the daytime, which most likely occurs at public EVSEs. On the other hand, the results of Schey et al. [13] were rather unique, as they observed two separate charging peaks in the evening. In their project, participants were observed to charge their EVs at home. The normalized plot for weekday charging demand showed that the demand per EVSE initially increased at 16:00 and peaked at around 23:00. The second peak occurred from around 00:00 to 01:00. The charging peak schedules during the weekends were similar, but with a lower demand.
Several other studies were previously performed to describe the charging behaviors of EV users. A field test was executed for 16 weeks, and it was found that EVs are parked 90% of the time, while they are being charged 60% of the time [19]. A spatial-temporal activity model by Tiantian [11] showed that EVs in China are generally parked from 08:35 to 17:00 and 17:50 to 07:45. Generally, EV users in China drive from 07:45 to 08:35 and from 17:00 to 17:50. Monte Carlo simulation was used by Brady and O’Mahony [15] to study the behavior of EV users. The study collected the GPS data of 15 iMiev EVs, which were used by private employees and public members for nine months. The following behaviors were observed in the model: EV driving has the highest frequency at 9:00 a.m. and 6:00 p.m., a high percentage of EV users arrive home at 21:00, EV charging electricity demand peaks at around 20:00. The key takeaway is that the uniqueness of each city must be considered in such models, as great variations in travel demand, schedule, and behavior can be observed.
Simulation techniques had been used to forecast the potential impacts of EV charging on the electricity grid. Multi-agent Monte Carlo simulations [20] and scenario analysis [12] were used to determine the influence of EV charging on peak electricity demand. The two studies concluded that EV charging may not affect the grid by more than 2% and by about 53%, respectively. In Harris and Webber [21], three regions were examined, and simulations showed that the average peak load will increase to a maximum of 1.9% of the forecasted peak load by year 2025. Kelly et al. [22] cautioned that increases in network peak demand due to penetration of EV charging can cause transformers to overload. On the other hand, Paevere et al. [23] predicted that the increase in peak electricity demand due to EV charging can be from 10% to 15% in Australia. Arias and Bae [24] used historical traffic data in South Korea to predict hourly EV charging, with weekday, weekend, residential, commercial, and various weather comparisons. The same authors also conducted a spatiotemporal EV charging study [25] using CCTV data. Additionally, Bae and Kwasinski [26] developed a spatiotemporal model for prediction of EV charging demand using fluid dynamics principles to model the arrival of vehicles on a charging station and a queueing system to model the discharge of vehicles.
Different studies were able to cover different levels of complexity in their simulations. The power systems market model PLEXOS was used by Foley et al. [27] to show that it is better to charge EVs during off-peak hours than during peak hours, and that 1.5% of the renewable energy in transport can be supplied to EV charging. In another study, a multinomial logit model was used by Lee et al. [16]. In the model, EV users were grouped according to their preferred location of charging. The groups were the following: those who charge only at home, only at work, only at public places, at home or work, at home or public, at work or public, and at all locations. The general social characteristics of EV users for each classification were determined by the model. The following are some of the social characteristics defined by the model: household income, age, gender, and household size. Furthermore, the travel demand model called mobiTopp was used by Mallig et al. [17] to model the weekly electricity demand from EVs. In the model, every person, household, and vehicle were distinctive agents. Agents can distinctively choose their destination and mode of driving.
With regards to this study’s choice of methodology, discrete event simulation, or DES, has been widely used in previous electric vehicle studies. The primary areas of application were in the modeling of electric vehicle energy demand [28,29,30], cost of ownership [31], optimal charging station locations [32,33,34], and scheduling [35,36]. A key differentiating factor for DES is that it significantly reduces the number of decision variables in the simulation [36], and this is also taken advantage of in this study.
The present study therefore builds onto the previous modeling approaches. While other studies have already successfully estimated potential charging peak demand and hourly charging demand through simulations, the model developed in this study enables the modeling of EVSE availability outside homes, as well as the charging threshold of individual EV users. It can be hypothesized that increasing EVSE availability will increase daytime EV charging demand. However, the question is by how much and how it will affect peak charging in the evening. Moreover, varying the charging threshold of individual EV users introduces an important behavioral component of EV charging. Frequent charging can also potentially stress the grid. However, occasional charging can create longer charging hours, which also may extend to peak periods. The details of the discrete event simulation-based model integrated with a Monte Carlo approach are described in the succeeding section.
3. Methods and Data
The model in this study is based on the logic of discrete event simulation (DES), embedded with a Monte Carlo approach. The model is implemented in a spreadsheet software and can simulate as many individuals as the software can handle (e.g., in MS Excel, the maximum number of rows is approximately 1 million). The simulation is run on a laptop with a Core i7 processor and 8 GB RAM. For 1000 individual EVs, the average delay is around 4 s per iteration. More details on the model are discussed below.
Each destination in an individual’s daily travel itinerary comprises of two “events” in this model, i.e., arrival and departure. While there is technically no limit on the number of events that may be simulated per day, it is limited to only eight events in this paper. On the last destination of the day, the individual is sent “home” by default. However, it is not prohibited from going home as early as the third event. On the first, third and fifth events, it can either go to “work” or to “other” destinations. The difference between these destinations can be the time spent on them (i.e., based on the survey data), the availability of EVSE (i.e., determined stochastically using a user-inputted distribution), and type of EVSEs (i.e., power rating). Being able to specify the percentage availability of EVSEs outside homes is one of the novelties of this study.
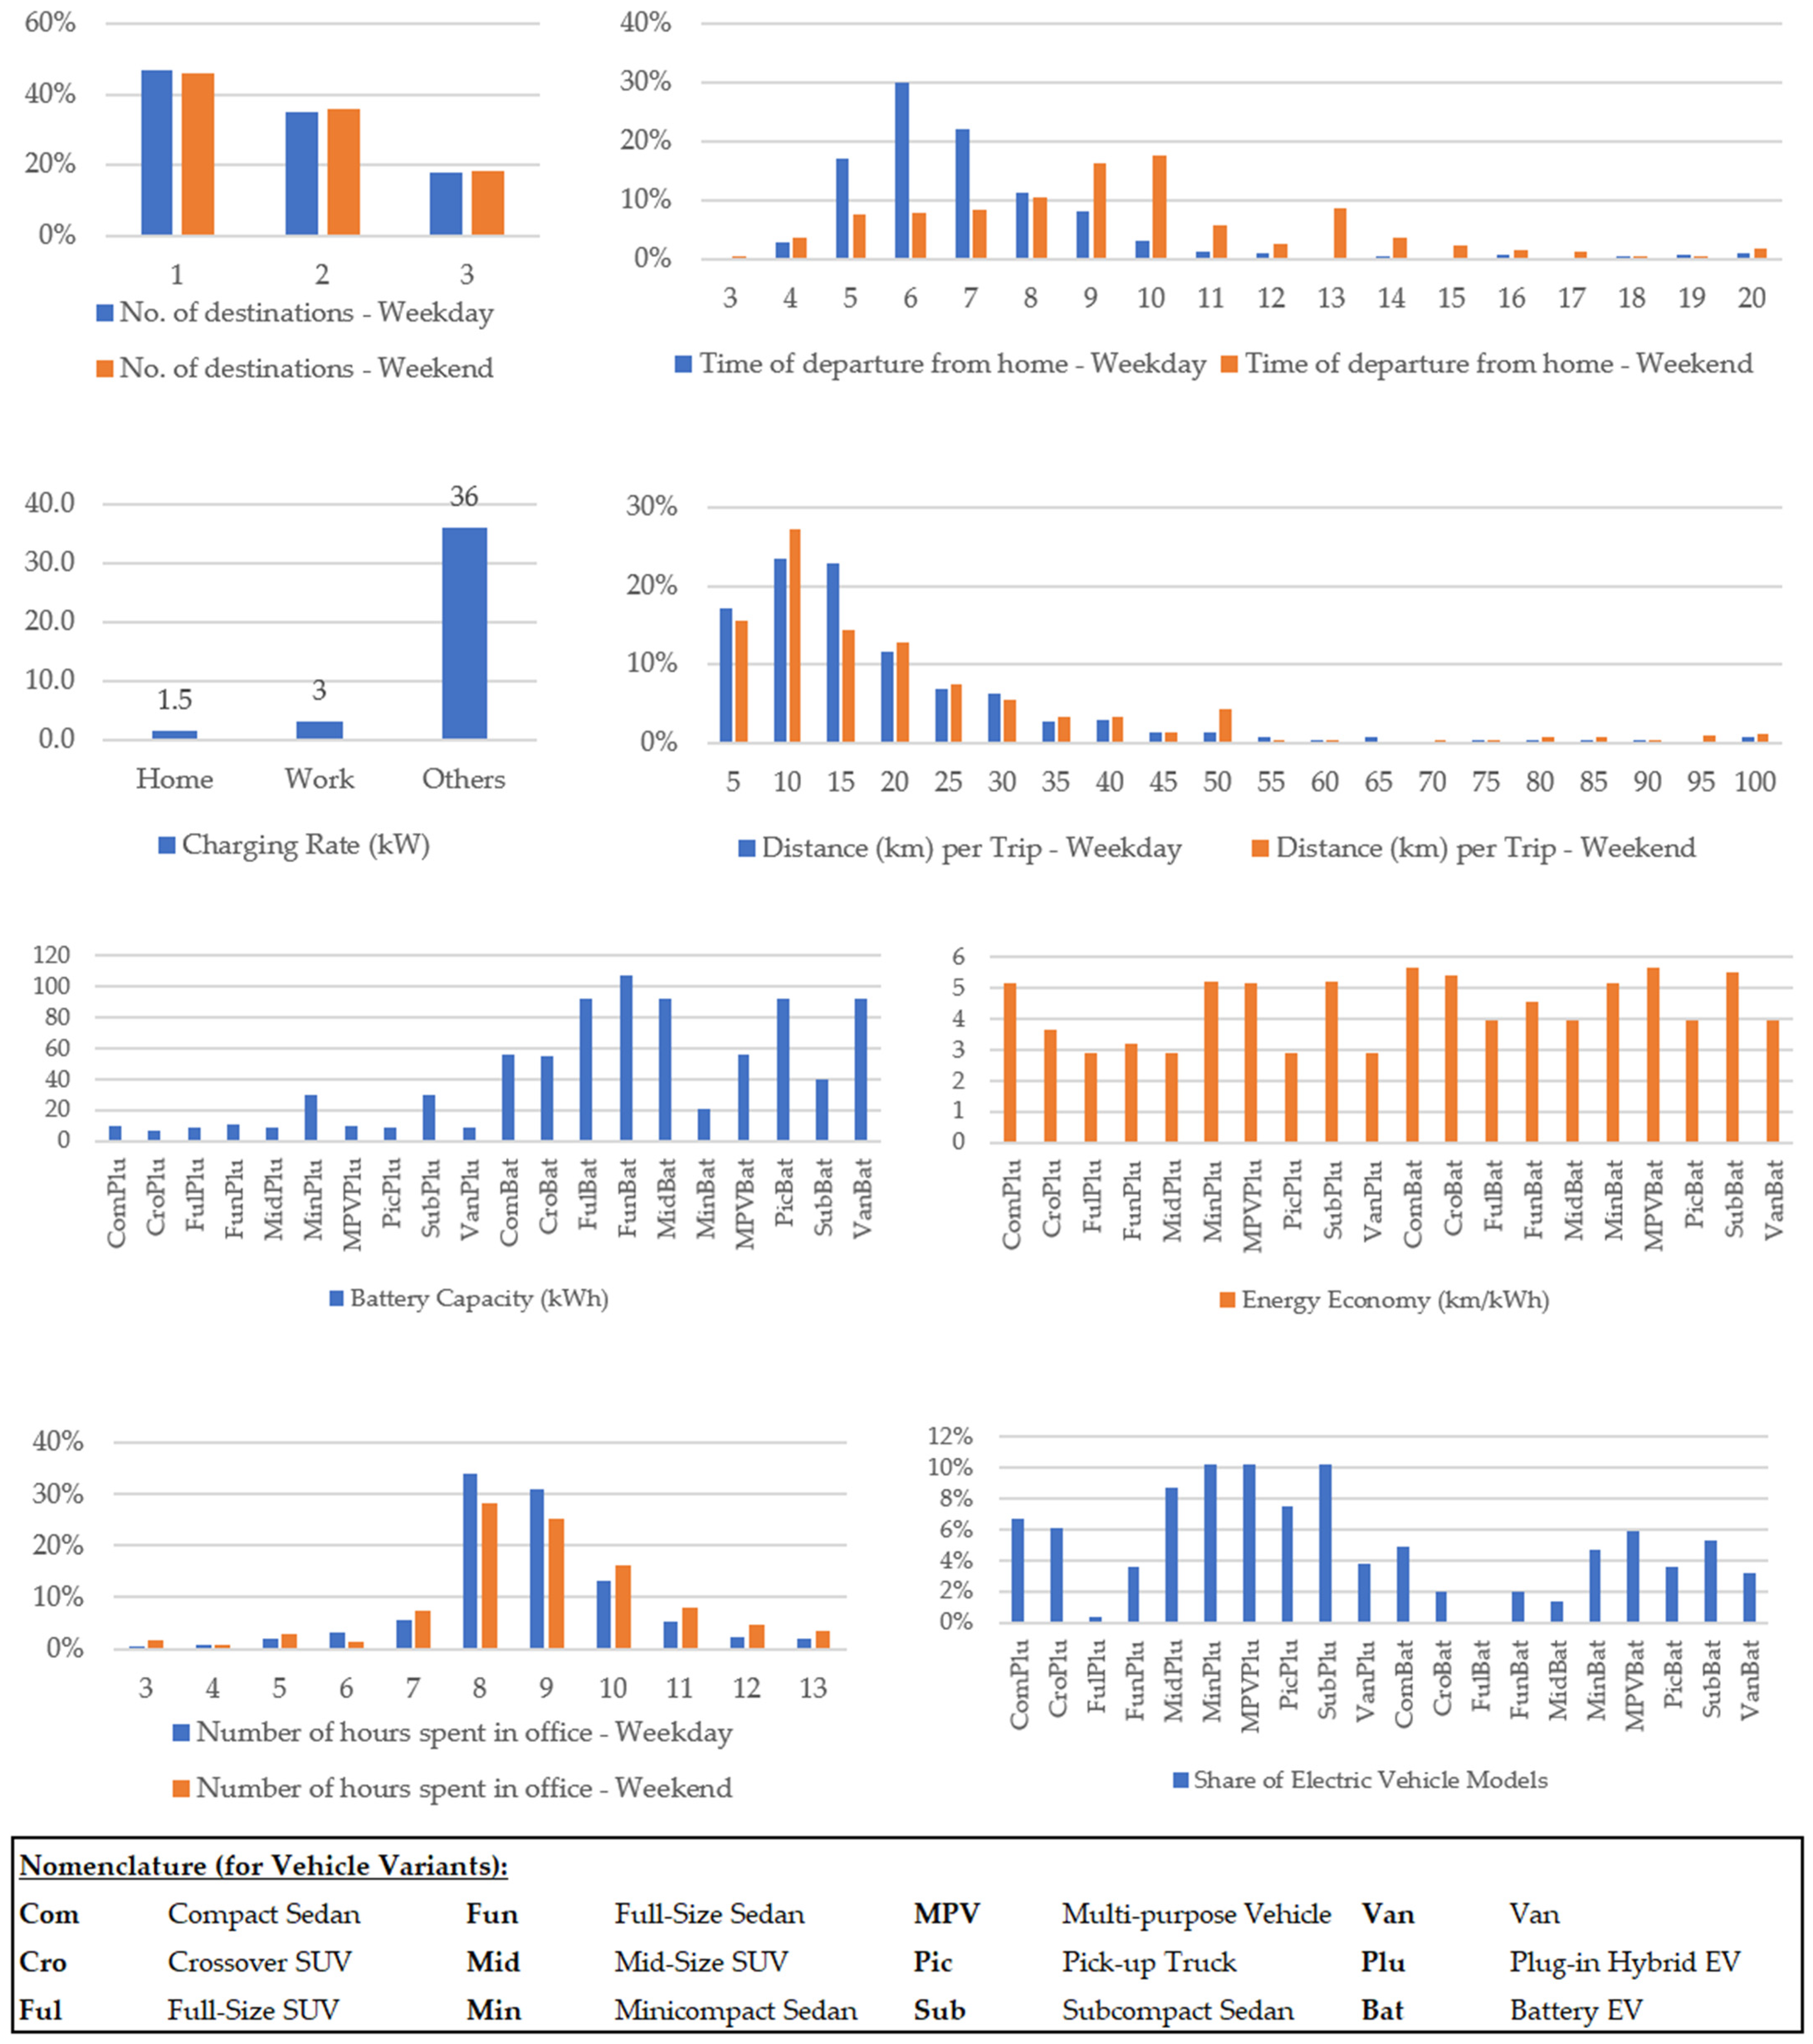
In traditional discrete event simulations, entities queue and share resources. All the entities usually belong to one system only. A classic example would be people queueing to transact with tellers in a bank. In traditional DES, the people in the example would be considered the “entities”, and they queue to be served by the same teller/s. There can be at least two events in that example, which are the arrival and departure of a person at the teller. The state of the entities and the system change during each event. In the modified discrete event simulation-based model we use in this paper, each electric vehicle (EV) is a system on its own—they do not share resources and chargers with any other vehicles in any destination. This is the major difference between our approach and the traditional DES. However, the authors acknowledge that not being able to queue EVs to use a charger as a weakness/limitation of the model. In reality, EVs would have to wait for a charger to be available in some instances. This is an opportunity to develop the model further for future work. This is discussed further in Section 3.2 below. On each event, the model recalculates the state of the system. Various variables calculated during this instance include the timestamp and battery state of charge of the EV. Various data used in this study are summarized in Figure 1. For demonstration purposes, the percentage distributions were generated from a survey of 2000 participants conducted by the main project, of which this study is a part of [37]. The type of vehicle was also determined using the forecasted distribution of electric vehicle variants by the year 2030 in the Philippines, from the same study.
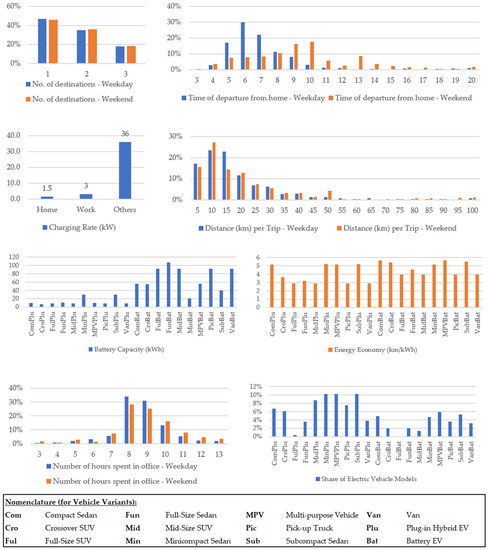
Figure 1.
Compilation of survey data and assumptions used in the model.
The model recalculates the battery SOC upon arrival at each destination as a function of the trip length and the vehicle type’s assumed energy economy. An average energy economy for each vehicle type (in km/kWh) is obtained from AFLEET [38]. The same values were used on a previous study by the authors [39]. This is assumed to be constant for each vehicle type.
The model makes use of the various percentage distributions, both from the survey and specified by the modeler, through random number variables. Microsoft Excel generates random numbers using the Mersenne Twister pseudorandom number generator algorithm [40]. The type of vehicle, trip length, number of destinations, departure time, type of destination, amount of time spent on each destination, and other characteristics of an individual are taken from the percentage distributions generated from the survey. Each variable is assigned with its own random number variable to determine its value/setting.
3.1. DES Process Flow
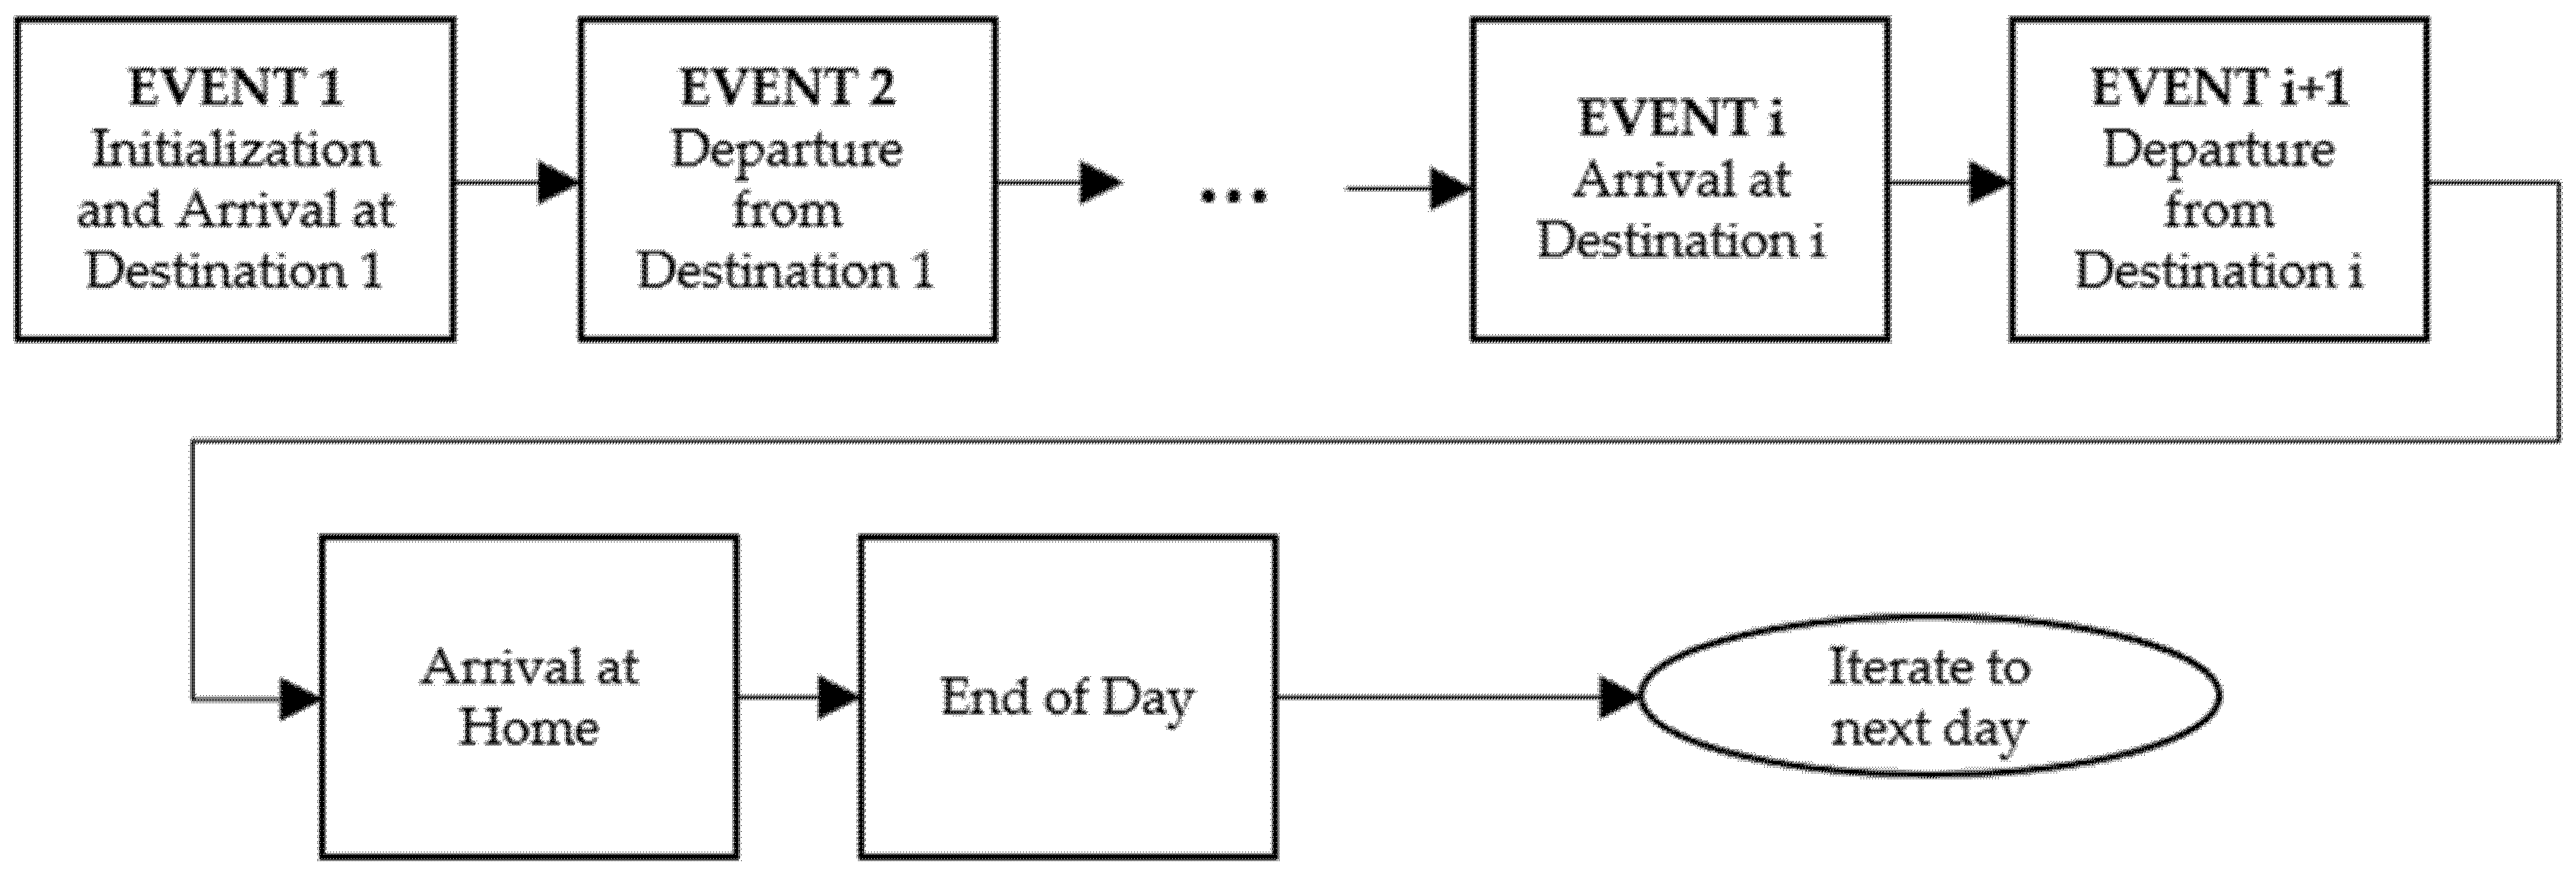
The general process flow of the whole simulation is shown on Figure 2.
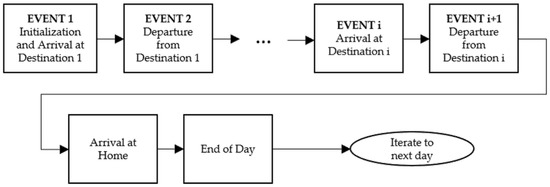
Figure 2.
Summary of tasks carried out by the model in each event.
The simulation starts with EVENT 1, which is an initialization step where the following are attended to by the model:
- Generate the number of random EVs, i.e., systems to be simulated. In the case study below, the authors generated 1000 random EV users.
- Determine the vehicle type/variant of each user.
- Determine the starting battery state of charge (SOC0) of each EV.
- Determine the time of departure (T0), i.e., from home, of each EV user.
- Determine the nature of the first destination.
- Determine the driving distance to the first destination (X1).
At the same step, the model simulates the arrival of the EV at the first destination, where the following are then calculated:
DES allows the simulation to jump to specific time steps where significant changes in the model occur. This saves computational resources, as what happens in between significant events do not have to be modeled in detail. Equations (1) and (2) show what occurs in the model when the DES jumps to the time when an EV arrives at one of its destinations. Ti is the time of arrival at destination i. Ti−1 is the time of departure from the previous destination. For the first destination, Ti−1 would be the time of departure from home. TDi is the travel time to the current destination. Furthermore, upon arrival at a destination, the new SOC of the EV is calculated. SOCiA is the SOC of the EV upon arrival at destination i. Meanwhile, SOC(i−1)D is the SOC of the EV upon departure from the previous destination. For the first destination of day 1, SOC(i−1)D shall be equal to SOC0. Finally, ECi refers to the energy consumption of the EV due to driving to destination i.
After the “arrival” event, the DES jumps to the “departure” event, where the following decisions/checks have to be made by the model:
- Is SOCiA below the driver’s charging threshold?
- Is an EVSE available at destination i?
On the basis of these two questions, the model will determine if the EV user charged the vehicle at destination i. The charging threshold of the driver refers to the percentage SOC that will trigger them to charge. While this is obviously driven by technical factors (e.g., distance of next destination) the authors hypothesize that this is significantly affected by psychological factors. Like the availability of EVSEs, the charging threshold of the individuals are also inputted to the model through a percentage distribution by the modeler and is also one of the key novelties of this study. If the conditions necessary to trigger charging are met at destination i, the new SOC is recalculated:
where SOCiD refers to the SOC upon departure from destination i; Si refers to the amount of time spent on destination i; and CRi refers to the charge rate, i.e., 1.5 kW, 3 kW, or 36 kW, installed at destination i. If the battery becomes fully charged earlier than Si, the EV will be “unplugged” earlier by the model. The model does not assume that the EV will remain plugged onto the grid during the whole duration of stay at any destination. Afterwards, the DES jumps to time step Ti+1 (departure time from destination i):
The model prepares for the next “arrival” event by determining the nature of destination i + 1, i.e., home, work, or other. The distance to destination i + 1 (Xi+1) is also determined. Note that as mentioned above, a probability distribution for these kinds of variables were taken from a survey, and then the model selects through random number generation.
The arrival and departure events at each succeeding destination basically performs the same exact steps outlined above. Computationally, there are no limits to the number of events a modeler can simulate in a day; however, physical/realistic constraints have to be considered. For example, there are only 24 h in a day, and a person cannot be driving or traveling during the whole 24 h. Thus, the last destination for each day is automatically set to “home”. Home charging is enabled for all users in this model, and it is given a fixed charge rate of 1.5 kW. Like in other destinations, the model does not assume that the EV will be plugged into the grid 100% of the time while at home. The model will unplug the EV as soon as it reaches 100% SOC. At the end of each day, the ending SOC of the EV is transferred to the next day, and that becomes the starting SOC (SOC0) for that day. The ending SOC for the previous day is obtained at 05:00 h of the current day, not for any particular reason, but it was set to be the “handshake” period between two days to allow the EV to charge as much as possible first at home before leaving for the next day. This also allows the model to not simulate any charging anymore at the start of the day and go straight to processing the departure for the first destination of the day. The model will run continuously for 6 weeks, calculating the charging demand every 6 min. Since the departure time, travel time and time spent on each destination are known, time stamps can be given to each charging activity, and therefore can be aggregated together with the other EVs’ charging activities to form the model’s total hourly charging demand.
3.2. Constraints and Assumptions
This section discusses specific constraints and assumptions applied specifically to the illustrative case study below. First, the model is capable of differentiating between weekdays and weekends, as data on typical weekday and weekend trips were collected via a survey. Unfortunately, specific differences between Saturdays or Sundays and among weekdays cannot be determined as they have not been differentiated in the survey.
Regarding charge rates, all homes are assumed to have 1.5 kW chargers installed, while work and other destinations are assumed to have 3 kW and 36 kW chargers, respectively. This is because users are assumed to spend less time in other destinations than work, and thus would require faster charge rates. Other destinations represent coffee shops and stores in this study.
The timestamps in the DES are calculated as a function of the journey length and an assumed average speed of 40 km/h. The energy consumption of each EV is calculated using the assumed energy economies in Figure 1 (above).
Furthermore, as described in Section 3.1, a major limitation of this model is that it does not simulate queueing. While the model simulates the availability of an EVSE in a particular destination, each EV user is modeled as a separate system. That is, the model does not determine if any two EVs are at the same place at any time, thus preventing queueing to be modeled in the study. It is then assumed that as long as an EVSE infrastructure is present in the destination, it should be ready and waiting for the EV to use. It should not be difficult to add queueing as an additional feature to this model in the future. In fact, queueing is one of the strengths of DES, as shown in previous literature such as in Darabi and Ferdowski [9], and DES has been used in spatiotemporal types of studies before [33,34]. While the difficulty of modeling it is not a problem, modeling queueing would significantly increase the number of variables in the simulation as the instantaneous location of each EV will have to be monitored. Thus, for simplification, it is not included in this study.
On each iteration, the charging demand (in kW) is estimated every 6 min for 24 h in a day for six continuous weeks. The first five weeks are used only for stabilization. This is because at day 1, all vehicles are assigned a random battery SOC. This initialization is observed to have a significant effect on the results, which is smoothened as the simulation is extended. The 6-week simulation is also iterated 30 times. While the general trend of hourly charging demand is consistent for each iteration, the peaks can vary significantly due to the randomness of the variables in the model. To make the results rigid, we used the average of 30 iterations for analysis in this study. The 30 iterations smoothen the run-to-run fluctuations caused by random number generation to ≈1.4%. With this approach, the study is confident that any difference observed between days in the model are not just due to chance.
4. Results and Discussion
This section illustrates the capability of the simulation model presented in this study using 1000 random EVs modeled using actual survey data from Manila, the Philippines.
4.1. Daily Variation in Charging Demand
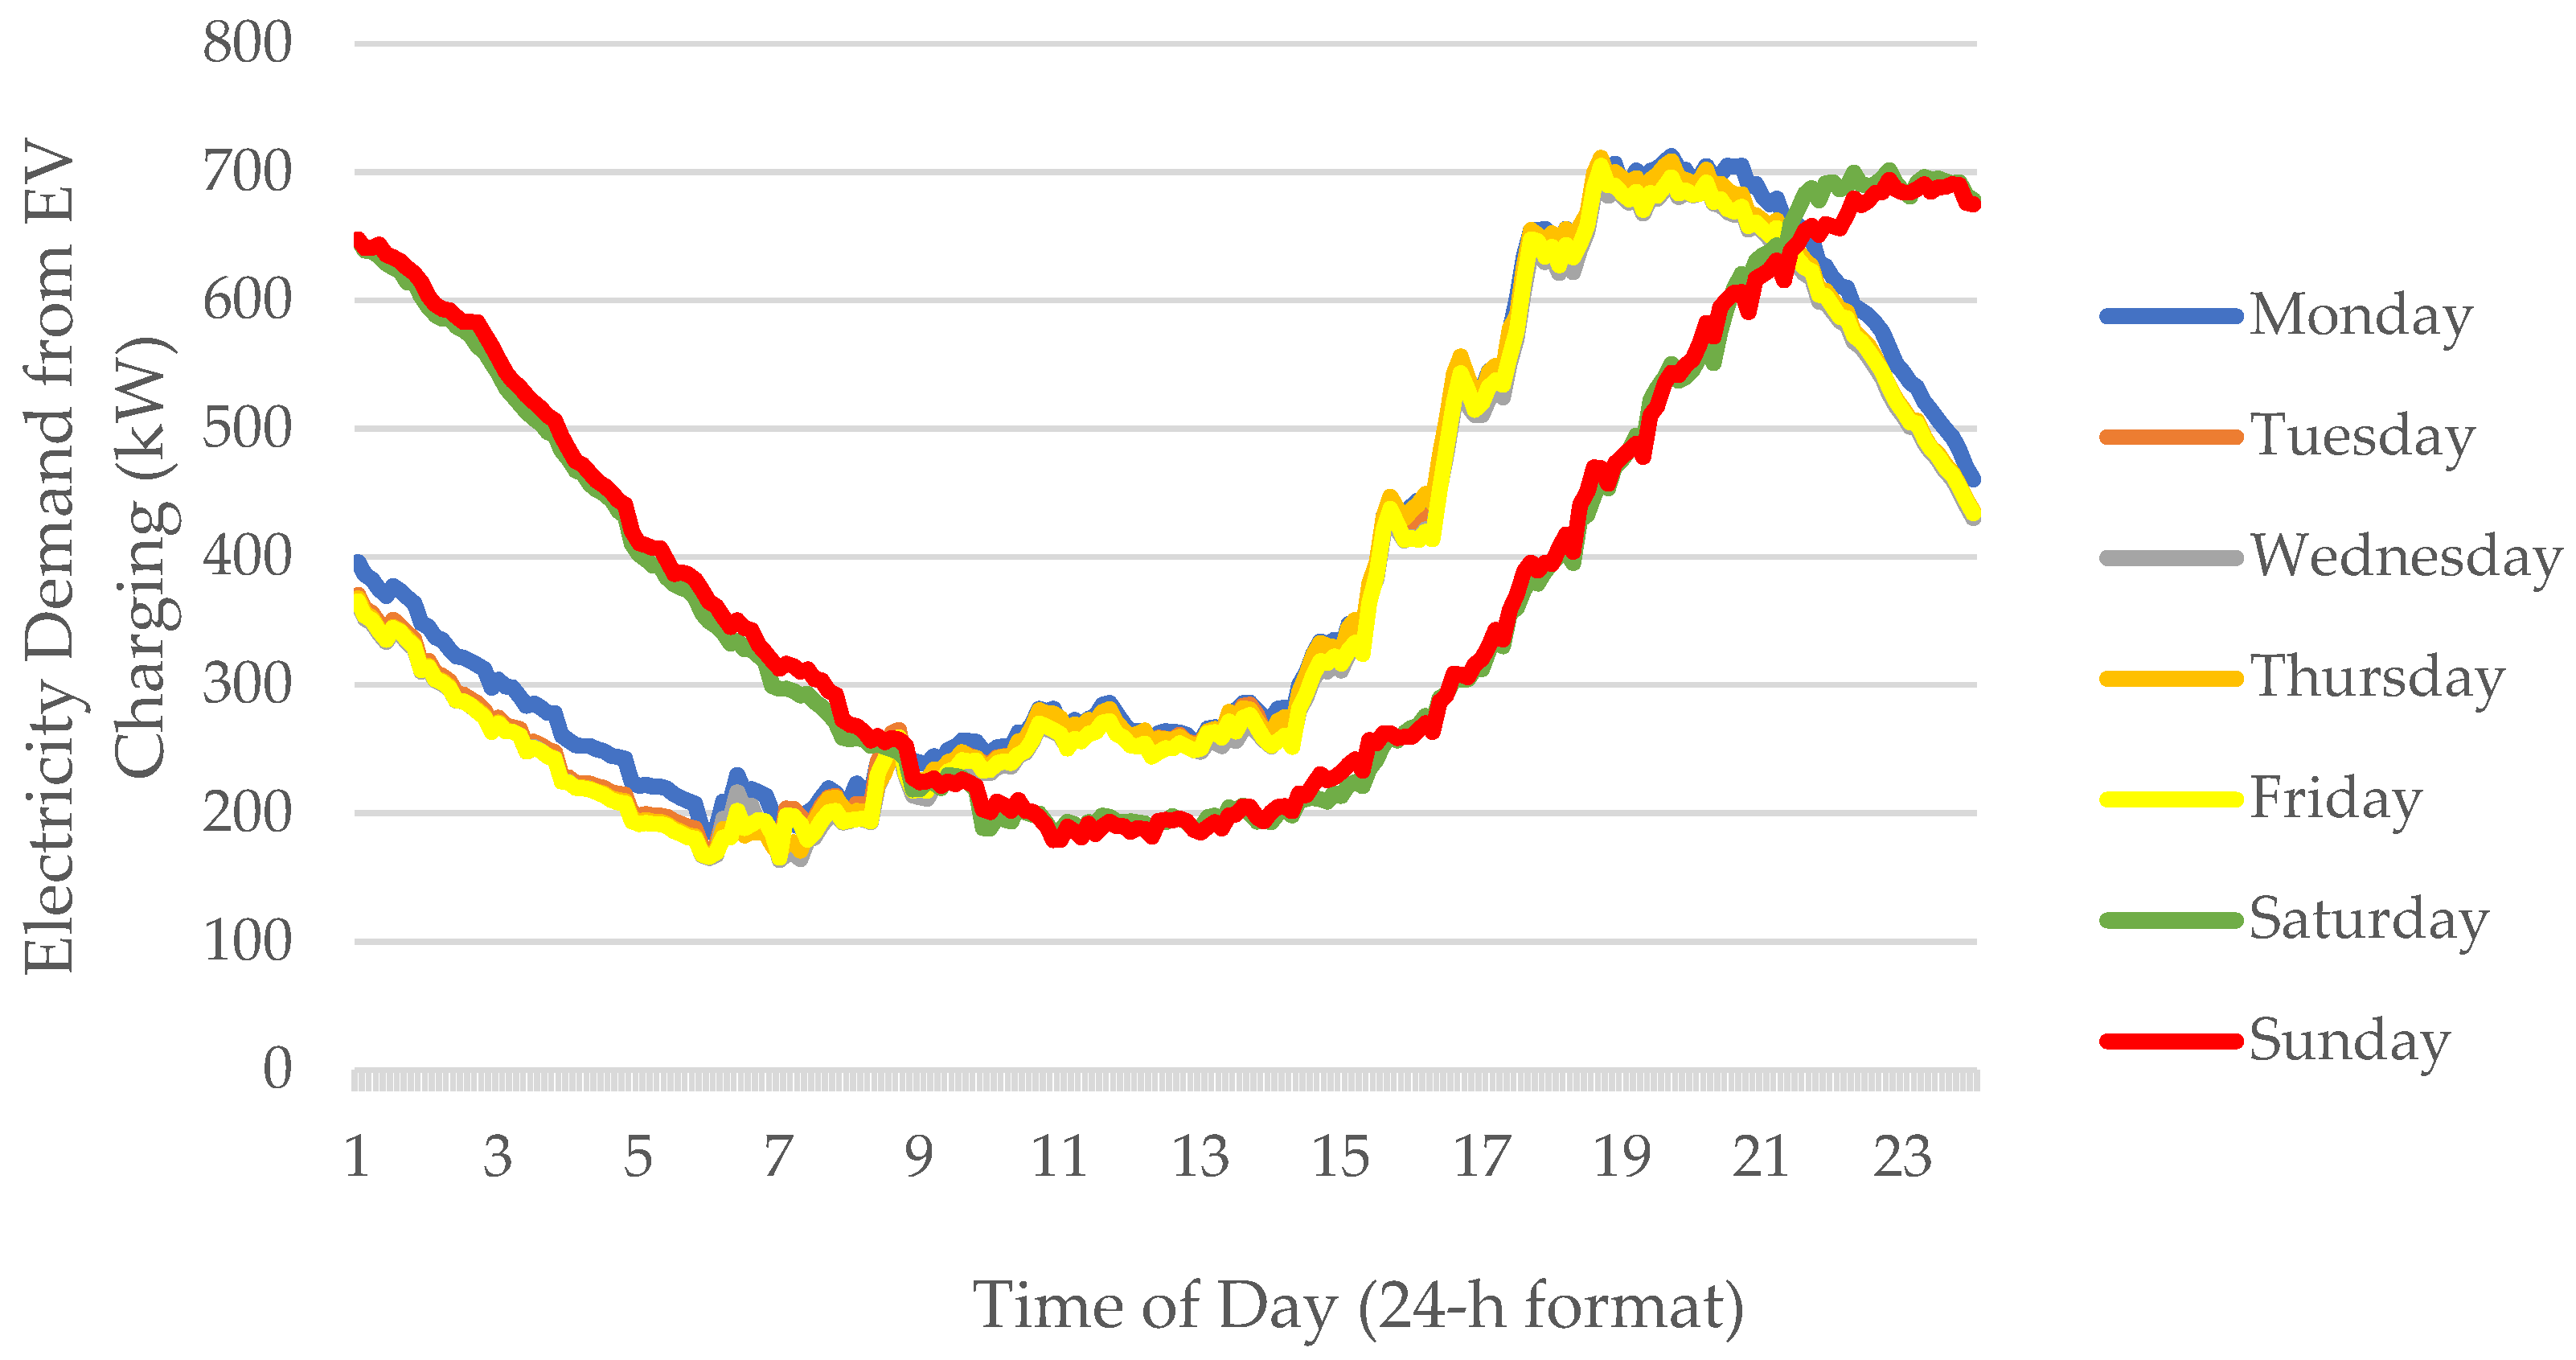
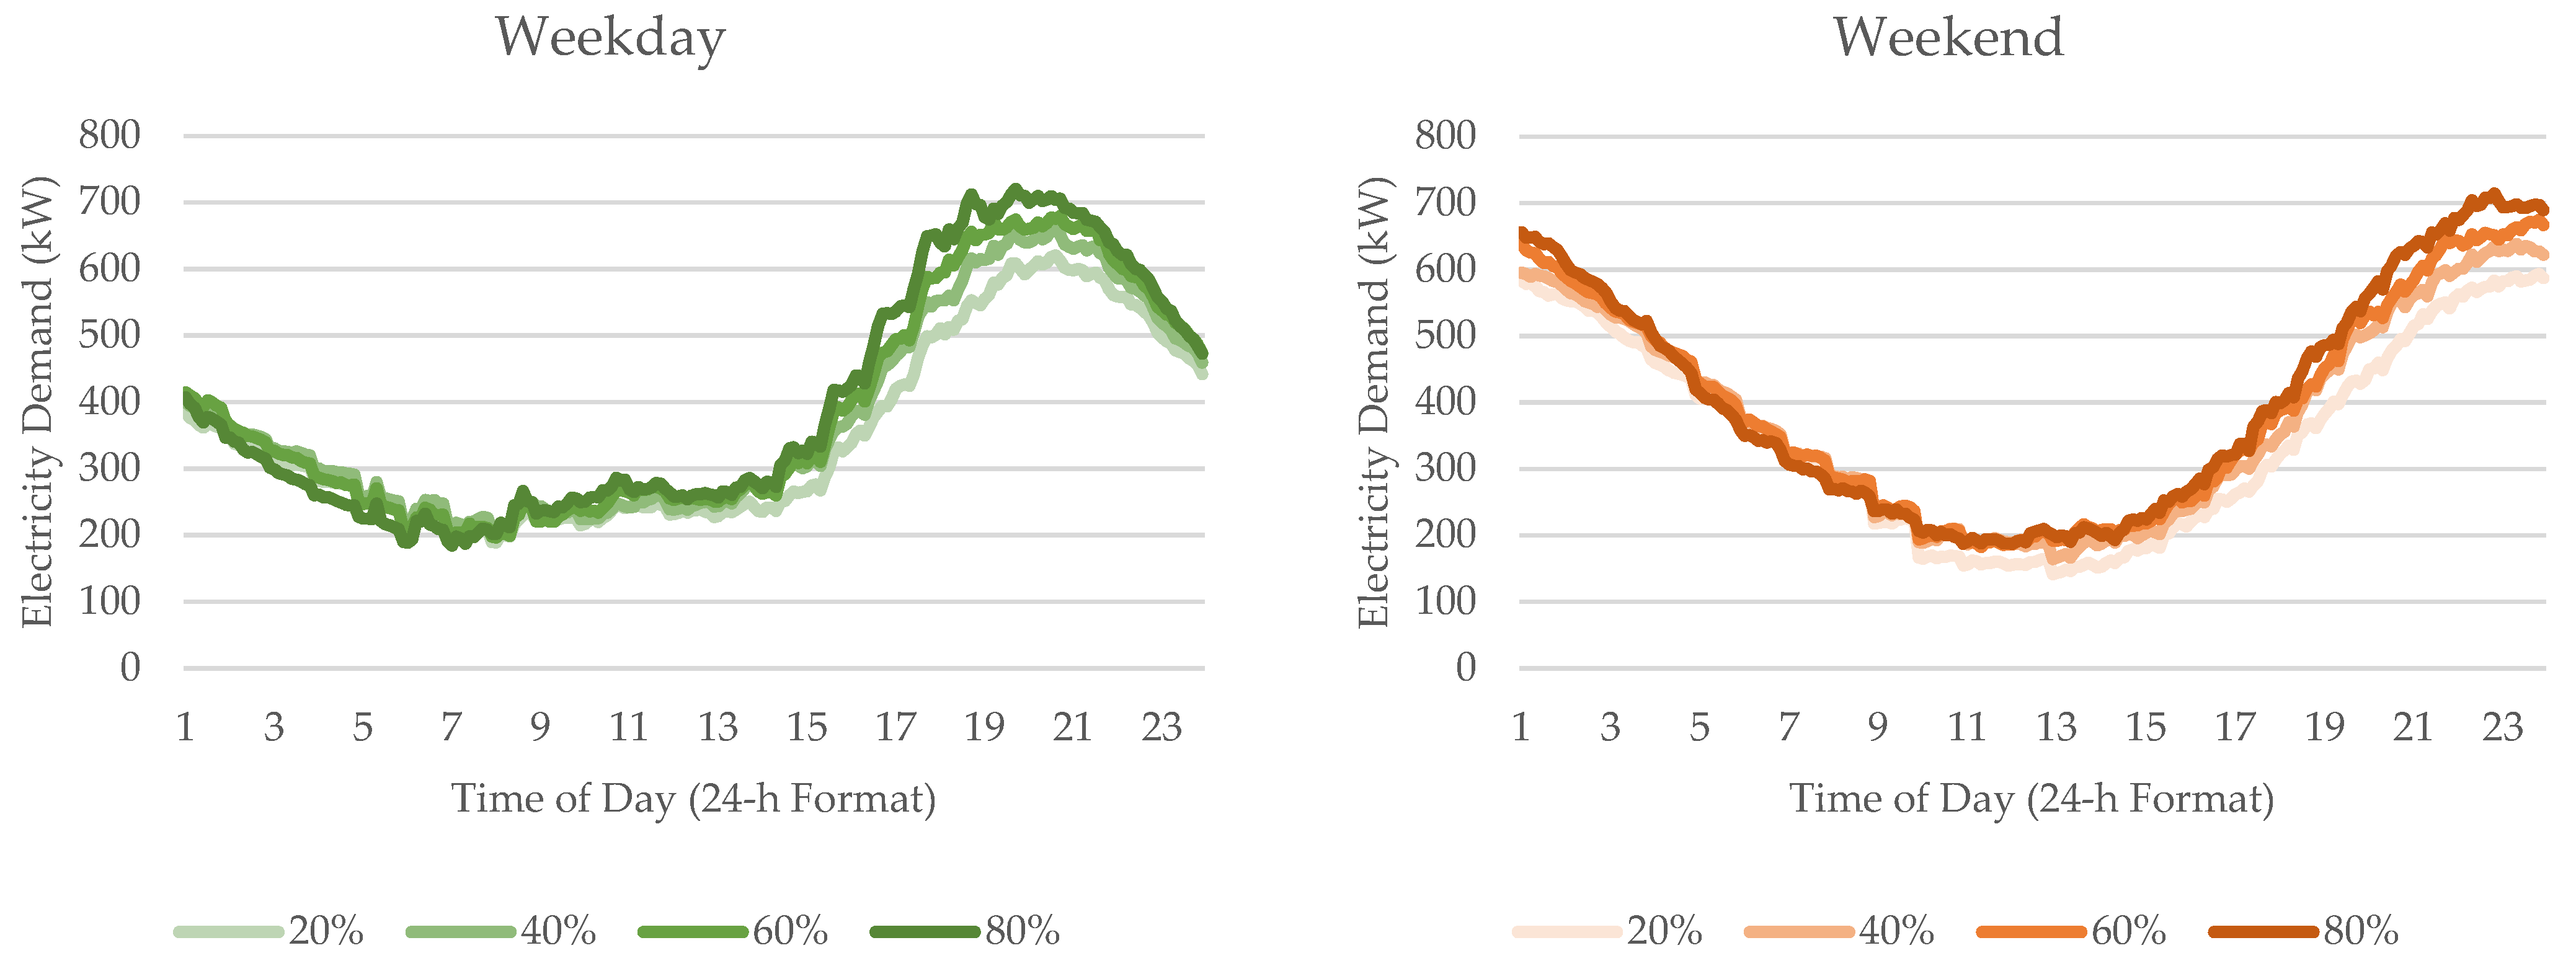
Figure 3 compares modeled daily hourly electricity demand from EV charging. For simplicity, all days simulated used the same charging threshold of 80% and EVSE availability of 20%. As previous studies have shown, there were no significant daily differences in charging demand, aside from the weekday–weekend comparison. Even if not all vehicles need to charge every day, it only creates minimal variations in the demand, which are easily evened out by a large population.
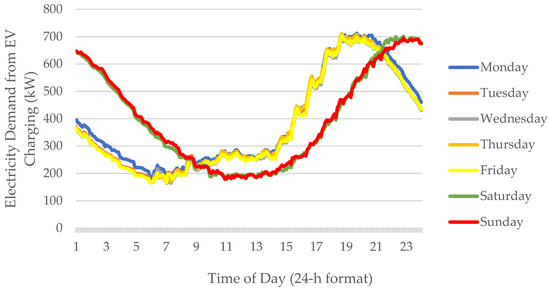
Figure 3.
Daily comparison of hourly EV charging demand.
In this simulation, the charging demand was at its highest at around 19:00 during weekdays, similar to the findings of [11,15], and at around 23:00 during weekends. During weekdays, 19:00 is the typical time when people arrive home from work. Upon arriving home, EV users start to charge their EVs. As most EV users prefer to charge at home at the same time, it could create serious grid issues if fast chargers are allowed to be used at home. Discouraging the use of fast chargers at home is reasonable since in the evening, EVs have at least 10 h to stay parked and get charged for the next day’s use.
There was a constant charging demand from 06:00 to 14:00 during weekdays. This was mainly due to the fact that the typical working schedule in the Philippines is within this time frame. This is the time when the lowest charging demand can be observed, which indicates a low charging activity. The charging demand started to increase at around 14:00.
During weekends, people leave the house later in the day, shifting the charging demand schedule by about 4 h. In addition, on the basis of the survey data, we found that weekend trips were approximately 13% farther than weekday trips. For example, the average distance for the first destination on weekdays was found to be only 18.5 km, while it was 21 km on weekends. This explains why the charging demand maintains a more consistently higher value from 00:00 to 08:00 on weekends. Moreover, the probability of having more than one destination was slightly higher during weekends according to the survey, explaining why people tend to go home and start charging later in the evening during weekends and the less-steeper slope from 14:00 to 23:00. Eventually, at 23:00, weekend charging arrived at the same peak as with the weekday demand.
4.2. Effect of Increasing Availability of EVSE
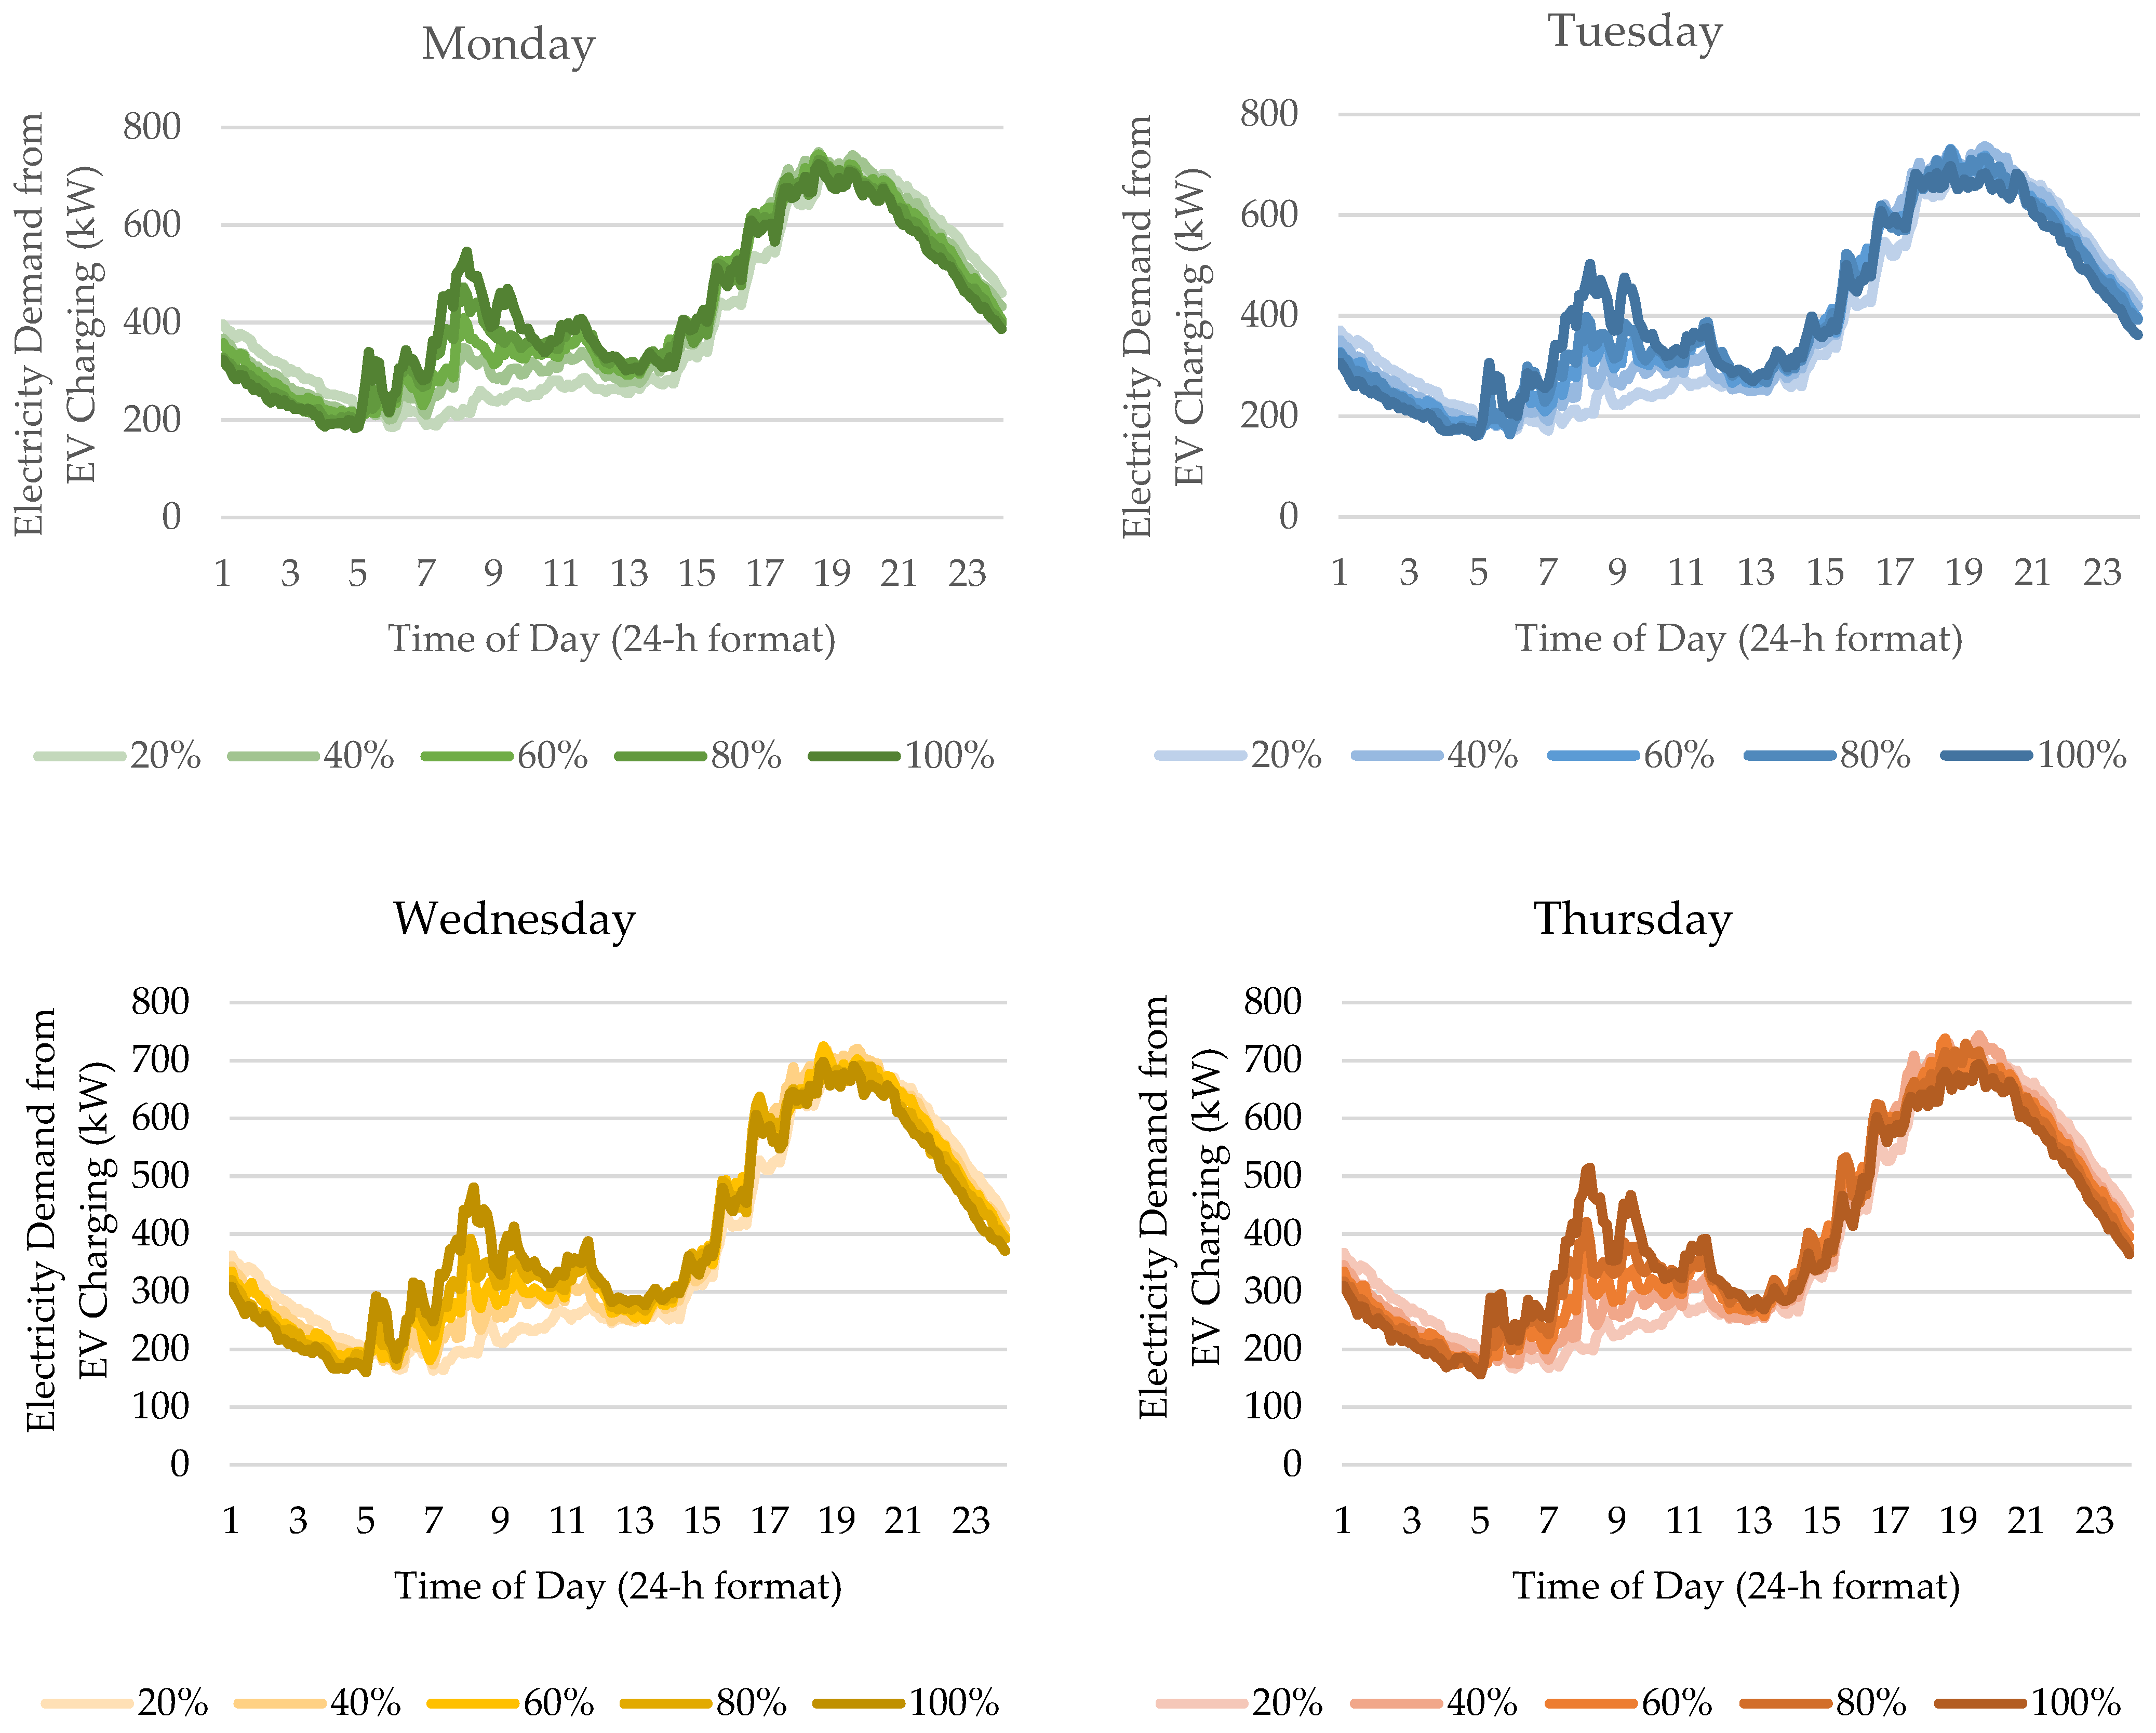
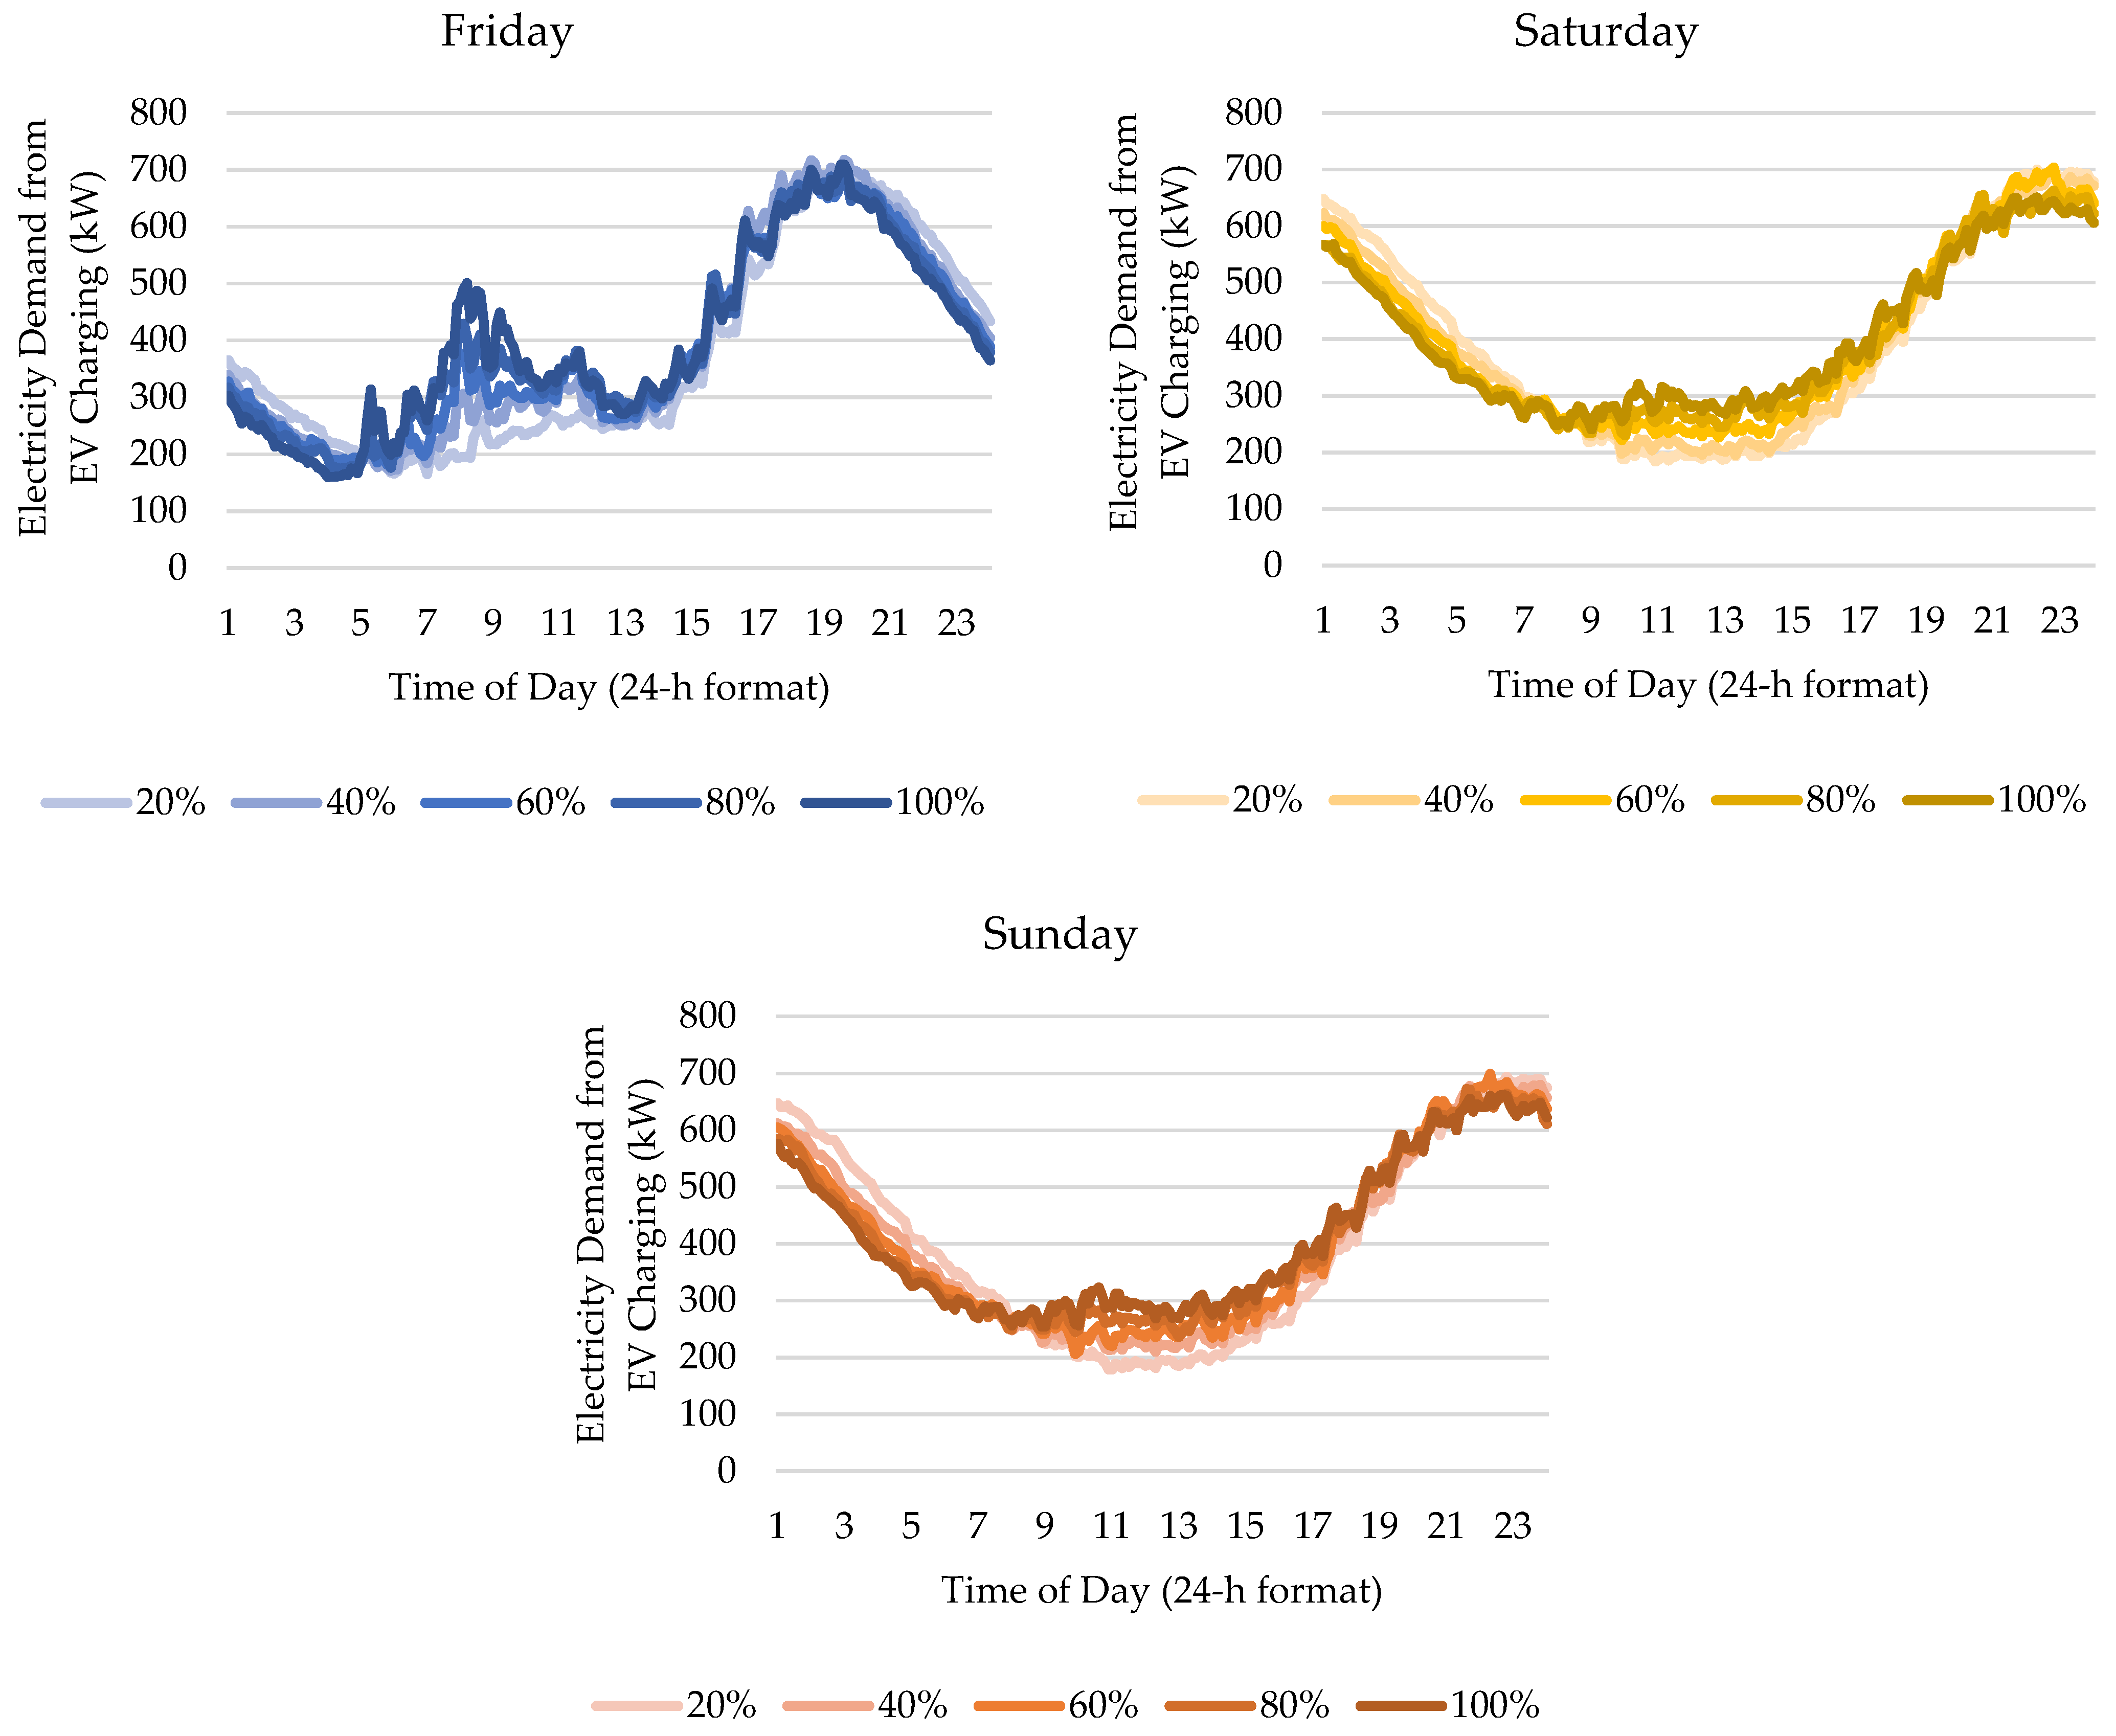
In this subsection, the availability of EVSEs outside homes was increased from 20% to 100% (i.e., all destinations can offer charging) while keeping the charging threshold of individuals at 80% (see Figure 4). In this simulation, chargers outside homes were expected to have a higher power rating. At work, 3 kW chargers were assumed to be installed, while they were 36 kW at other locations. Home charging was limited to 1.5 kW in this simulation.
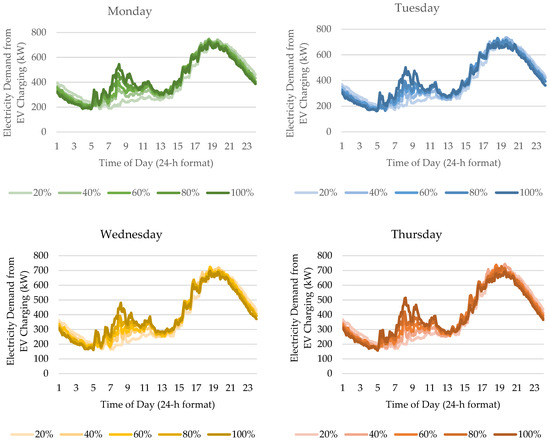
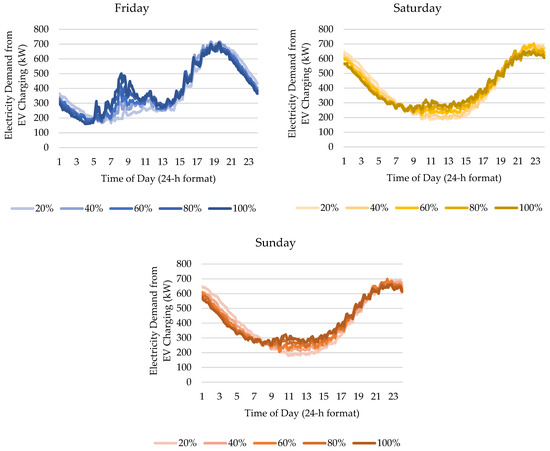
Figure 4.
Effect of increasing EVSEs outside homes. Darker curves refer to higher percentage availability.
Increasing the availability of EVSEs outside homes can reduce peak demand in the evening by up to 11% on some days. In Figure 3, this reduction is observed on five out of seven days, i.e., Tuesday, Wednesday, Thursday, Saturday, and Sunday. The reduction in peak demand was possibly due to some EVs no longer going below the charging threshold of their drivers upon reaching home. Since they were able to charge somewhere else before going home, it is possible that they still had more than 80% SOC upon reaching home, especially if the trip was short. If EV charging peak time coincides with the peak system demand, increasing the availability of EVSEs outside homes can be used as a strategy to lower the peak charging demand in the evening.
Correspondingly, installing more chargers outside homes increased charging demand during the day. This was found to be more pronounced on weekdays, where it was able to more than double the demand at around 08:00 in the morning. This is the time when everyone arrives at their first destination and starts to plug in their vehicles for charging. During weekends, this effect was less evident, since the time of arrivals at the first destinations were more variable.
4.3. Effect of Individual Users Charging Threshold
In this subsection, the behavior of EV users is considered. Decreasing the charging threshold of EV users can significantly reduce the peak demand in the evening (see Figure 5). Less frequent charging can reduce the peak demand by ≈14%. This was slightly more pronounced during weekends (≈17%).

Figure 5.
Effect of increasing varying charging thresholds of individuals. Darker curves refer to higher thresholds (i.e., more frequent charging).
Interestingly, controlling the charging frequency was more effective than increasing EVSE availability in reducing the peak demand. If EV users maximize the battery capacities of their EVs, they are able to postpone their charging to a later time, thus significantly reducing the number of concurrent users plugged into the grid. Promoting less frequent charging is doable for commute trips because of their predictability. Considering the battery capacity of BEVs and the average trip lengths in Metro Manila, one would only need to charge a BEV after approximately 20 trips. For PHEVs, this is different, as they would need to be charged after approximately 1.5 trips.
5. Conclusions
We present in this paper a novel approach to model electric vehicle charging demand using a methodology based on discrete event simulation. While it has a significant difference with the traditional discrete event simulation, including treating each entity as a separate system, the basic logic and procedure remain to be inspired by discrete event simulation. This modified approach enabled the authors to factor in differences in charging thresholds of EV drivers and the availability of EVSEs in any destination without requiring significant computational resources. This study demonstrated how DES can be used to produce agent-based types of studies by treating each EV user (i.e., decision-maker) as a separate system.
To the knowledge of the authors, this is the first time a significant difference between weekday and weekend charging has been documented in such a study. Previously published simulations only showed a decreased peak during weekends and not a significant change in charging demand schedule. This study shows that the differences in the characteristics of weekday and weekend trips can shift the charging schedule by 4 h.
The study also provides interesting insights regarding the increasing availability of EVSEs outside homes—how it can potentially affect the grid and the EV users’ charging behavior. Interestingly, a behavioral solution, i.e., reducing the frequency of charging, is more effective than increasing EVSEs in reducing the charging peak demand in the evening. Requiring EV users to utilize their battery capacities before charging (i.e., draining the battery down to 20% SOC before plugging into the grid) can reduce evening charging peak demand by 14–17%. On the other hand, increasing EVSEs can only reduce evening peak demand by up to 11%. More scrutiny and analysis of human behavioral effects on electric vehicle charging demand (e.g., psychological effects of mileage anxiety to aggregated charging demand) should be made by researchers in the near future to validate this finding.
While the authors agree that a good number of EV charging infrastructure needs to be made available to address range anxiety, it should not be a major limiting factor for the deployment of EVs since the majority of charging would still occur at home, as shown on this simulation.
On the basis of the results, potential implications to policies on EV charging are below:
- ○
- Encourage home charging. With home charging, the power extraction can be stretched over a longer period of time, therefore not significantly increasing the peak demand. This is important when the EV charging peak time coincides with that of the existing system demand. Fortunately, the system peak demand in the Philippines is around 14:00 in the afternoon, unlike in other countries where the peak is in the evening. As shown on the simulations, increasing EVSE availability outside homes from 20% to 100% can more than double the charging demand in the morning from 200 kW to 500 kW (for 1000 modeled EVs).
- ○
- Discourage purchase of fast chargers for home use. As the power draw of fast chargers are rated up to 30 times higher than standard home chargers, allowing its use in homes can cause serious challenges to the existing grid during evenings. The use of fast chargers should be limited to locations outside homes to reduce the possibility of simultaneous mass usage. For context, typical home chargers are rated 1.5 kW, while common fast chargers at least 36 kW. With just home charging, the peak in the evening for just 1000 EVs is already around 700 kW, meaning, it would be extremely dangerous to the grid if everyone charging their vehicles at home would use a fast-charger.
- ○
- Lack of EVSEs outside homes should not hold back diffusion of EVs. While it is important for such infrastructure to also be included in the roadmap, the lack of it should not hold back policymakers from supporting the diffusion of EVs. Previous studies, including this one, have shown that home charging is effective and practical.
- ○
- EVSEs could be more significant for leisure and holiday trips. Studies, including this one, support the compatibility of EVs for use on daily commutes. Due to the predictability and relatively manageable distances of commute trips, home charging is very practical. However, for irregular trips, such as leisure and holiday trips, the presence of EVSEs outside homes can be a significant factor. This is important to be considered since it can influence the eventual decision of a household to purchase an electric vehicle.
In future works, the effect of varying charging thresholds of EV users can be explored further in order to understand how it interacts with other factors. Other interesting extensions of this study include the consideration of various battery types and the modeling of EV charging pricing. EVSE queueing is also another potential extension of this paper. The authors also recommend performing a more detailed trip survey that will capture long weekend/holiday trips, as well as differences among weekdays.
Author Contributions
Conceptualization, N.S.L. and J.B.M.B.; methodology, N.S.L.; software, N.S.L. and A.A.; formal analysis, N.S.L. and A.A.; writing—original draft preparation, N.S.L. and A.A.; writing—review and editing, J.B.M.B.; visualization, A.A.; project administration, J.B.M.B.; funding acquisition, J.B.M.B. All authors have read and agreed to the published version of the manuscript.
Funding
This research was funded by Mitsubishi Motors Corporation and sponsored by the Department of Trade and Industry, the Philippines. The APC was funded by the Office of the Vice Chancellor for Research and Innovation of De La Salle University, Manila, the Philippines.
Institutional Review Board Statement
Not applicable.
Informed Consent Statement
Not applicable.
Data Availability Statement
The data presented in this study are available in Figure 1.
Acknowledgments
The authors would like to acknowledge the contributions of all members of the Electric Vehicle Policy Analysis project sponsored by the Department of Trade and Industry, the Philippines, of which this study is a part of.
Conflicts of Interest
The authors declare no conflict of interest.
References
- Cuddy, M.R.; Wipke, K.B. Analysis of the Fuel Economy Benefit of Drivetrain Hybridization; National Renewable Energy Laboratory: Golden, CO, USA, 1997.
- IEA. Global EV Outlook 2018: Towards Cross-Modal Electrification; IEA: Paris, France, 2018. [Google Scholar]
- Crabtree, G. The coming electric vehicle transformation. Science 2019, 366, 422–424. [Google Scholar] [CrossRef] [Green Version]
- Leggett, T. Jaguar Car Brand to Be All-Electric by 2025. BBC News, 15 February 2021. Available online: https://www.bbc.com/news/business-56072019(accessed on 29 March 2021).
- Zero-Emission Vehicle Program | California Air Resources Board. Available online: https://ww2.arb.ca.gov/our-work/programs/zero-emission-vehicle-program/about (accessed on 18 February 2021).
- Harper, J. Chinese £3,200 budget electric car takes on Tesla. BBC News, 25 February 2021. Available online: https://www.bbc.com/news/business-56178802(accessed on 29 March 2021).
- Macioszek, E. Electric Vehicles—Problems and Issues. In Proceedings of the 2019 Transport Systems Theory and Practice Conference, Katowice, Poland, 16–18 September 2019. [Google Scholar]
- Madhusudhanan, A.K.; Na, X.; Cebon, D. A computationally efficient framework for modelling energy consumption of ICE and electric vehicles. Energies 2021, 14, 2031. [Google Scholar] [CrossRef]
- Darabi, Z.; Ferdowsi, M. An event-based simulation framework to examine the response of power grid to the charging demand of plug-in hybrid electric vehicles. IEEE Trans. Ind. Inform. 2014, 10, 313–322. [Google Scholar] [CrossRef]
- Eirgrid. System Demand. Available online: http://www.eirgrid.com/operations/systemperformancedata/systemdemand/ (accessed on 10 March 2021).
- Tiantian, Q. Calculation of electric vehicle charging power based on spatial-temporal activity model. In Proceedings of the China International Conference on Electricity Distribution, CICED, Tianjin, China, 17–19 September 2018; pp. 2884–2888. [Google Scholar]
- Camus, C.; Silva, C.M.; Farias, T.L.; Esteves, J. Impact of Plug-in hybrid electric vehicles in the Portuguese electric utility system. In Proceedings of the IEEE International Conference on Power Engineering, Energy and Electrical Drives, Lisbon, Portugal, 18–20 March 2009. [Google Scholar]
- Schey, S.; Scoffield, D.; Smart, J. A First Look at the Impact of Electric Vehicle Charging on the Electric Grid in the EV Project. World Electr. Veh. J. 2012, 5, 667–678. [Google Scholar] [CrossRef] [Green Version]
- Morrissey, P.; Weldon, P.; O’Mahony, M. Future standard and fast charging infrastructure planning: An analysis of electric vehicle charging behaviour. Energy Policy 2016, 89, 257–279. [Google Scholar] [CrossRef]
- Brady, J.; O’Mahony, M. Modelling charging profiles of electric vehicles based on real-world electric vehicle charging data. Sustain. Cities Soc. 2016, 26, 203–216. [Google Scholar] [CrossRef]
- Lee, J.H.; Chakraborty, D.; Hardman, S.J.; Tal, G. Exploring electric vehicle patterns: Mixed usage of charging infrastructure. Transp. Res. Part D Transp. Environ. 2020, 79, 102249. [Google Scholar] [CrossRef]
- Mallig, N.; Heilig, M.; Weiss, C.; Chlond, B.; Vortisch, P. Modelling the weekly electricity demand caused by electric cars. Future Gener. Comput. Syst. 2016, 64, 140–150. [Google Scholar] [CrossRef]
- Moon, H.; Park, S.Y.; Jeong, C.; Lee, J. Forecasting electricity demand of electric vehicles by analyzing consumers’ charging patterns. Transp. Res. Part D Transp. Environ. 2018, 62, 64–79. [Google Scholar] [CrossRef]
- Markel, T.; Bennion, K.; Kramer, W.; Byran, J.; Giedd, J. Field Testing Plug-in Hybrid Electric Vehicles with Charge Control Technology in the Xcel Energy Territory, Technical Report NREL/TP-550-46345; National Renewable Energy Laboratory: Golden, CO, USA, 2009.
- Huang, S.; Infield, D. The impact of domestic plug-in hybrid electric vehicles on power distribution system loads. In Proceedings of the 2010 International Conference on Power System Technology, Hangzhou, China, 24–28 October 2010. [Google Scholar]
- Harris, C.B.; Webber, M.W. An empirically-validated methodology to simulate electricity demand for electric vehicle charging. Appl. Energy 2014, 126, 172–181. [Google Scholar] [CrossRef]
- Kelly, L.; Rowe, A.; Wild, P. Analyzing the impacts of plug-in electric vehicles on distribution networks in British Columbia. In Proceedings of the 2009 IEEE Electrical Power & Energy Conference, Montreal, QC, Canada, 22–23 October 2009. [Google Scholar]
- Paevere, P.; Higgins, A.; Ren, Z.; Horn, M.; Grozev, G.; McNamara, C. Spatio-temporal modelling of electric vehicle charging demand and impacts on peak household electrical load. Sustain. Sci. 2013, 9, 61–76. [Google Scholar] [CrossRef]
- Arias, M.B.; Bae, S. Electric vehicle charging demand forecasting model based on big data technologies. Appl. Energy 2016, 183, 327–339. [Google Scholar] [CrossRef]
- Arias, M.B.; Bae, S. Prediction of electric vehicle charging-power demand in realistic urban traffic networks. Appl. Energy 2017, 195, 738–753. [Google Scholar] [CrossRef]
- Bae, S.; Kwasinski, A. Spatial and temporal model of electric vehicle charging demand. IEEE Trans. Smart Grid 2012, 3, 394–403. [Google Scholar] [CrossRef]
- Foley, A.; Tyther, B.; Calnan, P.; Ó Gallachóir, B. Impacts of Electric Vehicle charging under electricity market operations. Appl. Energy 2013, 101, 93–102. [Google Scholar] [CrossRef]
- Hu, S.; Chen, P.; Xin, F.; Xie, C. Exploring the effect of battery capacity on electric vehicle sharing programs using a simulation approach. Transp. Res. Part D Transp. Environ. 2019, 77, 164–177. [Google Scholar] [CrossRef]
- Lebeau, P.; Macharis, C.; Van Mierlo, J.; Maes, G. Implementing electric vehicles in urban distribution: A discrete event simulation. World Electr. Veh. J. 2013, 6, 38–47. [Google Scholar] [CrossRef] [Green Version]
- Hutterer, S.; Affenzeller, M.; Auinger, F. Heuristic Power Scheduling of Electric Vehicle Battery Charging Based on Discrete Event Simulation. Comput. Vis. 2012, 6927, 311–318. [Google Scholar]
- Jefferies, D.; Gohlich, D. A comprehensive TCO evaluation method for electric bus systems on Discrete-Event Simulation including bus scheduling and charging infrastructure optimisation. World Electr. Veh. J. 2020, 11, 56. [Google Scholar] [CrossRef]
- Khosrojerdi, A.; Xiao, M.; Sarikprueck, P.; Allen, J.K.; Mistree, F. Designing a system of plug-in hybrid electric vehicle charging stations. In Proceedings of the ASME 2013 International Design Engineering Technical Conferences and Computers and Information in Engineering Conference 2014, Portland, OR, USA, 4–7 August 2013. [Google Scholar]
- Sebastiani, M.T.; Luders, R.; Fonseca, K.V.O. Allocation of charging stations in an electric vehicle network using simulation optimization. In Proceedings of the Winter Simulation Conference 2014, Savannah, GA, USA, 7–10 December 2014; pp. 1073–1083. [Google Scholar]
- Maizi, Y.; Zhu, E.C.; Wu, T.; Zhou, J. A reliable deployment strategy for public electric vheicle charging stations: A discrete event simulation model for power grid and traffic networks. In Proceedings of the 2019 Winter Simulation Conference, Nationa Harbor, MD, USA, 8–11 December 2019. [Google Scholar]
- Pruckner, M.; German, R.; Eckhoff, D. Spatial and temporal charging infrastructure planning using discrete event simulation. In Proceedings of the 2017 ACM SIGSIM Conference on Principles of Advanced Discrete Simulation, Singapore, 24–26 May 2017; pp. 249–257. [Google Scholar]
- Ferro, G.; Laureri, F.; Minciardi, R.; Robba, M. A predictive discrete event approach for the optimal charging of electric vehicles in microgrids. Control Eng. Pract. 2019, 86, 11–23. [Google Scholar] [CrossRef]
- Biona, J.B.M.; Manuel, M. Philippine Electric Vehicle Policy Analysis Report; Mitsubishi Motors Corporation: Santa Rosa, Laguna, Philippines, 2019. [Google Scholar]
- Argonne National Laboratory. Alternative Fuel Life-Cycle Environ-mental and Economic Transportation (AFLEET) Tool. 2016. Available online: https://greet.es.anl.gov/afleet (accessed on 12 February 2021).
- Lopez, N.S.; Soliman, J.; Biona, J.B.M.; Fulton, L. Cost-benefit analysis of alternative vehicles in the Philippines using immediate and distant future scenarios. Transp. Res. Part D 2020, 82, 102308. [Google Scholar] [CrossRef]
- Mélard, G. On the accuracy of statistical procedures in Microsoft Excel 2010. Comput. Stat. 2014, 29, 1095–1128. [Google Scholar] [CrossRef] [Green Version]
Publisher’s Note: MDPI stays neutral with regard to jurisdictional claims in published maps and institutional affiliations. |
© 2021 by the authors. Licensee MDPI, Basel, Switzerland. This article is an open access article distributed under the terms and conditions of the Creative Commons Attribution (CC BY) license (https://creativecommons.org/licenses/by/4.0/).

