
Zero-Emission Pathway for the Global Chemical and Petrochemical Sector


Abstract
:1. Introduction
- How can zero emissions be achieved, considering the full product life cycle?
- What is the potential contribution of renewables-based solutions?
2. Review of Literature on Decarbonisation of the Chemical and Petrochemical Sector
3. Materials and Methods: Prioritisation of Technology Options for Decarbonisation
- -
- improve energy efficiency in the production process by adopting best practices and breakthroughs, including substituting fossil fuels with direct renewable energy resources, electrification and other renewables for process heat generation (A)
- -
- a switch to biomass and synthetic feedstocks based on renewable “green” hydrogen and CO2 (B)
- -
- a shift to circular economy to reduce primary materials demand by increasing reuse and recycling of plastics and by reducing per capita plastics and chemicals demand through changing consumer behavior and substitution with other materials (C)
- -
- decarbonising production processes and waste handling by CCS (D)
- -
- shifting power supply to carbon-free electricity, notably renewables (E)

| Technology Option | Application | Rationale/Explanation and Key References Used to Estimate the Fossil Fuel Substitution Potentials | Cost | Unit | References for Costs |
|---|---|---|---|---|---|
| (A) Energy efficiency, renewable energy and process heat electrification | |||||
| Best practice technologies (1) | Improving energy efficiency to reduce process heat demand | Global energy saving potential of best practice technologies that are currently available in the market [8] would result in a continuation of the current average energy efficiency trends of 0.5%/yr if they are implemented in all production processes by 2050 [45]. 1 The rate of improvement is average over the period to 2050, and does not necessarily follow a linear path. | 20–60 | USD/t CO2 in 2030 | [46] |
| Breakthroughs and heat integration (1) | New technology options and cross-cutting technologies such as advanced membranes to reduce process heat demand by 2050 [47] would double the improvements to 1%/yr. 2 While pinch analysis for heat integration shows 50% and 30% savings for hot and cold utilities, respectively [48], actual potential could still be lower, since efficiency is typically assessed at site level where a high level of steam system integration reduces potential. | Up to 200 | USD/t CO2 in 2050 | [47] | |
| Solar process heat (2) | Fuel switching | Solar process heating systems can replace fossil fuels for process heat generation [49,50]. 3 | 0–100 | USD/t CO2 in 2030 | [49] |
| Biomass for process heat (4) | Biofuels produced from various biomass feedstocks can replace fossil fuels for process heat generation by 2030/50 [6]. 4 | 0–75 | USD/t CO2 in 2030 | [6] | |
| Electrification of process heating combined with renewables (5) | Synthetic naphtha produced from renewable hydrogen can replace crude oil-based naphtha for HVC production [51]. 14 | −60–450 | USD/t CO2 in 2050 | [52] | |
| Heat pumps can replace fossil fuels to supply low-temperature process heat [49,50,53,54]. 5 | 0–50 | USD/t CO2 in 2030 | [49] | ||
| (B) Switching from fossil fuel-based feedstocks to biomass and synthetic feedstocks | |||||
| Biomass for plastics (9) | Feedstock switching | Biomass can replace fossil fuels used as feedstock for plastics production [6]. 9 | 0–500 | USD/t CO2 in 2009 | [6] |
| Biomass for ammonia (10,19) | Feedstock switching | Biomass can replace fossil fuels used as feedstock for ammonia production [55]. 10 | 250–400 | USD/t CO2 | [22,56,57] |
| Biomass for methanol (10,19) | Feedstock switching | Biomass can replace fossil fuels used as feedstock for methanol production, either through gasification to methanol or by using biomethane in the traditional production route [58]. 11 | −150–450 | USD/t CO2 | [37,56,57,59,60] |
| Renewable-hydrogen for ammonia (11,20) | Feedstock switching | Renewable hydrogen can replace fossil fuels used as feedstock for ammonia production [22]. 12 | 0–150 | USD/t CO2 | [37,60,61] |
| Renewable-hydrogen for methanol (11,20) | Feedstock switching | Renewable hydrogen can replace fossil fuels used as feedstock for methanol production [58]. 13 | −50–200 | USD/t CO2 | [37,58,60] |
| Methanol for olefins (13) | Feedstock switching | Renewable hydrogen-based methanol can be used for olefins production, thereby reducing the need of fossil fuels feedstocks [58]. 14 | 50–300 | USD/t CO2 | [37] |
| Synthetic fuels (naphtha) (12) | Feedstock switching | Synthetic naphtha produced from renewable hydrogen can replace crude oil-based naphtha for HVC production [51]. 15 | −60–450 | USD/t CO2 in 2050 | [52] |
| CO2 (14) | Feedstock switching | Electrocatalytic CO2 production can replace fossil fuels used as feedstock in ethylene production. 16 | −30–80 | USD/t CO2 in 2050 | [15] |
| (C) Circular economy concepts | |||||
| Demand reduction/Reuse (18) | Demand reduction | Plastics demand is reduced from high end of plastics production projections (3%/yr) to the average of the range found in literature (2%/yr). Reuse of plastics has been assessed as part of this demand reduction strategy. | N/A | N/A | - |
| Mechanical recycling (6) | End of life | Global mechanical recycling rate is assumed to grow around two-fold by 2030 [42] and triple by 2050. 6 | −140–200 | USD/t CO2 in 2015 | [62,63,64,65] |
| Chemical recycling (7) | End of life | Chemical recycling rate is assumed to be commercialized and reach the level of mechanical recycling by 2050 [42,66]. 7 | 80–500 | USD/t CO2 in 2015 | [20,65,66,67] and industry sources |
| Incineration with highly efficient energy recovery (8) | End of life | All remaining post-consumer plastic waste is assumed to be incinerated with high efficiency combined with CCS [43]. 8 | −200–−50 | USD/t CO2 in 2020 | Own estimate |
| (D) CCS | |||||
| Capture and storage (15) | Process emissions | All high-purity process CO2 emissions can be captured by 2050. Three-quarters of all emissions from fuel combustion are assumed to be captured. It is assumed that a shift to energy recovery is meaningful from a climate perspective if only coupled with CCS. Biomass use is primarily for cogeneration of heat and power and all processes are assumed to be coupled with CCS. 17 | 0–50 | USD/t CO2 in 2040 | [20,60,68,69] |
| Capture and storage (16) | Emissions fossil fuel combustion from energy recovery | 50–150 | USD/t CO2 | ||
| Capture and storage with biomass (3) | Emissions from biomass-based heat generation | 150–200 | USD/t CO2 | [70,71] | |
| (E) Carbon-free electricity supply (17) | |||||
4. Transformation Scenario for the Chemical and Petrochemical Sector
4.1. Commodity and Technology Characteristics
| 2017 | 2050 PES | 2050 1.5 °C | |||||||
|---|---|---|---|---|---|---|---|---|---|
| Production | Process Energy | Feedstock Use | Production | Process Energy 2 | Feedstock Use | Production | Process Energy | Feedstock Use | |
| (Mt/year) | (GJ/t) | (GJ/t) | (Mt/year) | (GJ/t) | (GJ/t) | (Mt/year) | (GJ/t) | (GJ/t) | |
| Conventional routes 1 | |||||||||
| Ethylene (steam cracking) | 135 | 16.3 | 45.0 | 379 | 13.9 | 45.0 | 80 | 12.6 | 45.0 |
| Propylene (steam cracking) | 50 | 16.3 | 45.0 | 135 | 13.9 | 45.0 | 27 | 12.6 | 45.0 |
| Propylene (fluid catalytic cracking) | 21 | 3.2 | 45.0 | 58 | 2.7 | 45.0 | 22 | 2.5 | 45.0 |
| Benzene (steam cracking) | 17 | 16.3 | - | 48 | 13.9 | - | 15 | 12.6 | - |
| Benzene (naphtha extraction) | 44 | 3.2 | 40.1 | 120 | 2.7 | 40.1 | 51 | 2.5 | 40.1 |
| Toluene | 26 | 3.2 | 20.3 | 75 | 2.7 | 20.3 | 36 | 2.5 | 20.3 |
| Xylene | 47 | 3.2 | 41.0 | 140 | 2.7 | 41.0 | 68 | 2.5 | 41.0 |
| Butadiene (steam cracking) | 16 | 16.3 | - | 44 | 13.9 | - | 14 | 12.6 | - |
| Butadiene (C4 separation) | 16 | 7.3 | 44.6 | 44 | 6.2 | 44.6 | 21 | 5.6 | 44.6 |
| Butylene | 30 | 3.2 | 45.0 | 84 | 2.7 | 45.0 | 41 | 2.5 | 45.0 |
| Carbon black | 15 | 9.0 | 32.8 | 38 | 7.7 | 32.8 | - | - | - |
| Ammonia | 172 | 15.0 | 20.7 | 440 | 12.8 | 20.7 | 106 | 11.6 | 20.7 |
| Methanol | 86 | 10.0 | 20.0 | 174 | 8.5 | 20.0 | 50 | 7.8 | 20.0 |
| Alternative routes | |||||||||
| Plastics from biomass (excluding bio-ethylene) 3 | - | - | - | - | - | - | 73 | 28.3 | 45.0 |
| Synthetic organic materials from biomass 3 | - | - | - | - | - | - | 52 | 23.3 | 45.0 |
| Ethylene from biomass 4 | - | - | - | - | - | - | 7 | 61.0 | 45.0 |
| Ethylene from green hydrogen and captured CO2 6 | - | - | - | - | - | - | 14 | 10.6 | 45.0 |
| Methanol to olefins 5 | - | - | - | - | - | - | 62 | 5.0 | - |
| Steam cracking with synthetic naphtha (ethylene + propylene) 7 | - | - | - | - | - | - | 65 | 42.2 | 45.0 |
| Steam cracking with synthetic naphtha (benzene + butadiene) 7 | - | - | - | - | - | - | 12 | 24.6 | - |
| Ammonia from green hydrogen 8 | - | - | - | - | - | - | 330 | 5.8 | 20.7 |
| Ammonia from biomass 9 | - | - | - | - | - | - | 162 | 19.1 | 20.7 |
| Methanol from green hydrogen 10 | - | - | - | - | - | - | 117 | 11.1 | 20.0 |
| Methanol from green hydrogen for olefins 10 | 177 | 11.1 | 20.0 | ||||||
| Methanol from biomass 11 | - | - | - | - | - | - | 57 | 36.7 | 20.0 |
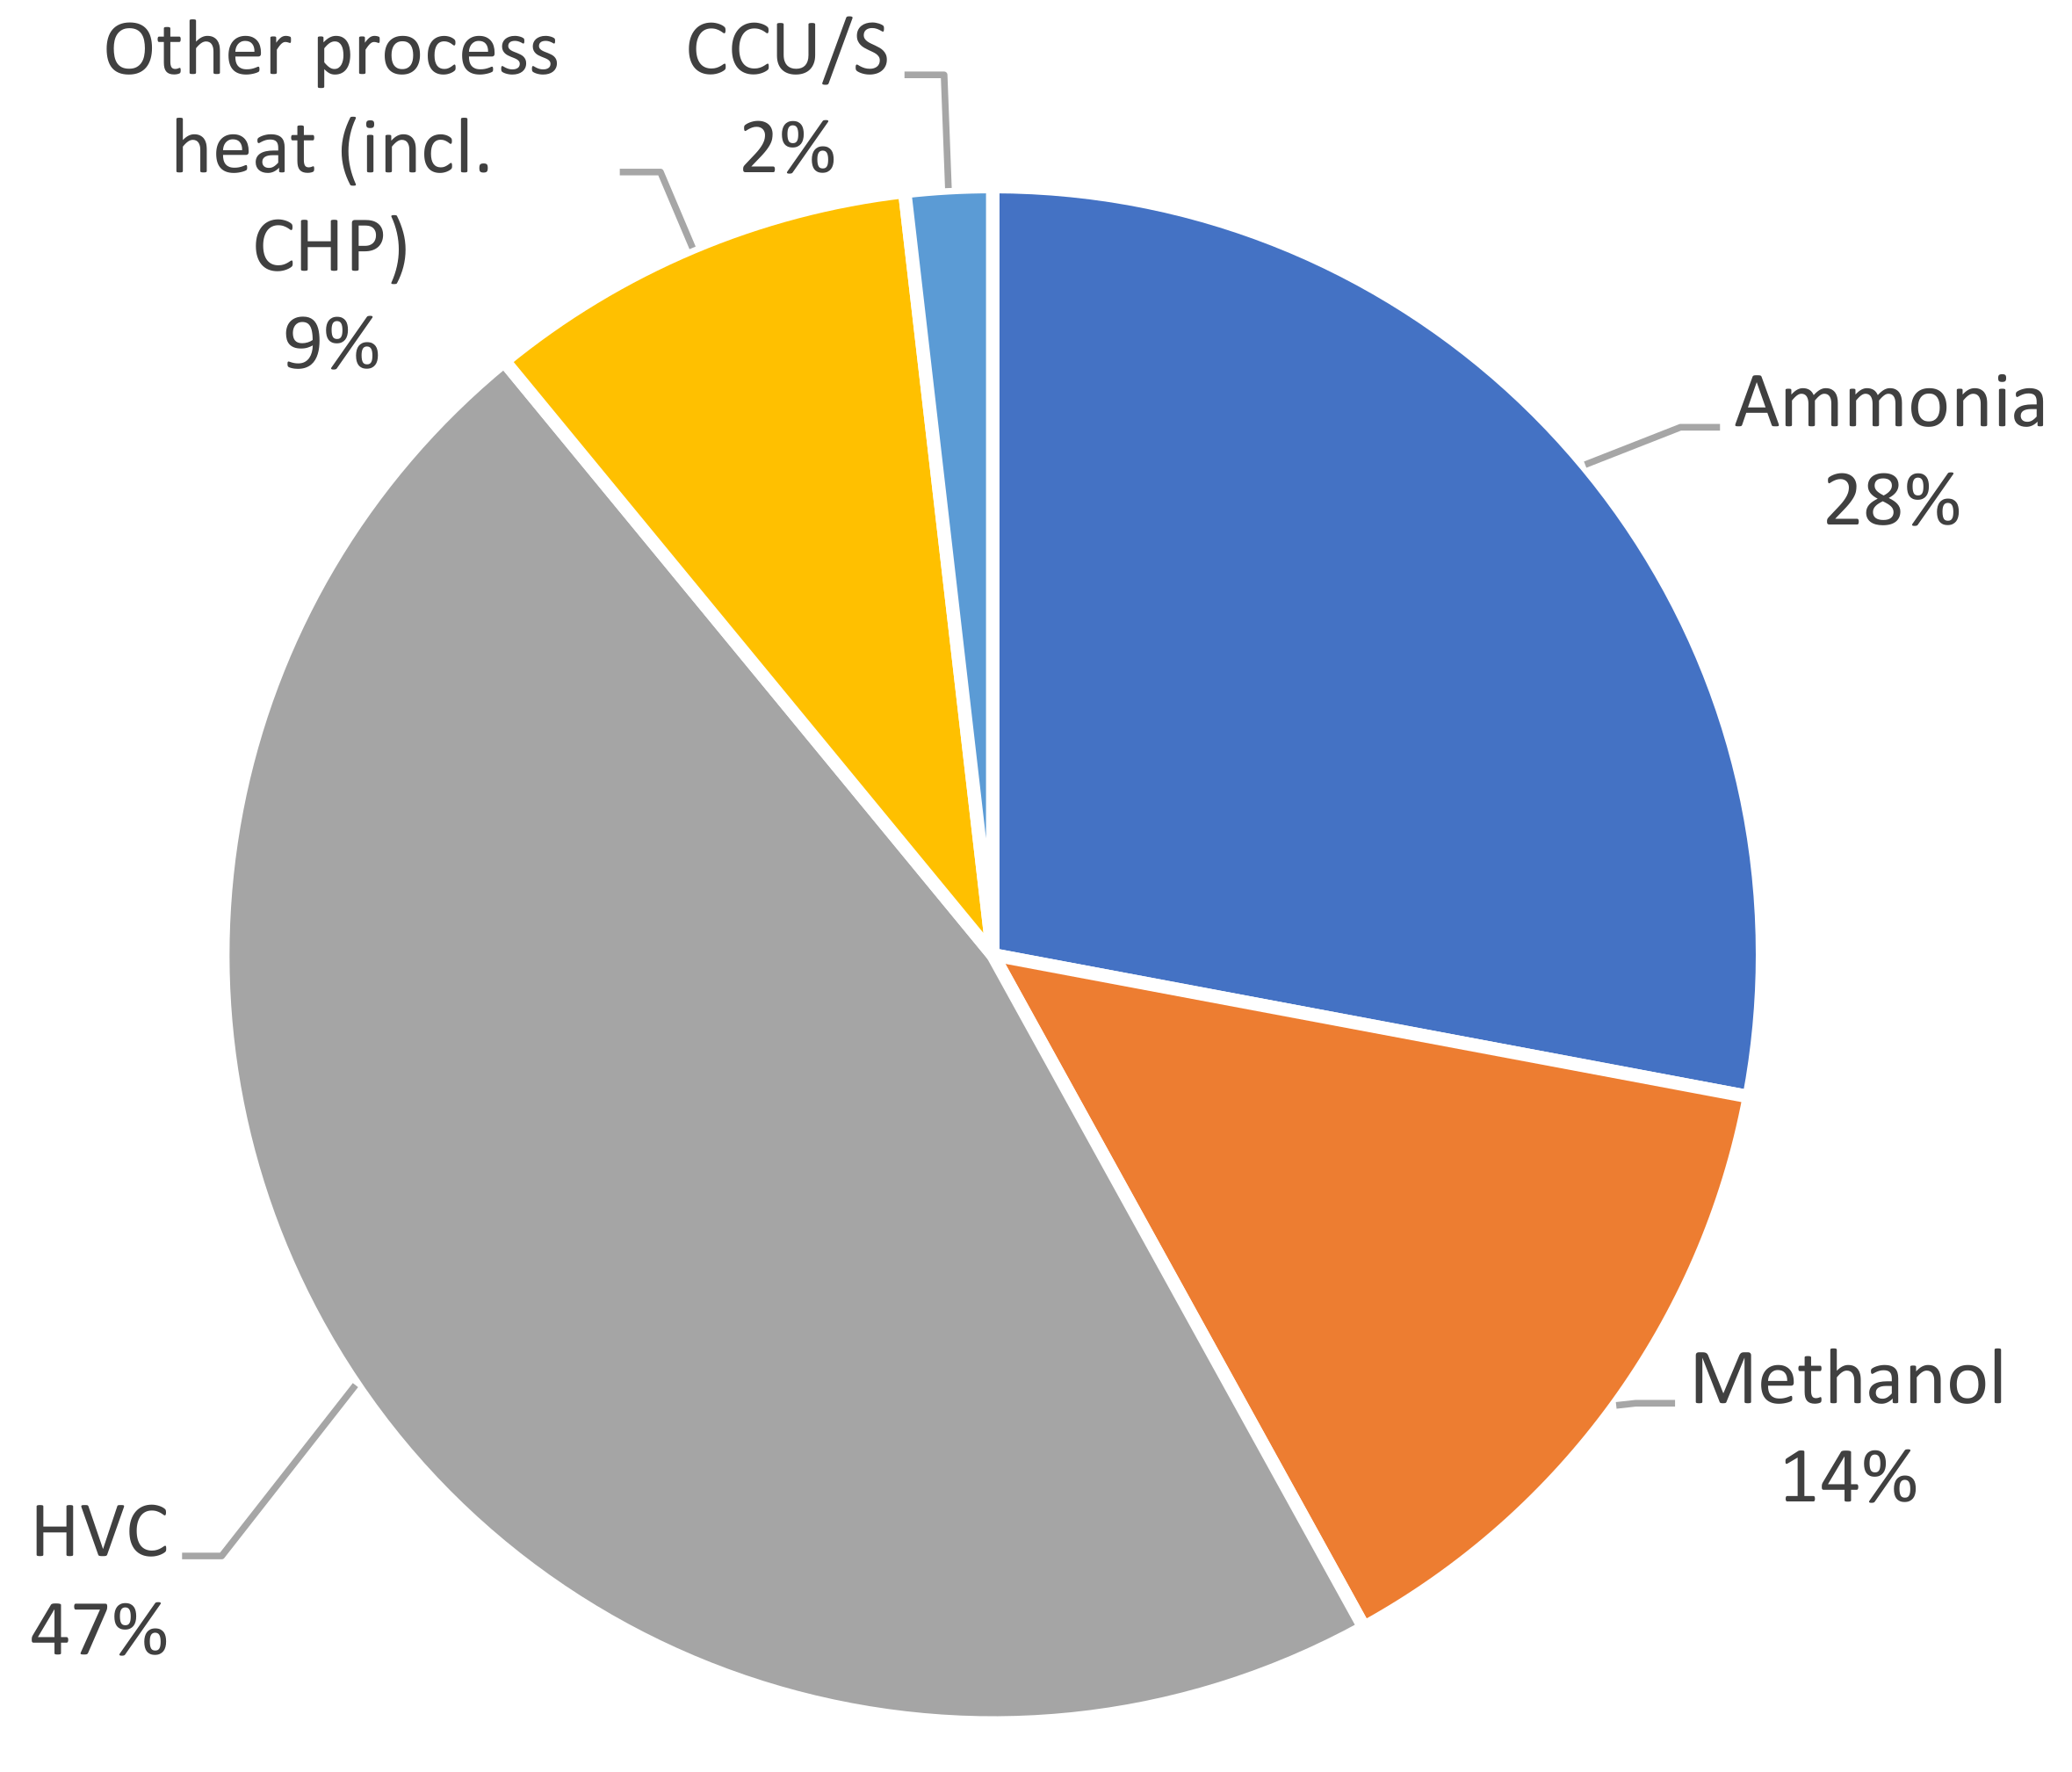
4.2. Energy Use
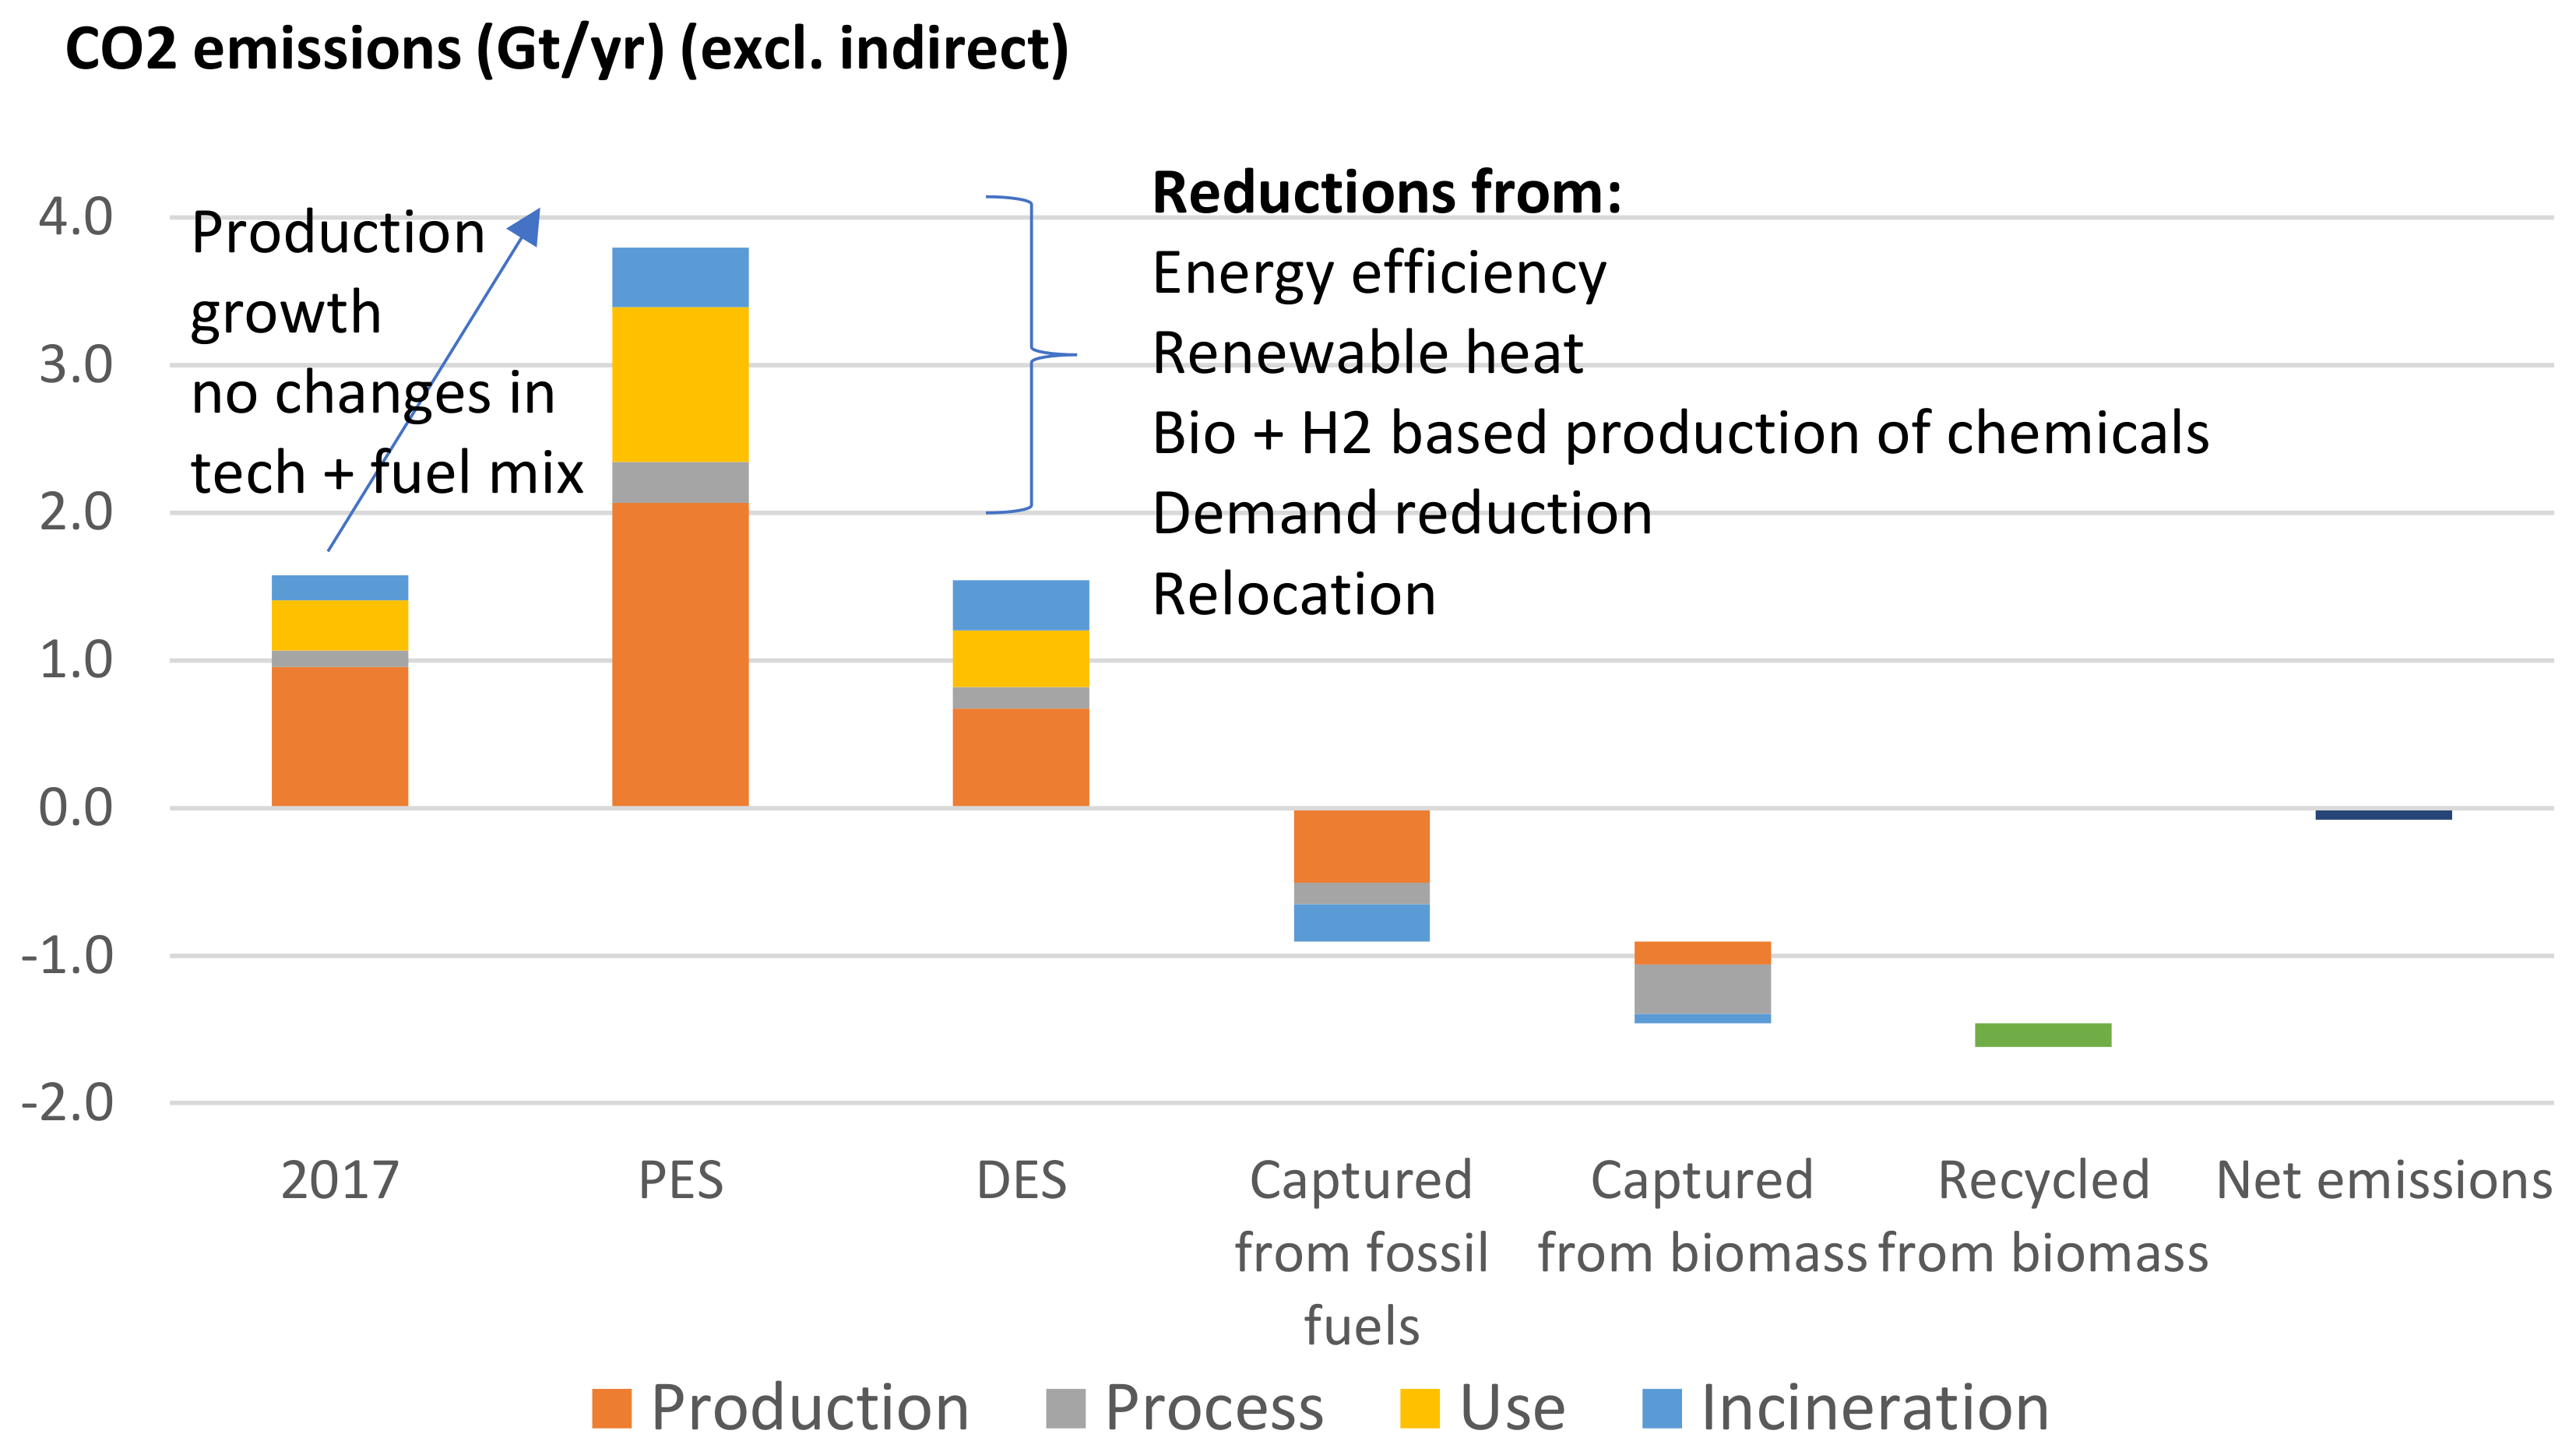
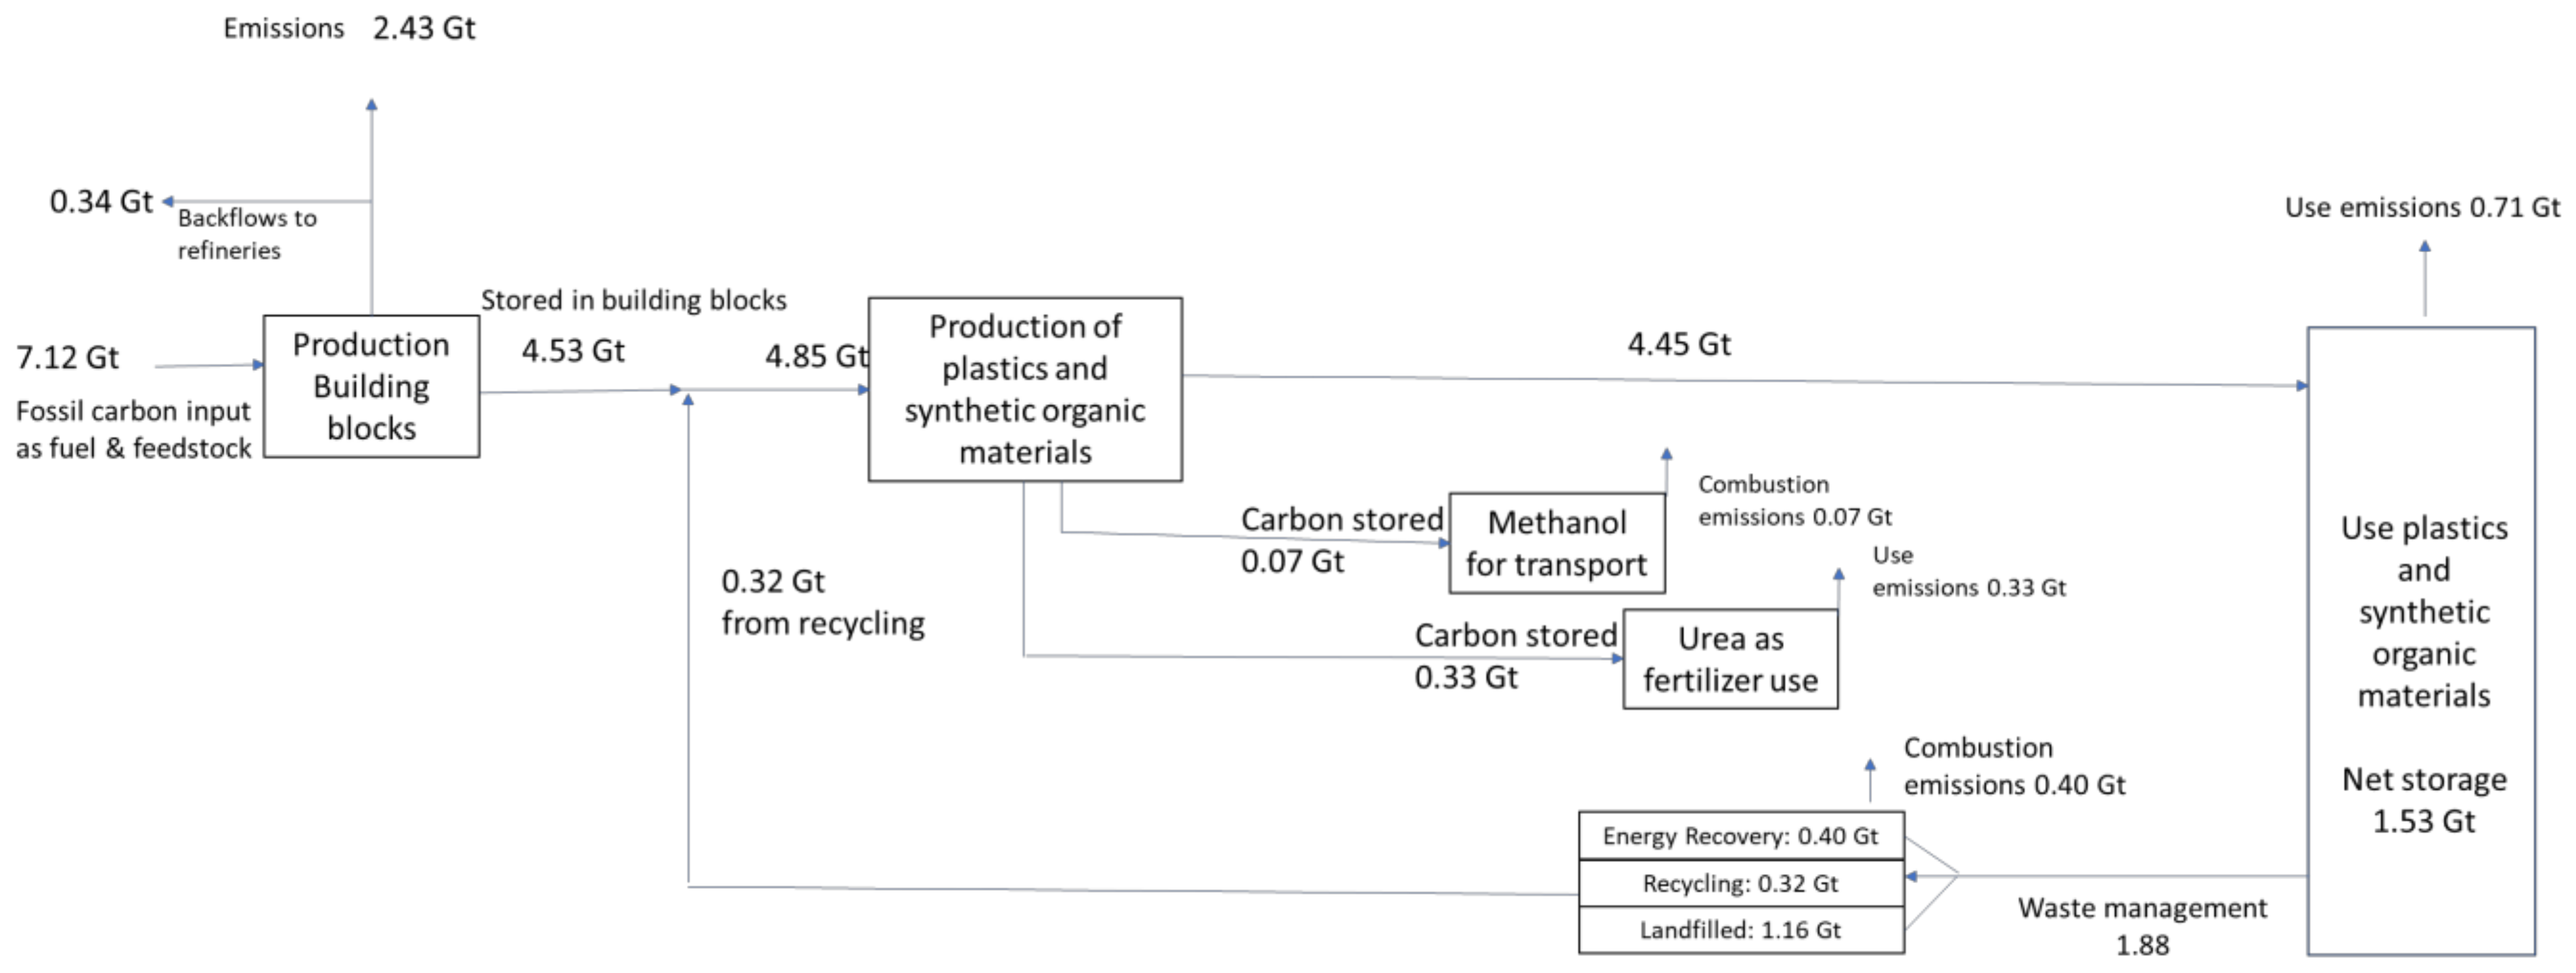
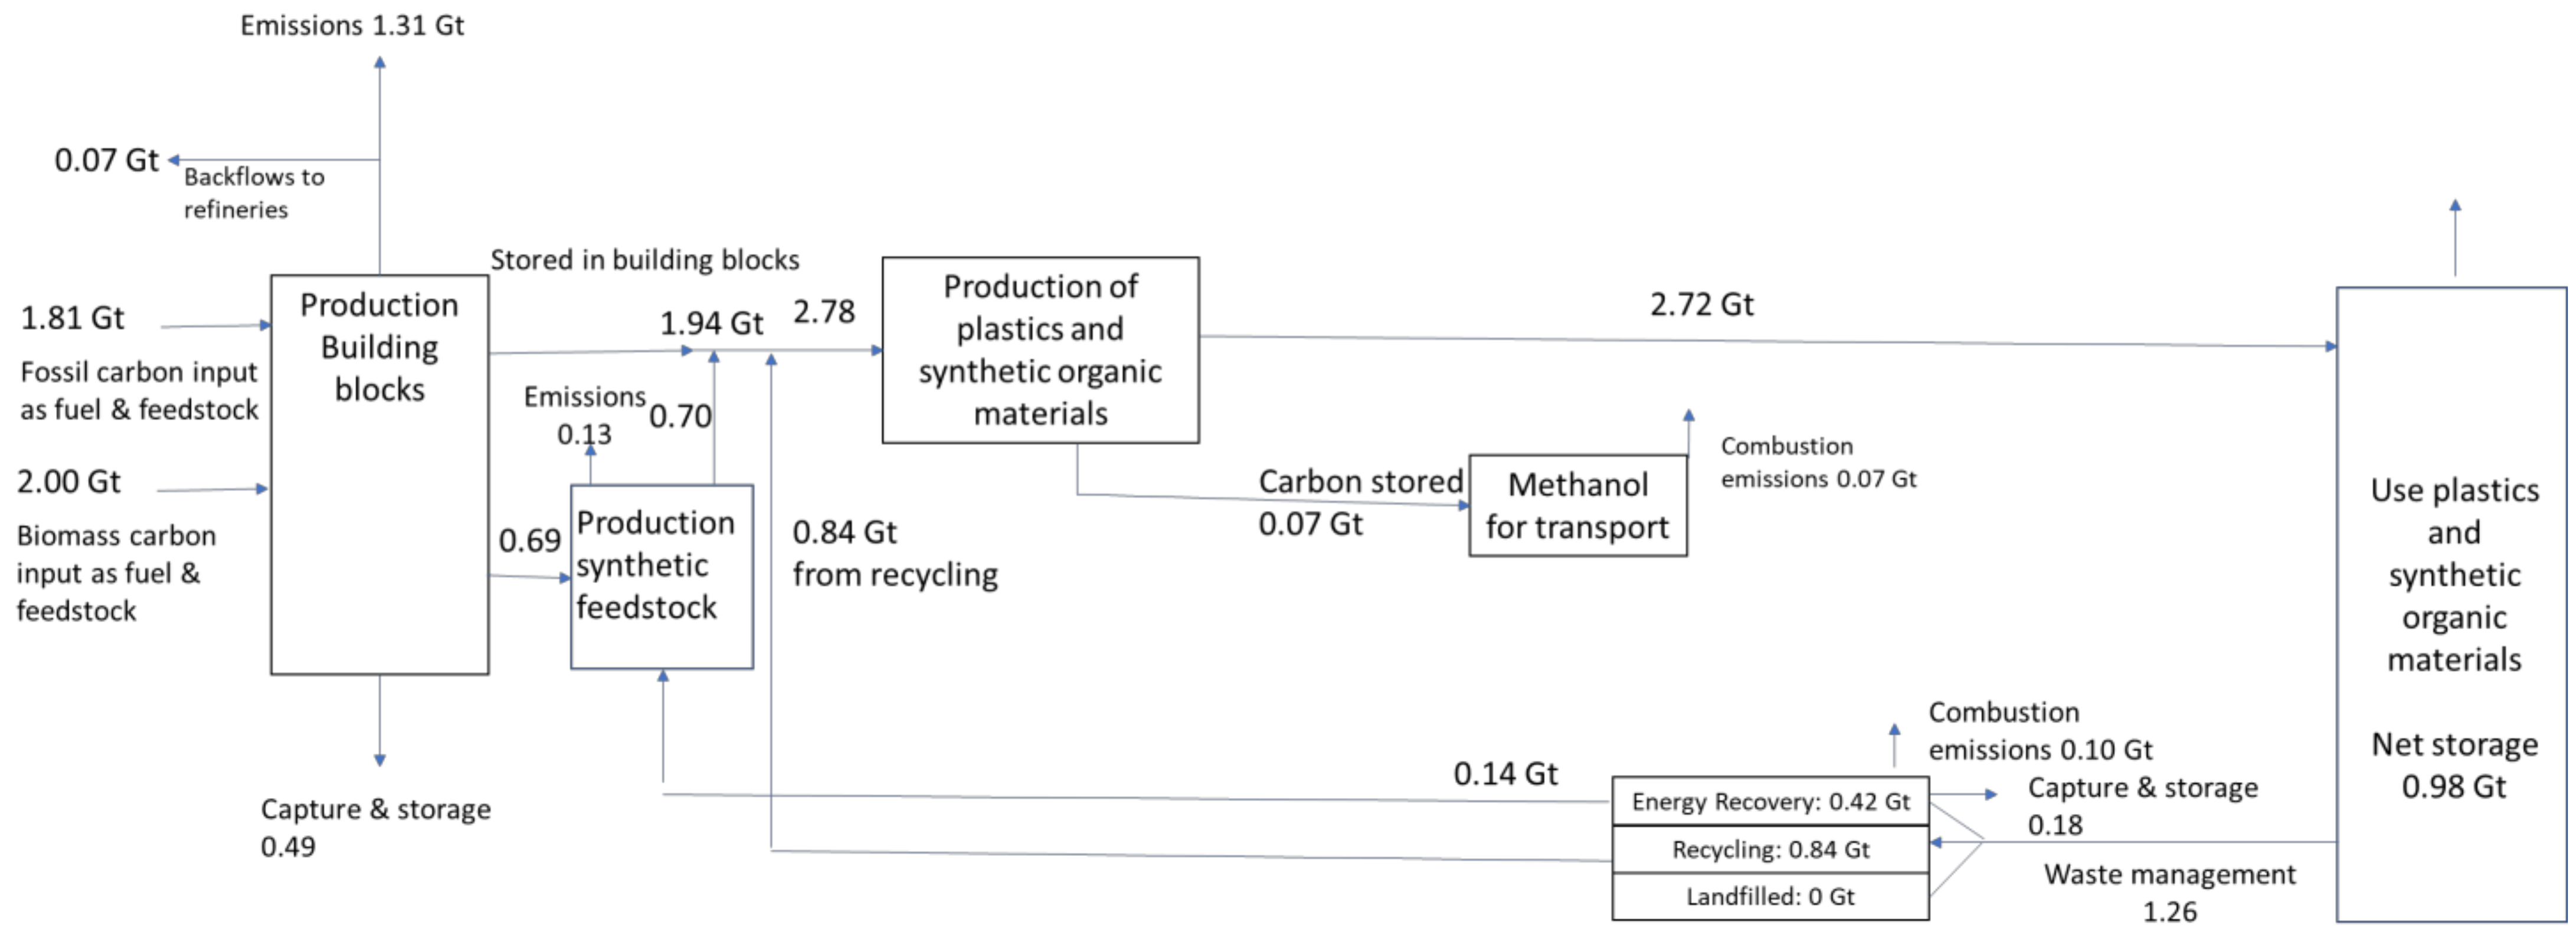
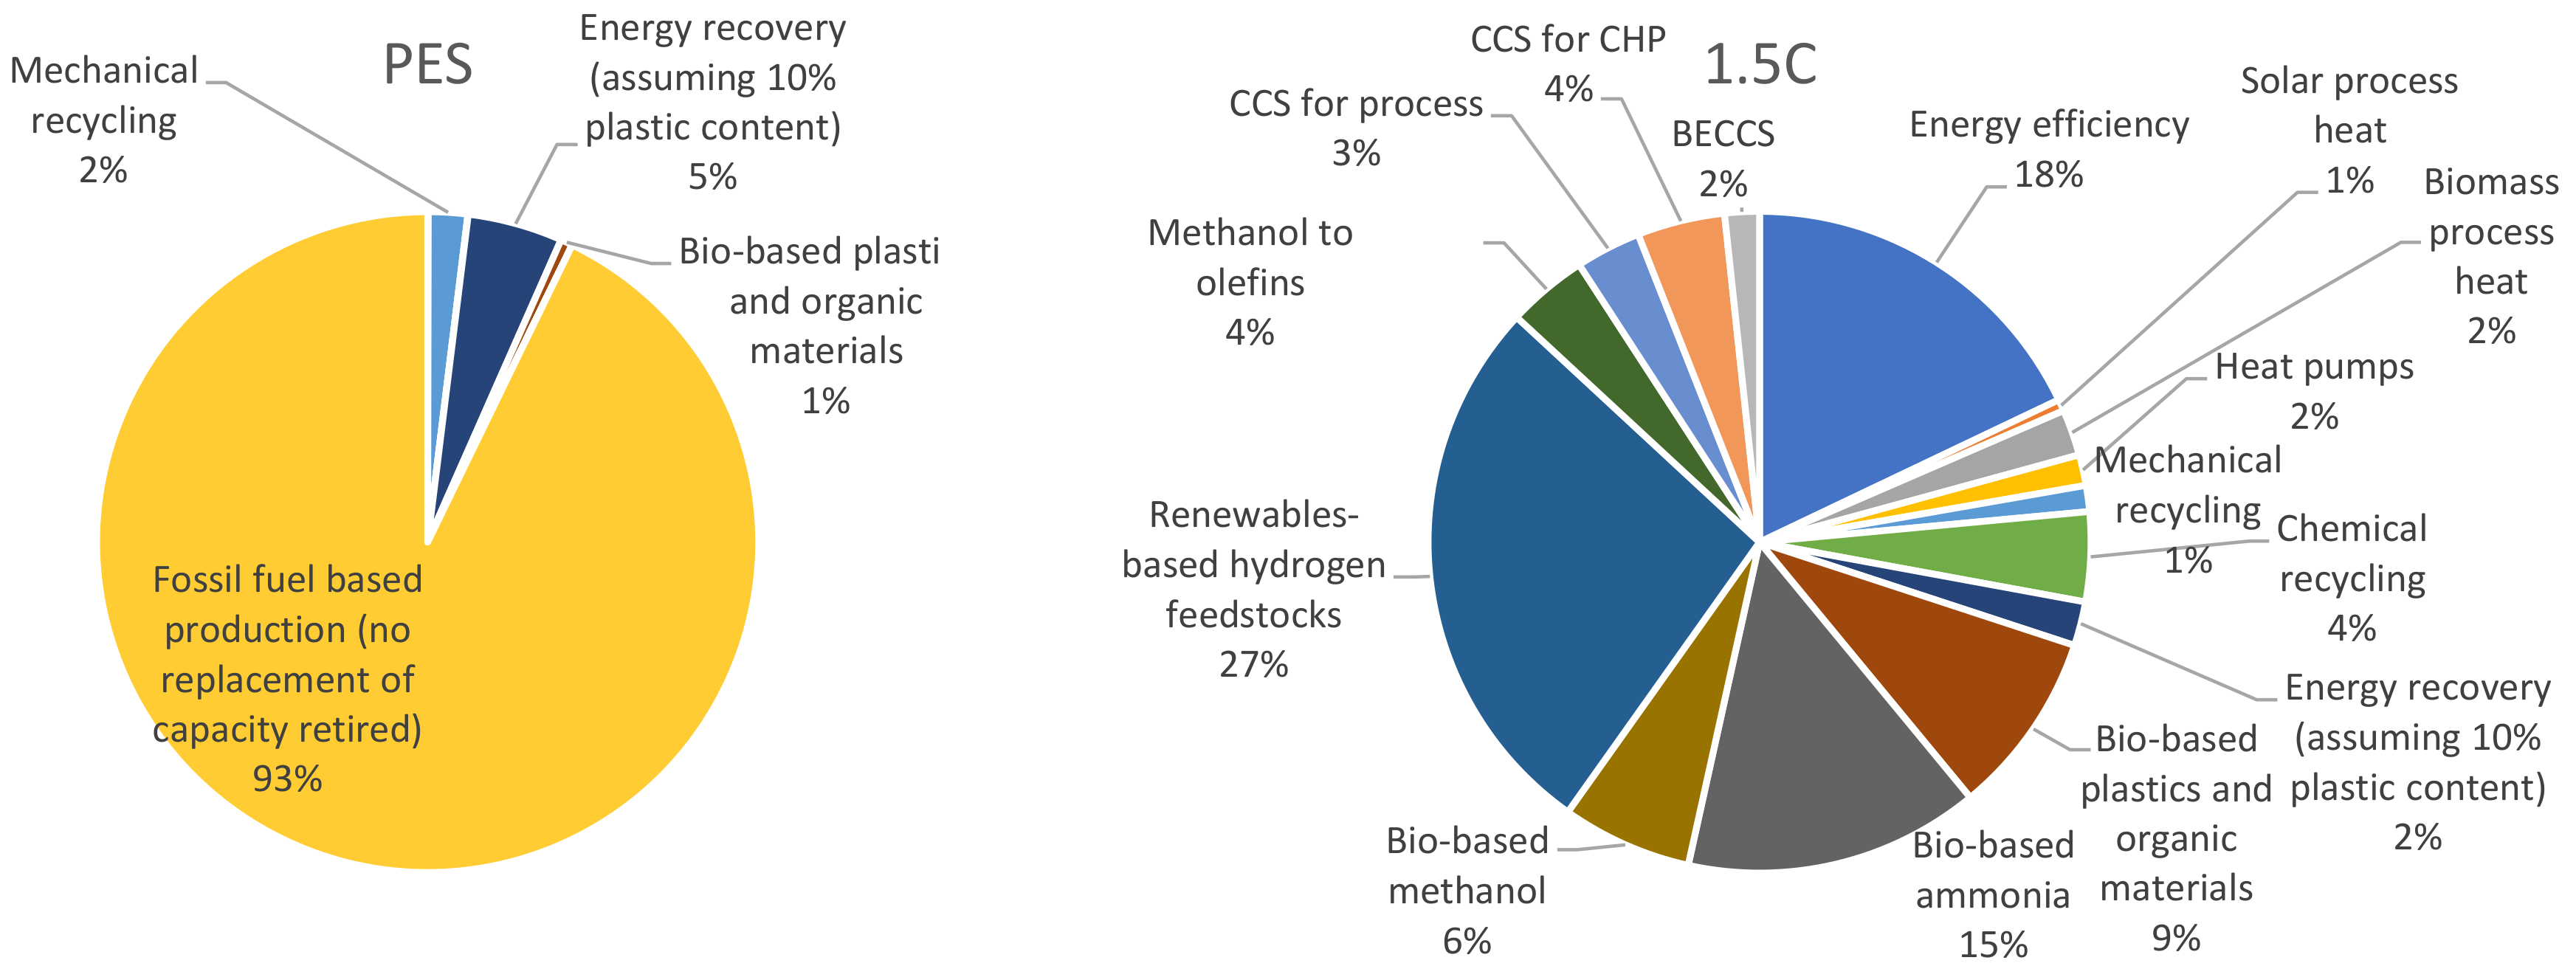
4.3. Emissions Reductions and Carbon Flows
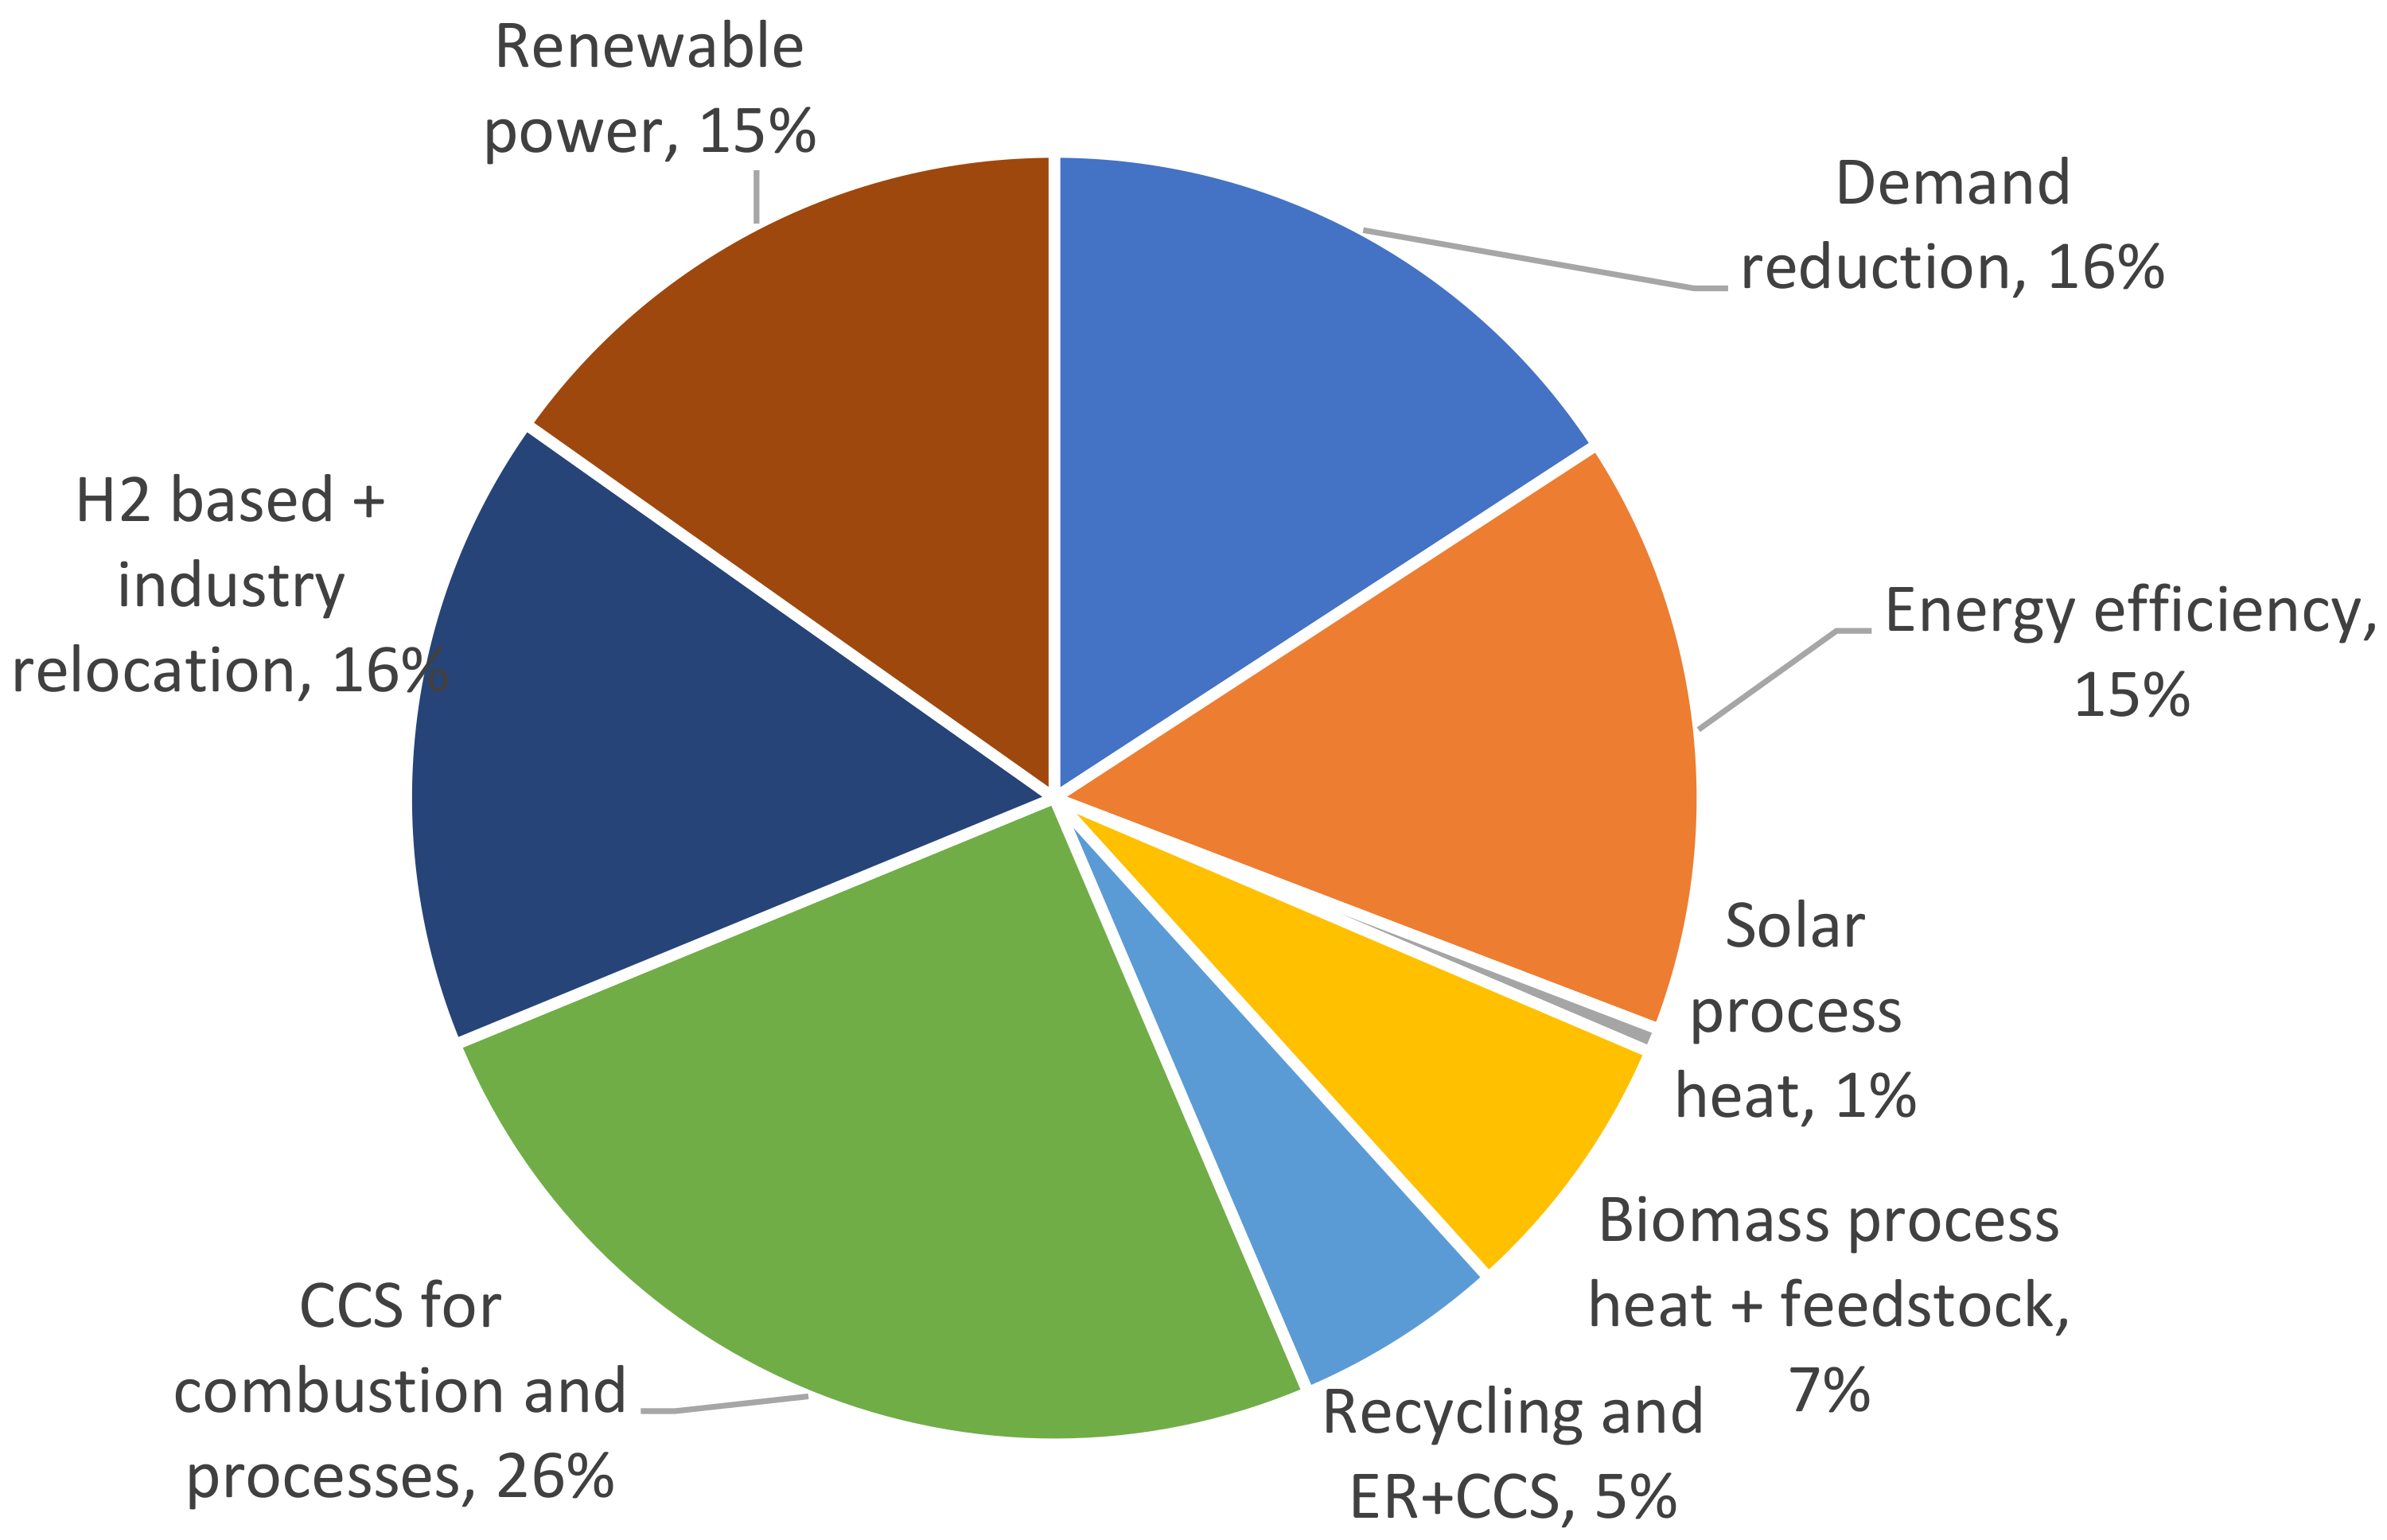
4.4. Costs of Emissions Reductions
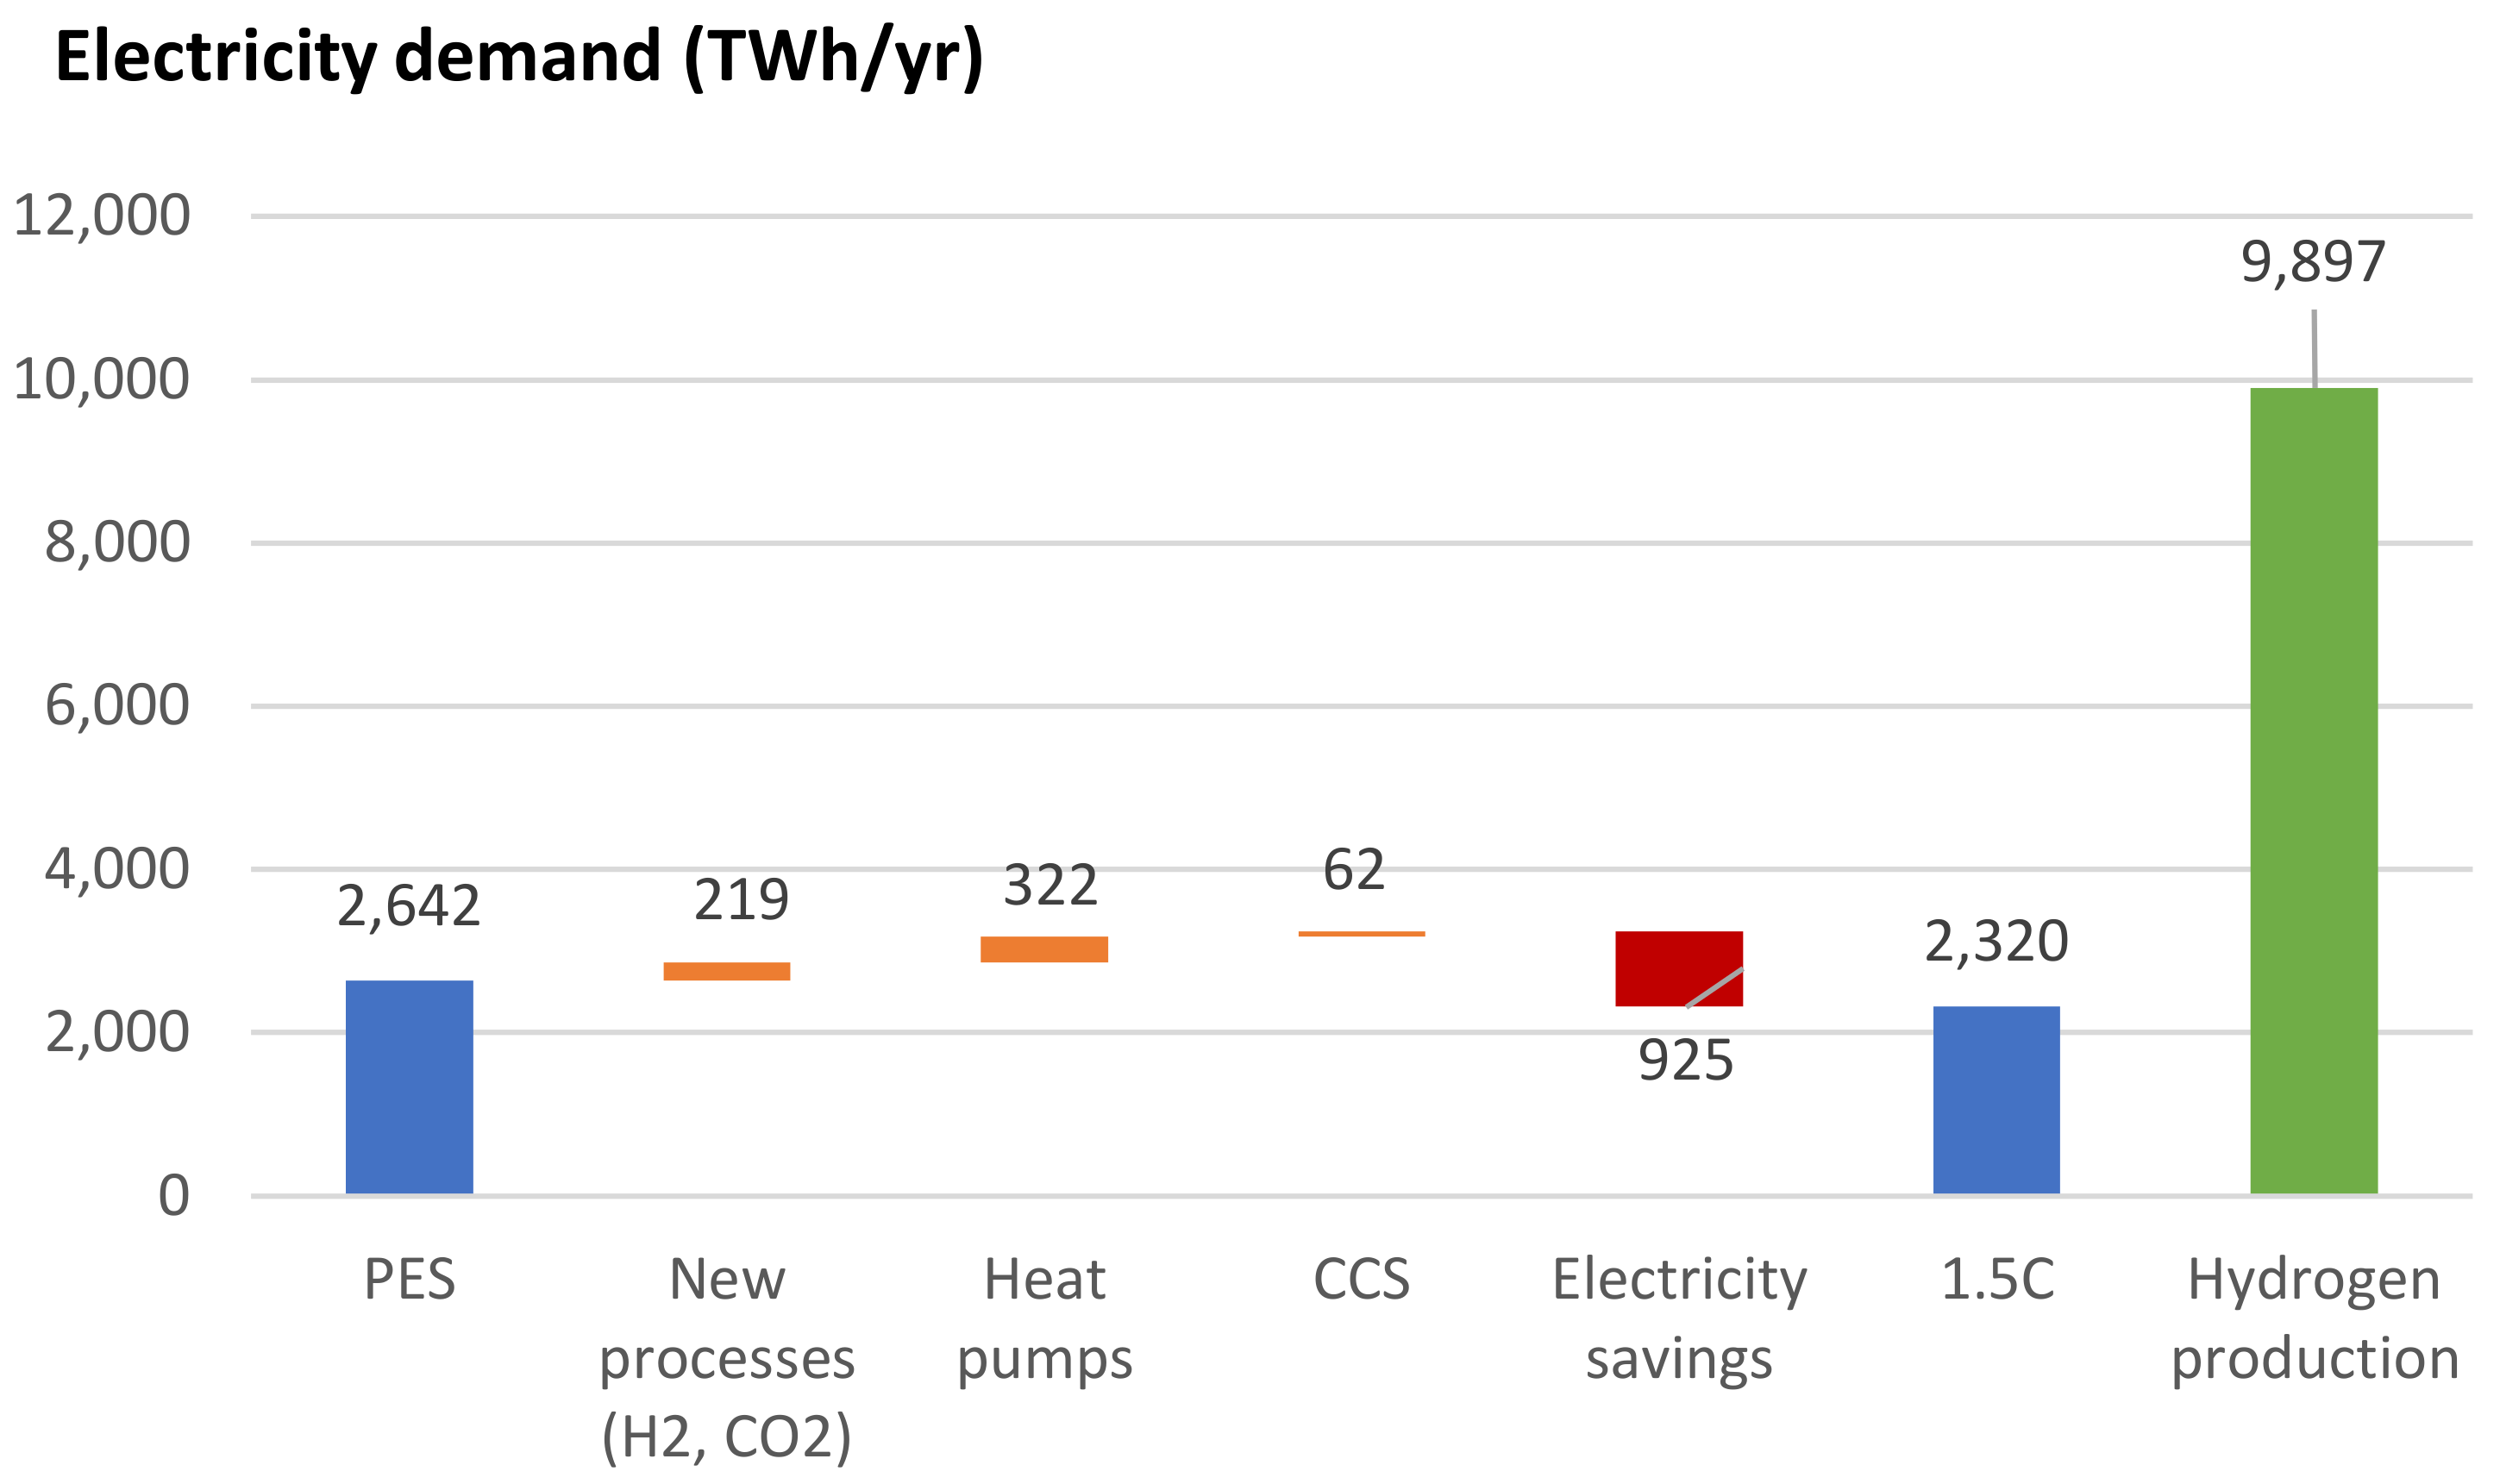
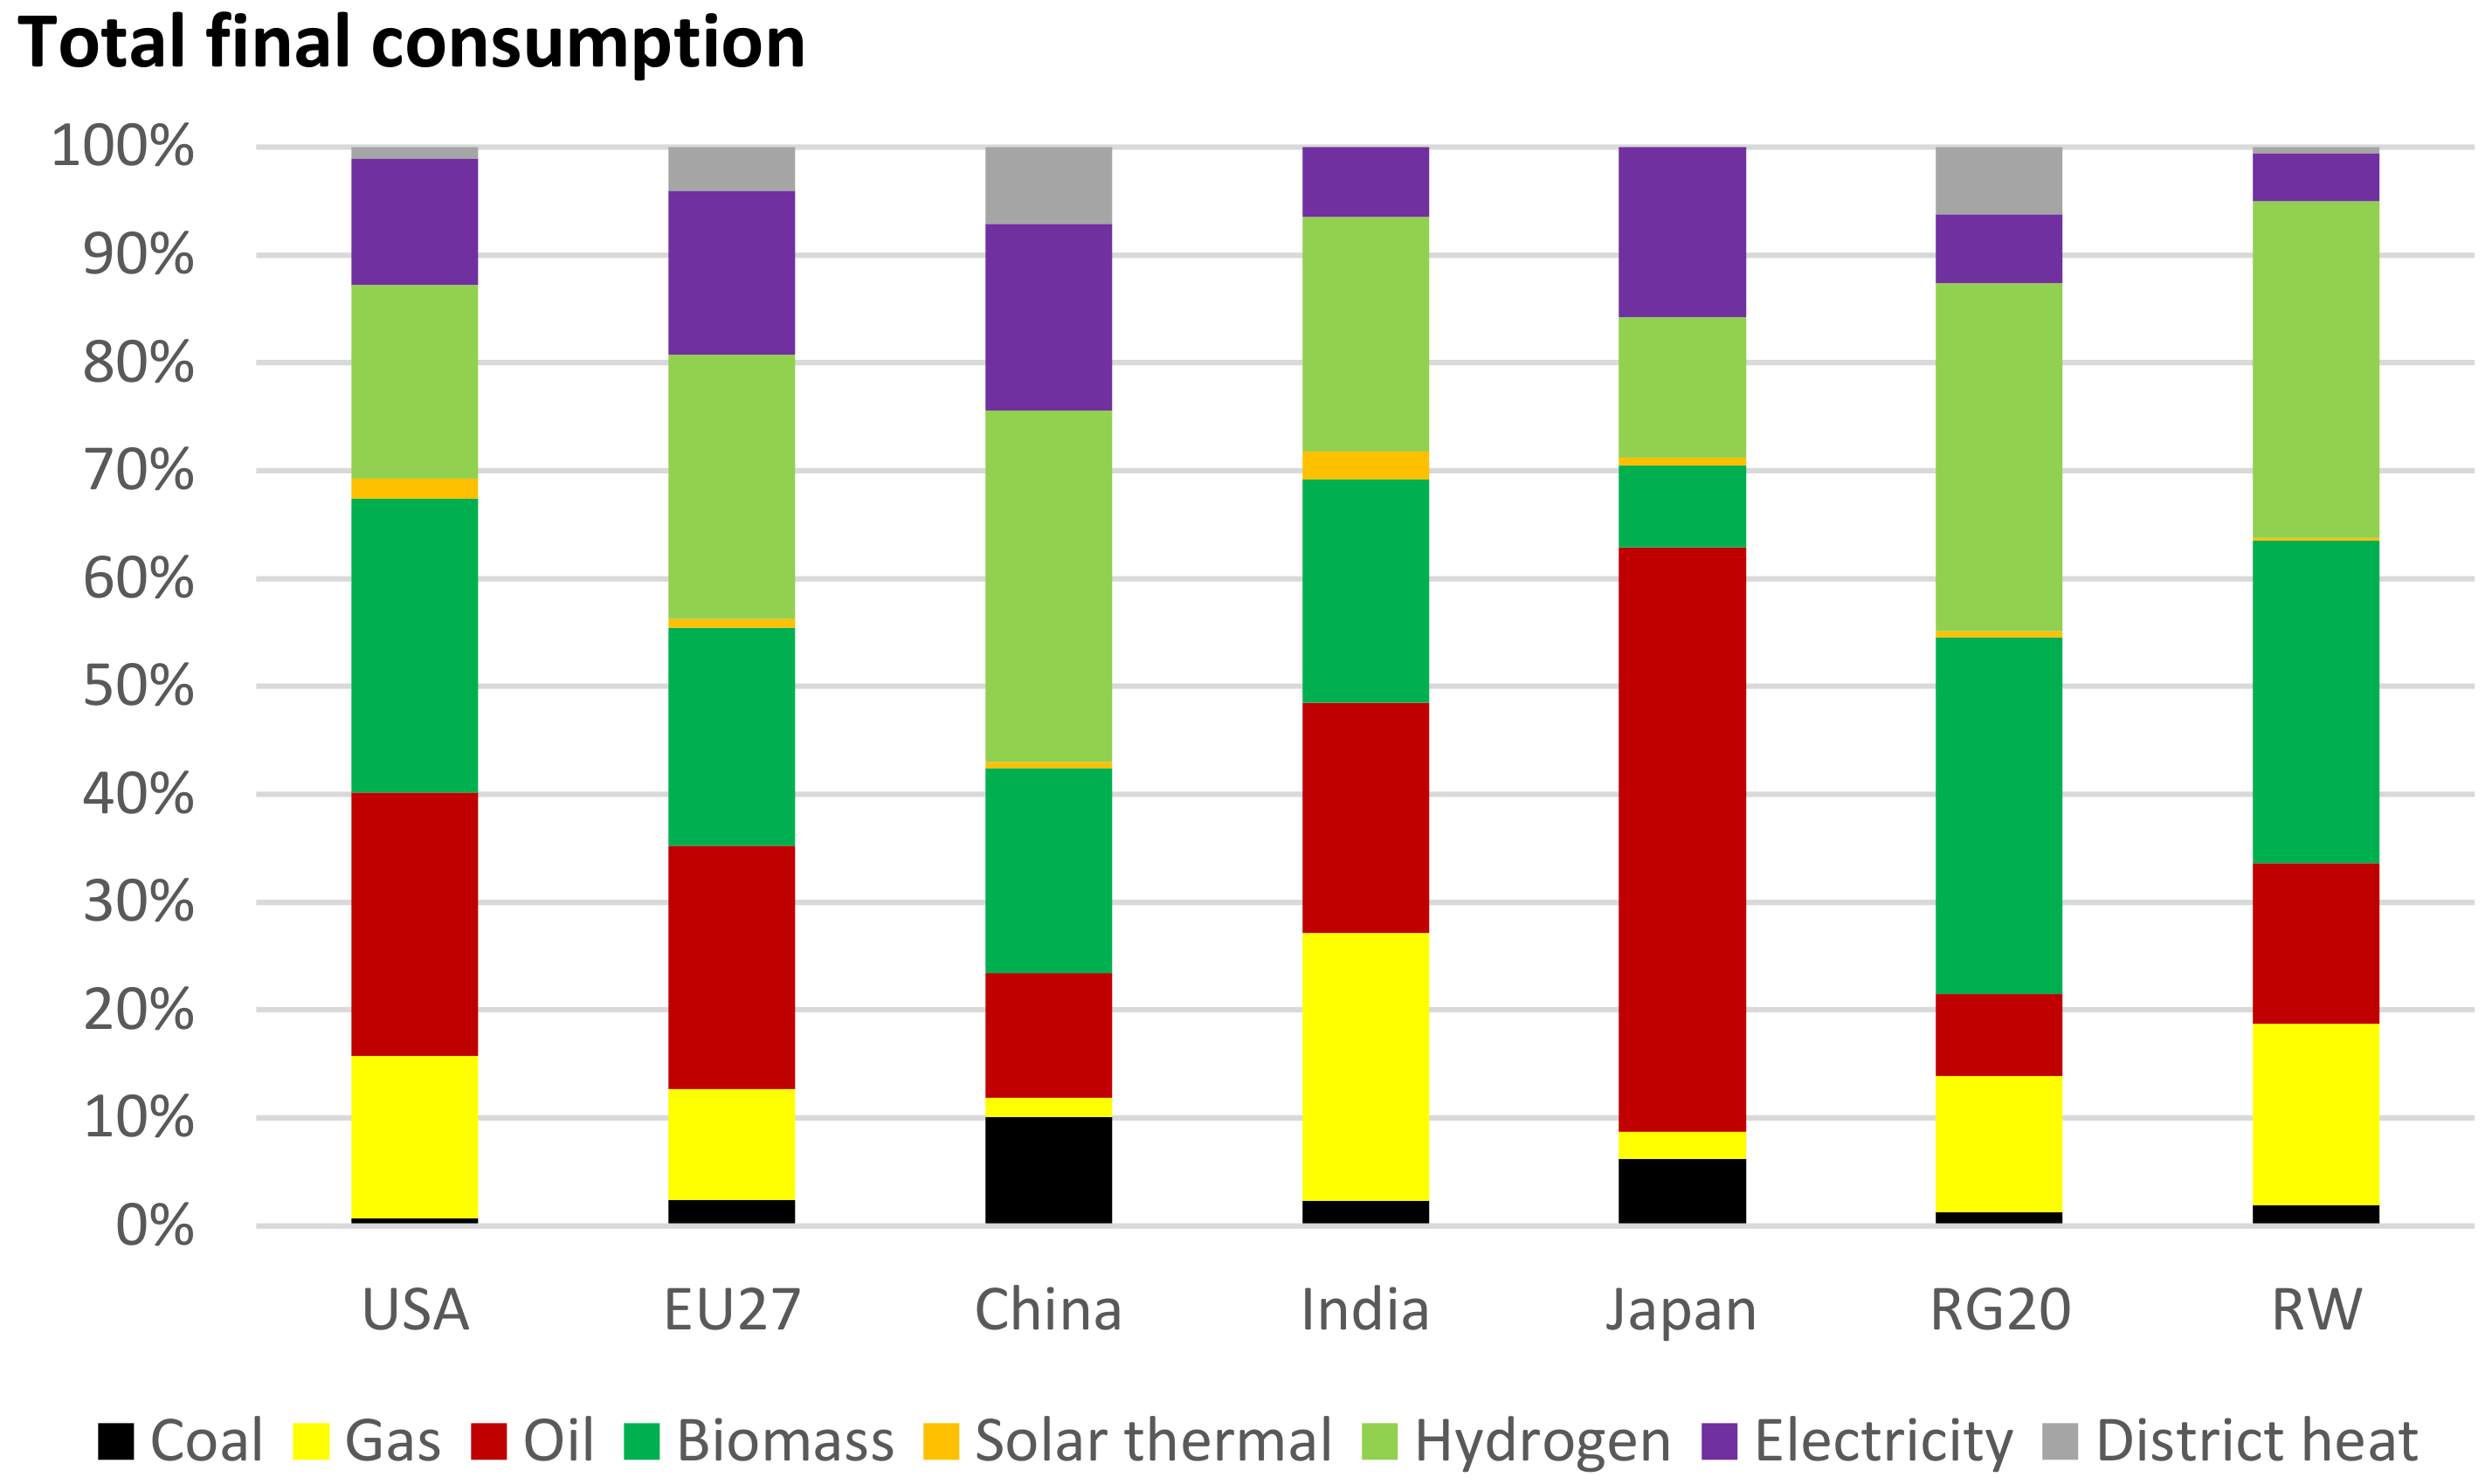
4.5. Implications for the Global Energy System
4.6. Impact on Commodity Prices
5. Discussion of Decarbonisation Challenges
5.1. Discussion of Results
5.2. Strategic Implications
6. Conclusions
Supplementary Materials
Author Contributions
Funding
Acknowledgments
Conflicts of Interest
References
- OECD. Saving Costs in Chemicals Management: How the OECD Ensures Benefits to Society; OECD: Paris, France, 2019. [Google Scholar]
- IEA. World Energy Balances 2019; OECD/IEA: Paris, France, 2019. [Google Scholar]
- Khemka, P. Ammonia and Urea: Global Overcapacity to Continue to Subdue Global Operating Rates in the Medium Term; Nexant: White Plains, NY, USA, 2019. [Google Scholar]
- Plastics Europe. Plastics—The Facts 2019. An Analysis of European Plastics Production, Demand and Waste Data; Plastics Europe: Brussels, Belgium, 2019. [Google Scholar]
- Grau, E. Bio-Sourced Polymers. Master’s Thesis, University of Bordeaux, Bordeaux, France, 2019. [Google Scholar]
- Saygin, D.; Gielen, D.; Draeck, M.; Worrell, E.; Patel, M. Assessment of the technical and economic potentials of biomass use for the production of steam, chemicals and polymers. Renew. Sustain. Energy Rev. 2014, 40, 1153–1167. [Google Scholar] [CrossRef]
- Weiss, M.; Neelis, M.; Zuidberg, M.; Patel, M. Applying bottom-up analysis to identify the system boundaries of non-energy use data in international energy statistics. Energy 2008, 33, 1609–1622. [Google Scholar] [CrossRef]
- Saygin, D.; Patel, M.; Worrell, E.; Tam, C.; Gielen, D. Potential of best practice technology to improve energy efficiency in the global chemical and petrochemical sector. Energy 2011, 36, 5779–5790. [Google Scholar] [CrossRef]
- IRENA. Global Renewables Outlook; International Renewable Energy Agency: Abu Dhabi, United Arab Emirates, 2020. [Google Scholar]
- Rogelj, J.; Shindell, D.; Jiang, K.; Fifita, S.; Forster, P.; Ginzburg, V.; Handa, C.; Kheshgi, H.; Kobayashi, S.; Kriegler, E.; et al. Mitigation Pathways Compatible with 1.5 °C in the Context of Sustainable Development. In Global Warming of 1.5 °C. An IPCC Special Report on the Impacts of Global Warming of 1.5 °C above Pre-Industrial Levels and Related Global Greenhouse Gas Emission Pathways, in the Context of Strengthening the Global Response to the Threat of Climate Change, Sustainable Development, and Efforts to Eradicate Poverty; Cambridge Press: Cambridge, UK, 2018. [Google Scholar]
- Ike, G.N.; Usman, O.; Sarkodie, S.A. Testing the role of oil production in the environmental Kuznets curve of oil producing countries: New insights from Method of Moments Quantile Regression. Sci. Total. Environ. 2020, 711, 135208. [Google Scholar] [CrossRef]
- Sadik-Zada, E.R.; Gatto, A. The puzzle of greenhouse gas footprints of oil abundance. Socio-Econ. Plan. Sci. 2021, 75, 100936. [Google Scholar] [CrossRef]
- Chen, G.-Q.; Patel, M.K. Plastics Derived from Biological Sources: Present and Future: A Technical and Environmental Review. Chem. Rev. 2012, 112, 2082–2099. [Google Scholar] [CrossRef]
- Karan, H.; Funk, C.; Grabert, M.; Oey, M.; Hankamer, B. Green Bioplastics as Part of a Circular Bioeconomy. Trends Plant Sci. 2019, 24, 237–249. [Google Scholar] [CrossRef]
- De Luna, P.; Hahn, C.; Higgins, D.; Jaffer, S.A.; Jaramillo, T.F.; Sargent, E.H. What would it take for renewably powered electrosynthesis to displace petrochemical processes? Science 2019, 364. [Google Scholar] [CrossRef] [Green Version]
- Gielen, D. Materializing Dematerialization. Ph.D. Thesis, Technical University Delft, Delft, The Netherlands, 1999. [Google Scholar]
- Kümmerer, K.; Clark, J.H.; Zuin, V.G. Rethinking chemistry for a circular economy. Science 2020, 367, 369–370. [Google Scholar] [CrossRef]
- Hatti-Kaul, R.; Nilsson, L.J.; Zhang, B.; Rehnberg, N.; Lundmark, S. Designing Biobased Recyclable Polymers for Plastics. Trends Biotechnol. 2020, 38, 50–67. [Google Scholar] [CrossRef]
- ECIU. Net Zero Tracker. Energy & Climate Intelligence Unit. 2021. Available online: https://www.eciu.net/netzerotracker (accessed on 24 April 2021).
- Stork, M.; de Beer, J.; Lintmeijer, N.; den Ouden, B. Chemistry for Climate: Acting on the Need for Speed. Roadmap for the Dutch Chemical Industry towards 2050; Ecofys and Berenschot: Utrecht, The Netherlands, 2018. [Google Scholar]
- CEFIC. European Chemistry for Growth. Unlocking a Competitive, Low Carbon and Energy Efficient Future; CEFIC: Brussels, Belgium, 2013. [Google Scholar]
- IEA. The Future of Petrochemicals. Towards More Sustainable Plastics and Fertilisers; OECD/IEA: Paris, France, 2018. [Google Scholar]
- Rissman, J.; Bataille, C.; Masanet, E.; Aden, N.; Morrow, W.R.; Zhou, N.; Elliott, N.; Dell, R.; Heeren, N.; Huckestein, B.; et al. Technologies and policies to decarbonize global industry: Review and assessment of mitigation drivers through 2070. Appl. Energy 2020, 266, 114848. [Google Scholar] [CrossRef]
- Economidou, M. Assessing the Progress towards the EU Energy Efficiency Targets Using Index Decomposition Analysis; No. EUR 28710 EN; Publications Office of the European Union: Luxembourg, 2017. [Google Scholar]
- Reuter, M.; Patel, M.K.; Eichhammer, W. Applying ex post index decomposition analysis to final energy consumption for evaluating European energy efficiency policies and targets. Energy Effic. 2019, 12, 1329–1357. [Google Scholar] [CrossRef] [Green Version]
- Saygin, D.; Worrell, E.; Tam, C.; Trudeau, N.; Gielen, D.; Weiss, M.; Patel, M. Long-term energy efficiency analysis requires solid energy statistics: The case of the German basic chemical industry. Energy 2012, 44, 1094–1106. [Google Scholar] [CrossRef]
- Boulamanti, A.; Moya, J.A. Energy Efficiency and GHG Emissions: Prospective Scenarios for the Chemical and Petrochemical Industry; No. EUR 28471 EN; Publications Office of the European Union: Luxembourg, 2017. [Google Scholar]
- Kesicki, F.; Yanagisawa, A. Modelling the potential for industrial energy efficiency in IEA’s World Energy Outlook. Energy Effic. 2015, 8, 155–169. [Google Scholar] [CrossRef]
- Saygin, D.; Wetzels, W.; Worrell, E.; Patel, M.K. Linking historic developments and future scenarios of industrial energy use in the Netherlands between 1993 and 2040. Energy Effic. 2013, 6, 341–368. [Google Scholar] [CrossRef]
- McLellan, B.; Corder, G.; Giurco, D.; Ishihara, K. Renewable energy in the minerals industry: A review of global potential. J. Clean. Prod. 2012, 32, 32–44. [Google Scholar] [CrossRef]
- Schiffer, Z.J.; Manthiram, K. Electrification and Decarbonization of the Chemical Industry. Joule 2017, 1, 10–14. [Google Scholar] [CrossRef] [Green Version]
- Åhman, M.; Nilsson, L.J.; Johansson, B. Global climate policy and deep decarbonization of energy-intensive industries. Clim. Policy 2017, 17, 634–649. [Google Scholar] [CrossRef] [Green Version]
- Fais, B.; Sabio, N.; Strachan, N. The critical role of the industrial sector in reaching long-term emission reduction, energy efficiency and renewable targets. Appl. Energy 2016, 162, 699–712. [Google Scholar] [CrossRef] [Green Version]
- Gerres, T.; Ávila, J.P.C.; Llamas, P.L.; Román, T.G.S. A review of cross-sector decarbonisation potentials in the European energy intensive industry. J. Clean. Prod. 2019, 210, 585–601. [Google Scholar] [CrossRef]
- Gielen, D.; Taylor, M. Modelling industrial energy use: The IEAs Energy Technology Perspectives. Energy Econ. 2007, 29, 889–912. [Google Scholar] [CrossRef]
- Levi, P.G.; Cullen, J.M. Mapping Global Flows of Chemicals: From Fossil Fuel Feedstocks to Chemical Products. Environ. Sci. Technol. 2018, 52, 1725–1734. [Google Scholar] [CrossRef] [PubMed]
- Bazzanella, A.M.; Ausfelder, F. Low Carbon Energy and Feedstock for the European Chemical Industry; Technical Study; Dechema E.V.: Frankfurt am Main, Germany, 2017. [Google Scholar]
- Serrano-Ruiz, J.C.; West, R.M.; Dumesic, J.A. Catalytic Conversion of Renewable Biomass Resources to Fuels and Chemicals. Annu. Rev. Chem. Biomol. Eng. 2010, 1, 79–100. [Google Scholar] [CrossRef] [PubMed]
- Patel, M.; Neelis, M.; Gielen, D.; Olivier, J.; Simmons, T.; Theunis, J. Carbon dioxide emissions from non-energy use of fossil fuels: Summary of key issues and conclusions from the country analyses. Resour. Conserv. Recycl. 2005, 45, 195–209. [Google Scholar] [CrossRef]
- IRENA. World Energy Transitions Outlook: 1.5 °C Pathway (Preview); IRENA: Abu Dhabi, United Arab Emirates, 2021. [Google Scholar]
- Bourguignon, D. Plastics in a Circular Economy. Opportunities and Challenges; Briefing; European Parliament: Brussels, Belgium, 2017. [Google Scholar]
- Hundertmark, T.; Mayer, M.; McNally, C.; Simons, T.J.; Witte, C. How Plastics-Waste Recycling Could Transform the Chemical Industry; McKinsey & Company: New York, NY, USA, 2018. [Google Scholar]
- WEF. The New Plastics Economy. Rethinking the Future of Plastics; World Economic Forum: Geneva, Switzerland, 2016. [Google Scholar]
- Gielen, D.; Patel, M.K. The NEAT model, non-energy use emission accounting tables. In Proceedings of the First NEU-CO2 workshop, Paris, France, 22–23 September 1999. [Google Scholar]
- Zuberi, M.J.S.; Patel, M.K. Cost-effectiveness analysis of energy efficiency measures in the Swiss chemical and pharmaceutical industry. Int. J. Energy Res. 2019, 43, 313–336. [Google Scholar] [CrossRef] [Green Version]
- Broeren, M.; Saygin, D.; Patel, M. Forecasting global developments in the basic chemical industry for environmental policy analysis. Energy Policy 2014, 64, 273–287. [Google Scholar] [CrossRef]
- IEA. Energy Technology Transitions for the Industry. Strategies for Next Industrial Revolution; OECD/IEA: Paris, France, 2009. [Google Scholar]
- Parvatker, A.G.; Eckelman, M.J. Simulation-Based Estimates of Life Cycle Inventory Gate-to-Gate Process Energy Use for 151 Organic Chemical Syntheses. ACS Sustain. Chem. Eng. 2020, 8, 8519–8536. [Google Scholar] [CrossRef]
- IRENA. Renewable Energy in Manufacturing. A Technology Roadmap for REmap 2030; International Renewable Energy Agency: Abu Dhabi, United Arab Emirates, 2014. [Google Scholar]
- Taibi, E.; Gielen, D.; Bazilian, M. The potential for renewable energy in industrial applications. Renew. Sustain. Energy Rev. 2012, 16, 735–744. [Google Scholar] [CrossRef]
- Lechtenböhmer, S.; Nilsson, L.J.; Åhman, M.; Schneider, C. Decarbonising the energy intensive basic materials industry through electrification—Implications for future EU electricity demand. Energy 2016, 115, 1623–1631. [Google Scholar] [CrossRef] [Green Version]
- Perner, J.; Unteutsch, M.; Lövenich, A. The Future Cost of Electricity-Based Synthetic Fuels; Agora Energiewende and Agora Verkehrswende: Berlin, Germany, 2018. [Google Scholar]
- Jung, O. Industrial Heat Pumps; Svenska Kyl &, Värmepumpdagen, Mölndal, Sweden, 17 October 2019. Available online: https://www.kvpdagen.se/wp-content/uploads/2019/11/Sal%201/20191017%20Industrial%20heat%20pumps%20-Oliver%20Jung.pdf (accessed on 11 June 2021).
- Van Kranenburg, K.; Schols, E.; Gelevert, H.; de Kler, R.; van Delft, Y.; Weeda, M. Empowering the Chemical Industry. Opportunities for Electrification; Whitepaper; TNO and ECN: Utrecht, The Netherlands; Petten, The Netherlands, 2016. [Google Scholar]
- Daioglou, V.; Faaij, A.P.C.; Saygin, D.; Patel, M.K.; Wicke, B.; Van Vuuren, D.P. Energy demand and emissions of the non-energy sector. Energy Environ. Sci. 2014, 7, 482–498. [Google Scholar] [CrossRef] [Green Version]
- IEA. The Future of Hydrogen. Seizing Today’s Opportunities; OECD/IEA: Paris, France, 2019. [Google Scholar]
- Karka, P.; Papadokonstantakis, S.; Kokossis, A. Cradle-to-gate assessment of environmental impacts for a broad set of biomass-to-product process chains. Int. J. Life Cycle Assess. 2017, 22, 1418–1440. [Google Scholar] [CrossRef]
- IRENA; Methanol Institute. Production of Renewable Methanol; IRENA: Abu Dhabi, United Arab Emirates, 2021. [Google Scholar]
- Matzen, M.; Alhajji, M.; Demirel, Y. Technoeconomics and Sustainability of Renewable Methanol and Ammonia Productions Using Wind Power-based Hydrogen. J. Adv Chem Eng. 2015, 5, 128. [Google Scholar] [CrossRef] [Green Version]
- IRENA. Accelerating the Energy Transition through Innovation; International Renewable Energy Agency: Abu Dhabi, United Arab Emirates, 2017. [Google Scholar]
- Philibert, C. Direct and indirect electrification of industry and beyond. Oxf. Rev. Econ. Policy 2019, 35, 197–217. [Google Scholar] [CrossRef]
- Da Cruz, N.F.; Ferreira, S.; Cabral, M.; Simões, P.; Marques, R.C. Packaging waste recycling in Europe: Is the industry paying for it? Waste Manag. 2014, 34, 298–308. [Google Scholar] [CrossRef] [PubMed] [Green Version]
- Ferreira, S.; Cabral, M.; da Cruz, N.; Simões, P.; Marques, R.C. The costs and benefits of packaging waste management systems in Europe: The perspective of local authorities. J. Environ. Plan. Manag. 2016, 60, 773–791. [Google Scholar] [CrossRef] [Green Version]
- Gradus, R.H.; Nillesen, P.H.; Dijkgraaf, E.; van Koppen, R.J. A Cost-effectiveness Analysis for Incineration or Recycling of Dutch Household Plastic Waste. Ecol. Econ. 2017, 135, 22–28. [Google Scholar] [CrossRef]
- Pilz, H. Criteria for Eco-Efficient (Sustainable) Plastic Recycling and Waste Management; Background Report for Associated Presentation No. Version 1.2; Denkstatt: Vienna, Austria, 2014. [Google Scholar]
- Bergsma, G. Chemical Recycling and Its CO2 Reduction Potential; CE Delft: Delft, The Netherlands, 2019. [Google Scholar]
- Devasahayam, S.; Raju, G.B.; Hussain, C.M. Utilization and recycling of end of life plastics for sustainable and clean industrial processes including the iron and steel industry. Mater. Sci. Energy Technol. 2019, 2, 634–646. [Google Scholar] [CrossRef]
- Kuramochi, T.; Ramírez, A.; Turkenburg, W.; Faaij, A. Comparative assessment of CO2 capture technologies for carbon-intensive industrial processes. Prog. Energy Combust. Sci. 2012, 38, 87–112. [Google Scholar] [CrossRef]
- Saygin, D.; Broek, M.V.D.; Ramírez, A.; Patel, M.; Worrell, E. Modelling the future CO2 abatement potentials of energy efficiency and CCS: The case of the Dutch industry. Int. J. Greenh. Gas Control. 2013, 18, 23–37. [Google Scholar] [CrossRef] [Green Version]
- Bhave, A.; Taylor, R.H.; Fennell, P.; Livingston, W.R.; Shah, N.; Mac Dowell, N.; Dennis, J.; Kraft, M.; Pourkashanian, M.; Insa, M.; et al. Screening and techno-economic assessment of biomass-based power generation with CCS technologies to meet 2050 CO2 targets. Appl. Energy 2017, 190, 481–489. [Google Scholar] [CrossRef] [Green Version]
- Pröll, T.; Zerobin, F. Biomass-based negative emission technology options with combined heat and power generation. Mitig. Adapt. Strat. Glob. Chang. 2019, 24, 1307–1324. [Google Scholar] [CrossRef] [Green Version]
- Material Economics. Industrial Transformation 2050—Pathways to Net-Zero Emissions from EU Heavy Industry; Material Economics: Stockholm, Sweden, 2019. [Google Scholar]
- Brown, T. What Drives New Investments in Low-Carbon Ammonia Production? One Million Tons per Day Demand. Ammonia Industry. 2018. Available online: https://ammoniaindustry.com/what-drives-new-investments-in-low-carbon-ammonia/ (accessed on 11 June 2021).
- IRENA. Global Energy Transformation: A Roadmap to 2050, 2019th ed.; IRENA: Abu Dhabi, United Arab Emirates, 2019. [Google Scholar]
- Haro, P.; Ollero, P.; Trippe, F. Technoeconomic assessment of potential processes for bio-ethylene production. Fuel Process. Technol. 2013, 114, 35–48. [Google Scholar] [CrossRef]
- Fasihi, M.; Bogdanov, D.; Breyer, C. Techno-Economic Assessment of Power-to-Liquids (PtL) Fuels Production and Global Trading Based on Hybrid PV-Wind Power Plants. In Energy Procedia, Proceedings of the 10th International Renewable Energy Storage Conference, IRES 2016, Düsseldorf, Germany, 15–17 March 2016; Elsevier: Amsterdam, The Netherlands, 2016; pp. 243–268. [Google Scholar]
- Ikäheimo, J.; Kiviluoma, J.; Weiss, R.; Holttinen, H. Power-to-ammonia in future North European 100 % renewable power and heat system. Int. J. Hydrogen Energy 2018, 43, 17295–17308. [Google Scholar] [CrossRef]
- Gilbert, P.; Thornley, P. Energy and carbon balance of ammonia production from biomass gasification. In Proceedings of the Bioten Conference on Biomass, Bioenergy and Biofuels, Birmingham, UK, 21–23 September 2010; CPL Press: Birmingham, UK, 2010. [Google Scholar]
- Renó, M.L.G.; Lora, E.E.S.; Palacio, J.C.E.; Venturini, O.J.; Buchgeister, J.; Almazan, O. A LCA (life cycle assessment) of the methanol production from sugarcane bagasse. Energy 2011, 36, 3716–3726. [Google Scholar] [CrossRef]
- Uddin, M.; Chowdhury, A.; Anderson, K.; Chaudhuri, K. The effect of COVID-19 pandemic on global stock market volatility: Can economic strength help to manage the uncertainty? J. Bus. Res. 2021, 128, 31–44. [Google Scholar] [CrossRef]
- Ezeaku, H.C.; Asongu, S.A.; Nnanna, J. Volatility of international commodity prices in times of COVID-19: Effects of oil supply and global demand shocks. Extr. Ind. Soc. 2021, 8, 257–270. [Google Scholar] [CrossRef]
- Bakas, D.; Triantafyllou, A. Commodity price volatility and the economic uncertainty of pandemics. Econ. Lett. 2020, 193, 109283. [Google Scholar] [CrossRef]
- Gaudenzi, B.; Zsidisin, G.A.; Pellegrino, R. Measuring the financial effects of mitigating commodity price volatility in supply chains. Supply Chain Manag. Int. J. 2020, 26, 17–31. [Google Scholar] [CrossRef]
- Gabrielli, P.; Gazzani, M.; Mazzotti, M. The Role of Carbon Capture and Utilization, Carbon Capture and Storage, and Biomass to Enable a Net-Zero-CO2 Emissions Chemical Industry. Ind. Eng. Chem. Res. 2020, 59, 7033–7045. [Google Scholar] [CrossRef] [Green Version]
- Langholtz, M.H.; Stokes, B.J.; Eaton, L.M. 2016 Billion-Ton Report: Advancing Domestic Resources for a Thriving Bioeconomy; Economic Availability of Feedstocks (No. ORNL/TM-2016/160); US Department of Energy: Oak Ridge, TN, USA, 2016; Volume 1.
- Mandley, S.; Daioglou, V.; Junginger, H.; van Vuuren, D.; Wicke, B. EU bioenergy development to 2050. Renew. Sustain. Energy Rev. 2020, 127, 109858. [Google Scholar] [CrossRef]
- Daioglou, V.; Doelman, J.C.; Wicke, B.; Faaij, A.; van Vuuren, D.P. Integrated assessment of biomass supply and demand in climate change mitigation scenarios. Glob. Environ. Chang. 2019, 54, 88–101. [Google Scholar] [CrossRef] [Green Version]
- IHS Markit. Plastics Recycling. In Chemical Economics Handbook; IHS Markit: London, UK, 2019. [Google Scholar]


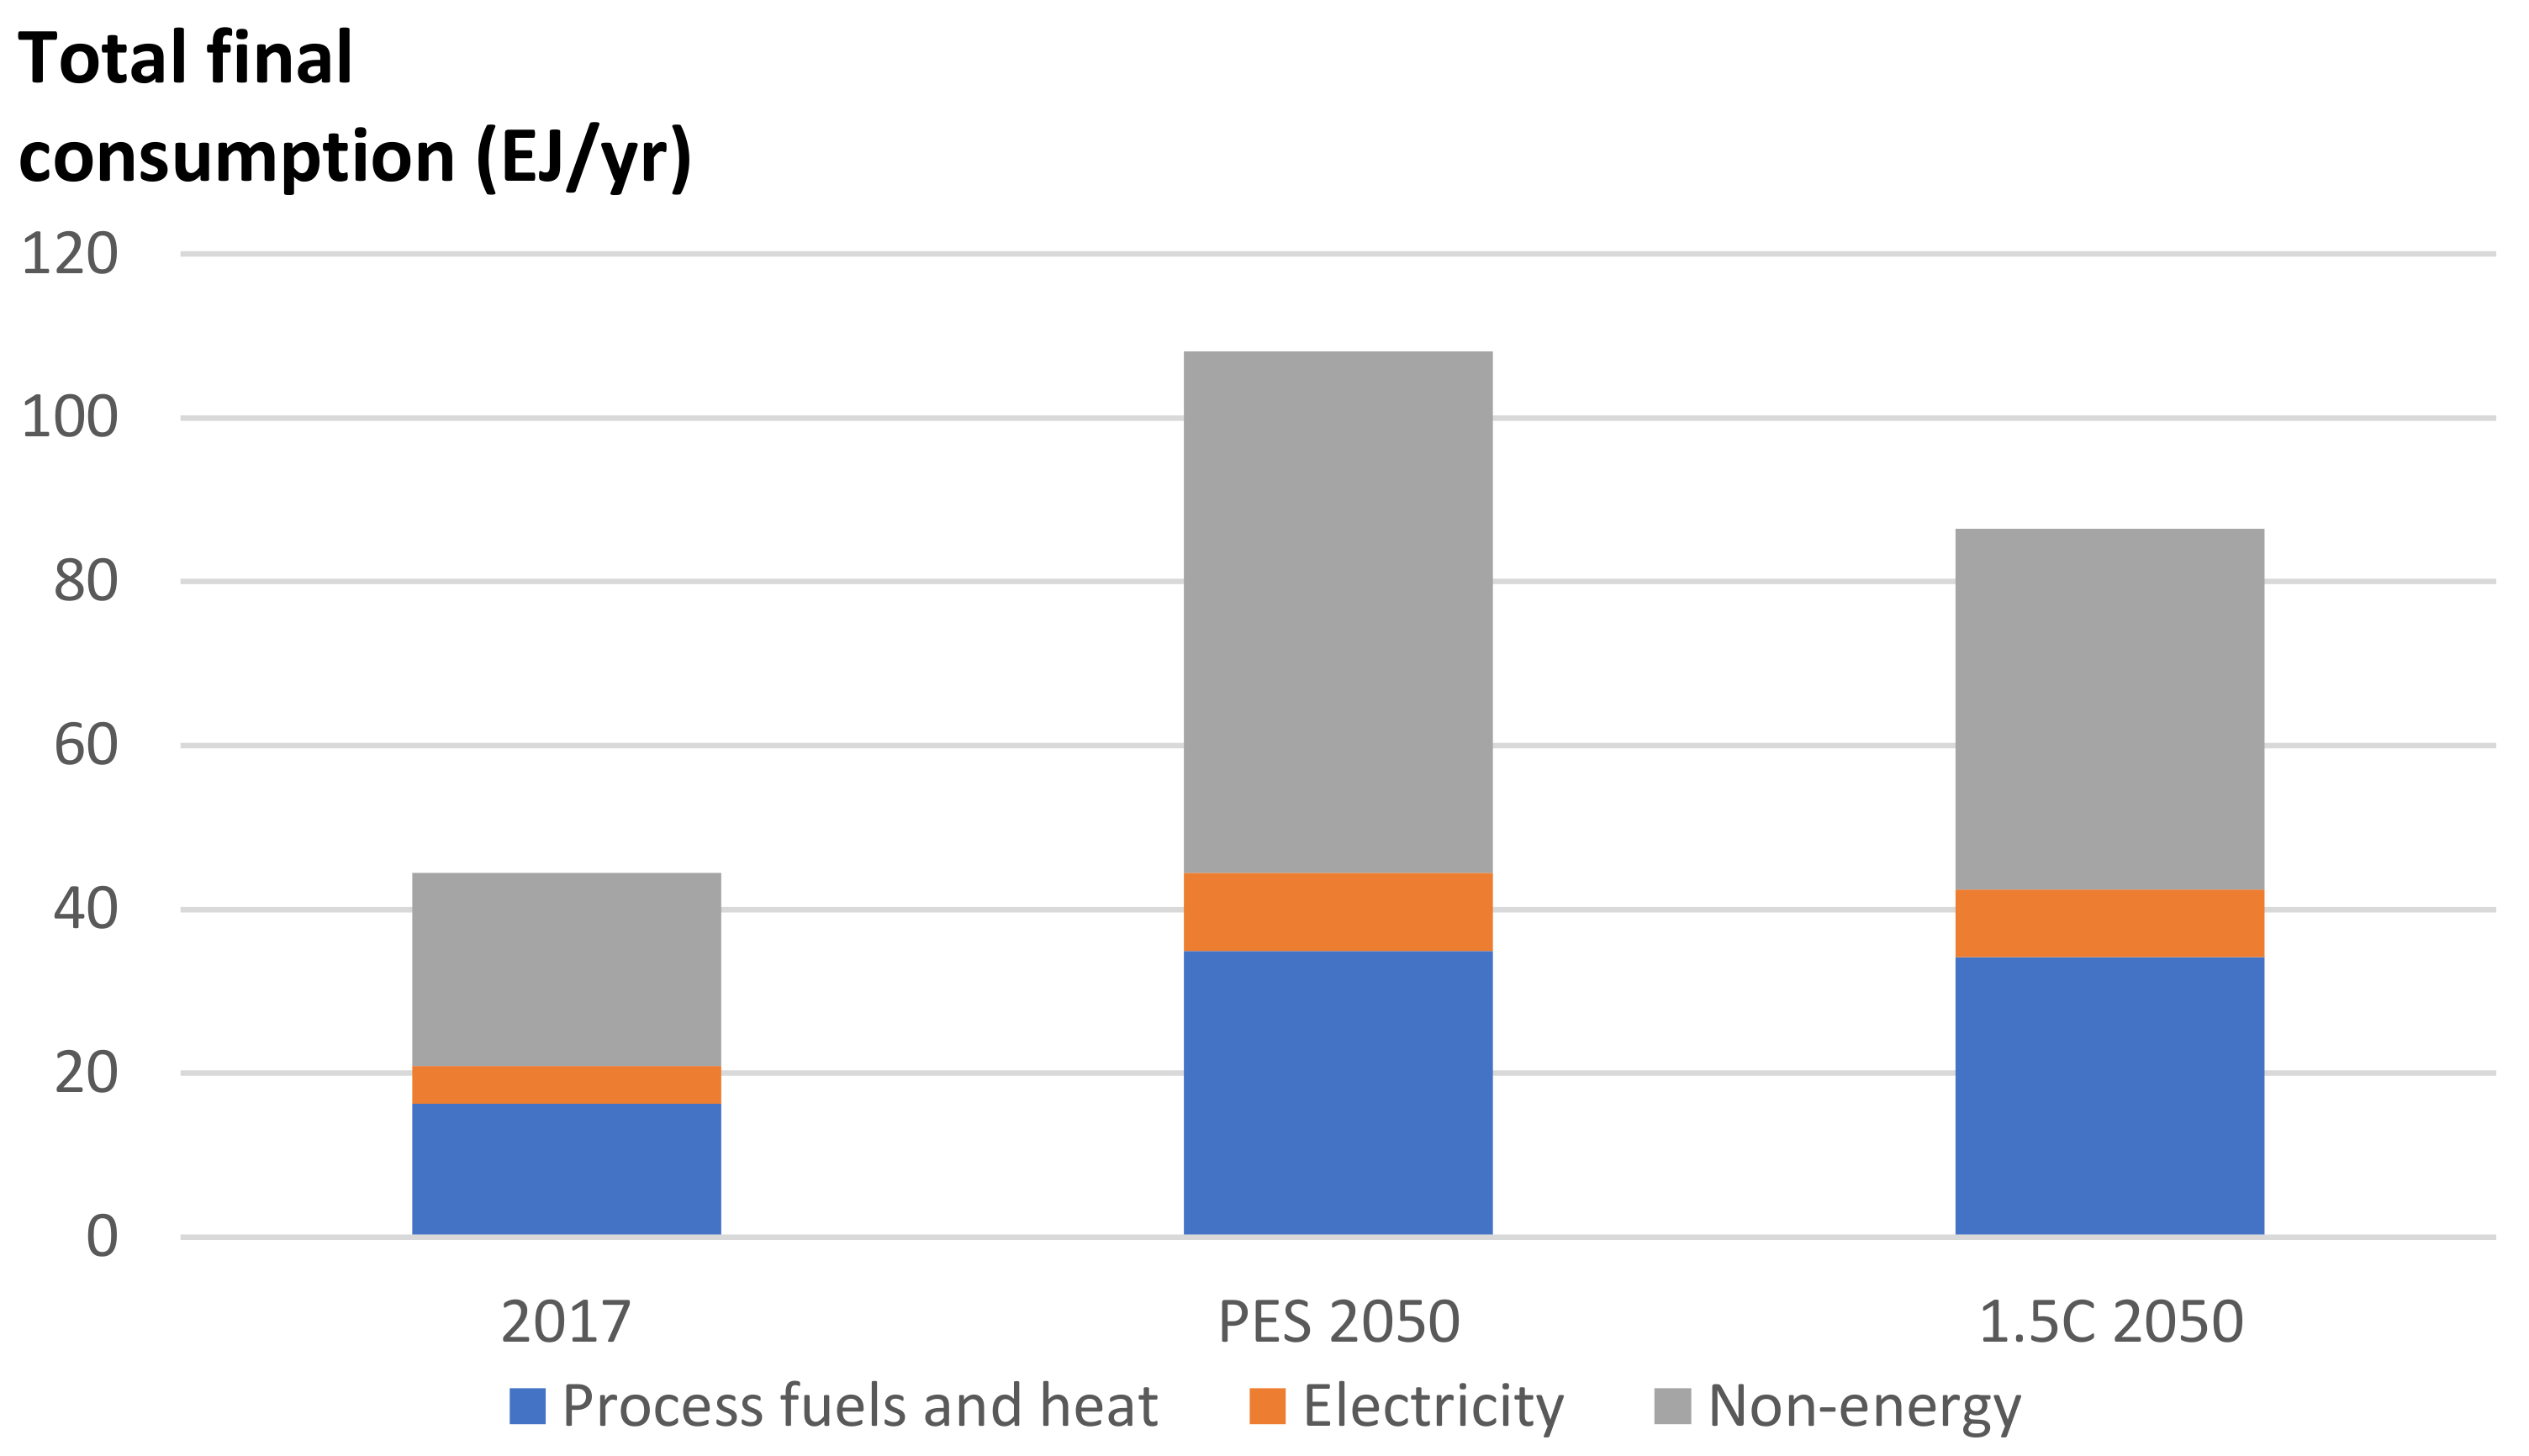
| [EJ/yr] | Energy | Non-Energy | Total | Total in This Analysis |
|---|---|---|---|---|
| Coal | 4.5 | 0.1 | 4.7 | 4.7 |
| Natural gas | 5.7 | 7.7 | 13.5 | 14.0 |
| Oil | 2.6 | 18.9 | 21.6 | 18.6 |
| Biomass and waste | 0.1 | 1.0 | 1.1 | 1.1 |
| Heat | 2.4 | - | 2.4 | 2.4 |
| Electricity | 4.6 | - | 4.6 | 4.6 |
| Total | 20.0 | 27.8 | 47.8 | 45.4 |
| [EJ/yr] | |
|---|---|
| Ammonia | 6.2 |
| Methanol | 2.7 |
| High vale chemicals | 21.2 |
| Carbon black | 1.0 |
| Total | 31.1 |
| Emissions Mitigated | Mitigation Cost Range | |
|---|---|---|
| [Gt CO2/yr] | [USD/t CO2] | |
| Demand reduction | 0.76 | 0–50 |
| Energy efficiency | 0.72 | 25–125 |
| Solar process heat | 0.03 | 0–100 |
| Biomass process heat | 0.13 | 0–75 |
| Recycling | 0.24 | −50–300 |
| Energy recovery + CCS | 0.31 | −50–100 |
| Biobased chemicals | 0.13 | −100–400 |
| CCS for combustion and processes | 1.18 | 0–200 |
| H2-based chemicals | 0.54 | −100–300 |
| Industry relocation | 0.05 | 0–50 |
| Renewable power | 0.73 | −25–25 |
| Total | 4.79 | −20–150 |
| Unit | 2017 | 2050 PES | 2050 1.5 °C Case | 1.5 °C case % World Demand 2050 | |
|---|---|---|---|---|---|
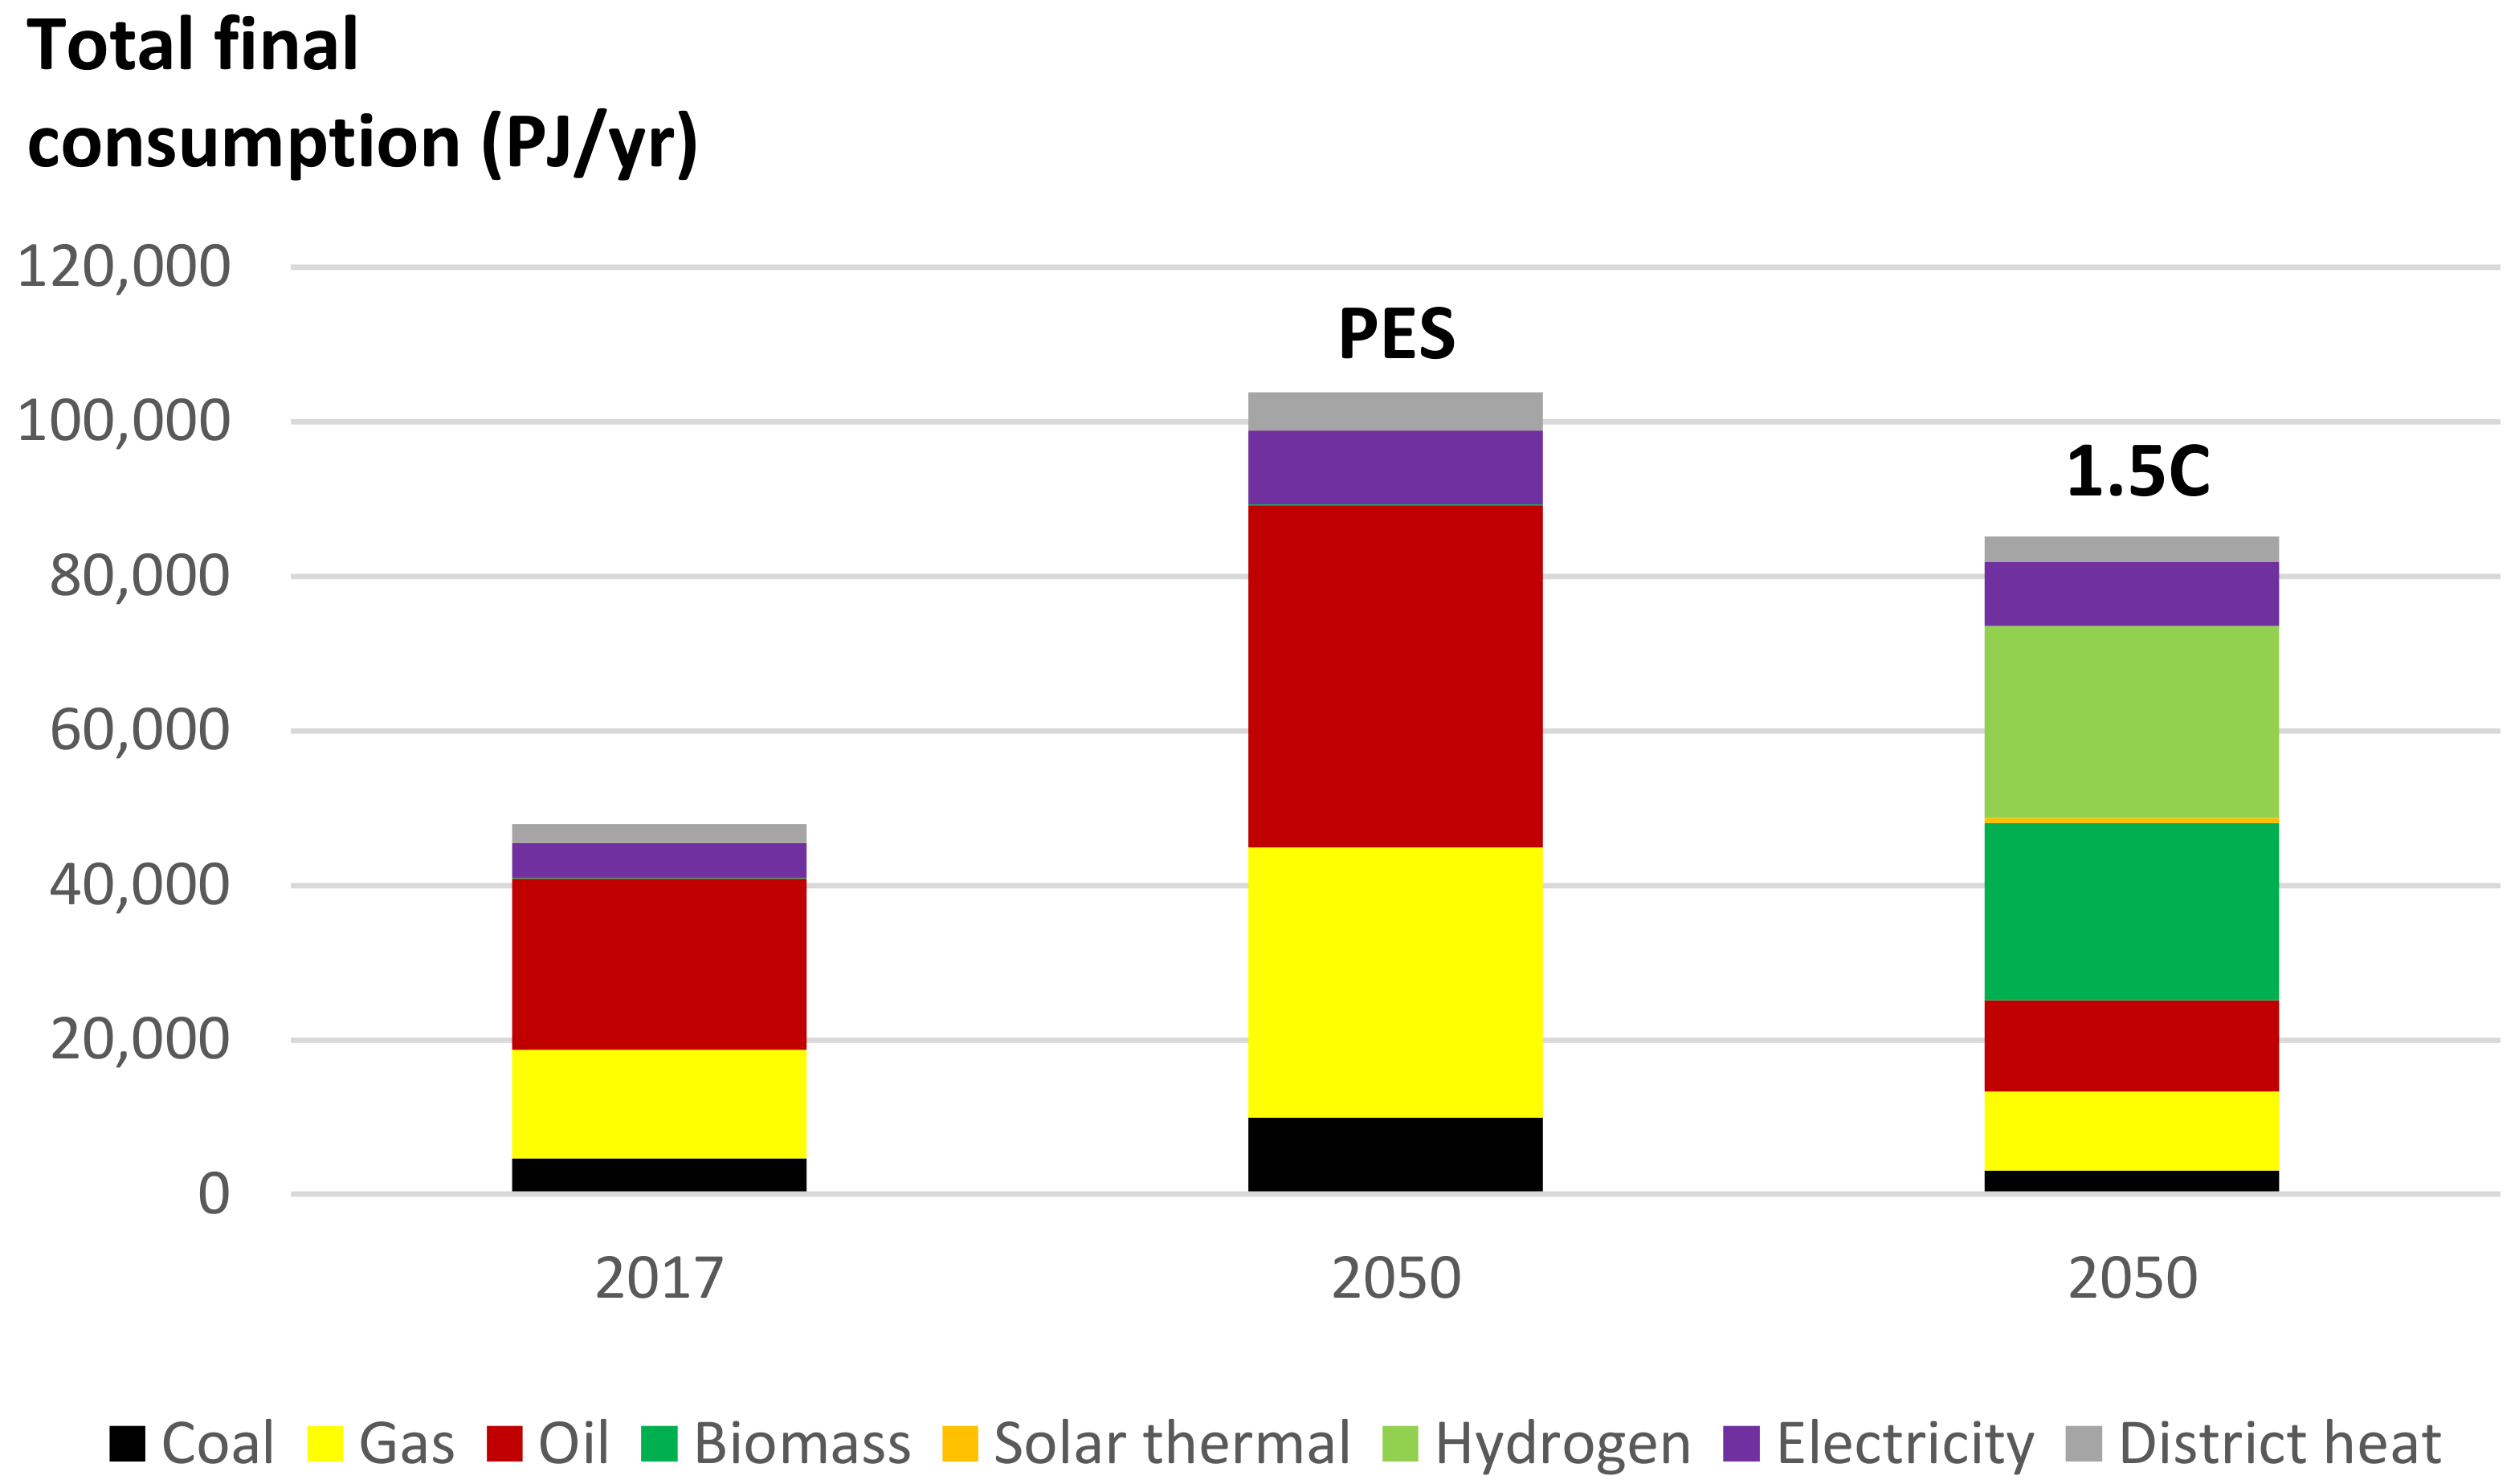
| Oil demand | [mbd] | 7.1 | 18.1 | 5.2 | 60 |
| Gas demand | [BCM] | 525 | 1343 | 357 | 11 |
| Biomass use | [Mt/yr] | 5.1 | 9.0 | 1320 | 15 |
| BECCS 1 | [Mt/yr] | 0.0 | 0.0 | 550 | 6.5 |
| Fossil CCS 2 | [Mt/yr] | 0.0 | 0.0 | 940 | 11 |
| Electricity demand 3 | [TWh/yr] | 1278 | 2645 | 2307 | 3.2 |
| Green hydrogen demand | [Mt/yr] | 0.0 | 0.0 | 210 | 34 |
| Hydrogen electrolyser capacity 4 | [GW] | 0.0 | 0.0 | 2468 | 48 |
| Heat pumps | [GW] | 73 | 30 | ||
| Solar thermal | [mln m2] | 190 | 5 |
Publisher’s Note: MDPI stays neutral with regard to jurisdictional claims in published maps and institutional affiliations. |
© 2021 by the authors. Licensee MDPI, Basel, Switzerland. This article is an open access article distributed under the terms and conditions of the Creative Commons Attribution (CC BY) license (https://creativecommons.org/licenses/by/4.0/).
Share and Cite
Saygin, D.; Gielen, D. Zero-Emission Pathway for the Global Chemical and Petrochemical Sector. Energies 2021, 14, 3772. https://doi.org/10.3390/en14133772
Saygin D, Gielen D. Zero-Emission Pathway for the Global Chemical and Petrochemical Sector. Energies. 2021; 14(13):3772. https://doi.org/10.3390/en14133772
Chicago/Turabian StyleSaygin, Deger, and Dolf Gielen. 2021. "Zero-Emission Pathway for the Global Chemical and Petrochemical Sector" Energies 14, no. 13: 3772. https://doi.org/10.3390/en14133772
APA StyleSaygin, D., & Gielen, D. (2021). Zero-Emission Pathway for the Global Chemical and Petrochemical Sector. Energies, 14(13), 3772. https://doi.org/10.3390/en14133772