
Pore-Scale Modeling of Air–Water Two Phase Flow and Oxygen Transport in Gas Diffusion Layer of Proton Exchange Membrane Fuel Cell


Abstract
:1. Introduction
2. The Computational Domain and the Physicochemical Processes
3. The Lattice Boltzmann Method
3.1. Multiphase Flow Model
3.2. Mass Transport Model
3.3. Source/Sink Term for Multiphase Flow
4. Results and Discussion
4.1. Multiphase Reactive Transport in the 3D Domain
4.2. Effects of the Fracture Number
5. Conclusions
Author Contributions
Funding
Acknowledgments
Conflicts of Interest
Abbreviations
| CL | Catalyst Layer |
| GC | Gas Channel |
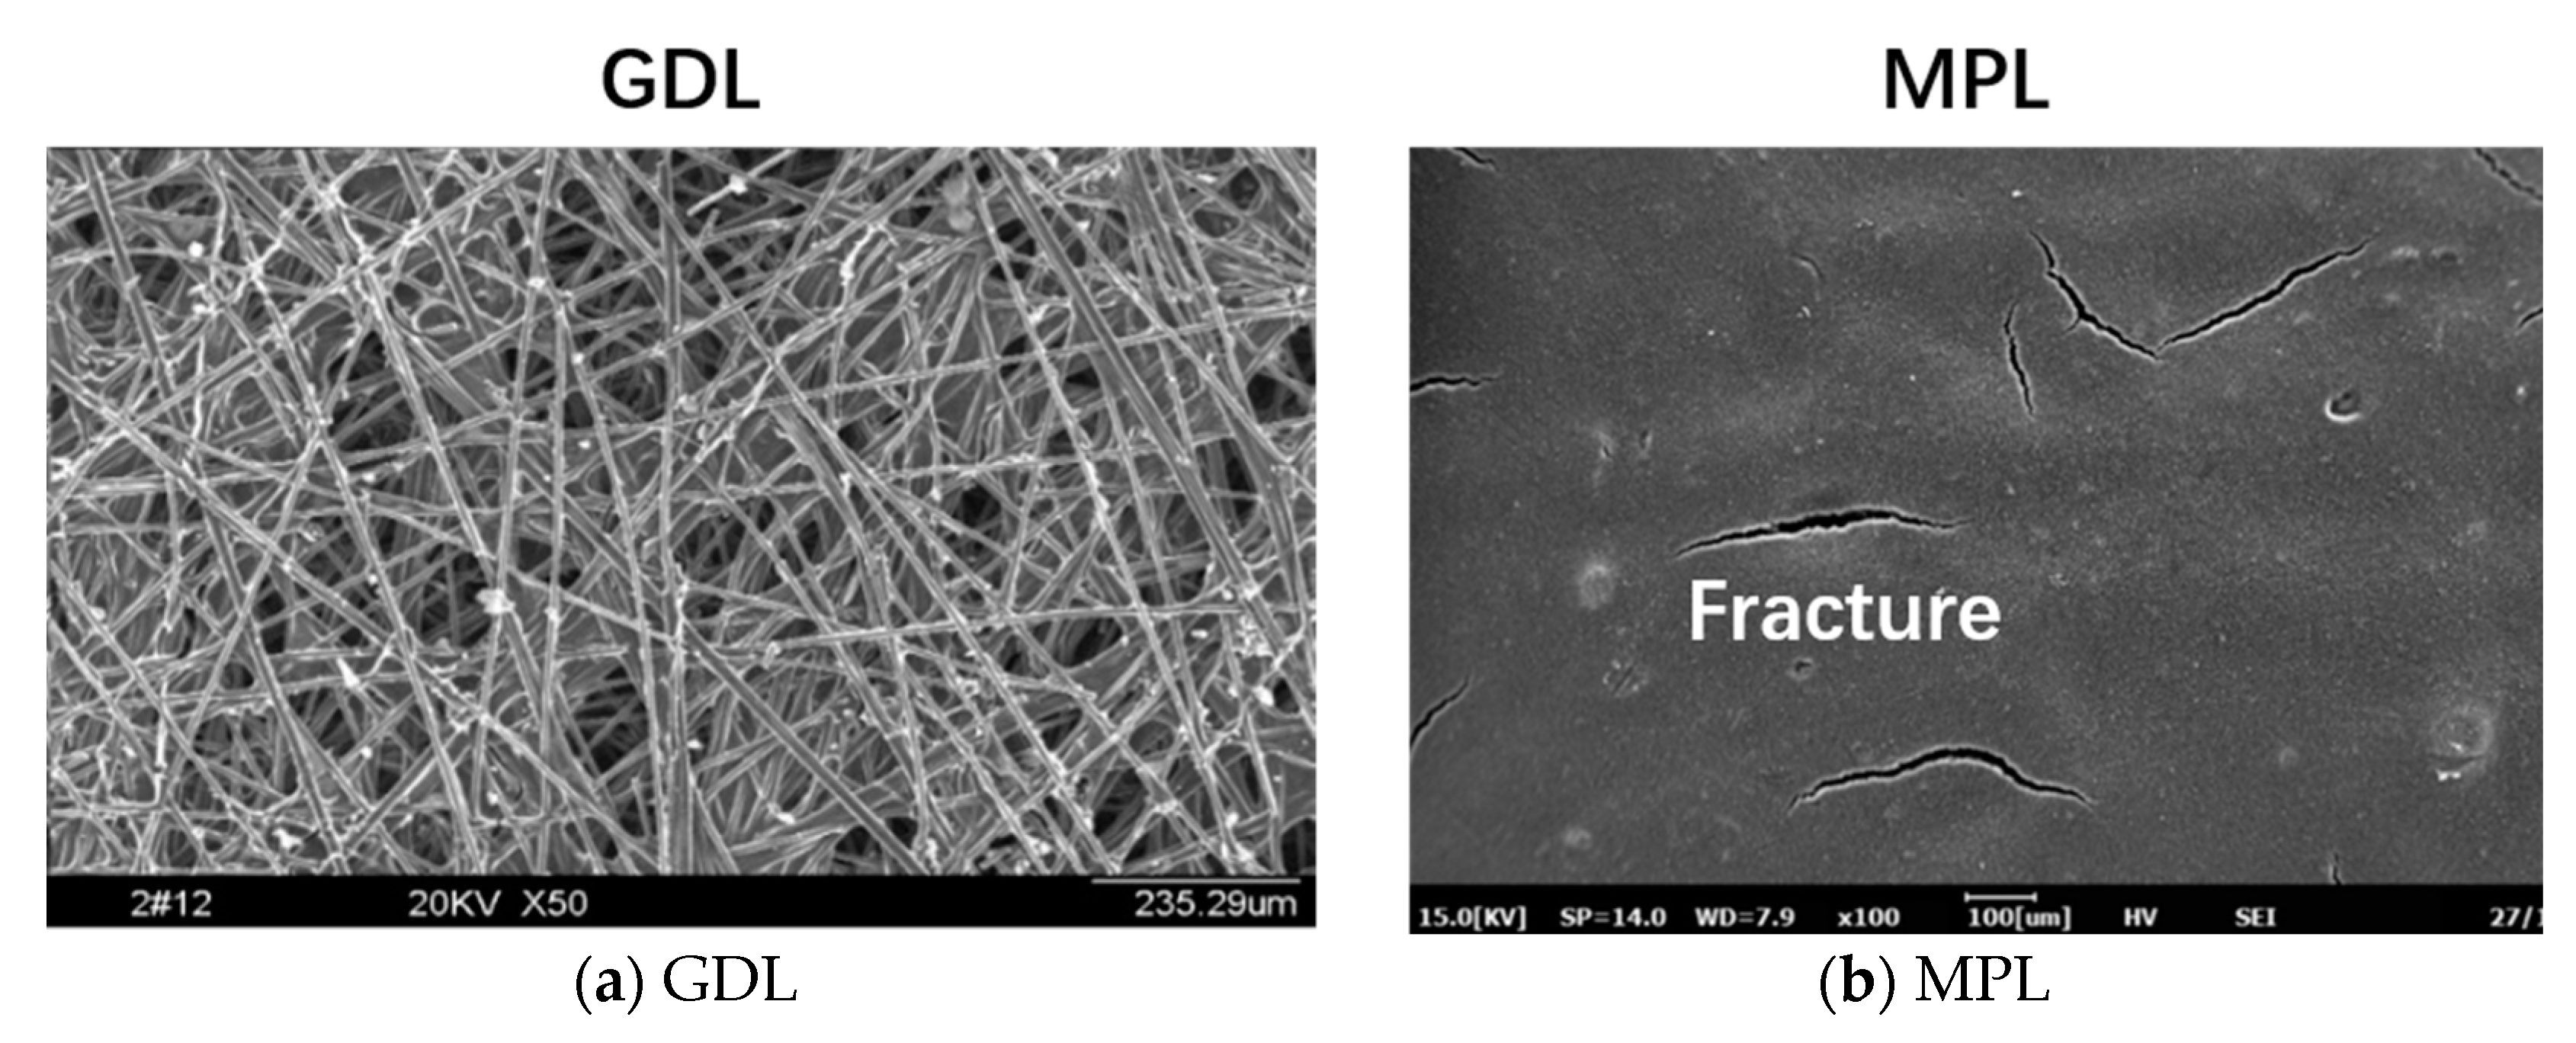
| GDL | Gas Diffusion Layer |
| LBM | Lattice Boltzmann Method |
| MPL | Microscopic Porous Layer |
| MRT | Multiple Relaxation Time |
| PEMFC | Proton Exchange Membrane Fuel Cell |
| REV | Representative Elementary Volume |
| TPB | Triple-Phase Boundary |
| XCT | X-ray Computed Tomography |
References
- Li, H.; Tang, Y.; Wang, Z.; Shi, Z.; Wu, S.; Song, D.; Zhang, J.; Fatih, K.; Zhang, J.; Wang, H.; et al. A review of water flooding issues in the proton exchange membrane fuel cell. J. Power Sources 2008, 178, 103–117. [Google Scholar] [CrossRef]
- Nam, J.H.; Kaviany, M. Effective diffusivity and water-saturation distribution in single- and two-layer PEMFC diffusion medium. Int. J. Heat Mass Transf. 2003, 46, 4595–4611. [Google Scholar] [CrossRef]
- Mortazavi, M.; Tajiri, K. Effect of the PTFE content in the gas diffusion layer on water transport in polymer electrolyte fuel cells (PEFCs). J. Power Sources 2014, 245, 236–244. [Google Scholar] [CrossRef]
- Sadeghifar, H.; Djilali, N.; Bahrami, M. Effect of Polytetrafluoroethylene (PTFE) and micro porous layer (MPL) on thermal conductivity of fuel cell gas diffusion layers: Modeling and experiments. J. Power Sources 2014, 248, 632–641. [Google Scholar] [CrossRef]
- Deevanhxay, P.; Sasabe, T.; Tsushima, S.; Hirai, S. Observation of dynamic liquid water transport in the microporous layer and gas diffusion layer of an operating PEM fuel cell by high-resolution soft X-ray radiography. J. Power Sources 2013, 230, 38–43. [Google Scholar] [CrossRef]
- Markötter, H.; Manke, I.; Krüger, P.; Arlt, T.; Haussmann, J.; Klages, M.; Riesemeier, H.; Hartnig, C.; Scholta, J.; Banhart, J. Investigation of 3D water transport paths in gas diffusion layers by combined in-situ synchrotron X-ray radiography and tomography. Electrochem. Commun. 2011, 13, 1001–1004. [Google Scholar] [CrossRef]
- Ince, U.U.; Markötter, H.; George, M.G.; Liu, H.; Ge, N.; Lee, J.; Alrwashdeh, S.S.; Zeis, R.; Messerschmidt, M.; Scholta, J.; et al. Effects of compression on water distribution in gas diffusion layer materials of PEMFC in a point injection device by means of synchrotron X-ray imaging. Int. J. Hydrogen Energy 2018, 43, 391–406. [Google Scholar] [CrossRef]
- Flückiger, R.; Marone, F.; Stampanoni, M.; Wokaun, A.; Büchi, F.N. Investigation of liquid water in gas diffusion layers of polymer electrolyte fuel cells using X-ray tomographic microscopy. Electrochim. Acta 2011, 56, 2254–2262. [Google Scholar] [CrossRef]
- Sabzpoushan, S.; Jafari Mosleh, H.; Kavian, S.; Saffari Pour, M.; Mohammadi, O.; Aghanajafi, C.; Hossein Ahmadi, M. Nonisothermal two-phase modeling of the effect of linear nonuniform catalyst layer on polymer electrolyte membrane fuel cell performance. Energy Sci. Eng. 2020, 8, 3575–3587. [Google Scholar] [CrossRef]
- Wang, C.Y.; Cheng, P. Multiphase Flow and Heat Transfer in Porous Media. In Advances in Heat Transfer; Hartnett, J.P., Irvine, T.F., Jr., Cho, Y.I., Greene, G.A., Eds.; Elsevier: Amsterdam, The Netherlands, 1997; Volume 30, pp. 93–196. [Google Scholar]
- Pasaogullari, U.; Wang, C.-Y. Two-phase transport and the role of micro-porous layer in polymer electrolyte fuel cells. Electrochim. Acta 2004, 49, 4359–4369. [Google Scholar] [CrossRef]
- Udell, K.S. Heat transfer in porous media considering phase change and capillarity—the heat pipe effect. Int. J. Heat Mass Transf. 1985, 28, 485–495. [Google Scholar] [CrossRef]
- Leverett, M. Capillary Behavior in Porous Solids. Pet. Dev. Technol. 1941, 142, 152–169. [Google Scholar] [CrossRef]
- Wang, X.-D.; Wang, Y.-L.; Chen, Y.; Si, C.; Su, A.; Lee, D.-J. Proton exchange membrane fuel cell modeling with diffusion layer-based and sands-based capillary pressure correlations: Comparative study. J. Taiwan Inst. Chem. Eng. 2014, 45, 1532–1541. [Google Scholar] [CrossRef]
- Gostick, J.T.; Fowler, M.W.; Ioannidis, M.; Pritzker, M.D.; Volfkovich, Y.; Sakars, A. Capillary pressure and hydrophilic porosity in gas diffusion layers for polymer electrolyte fuel cells. J. Power Sources 2006, 156, 375–387. [Google Scholar] [CrossRef]
- Kumbur, E.C.; Sharp, K.V.; Mench, M.M. Validated leverett approach for multiphase flow in PEFC diffusion media: I. hydrophobicity effect. J. Electrochem. Soc. 2007, 154, B1295–B1304. [Google Scholar] [CrossRef]
- Nguyen, T.V.; Lin, G.; Ohn, H.; Wang, X. Measurement of Capillary Pressure Property of Gas Diffusion Media Used in Proton Exchange Membrane Fuel Cells. Electrochem. Solid-State Lett. 2008, 11, B127–B131. [Google Scholar] [CrossRef] [Green Version]
- Molaeimanesh, G.R.; Saeidi Googarchin, H.; Qasemian Moqaddam, A. Lattice Boltzmann simulation of proton exchange membrane fuel cells—A review on opportunities and challenges. Int. J. Hydrogen Energy 2016, 41, 22221–22245. [Google Scholar] [CrossRef]
- Chen, L.; Kang, Q.; Mu, Y.; He, Y.; Tao, W. A critical review of the pseudopotential multiphase lattice Boltzmann model: Methods and applications. Int. J. Heat Mass Transf. 2014, 76, 210–236. [Google Scholar] [CrossRef]
- Hao, L.; Cheng, P. Lattice Boltzmann simulations of water transport in gas diffusion layer of a polymer electrolyte membrane fuel cell. J. Power Sources 2010, 195, 3870–3881. [Google Scholar] [CrossRef]
- Yu, J.; Froning, D.; Reimer, U.; Lehnert, W. Polytetrafluorethylene effects on liquid water flowing through the gas diffusion layer of polymer electrolyte membrane fuel cells. J. Power Sources 2019, 438, 226975. [Google Scholar] [CrossRef]
- Kakaee, A.H.; Molaeimanesh, G.R.; Elyasi Garmaroudi, M.H. Impact of PTFE distribution across the GDL on the water droplet removal from a PEM fuel cell electrode containing binder. Int. J. Hydrogen Energy 2018, 43, 15481–15491. [Google Scholar] [CrossRef]
- Jinuntuya, F.; Whiteley, M.; Chen, R.; Fly, A. The effects of gas diffusion layers structure on water transportation using X-ray computed tomography based Lattice Boltzmann method. J. Power Sources 2018, 378, 53–65. [Google Scholar] [CrossRef] [Green Version]
- Jeon, D.H.; Kim, H. Effect of compression on water transport in gas diffusion layer of polymer electrolyte membrane fuel cell using lattice Boltzmann method. J. Power Sources 2015, 294, 393–405. [Google Scholar] [CrossRef]
- Deng, H.; Hou, Y.; Jiao, K. Lattice Boltzmann simulation of liquid water transport inside and at interface of gas diffusion and micro-porous layers of PEM fuel cells. Int. J. Heat Mass Transf. 2019, 140, 1074–1090. [Google Scholar] [CrossRef]
- Zhang, D.; Cai, Q.; Gu, S. Three-dimensional lattice-Boltzmann model for liquid water transport and oxygen diffusion in cathode of polymer electrolyte membrane fuel cell with electrochemical reaction. Electrochim. Acta 2018, 262, 282–296. [Google Scholar] [CrossRef]
- Chen, L.; Luan, H.; He, Y.; Tao, W. Pore-scale flow and mass transport in gas diffusion layer of proton exchange membrane fuel cell with interdigitated flow fields. Int. J. Therm. Sci. 2012, 51, 132–144. [Google Scholar] [CrossRef]
- Mukherjee, P.P.; Wang, C.; Kang, Q. Mesoscopic modeling of two-phase behavior and flooding phenomena in polymer electrolyte fuel cells. Electrochim. Acta 2009, 54, 6861–6875. [Google Scholar] [CrossRef]
- Lenormand, R.; Touboul, E.; Zarcone, C. Numerical models and experiments on immiscible displacements in porous media. J. Fluid Mech. 1988, 189, 165–187. [Google Scholar] [CrossRef]
- Sakaida, S.; Tabe, Y.; Chikahisa, T. Large scale simulation of liquid water transport in a gas diffusion layer of polymer electrolyte membrane fuel cells using the lattice Boltzmann method. J. Power Sources 2017, 361, 133–143. [Google Scholar] [CrossRef]
- Porter, M.L.; Coon, E.T.; Kang, Q.; Moulton, J.D.; Carey, J.W. Multicomponent interparticle-potential lattice Boltzmann model for fluids with large viscosity ratios. Phys. Rev. E 2012, 86, 036701. [Google Scholar] [CrossRef] [PubMed]
- d’Humières, D. Multiple–relaxation–time lattice Boltzmann models in three dimensions. Philos. Trans. R. Soc. Lond. A Math. Phys. Eng. Sci. 2002, 360, 437451. [Google Scholar] [CrossRef] [PubMed]
- Aursjø, O.; Jettestuen, E.; Vinningland, J.L.; Hiorth, A. On the inclusion of mass source terms in a single-relaxation-time lattice Boltzmann method. Phys. Fluids 2018, 30, 057104. [Google Scholar] [CrossRef]
- Chen, L.; Zhang, R.; Kang, Q.; Tao, W. Pore-scale study of pore-ionomer interfacial reactive transport processes in proton exchange membrane fuel cell catalyst layer. Chem. Eng. J. 2020, 391, 123590. [Google Scholar] [CrossRef]
- Chen, L.; Kang, Q.; Tao, W. Pore-scale numerical study of multiphase reactive transport processes in cathode catalyst layers of proton exchange membrane fuel cells. Int. J. Hydrogen Energy 2021, 46, 13283–13297. [Google Scholar] [CrossRef]
- Chen, L.; Zhang, R.; He, P.; Kang, Q.; He, Y.-L.; Tao, W.-Q. Nanoscale simulation of local gas transport in catalyst layers of proton exchange membrane fuel cells. J. Power Sources 2018, 400, 114–125. [Google Scholar] [CrossRef]
- Fang, W.; Tang, Y.; Chen, L.; Kang, Q.; Tao, W. Influences of the perforation on effective transport properties of gas diffusion layers. Int. J. Heat Mass Transf. 2018, 126, 243–255. [Google Scholar] [CrossRef]


Publisher’s Note: MDPI stays neutral with regard to jurisdictional claims in published maps and institutional affiliations. |
© 2021 by the authors. Licensee MDPI, Basel, Switzerland. This article is an open access article distributed under the terms and conditions of the Creative Commons Attribution (CC BY) license (https://creativecommons.org/licenses/by/4.0/).
Share and Cite
Zhou, C.; Guo, L.; Chen, L.; Tian, X.; He, T.; Yang, Q. Pore-Scale Modeling of Air–Water Two Phase Flow and Oxygen Transport in Gas Diffusion Layer of Proton Exchange Membrane Fuel Cell. Energies 2021, 14, 3812. https://doi.org/10.3390/en14133812
Zhou C, Guo L, Chen L, Tian X, He T, Yang Q. Pore-Scale Modeling of Air–Water Two Phase Flow and Oxygen Transport in Gas Diffusion Layer of Proton Exchange Membrane Fuel Cell. Energies. 2021; 14(13):3812. https://doi.org/10.3390/en14133812
Chicago/Turabian StyleZhou, Chongbo, Lingyi Guo, Li Chen, Xin Tian, Tiefeng He, and Qinghua Yang. 2021. "Pore-Scale Modeling of Air–Water Two Phase Flow and Oxygen Transport in Gas Diffusion Layer of Proton Exchange Membrane Fuel Cell" Energies 14, no. 13: 3812. https://doi.org/10.3390/en14133812