Abstract
Thermal barrier coating (TBC) plays a vital role in the gas turbine combustor liner (CL) to mitigate the internal heat transfer from combustion gas to the CL and enhance the parent material lifetime of the CL. This present study examined the thermal analysis and creep lifetime prediction based on three different TBC thicknesses, 400, 800, and 1200 μm, coated on the inner CL using the coupled computational fluid dynamics/finite element method. The simulation method was divided into three models to minimize the amount of computational work involved. The Eddy Dissipation Model was used in the first model to simulate premixed methane-air combustion, and the wall temperature of the inner CL was obtained. The conjugate heat transfer simulation on the external cooling flows from the rib turbulator, impingement jet, and cross flow, and the wall temperature of the outer CL was obtained in the second model. The thermal analysis was carried out in the third model using three different TBC thicknesses and incorporating the wall data from the first and second model. The effect of increasing TBC thickness shows that the TBC surface temperature was increased. Thereby, the inner CL metal temperature was decreased due to the TBC thickness as well as the material properties of Yttria Stabilized Zirconia, which has low thermal conductivity and a high thermal expansion coefficient. With the increase in TBC thickness, the average temperature difference between the TBC surface and the inner metal surface increased. In contrast, the average temperature difference between the inner and outer metal surfaces remained nearly constant. The von Mises equivalent stress, based on the material property and thermal expansion coefficient, was determined and used to find the creep lifetime of the CL using the Larson–Miller rupture curve for all TBC thickness cases in order to analyze the thermo-structure. Except in the C-channel, the increasing TBC thickness was found to effectively increase the CL lifespan. Furthermore, the case without TBC was compared with the damaged CL with cracks due to thermal stress, which was prevented by increasing TBC thickness shown in this present study.
1. Introduction
In gas turbine engines, the combustor design and development are more important to achieve a reduction in size, weight, manufacturing costs, and maintenance as well as an increase in reliability and durability. The high flame temperature, of about 1826 K, in F-class gas turbines causes structural damage on combustor liners due to a heavy thermal loading when operating for a long period of time, which also affects the life time of engine components eventually [1]. Therefore, advanced wall-cooling techniques are required for thermal protection to the combustor liner to keep away from the structural damages. There are various cooling techniques, but the most effective cooling techniques in modern times are the angled effusion cooling hole (AEC) and thermal barrier coatings (TBC) techniques. When using the AEC hole technique, multiple holes are drilled on the combustor liner wall at a shallow angle to inject the cooling air to remove heat from the metal surface initially, after which it forms a thermal barrier between the liner wall side and hot combustion gases. The AEC hole is used broadly in the modern gas turbine combustor. However, the liner weight is increased by 20% due to the thicker wall requirement for drilling, which is a significant drawback [2]. Therefore, researchers have found an alternative and promising alternative, namely, to spray a thermal coating material on the inner side of the combustor liner. In this way, the thermal coating can reduce the wall temperature of the base metal by 150 K. In the past six decades, researchers have attempted to find adequate liner materials that can withstand higher temperatures [2,3]. Currently, nickel- or cobalt-based alloys, such as NiCoCrAlY, NiAl, etc., are used to fabricate the combustor liner, where the carbon composites are used to enrich the material properties to withstand the higher temperature, whereby the TBC is an attractive approach to enhance the combustor liner life by coating materials of low emissivity and low thermal conductivity [4]. By applying the TBC, the hot streaking or uneven combustion gas temperature distribution on the base metal of liner can be removed by reflecting the incident gas radiation from the flame and forming a thermal barrier between the base metal and hot gases [5]. A typical thickness of TBC is 0.1–0.5 mm [2].
The deterioration of the material due to the more significant heat flux is retarded with the TBC, and thus, the operating temperature ranges can be raised to a greater degree [6,7]. The operating temperature of the turbine inlet temperature needs to be higher for maximum performance, which can be easily accomplished by a higher flame temperature in the combustor, and the increasing flame temperature can cause structural failure of the combustor. Therefore, the TBC has two coating layers: a bond coat using NiCrAlY/MCrAiY and a top coat using Yttria Stabilized Zirconia (YSZ). Based on the coating thickness, the TBC is classified into the B- and C-class, in which the B-class coating is about 355.6 ± 101.6 μm thick and C-class coating is about 508 ± 50.8 μm thick [8,9]. The ceramic thermal coating material is mainly applied on the inner wall combustor liner to provide the thermal barrier [10,11].
The 7FA combustor is a type of dry low NOx emission system. The assembled parts of the combustor are swirl injectors for premixed combustion and cross flow and an impinging sleeve surrounding the liner and transition piece to provide a flow channel between them for forced convective cooling. The after-shell section of the gas turbine combustor liner with internal cooling passages is called the C-channel [12,13,14]. Numerous studies on the combustor liner to improve structural stability and reliability have been published using fluid and mechanical simulations. In these categories of simulation work, Kim et al. [14] conducted thermal and failure analyses using commercial tools such as ANSYS CFX and ANSYS Mechanical to estimate the C-channel creep lifetime prediction, which further demonstrated the high thermal stress distribution on the combustor liner that results in structural damages. Kim et al. [15] studied the flow structure of combustion gas inside the combustor and cooling flow outside the combustor liner. Moreover, Kim et al. [16] showed the calculation of thermal-mechanical lifetime using the C-channel heat transfer distribution to predict cracks, such as weld crack and axial crack, in an actual combustor liner. Moon et al. [17] performed the thermal-mechanical analysis using the same geometry configuration as Kim et al. [16], mainly on the after-shell section with the three various after-shell configuration arrays, i.e., the inline-discrete divider wall, staggered diver wall, and swirler wall, to mitigate the structural damage of crack formation. Recently, Moon et al. [18] used the Larson–Miller parameter to predict the creep lifetime of the combustor liner using the thermal stress of the combustor liner based on the actual operating condition. With these various topics of investigations conducted by other researchers, there is a lack of thermal barrier coating research work on the 7FA combustor liner, which is taken into account in the present work.
With a review of previous studies on the gas turbine combustor liner, the present study aims to predict the thermal distribution and creep lifetime on the inner and outer surface of the combustor liner by considering three different TBC thicknesses. In order to achieve these goals at a low computational cost, first, model 1, employing FVM, is used to simulate the premixed combustion for obtaining the inner liner metal temperature distribution. Second, model 2, employing FVM, is used to simulate the cooling flow over the outer surface of the combustor to obtain the outer surface metal temperature distribution. Consequently, the predicted data from the models 1 and 2 will be imported into model 3, where FEM is used to predict the thermal distribution on the inner combustor surface based on the three different TBC thicknesses: 400, 800, and 1200 μm. The creep lifetime prediction will be determined using the thermal stress and the Larson–Miller parameter. Finally, the result of the without TBC case will be compared with the actual damaged liner with cracks to show the structural damage due to thermal stress.
2. Numerical Methodology
2.1. Geometry
The schematic design in Figure 1 is the dry NOx combustor liner of the land-based gas turbine. The CL has three divisions, namely forward shell, center shell, and after shell. The location of the six swirlers at the inlet section of the forward shell is shown in Figure 2a; the clockwise swirlers have a vane angle of +50°, while the counter-clockwise swirler has a vane angle of −50°. The inner diameter at the inlet of the forward shell section is 457.2 mm. The length of the combustor from the swirler inlet to the combustor outlet is 908 mm.
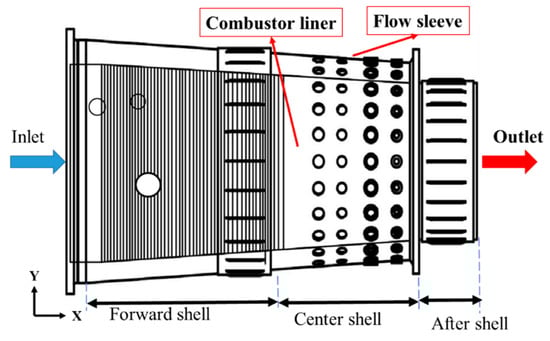
Figure 1.
Schematic sketch of a low-NOX premixed combustor.
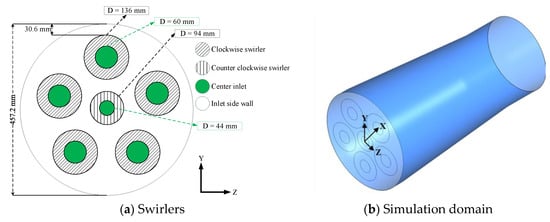
Figure 2.
Simulation model of an inner combustor liner with six swirlers only for Model 1.
2.2. Premixed Combustion and Heat Transfer for Inner Combustor Liner Modeling
The three-dimensional simulation was performed using FVM (Finite Volume Method), available in the commercial CFD code ANSYS CFX 18.1 [19]. The computational domain was a cylinder as shown in Figure 2. The inlet and outlet diameter were 457.2 and 348.85 mm, respectively. Unstructured tetrahedral mesh was used to mesh the domain and the domain had 727,360 elements with an element size of 3.1 mm used in the main flame area (injector side). A steady simulation was carried out in the present work using the RANS equations of k-omega SST turbulence model to reduce the computational cost. The detailed inlet boundary condition is shown in Table 1. The temperature of premixed methane-air inlet was 675.55 K; the air temperature at the center inlet was 675.55 K. The inlet side wall was fixed with a temperature of 673 K. A medium turbulence intensity level of 5% was specified at each inlet. Inside the combustor, the average combustion pressure was 1,522,700 Pa. For the outlet, 1,522,700 Pa average static pressure outlet boundary condition was applied. The adiabatic wall condition was applied at the inner CL. In the CFX solver control, the high-resolution advection scheme was used for solving the spatial discretization equations. A physical time scale of 0.25 s was specified in the fluid time scale option to control the outer iteration loop of solving flow fields for steady analyses.

Table 1.
Inlet boundary conditions for combustion simulation in model-1.
Based on the concept that the chemical reaction is fast relative to the transport processes in the flow, the reaction time scale is higher than the turbulent time scale (i.e., the Domköhler number is greater than unity). Therefore, the reaction rate dominated turbulent mixing. The Eddy Dissipation Model (EDM) proposed by Magnussen and Hjertager [20] is the simplest model with robust performance in the infinite fast turbulent reacting flows. Therefore, the EDM was used to stimulate the turbulence–chemistry interaction of the premixed combustion, and the reaction rate was assumed to be greater than the flow timing in the present model. The methane-air global equation proposed by Westbrook and Dryer [21] was used in the present work, and it is given in Equation (1). The transport equation for component in Equation (2) was used for calculating the chemical reaction rate using the source term in Equation (3). The burning process begins immediately after the premixed fuel enters the computational domain. Therefore, the reaction rate based on the turbulent scale in the EDM was determined using the minimum of the two expressions in Equations (4) and (5), where the eddy dissipation constants A and B were 4.0 and 0.5, respectively. The ratio of turbulence quantities () in Equation (5) was kept as a constant value of 2500 s−1 [22] to avoid the unphysical behavior near the wall predicted by the EDM. A value to the forward reaction rate constants, 8.3 × 10⁶ s−1 and 30 kcal/mol for the pre-exponential factor and activation energy, respectively, was applied in the Arrhenius equation. However, due to the presence of air, the NOx formation can occur in the combustor, which was modeled by enabling the prompt NO and thermal NO in ANSYS CFX. The prompt and thermal NO models are based on the Zeldovich mechanism. The constants in the Arrhenius equation for modeling the prompt NO are as follows: the pre-exponential factor was 6.4 × 10⁶ s−1 and the lower and upper temperature were 300 and 2300 K, respectively. The constants in the Arrhenius equation for modeling the thermal NO: the pre-exponential factor was 1.8 × 10¹¹ s−1 and the lower and upper temperature were 300 and 2300 K, respectively. As a result, a realistic accuracy in the simulation can be obtained. Through this simulation, the wall temperature of inner CL will be obtained and used for thermal analysis and creep lifetime prediction, which will be discussed in the next sections. The flow chart of how model 1, using CFD, is performed is shown in Figure 3.
CH4 + 2(O2 + 3.76N2) = CO2 + 2H2O + 7.52N2
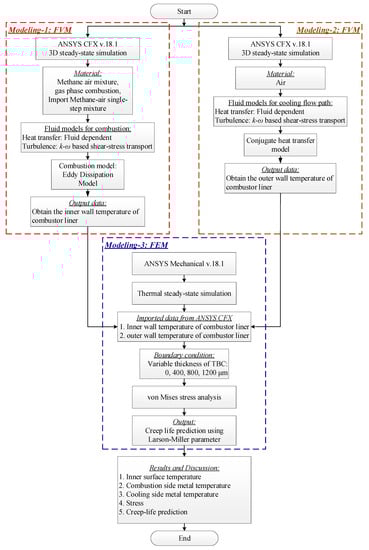
Figure 3.
Flow chart that shows how the three simulations were carried out in the present work.
Validation
To validate the numerical methods applied in model-1, the temperature profile from the simulation was compared with the experimental data provided by Masri et al. 2004 [23]. For this purpose, the swirl burner was chosen and has three inlets; fuel inlet, primary air inlet for swirling flow, and secondary air inlet. The diameter of the fuel inlet was 3.6 mm. The inner and outer diameter of the primary inlet were 50 and 60 mm, respectively, while the inner and outer diameter of the secondary air inlet were 60 and 260 mm, respectively. The chamber diameter and length were 260 and 350 mm, respectively. A 3D model with 595,525 mesh elements was used. The single-step global equation was considered. The same boundary condition of the SM1 flow configuration from the literature was used, which were the axial velocity in the fuel (gaseous CH4) inlet = 32.7 m/s at 293 K, axial and tangential velocity in the primary inlet for air swirling flow = 38.2 and 19.1 m/s, respectively, and the axial velocity in the secondary air inlet = 20 m/s. Figure 4a,b shows the experimental flame image and temperature contour from the simulation for comparison. In addition, the comparison of the radial temperature profile at an axial position of 40 mm from the simulation against the experimental data is shown in Figure 4c, and it was observed that the trend was similar between the simulation and experimental data; thereby, the numerical methods used in model-1 were validated. With this validation, the same numerical methods without employing the reaction equations were also used for model-2.

Figure 4.
Comparison of the flame image from the experiment (a) with the temperature contour from the simulation (b); numerical comparison between the experiment and the simulation (c).
2.3. Cooling Flow Modeling Outside the Combustor Liner
The model-2 using the steps in Figure 3 was used to find the temperature distribution on outer CL by coolant air. For performing this simulation, the outer CL geometry with the cooling flow paths only was considered. In this simulation, the hot gas of the inner combustor geometry was ignored. The computational domain with the cooling schemes is shown in Figure 5, which includes the rib turbulator, impinging jets with 24 holes in each row, and a C-channel. The diameter of the hole in the first and second row was 15.8 mm. Similarly, the hole diameter in the third and fourth hole was 18.95 and 12.9 mm. The cross-flow inlet is located on the C-channel inlet side, where the cross-flow moves towards the forward shell section associated with the additional flow from the impinging jet. The unstructured tetrahedral mesh was used to mesh the domain, and the domain had 16,405,131 elements. A steady simulation was carried out in the present work using the RANS equations of the k-omega SST turbulence model. The detailed inlet boundary condition for cooling flow simulation is shown in Table 2. The temperature of cooling air at the inlet was 673.35 K. The outer wall of the cooling flow path was assumed to be in an adiabatic condition, and the outer wall of the CL was assumed to be in a constant heat flux of 10,000 W/m2. The pressure outlet boundary condition was applied at the C-channel outlet with 1,530,000 Pa and flow path outlet with 1,534,302 Pa. With these conditions, the wall temperature from the outer CL will be obtained and used for thermal analysis and creep lifetime prediction, which will be discussed in the next section. The flow chart of how model-2 performed, using CFD, is shown in Figure 3.
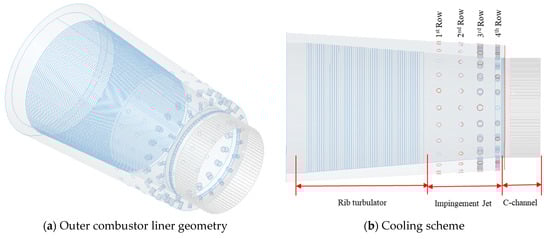
Figure 5.
Simulation model of the cooling flow only between CL and flow sleeve for model-2.
Table 2.
Boundary condition for cooling flow simulation in model-2.
2.4. Thermo-Structural Modeling and Analysis
The final step in Figure 3 for thermal analysis and creep life prediction is thermo-structural modeling. The solid model in Figure 6 was used to perform the steady thermal simulation using FEM in ANSYS Mechanical 18.1 [24,25]. The inner and outer wall temperature for inner and outer CL were imported from model-1 and model-2, as discussed in previous sections. The solid model has the inner surface coated with three different thicknesses, i.e., 400, 800, and 1200 μm, of the YSZ material and outer surface. The solid model was mesh using the unstructured tetrahedral mesh, and the number of meshes in the solid model without TBC and with TBC were 1,687,680 and 3,198,240 elements, respectively. The CL was made up of Inconel 617 alloy material, which is a nickel-chromium-cobalt-molybdenum alloy. This allows for high oxidation resistance at high temperatures due to the addition of aluminum. The properties of the Inconel 617 alloy are given in Table 3 [26]. The inner wall of the CL was coated with YSZ of three different thicknesses and their properties are given in Table 4. The thermal stress in the stress analysis simulation is proportional to the material and thermal properties, which can be expressed as:
where denotes Young’s modulus, is the thermal expansion coefficient, and denotes the temperature difference. The von Mises equivalent stress can be calculated using these calculated results and is used in failure theory to determine the yield of the ductile materials.
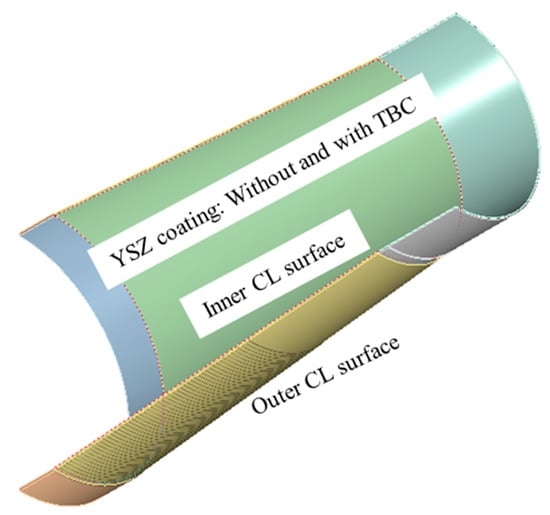
Figure 6.
Simulation model of combustor liner only without and with TBC for model-3.
Table 3.
Properties of Inconel 617 alloy.
Table 4.
Properties of Yttria Stabilized Zirconia (YSZ).
To determine the creep lifetime of the combustor liner, the calculated wall temperature and von Mises equivalent stress were used. The temperature and stress provide a correlation between the Larson–Miller parameter and . Then, the third-order polynomial function from the Larson–Miller rupture curves [27] forms a correlation with the Larson–Miller parameter , and the creep lifetime can, thus, be predicted using the expression in Equation (7).
3. Results and Discussion
3.1. Analysis of the Heat Transfer by Hot Gas to the Inner Wall of the CL
To find the amount of convective heat transfer to the parent metal of the CL from the combustion gas, the swirl combustion using premixed methane-air was simulated by adopting the numerical methods (model-1) shown in the flow chart in Figure 3. The result of premixed combustion will be analyzed and discussed using the combustion temperature, inner side wall temperature of the CL, and HTC contours. Figure 7 shows the combustion temperature contour (YZ plane) at five different locations and mid of XY plane. According to the contours of five different locations in Figure 7a, the maximum flame temperature occurred around 1900 K near the swirl injector side in the forward shell section, indicating that a high-level mixing occurred due to the turbulence generated by the clockwise rotating flow from the center swirler and the counter-clockwise rotating flow from the five swirler surrounded circumferentially. Following the forward shell section, the flame temperature was gradually reduced to 1700 K in the center shell section, resulting in a uniform temperature distribution at the end of the after-shell, as shown in Figure 7b, which indicates that the reaction was completed inside the combustor.
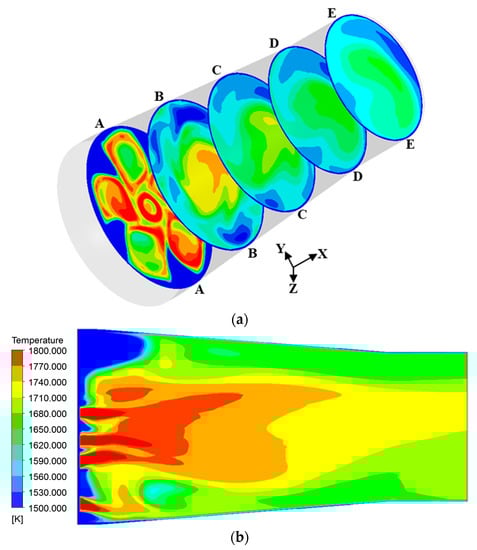
Figure 7.
Temperature (K) distribution of combustion gas. (a) Various cross-section in the YZ plane along the X direction. (b) Combustor cross-section in the middle of the XY plane.
A high wall temperature occurred at the point of reattachment to the CL wall in Figure 8 due to the flow development of the swirled flame. Because of the clockwise swirling flow from the five circumferential swirler, the high wall temperature distribution on the parent metal of the inside CL was obtained in clockwise direction. The forward shell section from the injector side to the AA-cross section had a lower wall temperature range of about 1450–1464 K than the other two shell sections, as shown in Figure 8a. In contrast, the non-uniform wall temperature around 1464–1520 K caused a large gradient inside the CL due to the mixing and flame formation influenced by the swirling flow, as shown in Figure 8a. The wall HTC was high along the flame reattachment area. The wall HTC distribution range of 1360–1500 W/m2K was particularly high near the nozzle where the flame is primarily mixed, and gradually decreased from the center shell section to the end of after shell section in Figure 8b. These non-uniformity distributions of the hotspot peak temperature are the primary causes of the gas turbine combustor failure modes, such as cracking, spalling, and so on, which reduce the lifetime of the CL. As a result, the wall temperature from model-1 will be used to perform model-3 to estimate the creep lifetime prediction of the CL.
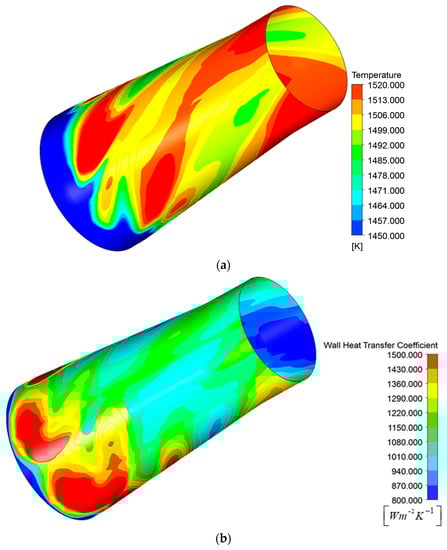
Figure 8.
Parent metal of the inside combustor liner. (a) Wall temperature (K) distribution and (b) heat transfer coefficient (W/m2K) distribution.
In the case of radiation heat transfer during combustion analysis, the radiation by flame was dominant. In the case of flame radiation, the shape factor was calculated based on the size of the flame. The shape factor of the flame in the main combustion was between 0.1 and 0.2, and the maximum heat flux by radiation heat transfer was 12,000 W/m2 based on the maximum temperature of the flame in the combustion analysis. In addition, the maximum temperature difference between the walls in the combustor was about 200 K, and the average radiation heat flux was calculated at 81.65 W/m2 when the emissivity of TBC was set to 0.9. However, the average wall heat flux is 469,150 W/m2 in this calculation. The heat flux by radiation heat transfer was about 2.75% compared to the average surface heat flux. Thus, the radiation heat transfer could be neglected in this combustion calculation.
3.2. Analysis of the Heat Transfer by Cooling Flow to the Outer Wall of the CL
The heat transfers from the outer CL wall by the compressed air from the compressor injected through the cooling schemes was determined using model-2. The cooling path result is shown in Figure 9 using the boundary condition from Table 2. The circumferential holes in the first and second rows had higher wall HTC than the third and fourth rows at the impingement point on the outer CL caused by impinging air in the center shell section. This was due to the impinging flow being deflected towards the forward shell section by the cross flow from the transition piece, resulting in the impingement point of cooling holes in the first and second rows having a higher wall HTC of 1184 W/m2K and in the third and fourth rows having a lower wall HTC of 298–596 W/m2K due to the cross flow. This impinged cooled air with the cross flow was then moved to the forward shell section to improve the heat transfer through rib tabulators on the circumferential surface of the outer CL. Only the impinging holes in the first row show a non-uniform distribution at the impingement point along the circumferential path, which can be also seen in the second row, but is reversed in the third and fourth rows. A comparison of these four rows revealed that the wall HTC decreased from first row to fourth row. Furthermore, deflected cooling air from the impinging holes by the cross flow moved to the forward shell section, where it was heated due to the high combustion temperature from the inner CL, resulting in a lower wall HTC compared to the center shell section. As a result, the cooling performance is reduced as cooling air passes the rib turbulator. Furthermore, the outer CL wall data from the model-2 will be used to perform the model-3 to estimate the creep lifetime prediction of the CL.
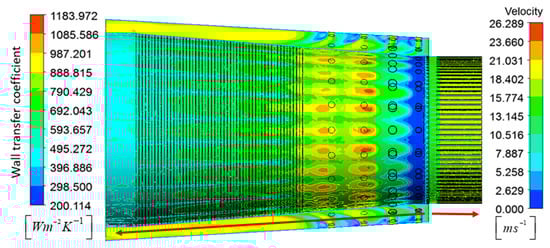
Figure 9.
Wall heat transfer coefficient and velocity distribution on the outer CL from model 2 using the boundary condition in Table 2.
3.3. Thermo-Structural Analysis and Creep Life Prediction
The inner and outer wall data of the CL from model-1 and model-2 are imported in model-3 using FEM in ANSYS Mechanical for thermo-structural analysis and creep lifetime prediction, as shown in Figure 10.
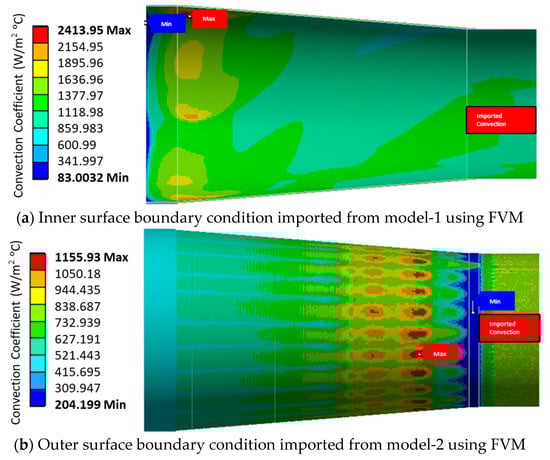
Figure 10.
The imported heat transfer coefficient on the hot side and cooling side of the combustor liner for model-3.
Figure 11 shows the wall temperature distribution on the inner wall of the CL without TBC and three different TBC thicknesses. When the inner wall CL coating had a thickness of 1200 μm TBC, the average wall temperature of the case without TBC increased to 1097 °C from 1029 °C. Similarly, as the TBC thickness increased, the maximum wall temperature also increased. Large-sized hotspot zones were found in the forward shell section, where the flame had made contact with the TBC-coated inner wall of the CL due to the swirling flow discussed earlier. In addition, the very high temperature distribution was observed near the C-channel due to the remarkable swirling effect still present on the inner wall of the CL, as shown in Figure 8a, and low wall HTC, as shown in Figure 9. An overall inspection of the wall temperature distribution based on the three different TBC thicknesses revealed that the inner TBC surface of the 1200 μm case had a higher wall temperature than the other two TBC thickness cases.
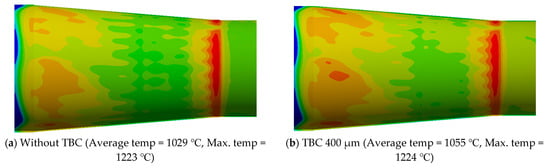
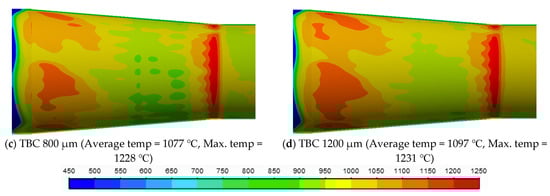
Figure 11.
TBC surface temperature distribution based on the TBC thickness exposed to hot gas.
Figure 12 shows the inner CL metal surface distribution based on the different TBC thicknesses on the combustion side. By increasing the TBC thickness, the metal surface temperature of the CL was reduced to 912 °C (1200 μm TBC case) from 1029 °C (without TBC). When comparing the maximum temperatures, a similar trend was observed. When the contours in Figure 11 and Figure 12 were compared based on TBC thickness between the TBC surface and metal surface, the metal temperature was reduced due to the low thermal conductivity of YSZ. Thus, the increasing TBC thickness provided good thermal protection. Furthermore, as TBC thickness increased, the larger hotspot with a higher temperature became merely a uniform reduced temperature distributed over the entire metal inner surface. However, the metal surface near the C-channel of the 1200 μm case had a higher temperature than the other two shell sections (forward and center) in Figure 12d, but a lower temperature than the other TBC cases in Figure 12a–c. The uniform distribution of the wall temperature can help to mitigate the structural damage.
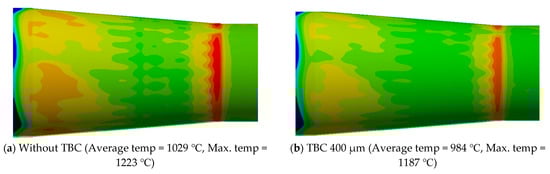
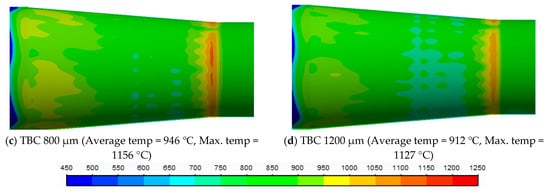
Figure 12.
Inner CL metal surface temperature distribution (combustion side) based on the TBC thickness.
The TBC thickness can have an effect on the outer wall of the CL in the cooling side. Figure 13 shows the wall temperature distribution of the outer metal surface based on the TBC thickness. The average and maximum wall temperature were reduced by increasing the TBC thickness. The TBC effectively reduced the higher temperature hotspots in the forward shell section, resulting in a uniformity result, as shown in Figure 13d.
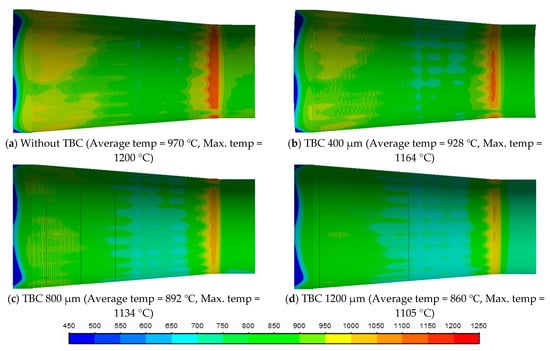
Figure 13.
Outer CL metal surface temperature distribution (cooling side) based on the TBC thickness.
A detailed investigation based on the average and maximum temperature of the TBC surface, inner metal, and outer metal based on the effectiveness of the TBC thickness are shown in Figure 14, Figure 15, Figure 16 and Figure 17. First, the average temperature of all cases is shown in Figure 14. In the case without TBC, the average temperature of the TBC surface and the metal inner surface was the same due to the lack of YSZ coating. The average temperature of the TBC surface was increased as the TBC thickness increased. Because of the low thermal conductivity and thermal expansion coefficient, the increased TBC thickness reduced the inner metal to a lower temperature than in the case without TBC. In addition, the between the TBC surface and inner metal surface increased with TBC thickness. On the other hand, the temperature slope between the inner and outer metal was the same in all cases. This implies that the TBC thickness directly affects the inner metal temperature directly, while indirectly affecting the outer metal temperature. A similar trend of variation was observed when comparing the maximum wall temperature of the TBC surface, inner metal, and outer metal for all cases, as is shown in Figure 15. The most important observation from Figure 15 is that the maximum temperature of the hotspot was reduced drastically by applying 1200 μm TBC as compared to the case without TBC.
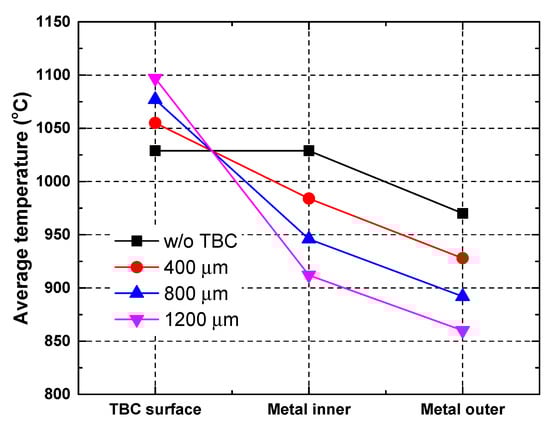
Figure 14.
Average wall temperature of all surfaces based on the TBC thickness.
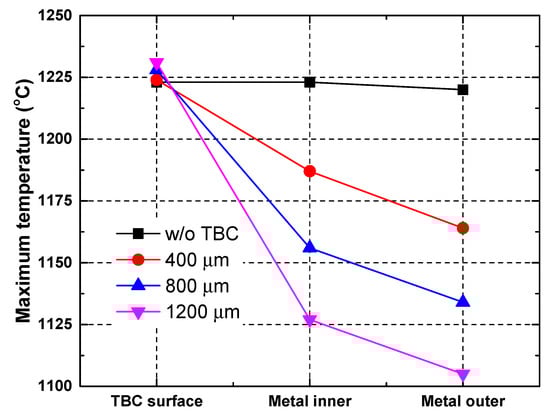
Figure 15.
Maximum wall temperature of all surfaces based on the TBC thickness.
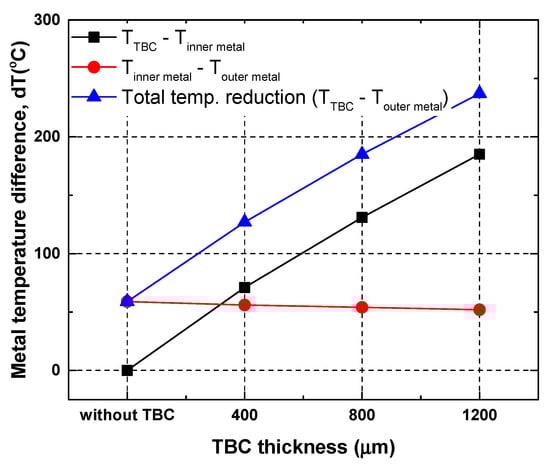
Figure 16.
Temperature difference between the surfaces of individual TBC thickness cases.
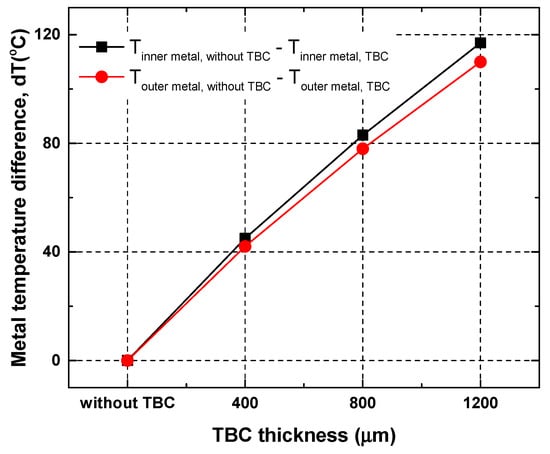
Figure 17.
Temperature difference between without TBC and three different TBC thicknesses.
Figure 16 shows that the between the TBC surface and inner metal surface was increased linearly; the correlation is expressed in Equation (8). The between the inner metal and outer metal surface was around 4%, and thus, had not changed remarkably between the TBC thicknesses. This is due to the low thermal conductivity of the YSZ material coated inside the CL, which slows the thermal conduction rate from the TBC surface to the inner metal surface, and the can, thereby, provide a thermal barrier to the CL. As a result of the effectiveness of varying TBC thicknesses, a total temperature reduction between the TBC surface and the outer metal was increased. Additionally, the comparison of all three TBC thickness cases with no TBC thickness case is shown in Figure 17. As previously stated, the inner and outer metal temperature decreased as the TBC thickness increased, which increased the of the inner and outer metal between without TBC and TBC thickness, as shown in Figure 17. The percentage of decrease in the inner metal temperature based on TBC was calculated using Equation (9), and it is shown in Figure 18:
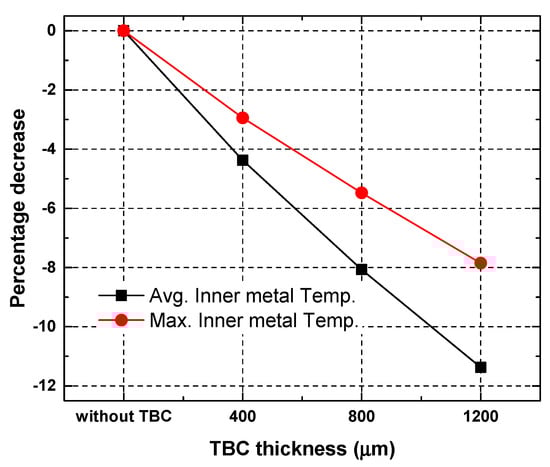
Figure 18.
Percentage comparison of the inner metal temperature based on the TBC thickness.
The thermal stress analysis based on the wall and thermal expansion coefficient were performed to show the stress contour based on the TBC thickness in Figure 19. The maximum stress was observed in the forward shell section due to the hot gas touching the combustor liner and C-channel due to the lowest wall HTC by the impingement jet. Overall, the stress level was decreased near the nozzle, in the collision jet, and in the uneven cooling area as TBC thickness increased. This thermal stress analysis revealed that the TBC was effective in reducing the CL metal stress in high temperature regions.
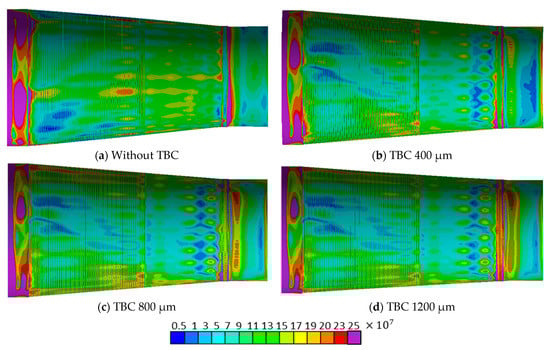
Figure 19.
Surface stress (×107 Pa) distribution on the combustor liner based on TBC thickness.
As discussed earlier, the method to predict the creep lifetime of the CL by using the calculated wall temperature and von Mises equivalent stress, along with Larson–Miller rupture curves and the creep lifetime of the inner metal and outer metal surface of the CL based on the TBC thickness, was estimated, and the creep lifetime contours are shown in Figure 20. Overall, the CL creep life was improved by decreasing the metal surface temperature as the TBC thickness increased in Figure 20. However, the C-channel section has the weakest creep lifetime in all cases due to lots of uneven hotspots of temperature and lowest wall HTC caused by the impingement jet in the center shell section. The vulnerable areas that result in the weakest creep lifetime in the without TBC case are shown in Figure 20a, which were improved by increasing the TBC thickness, as shown in Figure 20d. To ensure the capability of the simulation result obtained using coupled CFD and FEM, the simulation result of the without TBC case was compared with the actually damaged CL due to the thermal stress that showed cracks that occurred in the CL surface in Figure 21a,b. In this present study, we have shown that the structural damage that happened in the CL was prevented by increasing the TBC thickness, and an optimistic result of the 1200 μm case is shown in Figure 21c. This present study shows that increasing the TBC thickness can reduce the metal temperature, but over 1200 μm can increase the engine weight. Correspondingly, it would increase the manufacturing and TBC material costs.
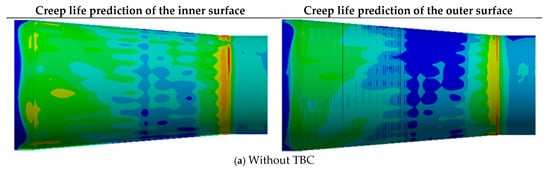
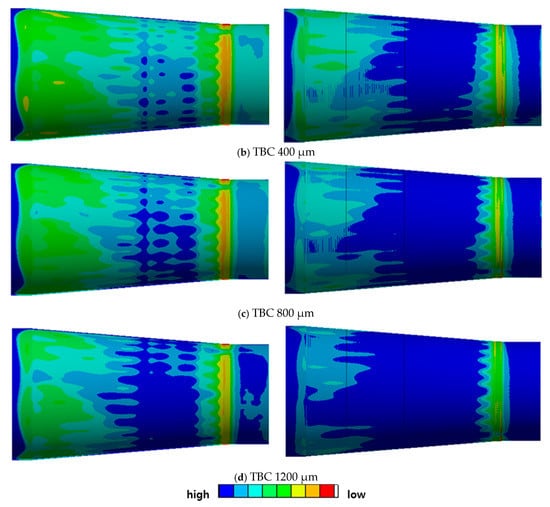
Figure 20.
Creep life prediction based on the temperature and stress distribution using the Larson–Miller parameter for varied TBC thicknesses.
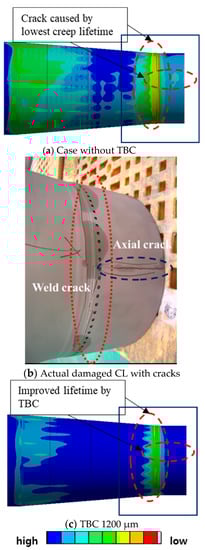
Figure 21.
Comparison of cracks induced by thermal stress of the actual damaged CL and prevention by TBC thickness.
4. Conclusions
Thermal analysis and creep lifetime prediction of the gas turbine combustor liner (CL) based on three different TBC thicknesses were performed in this present paper using the commercial tool ANSYS CFX (CFD) and Mechanical (FEM). The premixed combustion simulation and conjugate heat transfer simulation were conducted to obtain the wall temperature of the inner and outer CL. These two wall temperature data were used to perform thermal simulation for thermal stress analysis and creep lifetime prediction of the CL. The combustion simulation result showed that the uneven maximum wall temperature caused by the combustion temperature in the inner CL along the clockwise direction due to the swirling flow. The large-sized hotspot of the wall heat transfer coefficient (HTC) occurred in the forward shell section due to the hot gas touching the inner CL. The conjugate heat transfer simulation showed that the wall HTC was decreased towards the forward shell section due to the cross-flow associated with the impingement jet.
The FEM simulation shows that the TBC surface temperature was increased as the TBC thickness increased, which reduced the inner metal temperature of the CL. Additionally, the large-sized of vulnerable areas due to the non-uniform wall temperature distribution was decreased in the inner and outer CL surfaces. The effect of increasing TBC thickness showed that the temperature difference between the TBC surface and inner metal surface was increased linearly, and the temperature difference between the inner and outer metal surface was not changed. Thus, the total temperature reduction from the TBC surface to the outer metal surface was increased as the TBC increased. In the thermo-structure analysis, the increased TBC thickness reduced the hotspot of thermal stress overall, and thereby, it enhanced the creep life prediction of the CL. The present study suggests that the increasing TBC thickness can prevent structural damage and improve the lifespan of the parent material of the CL in the gas turbine combustor.
Author Contributions
Conceptualization, J.S.P.; methodology, J.S.P.; investigation, J.S.P., K.R.; writing—original draft preparation, J.S.P., K.R.; writing—review and editing, J.S.P., K.R.; project administration, J.S.P. All authors have read and agreed to the published version of the manuscript.
Funding
This research was supported by Basic Science Research Program through the National Research Foundation of Korea (NRF) funded by the Ministry of Education (2019R1F1A1059573).
Institutional Review Board Statement
Not applicable.
Informed Consent Statement
Not applicable.
Conflicts of Interest
The authors declare no conflict of interest.
Nomenclature
| A, B | Eddy dissipation coefficients |
| CFD | Computational fluid dynamics |
| CL | Combustion liner |
| D | Diameter |
| dT | Temperature difference |
| EDM | Eddy dissipation model |
| E | Young’s modulus |
| FVM | Finite volume method |
| FEM | Finite element method |
| HTC | Heat transfer coefficient |
| P | Larson–Miller parameter |
| Sl | Source term |
| T | Temperature |
| t | Time |
| TBC | Thermal barrier coating |
| Rk | Elementary reaction rate for reaction |
| Wl | Molar mass of component |
| Yl | Mass fraction |
| YSZ | Yttria Stabilized Zirconia |
| , ε | Turbulent kinetic energy and dissipation |
| , | Stoichiometric coefficients for reactant and product |
| ρ | Density |
| σ | Thermal stress |
| α | Thermal expansion coefficient |
References
- Gülen, S.C. Gas Turbines for Electric Power Generation; Cambridge University Press: Cambridge, UK, 2019. [Google Scholar]
- Lefebvre, A.H.; Ballal, D.R. Gas Turbine Combustion—Alternative Fuels and Emissions, 3rd ed.; CRC Press: Boca Raton, FL, USA, 2010. [Google Scholar]
- Thekare, J.G.; Pandey, C.; Mahapatra, M.M.; Mulik, R.S. Thermal Barrier Coatings—A State of Art Review. Met. Mater. Int. 2020, 1–22. [Google Scholar] [CrossRef]
- Kai, W.; Hui, P.; Hongbo, G.; Shengkai, G. Effect of sintering on thermal conductivity and thermal barrier effects of thermal barrier coatings. Chin. J. Aeronaut. 2012, 25, 811–816. [Google Scholar]
- He, L.; Menshikova, V.; Haller, B.R. Effect of Hot-Streak Counts on Turbine Blade Heat Load and Forcing. J. Propuls. Power 2007, 23, 1235–1241. [Google Scholar] [CrossRef]
- Schütze, M. Fundamentals of high temperature corrosion. In Materials Science and Technology: A Comprehensive Treatment: Corrosion and Environmental Degradation; Cahn, R.W., Haasen, P., Krame, E.J., Eds.; Wiley: New York, NY, USA, 2000; Volume I+II, pp. 67–130. [Google Scholar]
- Meier, S.M.; Nissley, D.M.; Sheffler, K.D.; Cruse, T.A. Thermal barrier coating life prediction model development. In Proceedings of the ASME 1991 International Gas Turbine and Aeroengine Congress and Exposition, Orlando, FL, USA, 3–6 June 1991; Paper No. 91-GT-040. p. V005T13A003. [Google Scholar]
- Pallos, K.J. Gas Turbine Repair Technology; GE Energy Services Technology, GE Power Systems: Atlanta, GA, USA, 2001; GER-3957B. [Google Scholar]
- Clarke, D.R.; Phillpot, S.R. Thermal barrier coating materials. Mater. Today 2005, 8, 22–29. [Google Scholar] [CrossRef]
- Mishra, R.K. Life Enhancement of Gas Turbine Combustor Liner Through Thermal Barrier Coating. J. Fail. Anal. Prev. 2017, 17, 914–918. [Google Scholar] [CrossRef]
- Osorio, J.D.; Toro, A.; Hernandez-Ortiz, J.P. Thermal barrier coatings for gas turbine applications: Failure mechanisms and key microstructural features. Dyna 2012, 79, 149–158. [Google Scholar]
- Martling, V.C.; Xiao, Z. Combustion Liner Having Improved Cooling and Sealing. U.S. Patent 7269957 B2, 18 September 2007. [Google Scholar]
- Intile, J.C.; West, J.A.; Byrne, W. Method and Apparatus for Cooling Combustion Liner and Transition Piece of a Gas Turbine. U.S. Patent 7010921 B2, 14 March 2006. [Google Scholar]
- Kim, K.M.; Yun, N.; Jeon, Y.H.; Lee, D.H.; Cho, H.H. Failure analysis in after shell section of gas turbine combustion liner under base-load operation. Eng. Fail. Anal. 2010, 17, 848–856. [Google Scholar] [CrossRef]
- Kim, K.M.; Yun, N.; Jeon, Y.H.; Lee, N.H.; Cho, H.H.; Kang, S.-H. Conjugated heat transfer and temperature distributions in a gas turbine combustion liner under base-load operation. J. Mech. Sci. Technol. 2010, 24, 1939–1946. [Google Scholar] [CrossRef]
- Kim, K.M.; Jeon, Y.H.; Yun, N.; Lee, N.H.; Cho, H.H. Thermo-mechanical life prediction for material lifetime improvement of an internal cooling system in a combustion liner. Energy 2011, 36, 942–949. [Google Scholar] [CrossRef]
- Moon, H.; Kim, K.M.; Park, J.S.; Kim, B.S.; Cho, H.H. Thermo-mechanical analysis of an internal cooling system with various configurations of a combustion liner after shell. Heat Mass Transf. 2015, 51, 1779–1790. [Google Scholar] [CrossRef]
- Moon, H.; Kim, K.M.; Jeon, Y.H.; Shin, S.; Park, J.S.; Cho, H.H. Effect of thermal stress on creep lifetime for a gas turbine combustion liner. Eng. Fail. Anal. 2015, 47, 34–40. [Google Scholar] [CrossRef]
- ANSYS CFX. Theory Guide; ANSYS, Inc.: Canonsburg, PA, USA, 2016. [Google Scholar]
- Magnussen, B.F.; Hjertager, B.H. On mathematical modeling of turbulent combustion with special emphasis on soot formation and combustion. Symp. (Int.) Combust. 1977, 16, 719–729. [Google Scholar] [CrossRef]
- Westbrook, C.K.; Dryer, F.L. Simplified Reaction Mechanisms for the Oxidation of Hydrocarbon Fuels in Flames. Combust. Sci. Technol. 1981, 27, 31–43. [Google Scholar] [CrossRef]
- ANSYS CFX. Modeling Guide; ANSYS, Inc.: Canonsburg, PA, USA, 2016. [Google Scholar]
- Masri, A.R.; Kalt, P.A.; Barlow, R.S. The compositional structure of swirl-stabilized turbulent nonpremixed flames. Combust. Flame 2004, 137, 1–37. [Google Scholar] [CrossRef]
- ANSYS. Mechanical Theory Guide; ANSYS, Inc.: Canonsburg, PA, USA, 2016. [Google Scholar]
- Tinga, T.; Van Kampen, J.F.; De Jager, B.; Kok, J.B.W. Gas Turbine Combustor Liner Life Assessment Using a Combined Fluid/Structural Approach. J. Eng. Gas Turbines Power 2006, 129, 69–79. [Google Scholar] [CrossRef]
- Metals, S. Product Handbook of High-Performance Nickel Alloys. Special Metals: Huntington, WV, 2015. Available online: http://www.specialmetals.com/ (accessed on 22 May 2017).
- Larson, F.R. A time-temperature relationship for rupture and creep stresses. Trans. ASME 1952, 74, 765–775. [Google Scholar]
Publisher’s Note: MDPI stays neutral with regard to jurisdictional claims in published maps and institutional affiliations. |
© 2021 by the authors. Licensee MDPI, Basel, Switzerland. This article is an open access article distributed under the terms and conditions of the Creative Commons Attribution (CC BY) license (https://creativecommons.org/licenses/by/4.0/).