Article

Lagrangian Vortex Computations of a Four Tidal Turbine Array: An Example Based on the NEPTHYD Layout in the Alderney Race

1
Laboratoire Ondes et Milieux Complexes, Normandie University, UNILEHAVRE, 76600 Le Havre, France
2
IFREMER, 150 Quai Gambetta, 62200 Boulogne-sur-Mer, France
3
Energy & Environment Research Group, Swansea University, Bay Campus, Swansea SA1 8EN, UK
*
Author to whom correspondence should be addressed.
Energies 2021, 14(13), 3826; https://doi.org/10.3390/en14133826
Submission received: 11 May 2021 / Revised: 17 June 2021 / Accepted: 19 June 2021 / Published: 25 June 2021
(This article belongs to the Special Issue Tidal Turbines)

Abstract

:
This study investigates the wake interaction of four full-scale three-bladed tidal turbines with different ambient turbulence conditions, in straight and yawed flows. A three-dimensional unsteady Lagrangian Vortex Blob software is used for the numerical simulations of the turbines’ wakes. In order to model the ambient turbulence in the Lagrangian Vortex Method formalism, a Synthetic Eddy Method is used. With this method, turbulent structures are added in the computational domain to generate a velocity field which statistically reproduces any ambient turbulence intensity and integral length scale. The influence of the size of the structures and their density (within the study volume) on the wake of a single turbine is studied. Good agreement is obtained between numerical and experimental results for a high turbulence intensity but too many structures can increase the numerical dissipation and reduce the wake extension. Numerical simulations of the four turbine array with the layout initially proposed for the NEPTHYD pilot farm are then presented. Two ambient turbulence intensities encountered in the Alderney Race and two integral length scales are tested with a straight flow. Finally, the wakes obtained for yawed flows with different angles are presented, highlighting turbine interactions.

1. Introduction

With the increase of precommercial tidal farms (EnFAIT project [1], Meygen [2], etc.), it is becoming urgent to have tools to model such configurations with an accurate account of wake–turbine interactions. A few years ago, Karsten et al. [3] simulated hundreds of tidal turbines in the Bay of Fundy, Canada, with a linear momentum actuator disc theory in a regional code. Such studies were interesting for global resource assessment and also possible global impact, but the methodology and discretisation used were not accurate enough to study turbine interactions. Similar conclusions could be drawn for the work of Divett et al. [4] using the Gerris code [5], even if the size of the farm was smaller (≈15 turbines) and using an adaptive mesh refinement. One of the first attempts very relevant for these types of precommercial farms was the study of Churchfield et al. [6], who computed 3D configurations of layouts with up to five turbines and using a LES (Large Eddy Simulation) code. However, the mesh was quite large (with up to 11 × 10 6 cells approximately) and, unfortunately at the time, the results were not compared to experimental data. Interactions between two aligned turbines to compare with the experimental results of Mycek et al. [7] were already attempted by the same research group using the Lagrangian Vortex framework (Mycek et al. [8]). These preliminary results were really promising, even though a better account of the blade was already invoked. This motivated us to enhance the software [9] so that the computations could be improved: larger array, finer discretisation, account of ambient turbulence, etc.
This last topic of ambient turbulence assessment in tidal energetic sites is of growing importance. From the pioneering works of Osalusi et al. [10,11] who measured ambient turbulence characteristics in the Fall of Warness at EMEC, Scotland, several research teams follow on their heels with increasing precision. Notable works are those of Thomson et al. [12] in Puget Sound, western part of Canada; Milne et al. [13] in Sound of Islay, UK or even McCaffrey et al. [14] reanalysing some of Thomson et al.’s results with increased insights into the physics. These works paved the way for more recent studies such as [15,16,17]. Very recently, and crucially for this paper dealing with the Alderney Race, the results of mainly two French research programs (THYMOTE and HYD2M) were published, most of them in a special issue of the Philosophical Transaction of the Royal Society A [18,19,20,21,22,23,24,25]. All these works will be extremely valuable for the forthcoming computations applied to farm configurations in the Alderney Race and specifically for the configuration treated in the present paper.
However, simulating ambient turbulence can be a significant challenge. Most of the numerical codes being dealing with this issue are based on a Eulerian approach. Therefore, in most cases, an initialisation of the inlet boundary condition is necessary using a synthetic approach, being either the Synthetic Eddy Method (SEM) of Jarrin et al. [26], the Mann algorithm, or even predefined toolboxes such as TurbSim [27] for instance.However, it becomes very complicated to maintain the ambient turbulence level all over the computational domain and this was already largely highlighted for instance in the work of Jarrin et al. Some research teams are trying to alleviate this phenomenon by either increasing the order of the numerical scheme and/or reducing the size of the mesh cells. Very interesting works in that respect were performed by Bernard et al. [28] in the wind energy sector, Ahmed et al. [29] in the tidal energy sector, or even Mercier et al. [17,30] also in the tidal energy sector using the Lattice Boltzmann Method for the last one, which is classified as a Lagrangian method. The present study also aims at using a Lagrangian approach but in another formalism: the Lagrangian Vortex method. Before any add-ons, Lagrangian approaches have the benefit of being much less dissipative than their Eulerian counterparts on the advection term of the Navier–Stokes equations. Based on the method proposed by Jarrin et al. [26], Pinon et al. [31] and more recently Choma Bex et al. [32] applied the SEM ambient turbulence generation technique to the Lagrangian Vortex Method. This was not the first attempt with the Lagrangian approach because Chatelain et al. [33] already performed computations with ambient turbulence in their Vortex-in-cell formalism. Bossy et al. [34] also applied a similar stochastic approach for computing interaction of wind turbines. One of the major advantages of the present synthetic turbulence approach implemented in the Lagrangian Vortex method is that the ambient turbulence level and characteristics are fully conserved throughout the entire computational domain. There is absolutely no numerical damping of the ambient turbulence characteristics. This ambient turbulence numerical approach recently implemented, combined with the accurate and fast numerical treatment of mutual interaction among turbines [35], make our code a good candidate for such computations of wake–turbine interaction in a farm.
A rationale for the writing of this paper was to highlight the fact that, with the use of such ambient turbulence models with a vortex blob code, accurate simulations of wake–turbine interactions can be performed. The geometrical configuration considered here (see Figure 1) is the precommercial farm NEPTHYD (Normandie Energie PiloTe HYDrolien) which was granted to a subsidiary company of the french energy and electric utility group Engie by the French Ministry of Energy and Environment, via its agency ADEME, in December 2014. At this time, Engie had contracted with Alstom the manufacturing of four Oceade™, a three bladed horizontal axis turbine of 18 m diameter rated at 1.4 MW. Following the purchase of Alstom’s energy activities by General Electric, the tidal activities of Alstom were rapidly halted and this demonstration project did not become a reality. However, in the meantime, Engie had started the consenting process with the French authorities and some official documents were issued and made public. Therefore, the farm configuration (number of turbines, turbine positioning, etc.), velocity value, rotational speed, etc. were taken from the report issued by the Autorité Environnementale on the 6th of April 2016, whose references are accessible here [36]. Only the ambient turbulence values were reproduced from the paper of Sentchev et al. [16]. However, the very interesting aspect of this configuration is that it is a real industrial precommercial farm configuration, very relevant for the scientific community.
Section 2 will first present the numerical method and more particularly how the SEM of Jarrin et al. is adapted to the Lagrangian Vortex Blob formulation. Then, Section 3 will be dedicated to the validation of this implementation, together with the assessment of the influence of several parameters such as the turbulent length scales or some other numerical ones. Section 4 will present the computations performed on the NEPTHYD configuration with different ambient turbulence levels and length scales. In the case of asymmetry in the flow, if the tidal flow is not fully bidirectional which is most often the case, wake–turbine interactions will be highlighted in this section. Finally, some conclusions will be presented in Section 5 and several perspectives will be drawn.

2. Numerical Method

This section covers the Vortex method used for the simulation of marine current turbines and their wakes, as well as the integration of a Synthetic Eddy Method adapted to the context of these computations. As a matter of nomenclature convention, bold signs will refer to vectors, regular letters will refer to continuous fields (e.g., u for the continuous velocity field) and capital letters will refer to the corresponding discretised fields (e.g., U i for the velocity of the i-th particle).

2.1. Vortex Particle Method

The Vortex method is an unsteady Lagrangian method, based on a discretisation of the flow into vorticity carrying particles [9,37,38,39]. The governing equations for this unsteady and incompressible flow are the Navier–Stokes equations in their velocity/vorticity ( u , ω ) formulation:
· u = 0 ,
D ω D t = ω · u + ν Δ ω ,
where u is the velocity field, ω = u is the vorticity field and ν is the kinematic viscosity. Equation (2) is the momentum equation transposed into the velocity–vorticty formulation, with ω · u representing the stretching term and ν Δ ω the diffusion term. The fluid domain is discretised into N P particles, each particle i represented by its position X i , its vortical weight Ω i , and its volume V i . The particles’ transport over time is described by the following displacement equation, integrated using regular time stepping schemes:
d X i d t = u ( X i ) = U i .
This leads to a discretised formulation of the previous Navier–Stokes Equation (2), dictating the evolution of the vorticity carried by each particle i:
d Ω i d t = Ω i · U i Stretching term : S i V i + ν [ Δ ω ] x = X i V i Diffusion term : L i V i .
Cottet and Koumoutsakos [39] provide a detailed explanation of the treatment of the stretching term S i V i .
Considering a viscous fluid with a constant viscosity ν , the diffusion term L i V i is described in accordance with the Particle Strength Exchange (PSE) method initially developed by Degond and Mas-Gallic [40] and Choquin and Huberson [41]. The present model integrates an additional account for turbulent diffusion using a Large Eddy Simulation (LES) method to represent the influence of the non-resolved length scales, all the more important when simulating ambient turbulence. Sagaut [42] has assembled a synthetic analysis of various possible formulations for this purpose, these particular simulations using the version of Mansour [43]. An alternative numerical approach for diffusion is possible in the Lagrangian Vortex framework: the Diffusion Velocity Method, initially proposed by Ogami and Akamatsu [44] and recently analysed by Mycek et al. [45].
The Lagrangian Vortex method relies on a Helmholtz decomposition of the velocity field:
u = ψ u ψ + ϕ u ϕ + u ,
where the components of the velocity can be detailed as the following:
  • A rotational velocity component u ψ accounting for particle–particle interaction, the core of any Lagrangian Vortex method. The component U ψ is the discrete solution of the continuous equation:
    Δ ψ = ω ,
    obtained by introducing the Helmholtz decomposition (Equation (5)) into the definition of vorticity. The solution for this Equation (6) is given at any point M of the fluid domain by the Biot and Savart law [37,39,46,47]:
    U ψ ( M ) = 1 4 π i = 1 N P MX i | MX i | 3 Ω i .
    This formulation is desingularised using a regularisation parameter ϵ , as described by Winckelmans and Leonard [47]. Additional developments are carried out in the numerical implementation of this formulation, such as a Treecode type acceleration algorithm (see Lindsay and Krasny [48]) and particles redistribution algorithms (see Cottet and Koumoutsakos [39]), as well as time stepping procedures.
  • A potential velocity component u ϕ , representing the influence of a solid body. There are many applications for the use of such a component, such as the simulation of the nozzle of jet [49], of a sail [50], or of a monofin [51]. In the present study, the potential velocity component represents the influence of the rotor of a turbine [9], as will be demonstrated in the following sections. This velocity component u ϕ derives from a scalar potential ϕ , which must satisfy:
    Δ ϕ = 0 .
    Equation (8) is obtained by introducing the velocity decomposition Equation (5) into the continuity Equation (1). The latest developments on this aspect of the software are detailed by Carlier et al. [52] as well as Mycek et al. [35].
  • A velocity component u representing the upstream velocity field at infinity, generally treated as a constant vector. The focus of this paper will be to adapt the upstream velocity component u in order to account for ambient turbulence in the surrounding flow.
A second order Runge–Kutta implementation is used for the time integration scheme. For such applied engineering configurations, this was preferred to the fourth order Runge–Kutta version for the sake of computational efficiency, while still providing a fairly reasonable accuracy. A convergence analysis was performed in a previous work [9], where a mesh independence analysis was presented. Both spatial and temporal convergence of the obtained results were analysed. In a more recent paper [35], a similar numerical analysis was presented for the boundary integral method implemented to account for the turbine mesh. In both of these cited works, some analysis of computational times was also provided.

2.2. Synthetic Eddy Method

In order to take into account the ambient turbulence in the Lagrangian Vortex Blob formulation, the Synthetic Eddy Method (SEM) of Jarrin et al. [26] was adapted and implemented (see [31,32]). After a brief presentation of this method, a few numerical parameters will be detailed. Their influence on the turbine wakes will be studied in the following sections.
In the Synthetic Eddy Method, ambient turbulence in the upstream flow is accounted for by modifying the upstream velocity u ( u = u e x + v e y + w e z ). This upstream velocity is rewritten by applying the Reynolds decomposition:
u ( x , t ) = u ¯ ( x ) + u ( x , t ) ,
where u ¯ is the mean velocity of the flow and u its fluctuating part.
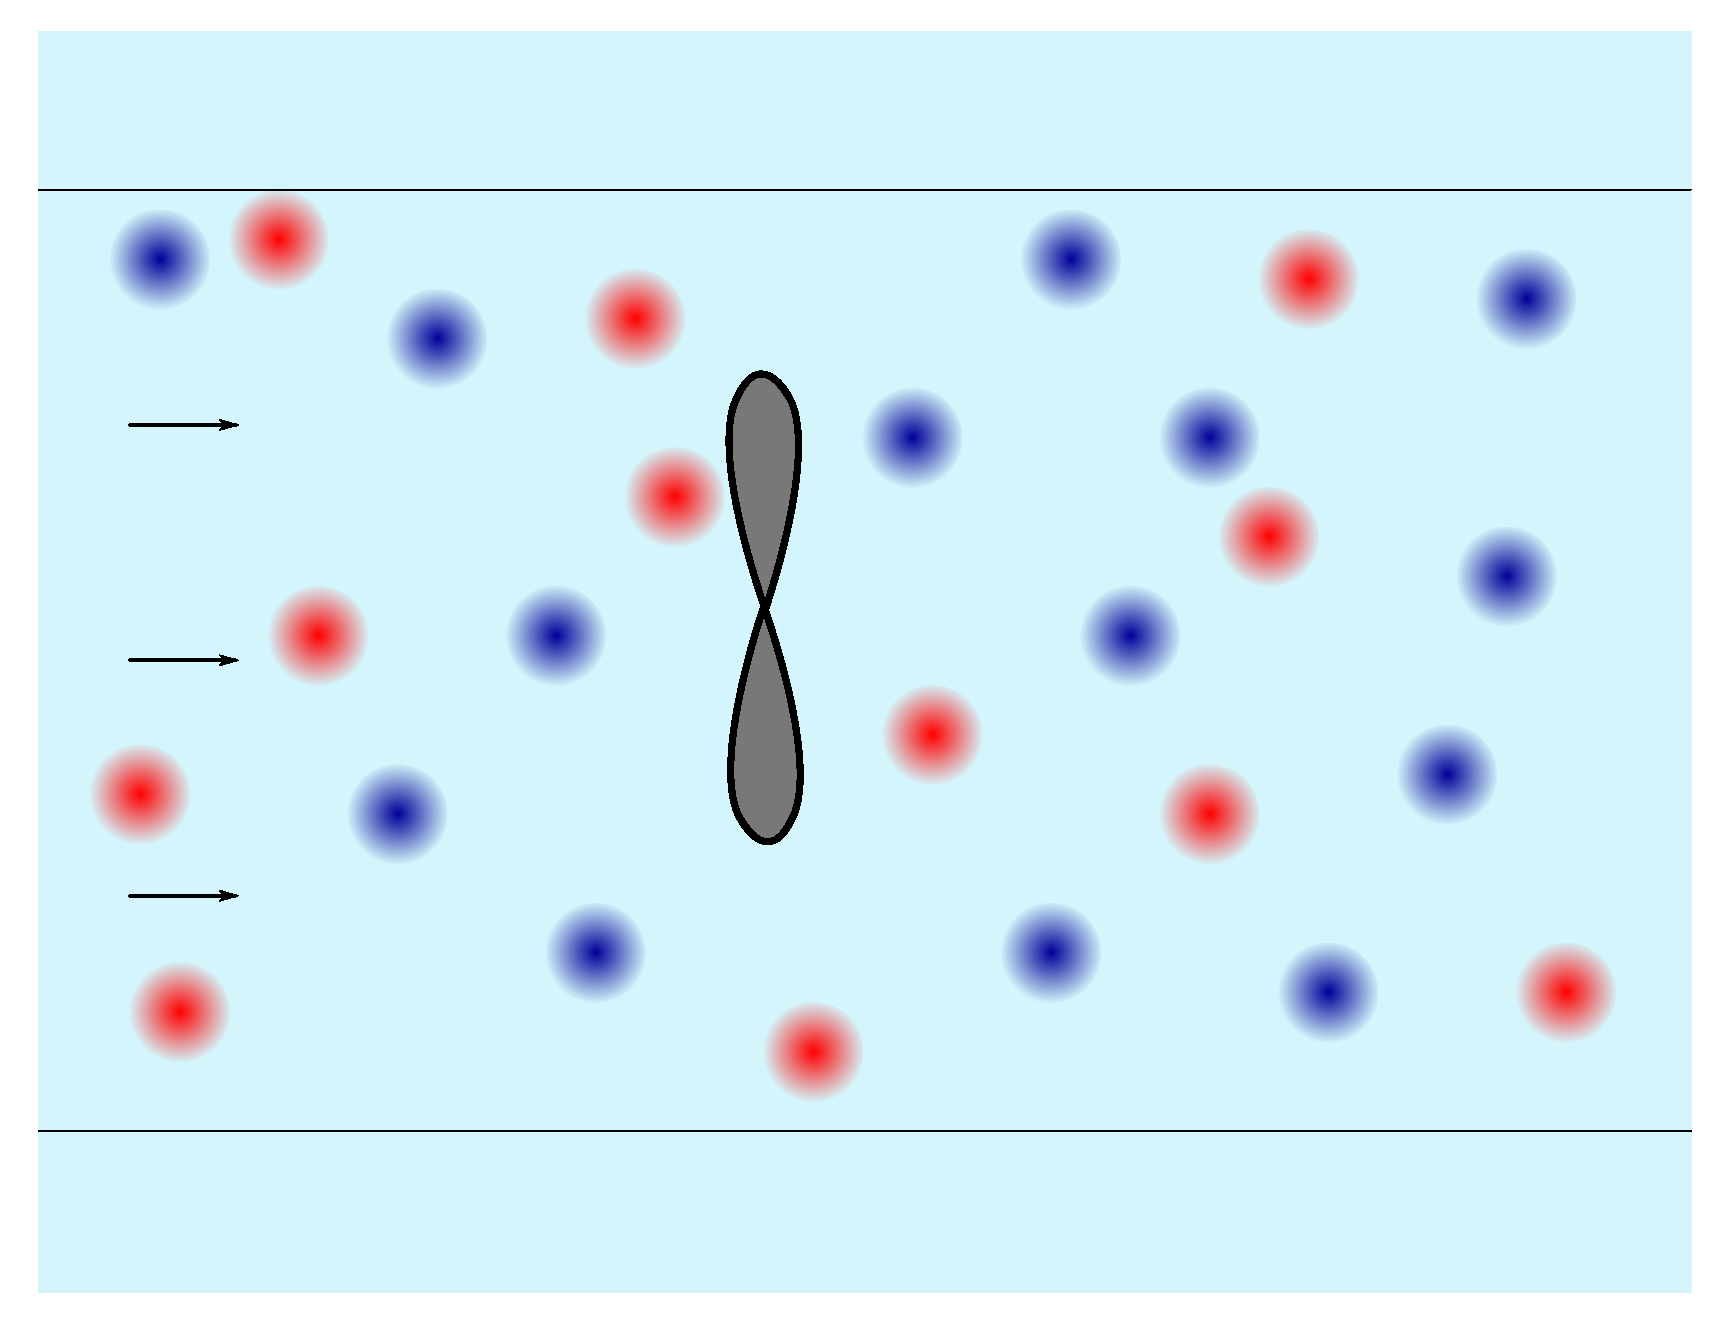
Jarrin et al. consider the fluctuating velocity u as a perturbation term encompassing the fluctuations due to ambient turbulence. This term is calculated as the sum of the velocity perturbations caused by N turbulent structures (see Figure 2) randomly placed within a three-dimensional study space of volume V 0 :
u ( x ) = 1 N k = 1 N c k f λ ( x x k λ ) ,
where f λ is a shape function and c k is the intensity of a single turbulent structure k of centre point x k . The three components of the intensity c k are defined as:
c i k = j = 1 3 a i j ϵ i j k , i { 1 , 2 , 3 } , k 1 , N .
The coefficients a i j are the elements of the Cholesky decomposition matrix of the Reynolds stress tensor R ¯ ¯ = A ¯ ¯ t A ¯ ¯ [53]:
a i j = R 11 0 0 R 21 / a 11 R 22 a 21 2 0 R 31 / a 11 ( R 32 a 21 a 31 ) / a 22 R 33 a 31 2 a 32 2 = A ¯ ¯ .
The random nature of ambient turbulence is represented by the randomly assigned signs ϵ i j k , which have an equal probability of being + 1 or 1 , as well as the random initial position of the turbulent structures. This sign will decide whether the structure is a velocity source ( ϵ i j k = + 1 ) or a velocity sink ( ϵ i j k = 1 ), depicted by different colours in Figure 2.
Equations (11) and (12) ensure the generation of a velocity field that statistically reproduces any given turbulence intensity I and Reynolds stress tensor R ¯ ¯ . Indeed, the turbulence intensity I is defined as:
I = 100 1 / 3 ( σ u 2 + σ v 2 + σ w 2 ) u ¯ 2 + v ¯ 2 + w ¯ 2
where σ u , σ v and σ w are the standard deviations of the velocity components u , v and w of the upstream velocity u . I can also be written as a function of the trace of the Reynolds Stress Tensor R ¯ ¯ :
I = 100 | u ¯ | tr R ¯ ¯ 3 .
The shape function f λ , which appears in (10), needs to respect several constraints in order to ensure the statistical convergence of the imposed turbulence conditions, such as:
f λ C 0 ( R , R ) f λ ( x ) = f λ ( x ) f λ ( x ) = 0 x [ λ , λ ] a r g m a x ( f λ ( x ) ) = 0 λ λ f λ 2 ( x ) d y = 1
where the parameter λ is a length scale defining the area of influence of each turbulent structure. The first two continuity and symmetry conditions ensure the regular shape of each turbulent structure, while the third condition limits the influence of each turbulent structure to its sole radius λ . The last two conditions will ensure that the average Reynolds Stress Tensor resulting from the perturbation velocity formulation of Equation (10) is mathematically equivalent to the prescribed tensor R ¯ ¯ from which are chosen the coefficients a i j .
More details about Jarrin’s formulation can be found in [26,54]. A detailed presentation of the adaptation of the SEM to the Lagrangian Vortex Blob formalism is proposed in Choma Bex et al. [32]. In particular, different shape functions f λ are considered. In the present work, a Gaussian shape function is used.

2.3. Numerical Parameters

As explained previously, λ defines the area of influence of each turbulent structure. It is a parameter which can be chosen based on the characteristics of the ambient turbulence which the user desires to reproduce. The results obtained by Choma Bex et al. [32] show that λ is proportional to the integral length scale L of the generated flow (estimated from the autocorrelation function of the streamwise velocity). For a Gaussian shape function f λ , L 0.654 λ .
If only one value is used for λ , all turbulent structures have the same size and this results in a poor reproduction of the velocity power spectral density [31,32]. Thus, in order to better represent the true physical phenomenon of the turbulence, a standard deviation of the size of turbulent structures, denoted σ ( λ ) , was added as a parameter of the model by Choma Bex et al. [32]. The size of all turbulent structures are calculated using a normal distribution law centred around an average value still noted λ . The standard deviation σ ( λ ) is expressed as a percentage of the variable λ (e.g., σ ( λ ) = 10 % = 0.1 λ ). At σ ( λ ) = 0 % , all turbulent structures have the same size λ . A standard deviation σ ( λ ) = 100 % around the average value λ = 0.5 implies that the size of a turbulent structure k can range from λ k = 0 to λ k = 1 .
Lastly, in order to evaluate the saturation level of turbulent structures in the study space, a filling ratio R f is defined:
R f = 4 3 π λ 3 N V 0 .
This ratio represents the density of turbulent structures within the study volume V 0 . Values of R f higher than 1 signify that several turbulent structures are overlapping each other.
The influence of these three parameters on the wake of a single turbine in a straight flow is studied in the following section.

3. Computation of a Single Tidal Turbine

3.1. Numerical Set-Up and Tested Configurations

The tidal turbine modelled in this study has a diameter D of 18 m. The blades of Alstom’s Oceade™ turbine are patented, which is why we chose to use an openly accessible turbine model instead, which corresponds to the generic turbine of the IFREMER (French Research Institute for Exploitation of the Sea). Experimental results obtained for the latter by Mycek et al. [55] will be used for comparison. More details about the numerical model and IFREMER’s turbine can be found in [9].
Within these simulations the mesh is only made up of a zero-thickness surface mesh for the blades and possibly the turbine nacelle if used (see Figure 3). The fluid is represented by Lagrangian vortex particles freely evolving throughout the computational domain following the Navier–Stokes equations. When using the SEM for the addition of ambient turbulence, a study space must be defined where the turbulent structures will be placed, as explained in Section 2. Here, the dimensions of this space are L x = 243 m = 13.5 D along the main flow direction, and L y = L z = 108 m = 6 D along the horizontal and vertical directions. The blade surface meshes are defined as those presented in previous studies [9,32,35]. In the present work, 11 mesh elements are discretising the blade along the blade radius and 5 along the blade chord. To complete the discretisation parameters, the interparticle spacing is set to d h = 0.6 m, similar to the surface mesh discretisation along the blade radius, with a smoothing parameter of δ = 1.5 d h . In all the following computations, the upstream incoming velocity was set to U = 3.2 m/s. The Tip Speed Ratio (defined as TSR = ω R / U , where ω and R are the rotational speed and the turbine radius respectively) was set to 3.67 in Section 3.2 and Section 3.3 for comparison with the experimental results. In Section 3.4, the TSR was set to 4.1 in order to have the same rotational speed as the one used for the NEPTHYD configuration of Section 4. A time step of d t = 0.044 s was imposed owing to the CFL-like condition for vortex methods and the simulation time was set to 200 seconds. Finally, an isotropic turbulence is used and different turbulence intensities I , structure sizes λ , standard deviations σ ( λ ) and filling ratios R f are considered. All the results presented here are time-averaged. As the fluctuating turbulence has by definition a zero average ( u ¯ = 0 ), this component was removed during the postprocessing of the time-averaged velocity maps, to emulate the effect of a much longer time average than the last 68 s (90 s to 103 s for Section 3.4) of 200 s simulations used here.

3.2. Taking into Account the Nacelle

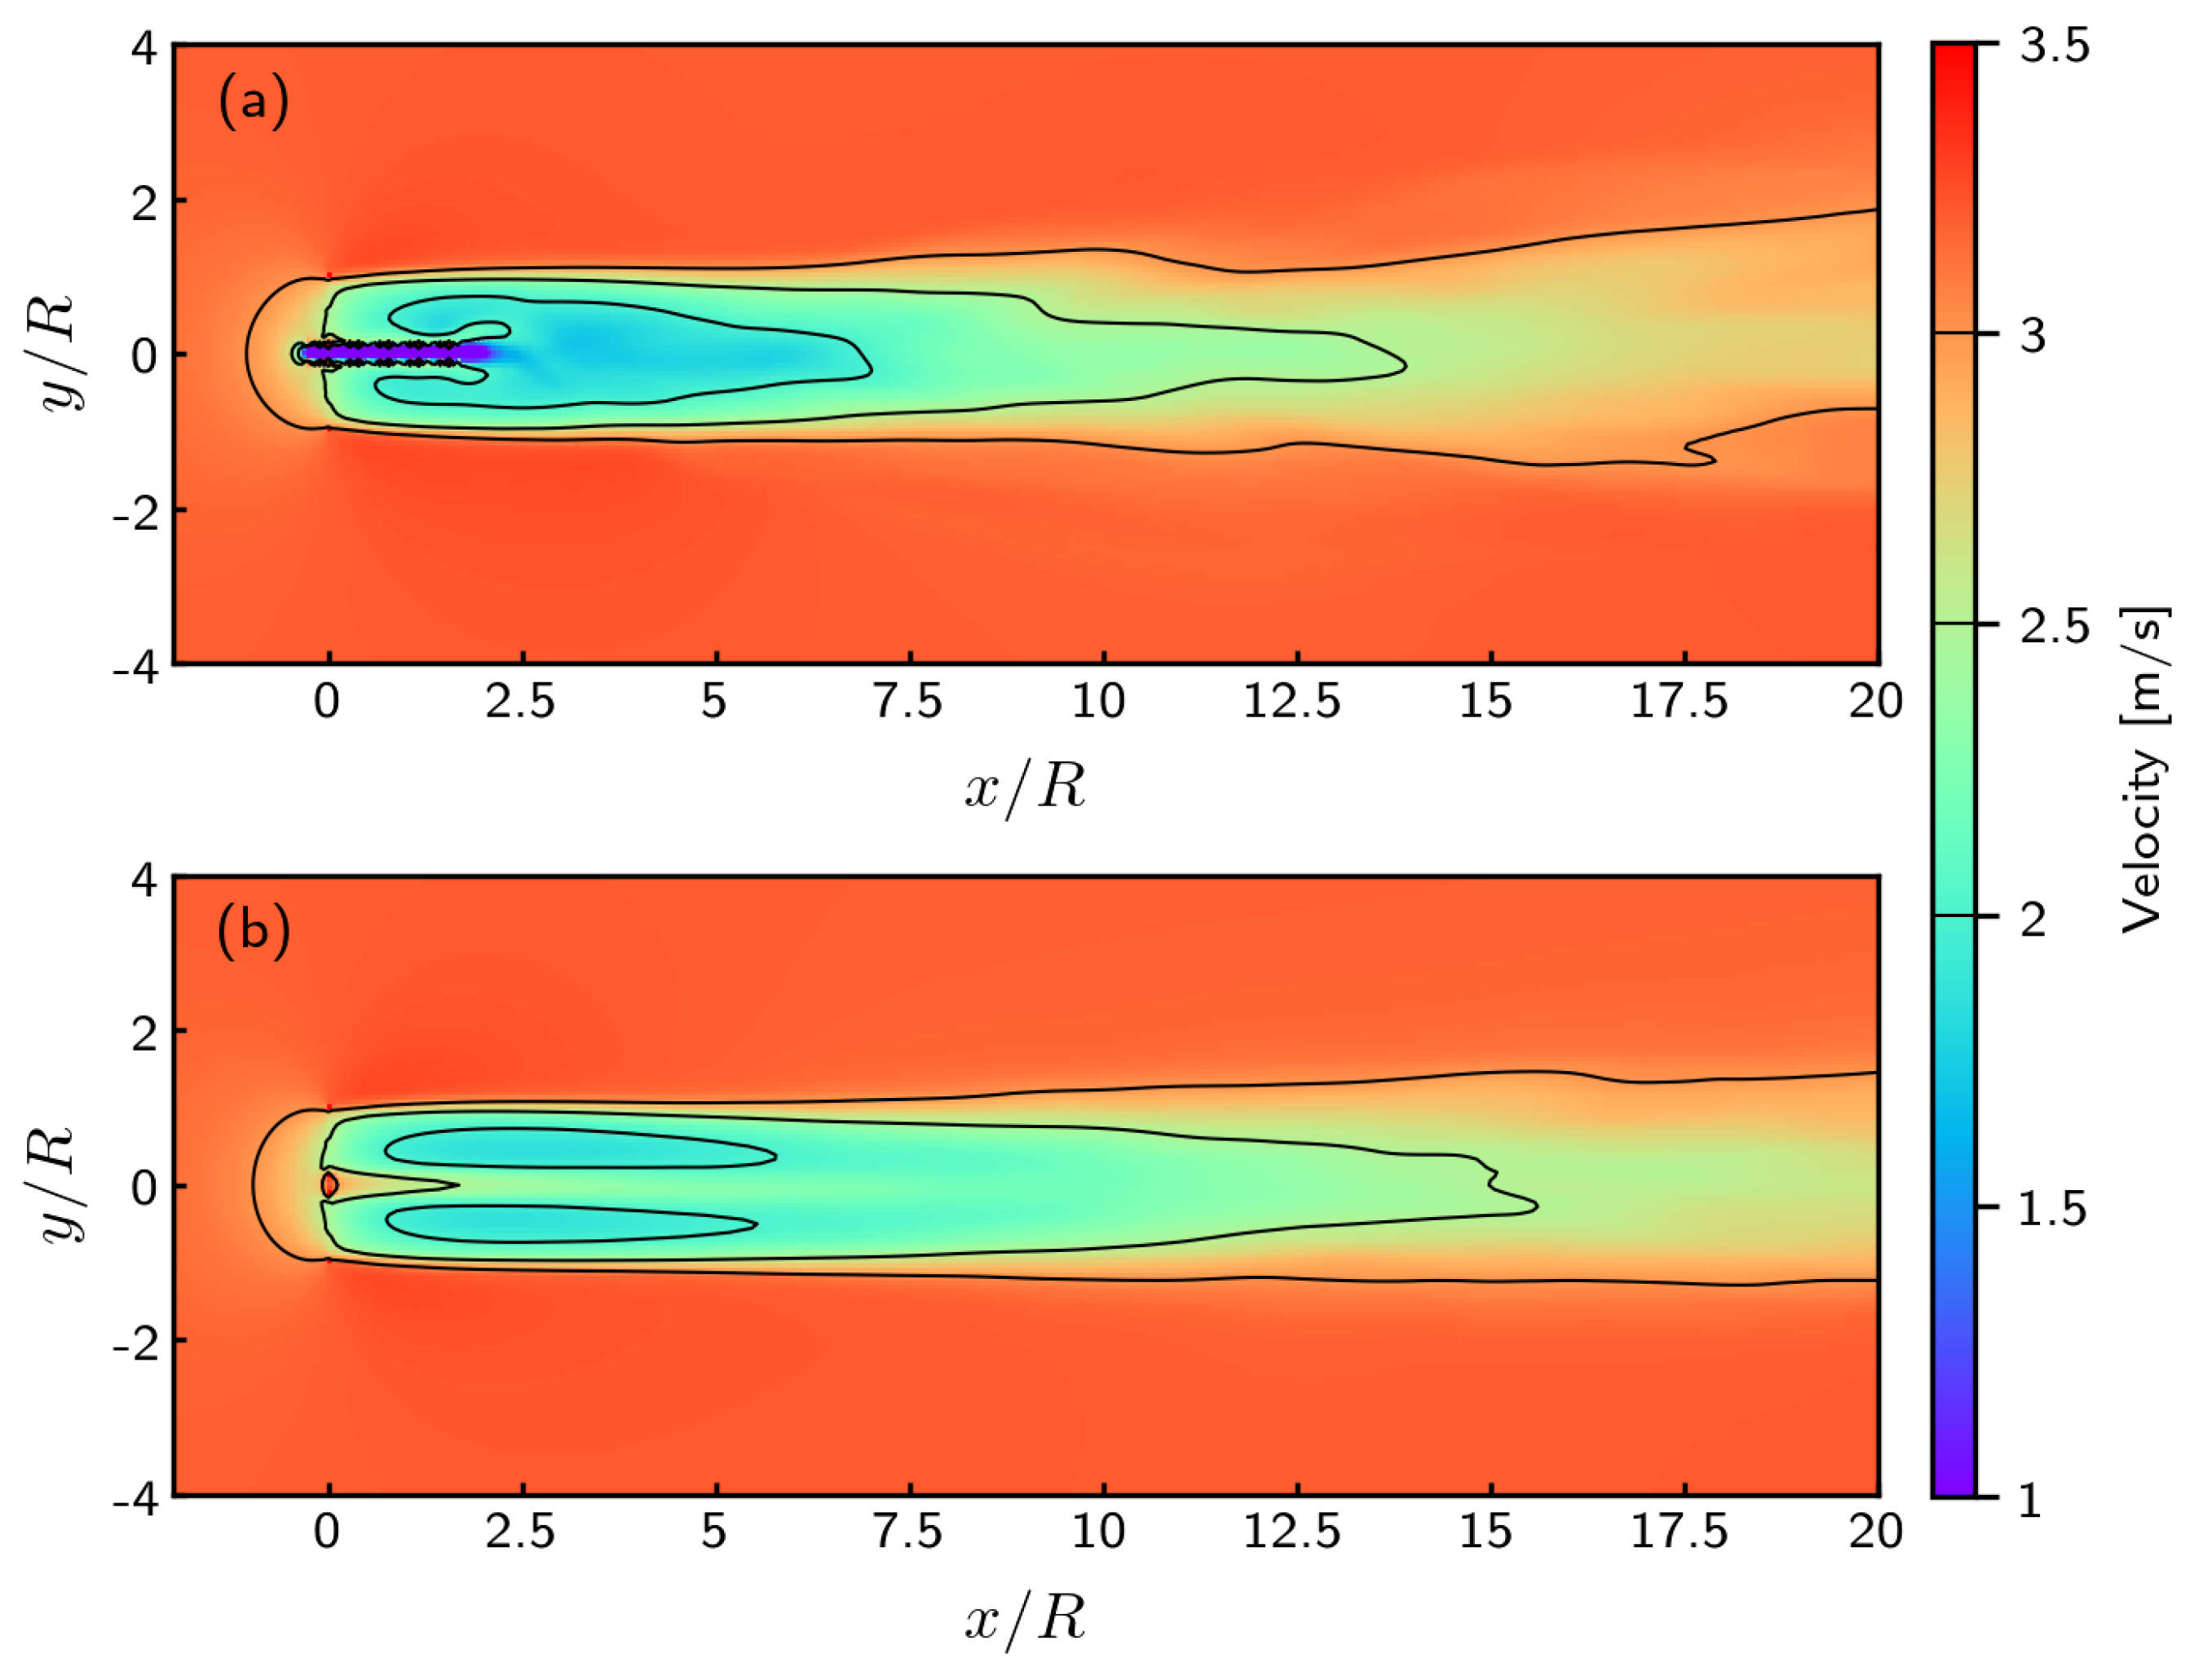
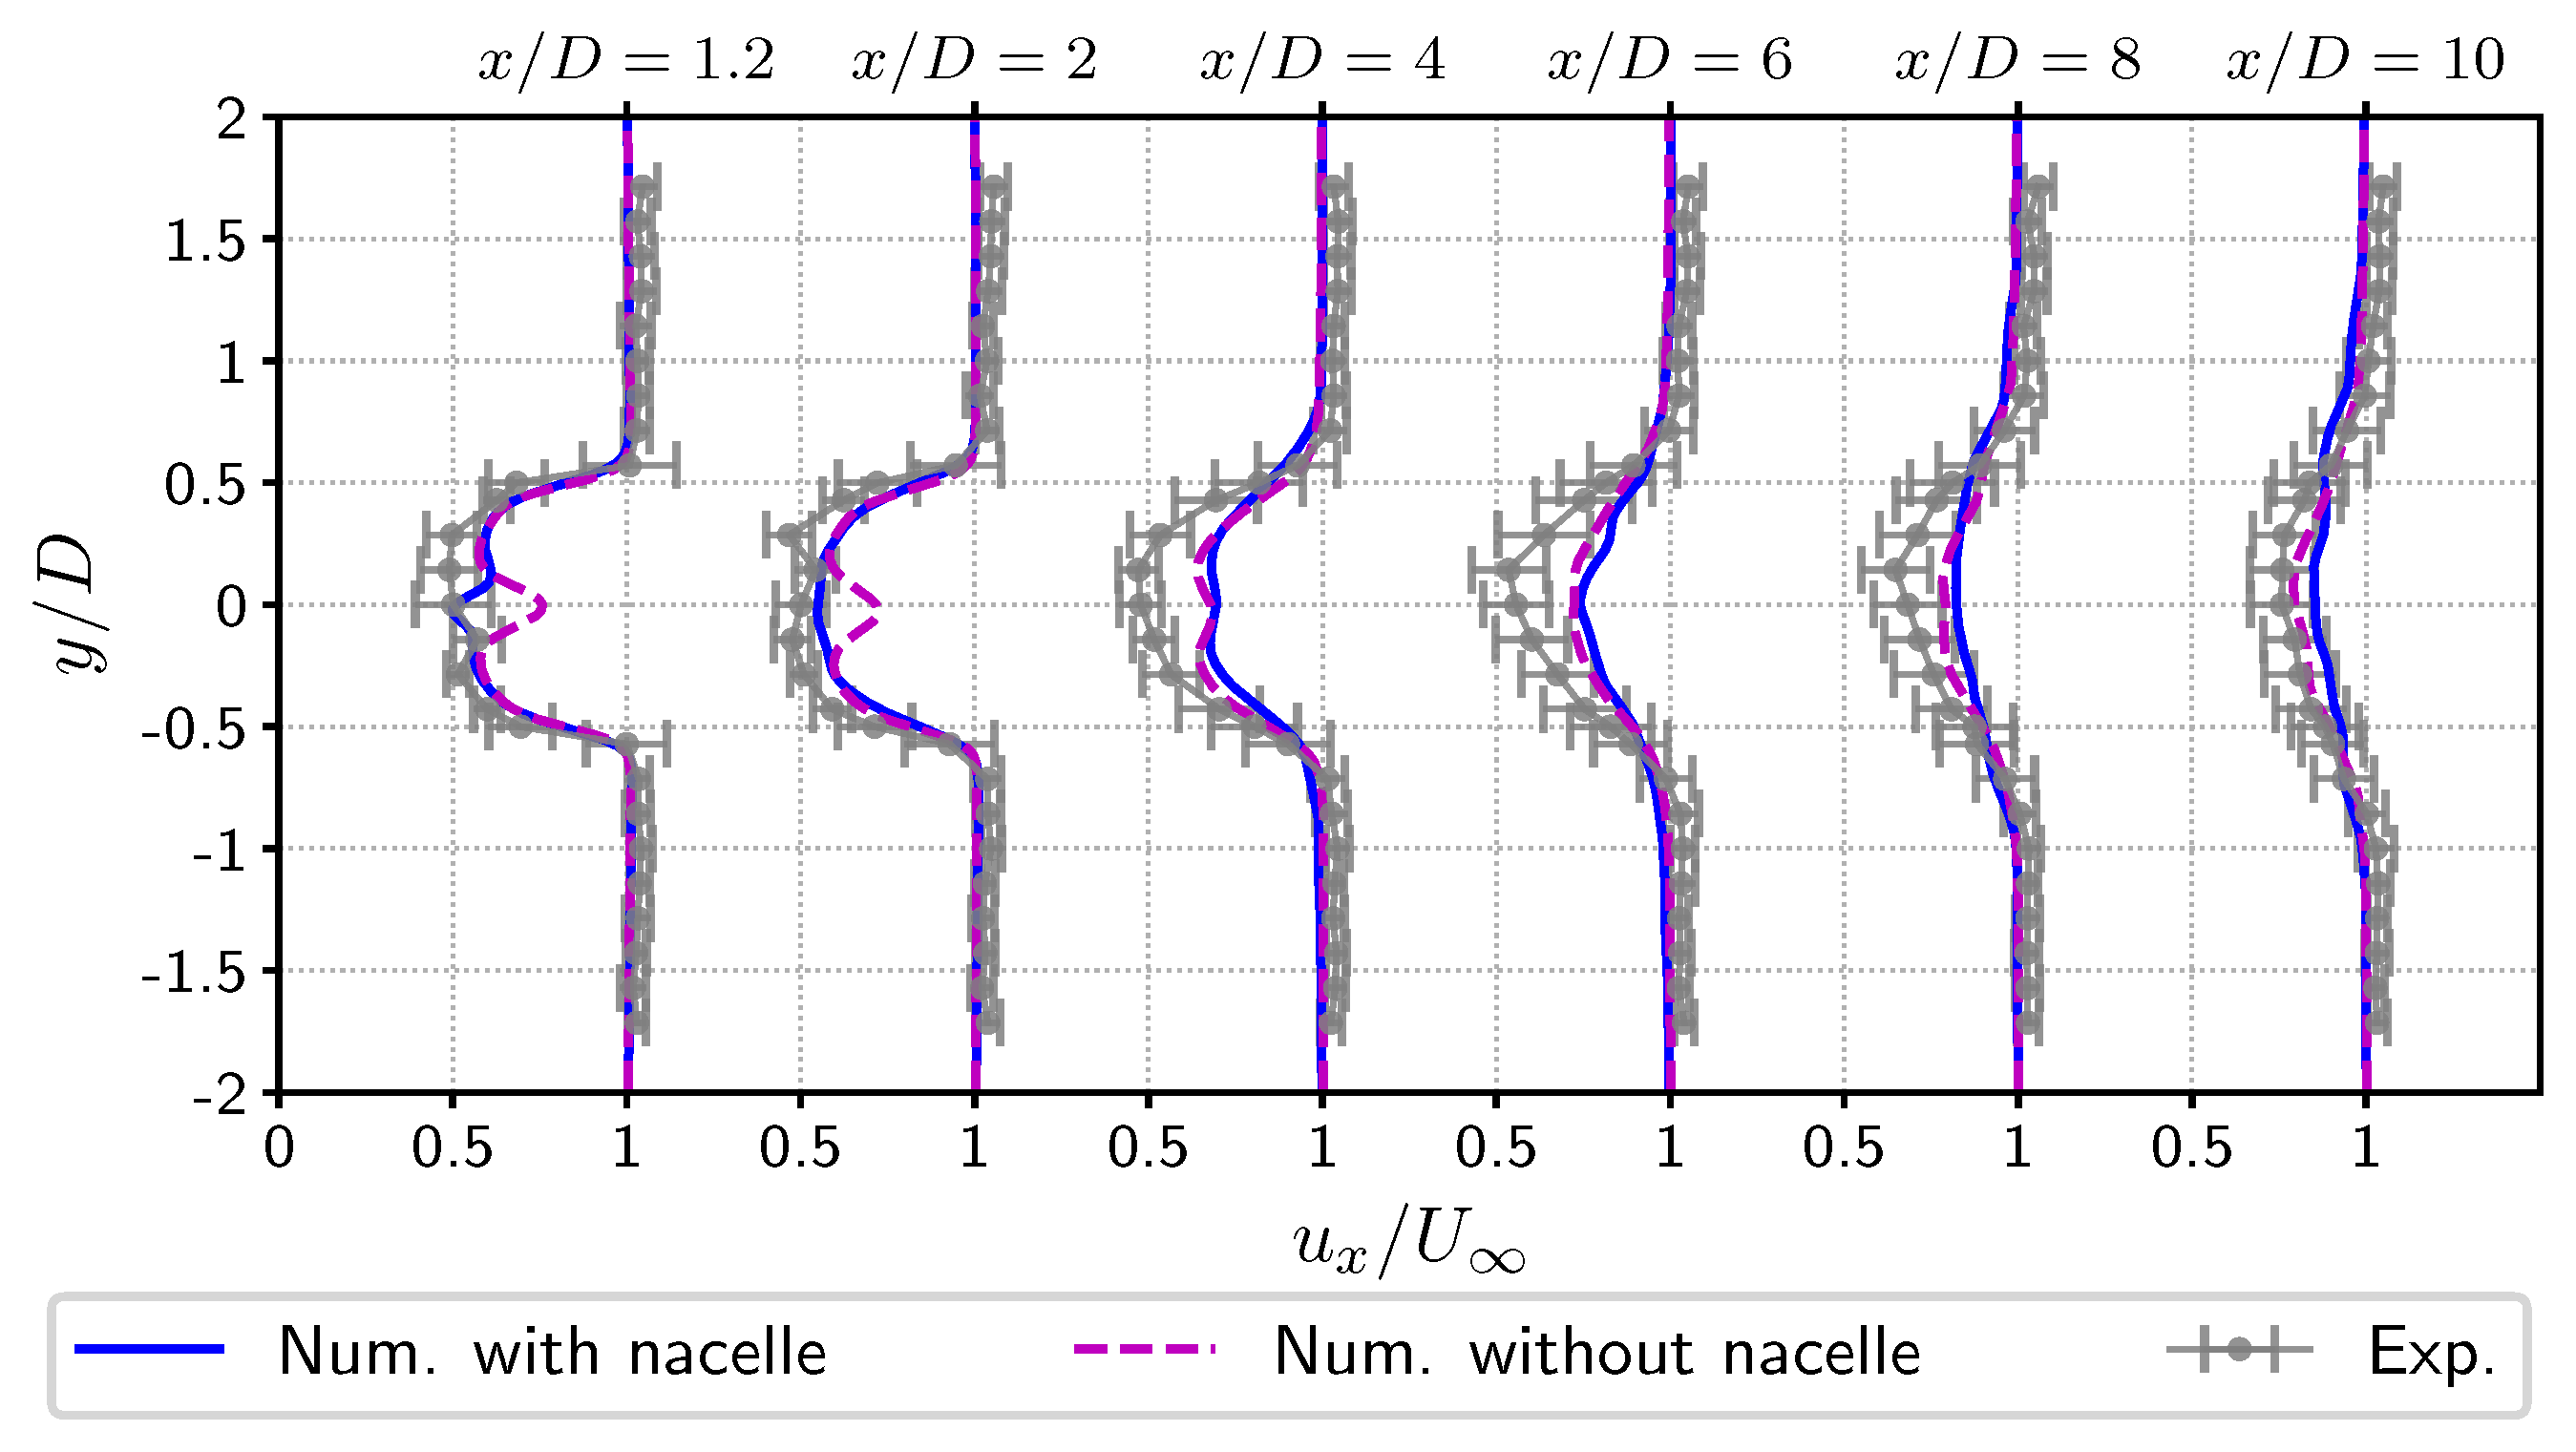
In [32,56], it was reported that the use of the turbine nacelle could possibly generate some numerical instabilities. Even though the source of these instabilities was found and fixed, the question of the inclusion of the turbine nacelle can still be posed. Looking at the numerically computed wake velocity fields presented in Figure 4 would make the answer tend towards the necessity of its inclusion. The near wake is really different and a much larger velocity deficit is experienced when using the nacelle. However, the global wake length is near-identical, even for this low ambient turbulence value of I = 1.5 % . Looking at the corresponding velocity profiles presented in Figure 5 confirms this analysis. The first two velocity profiles at x / D = 1.2 and x / D = 2 are very different depending on whether the nacelle is included or not. The presence of the nacelle markedly improves the result in comparison with the single turbine wake measurement done at laboratory scale with a similar ambient turbulence intensity and reproduced from [55]. However, for the four remaining velocity profiles depicted in Figure 5, the differences with and without the nacelle are not very significant. It could be argued that taking into account the nacelle would bring about an additional numerical complexity with a low benefit to the end quality of result, especially in the far wake. Moreover, the differences are here highlighted by the fact that the turbulence intensity I is very low, and the reported values are much higher in the Alderney Race as it will be presented in Section 4.
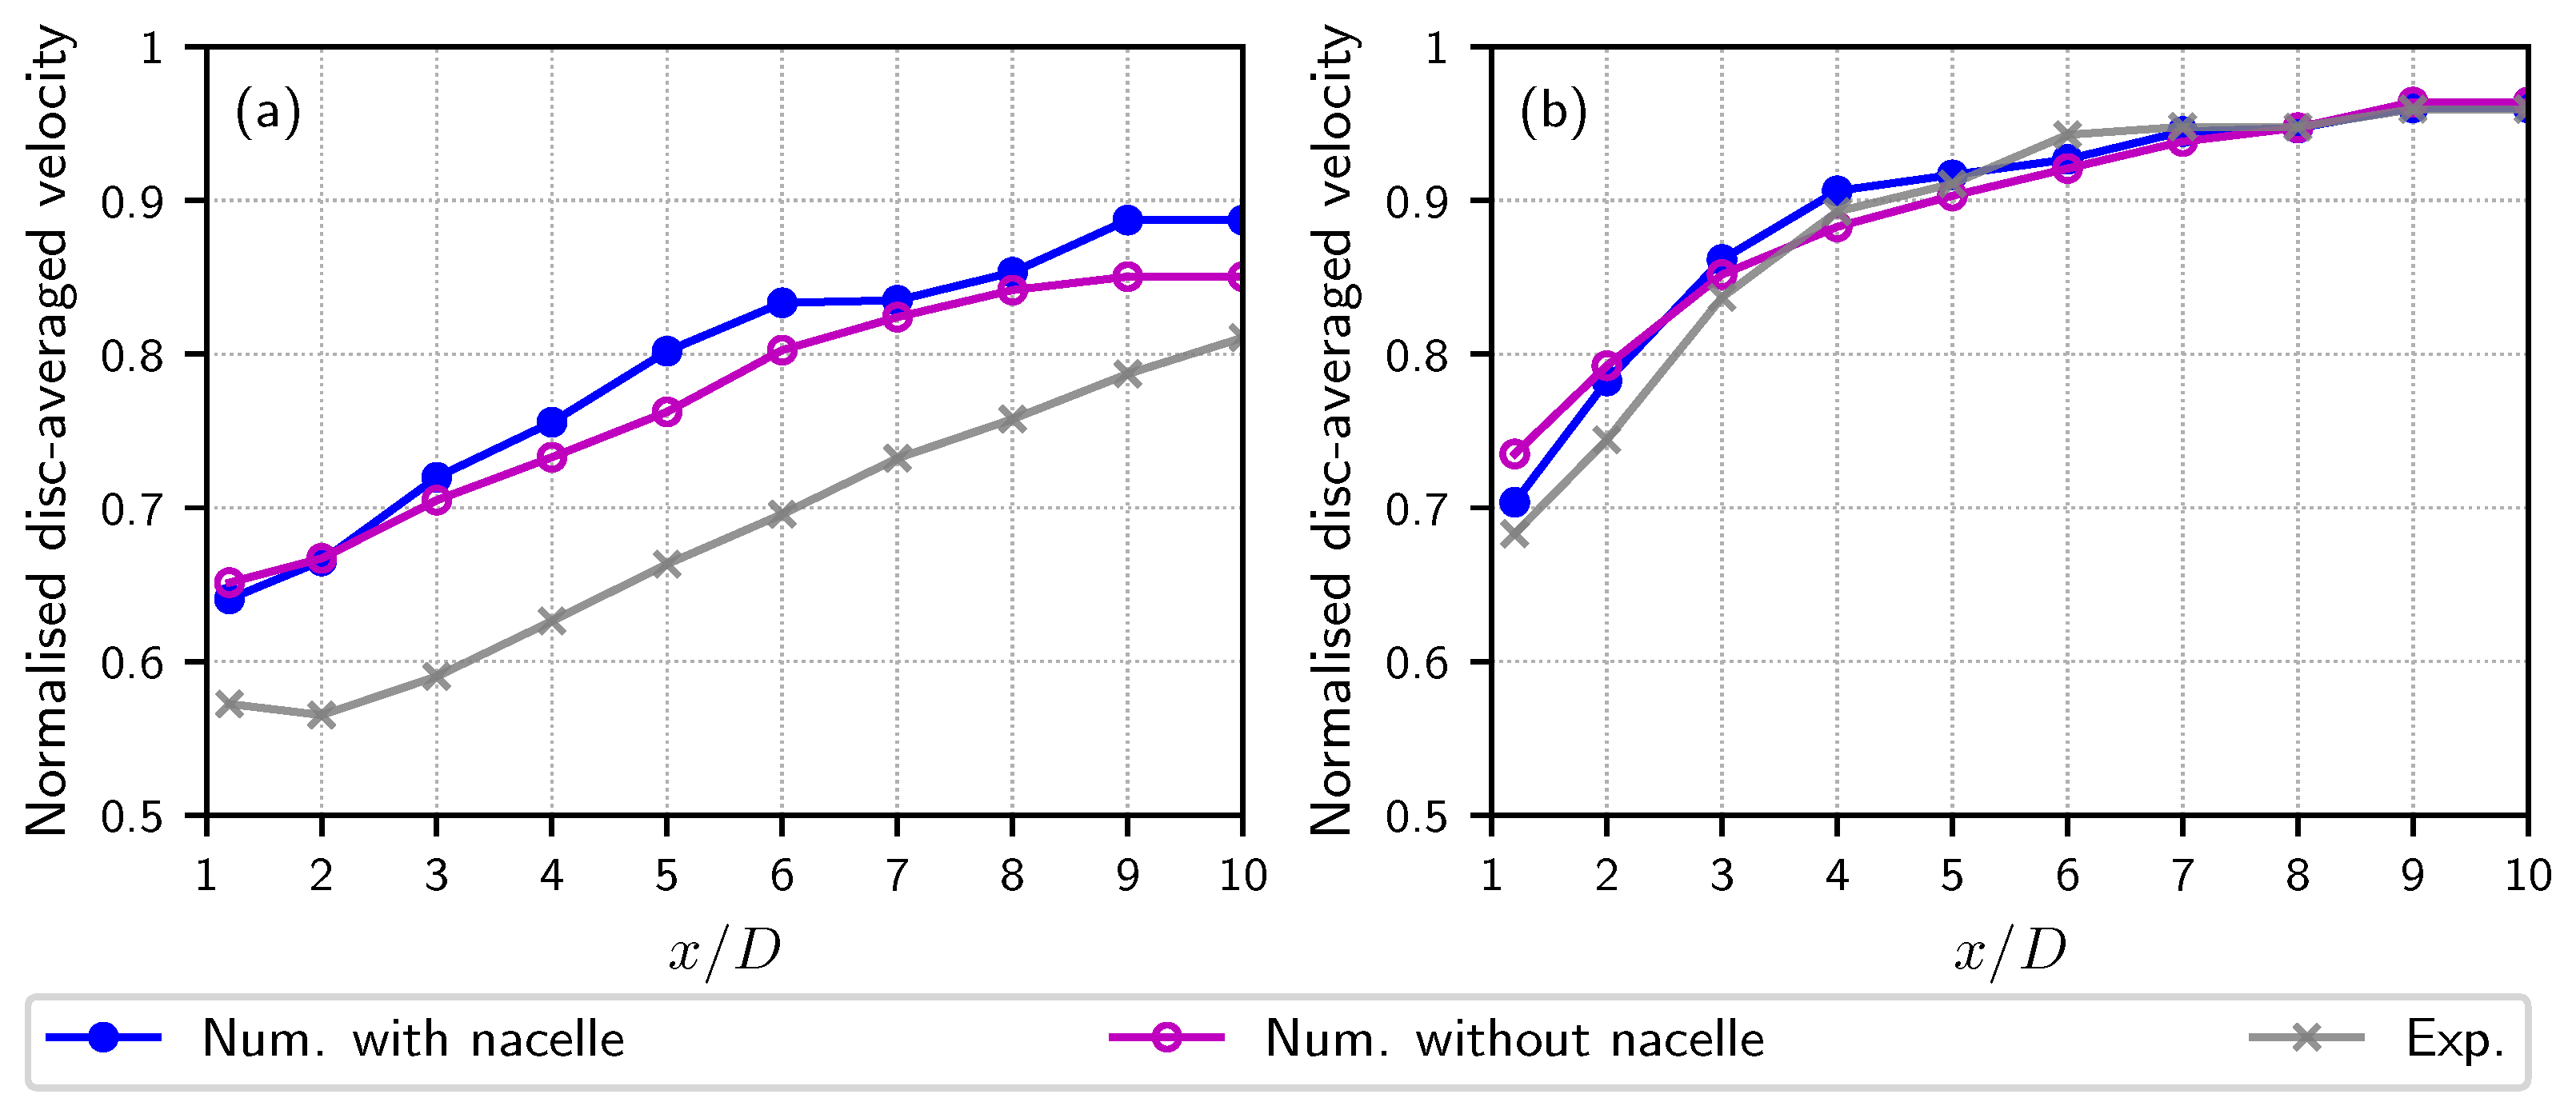
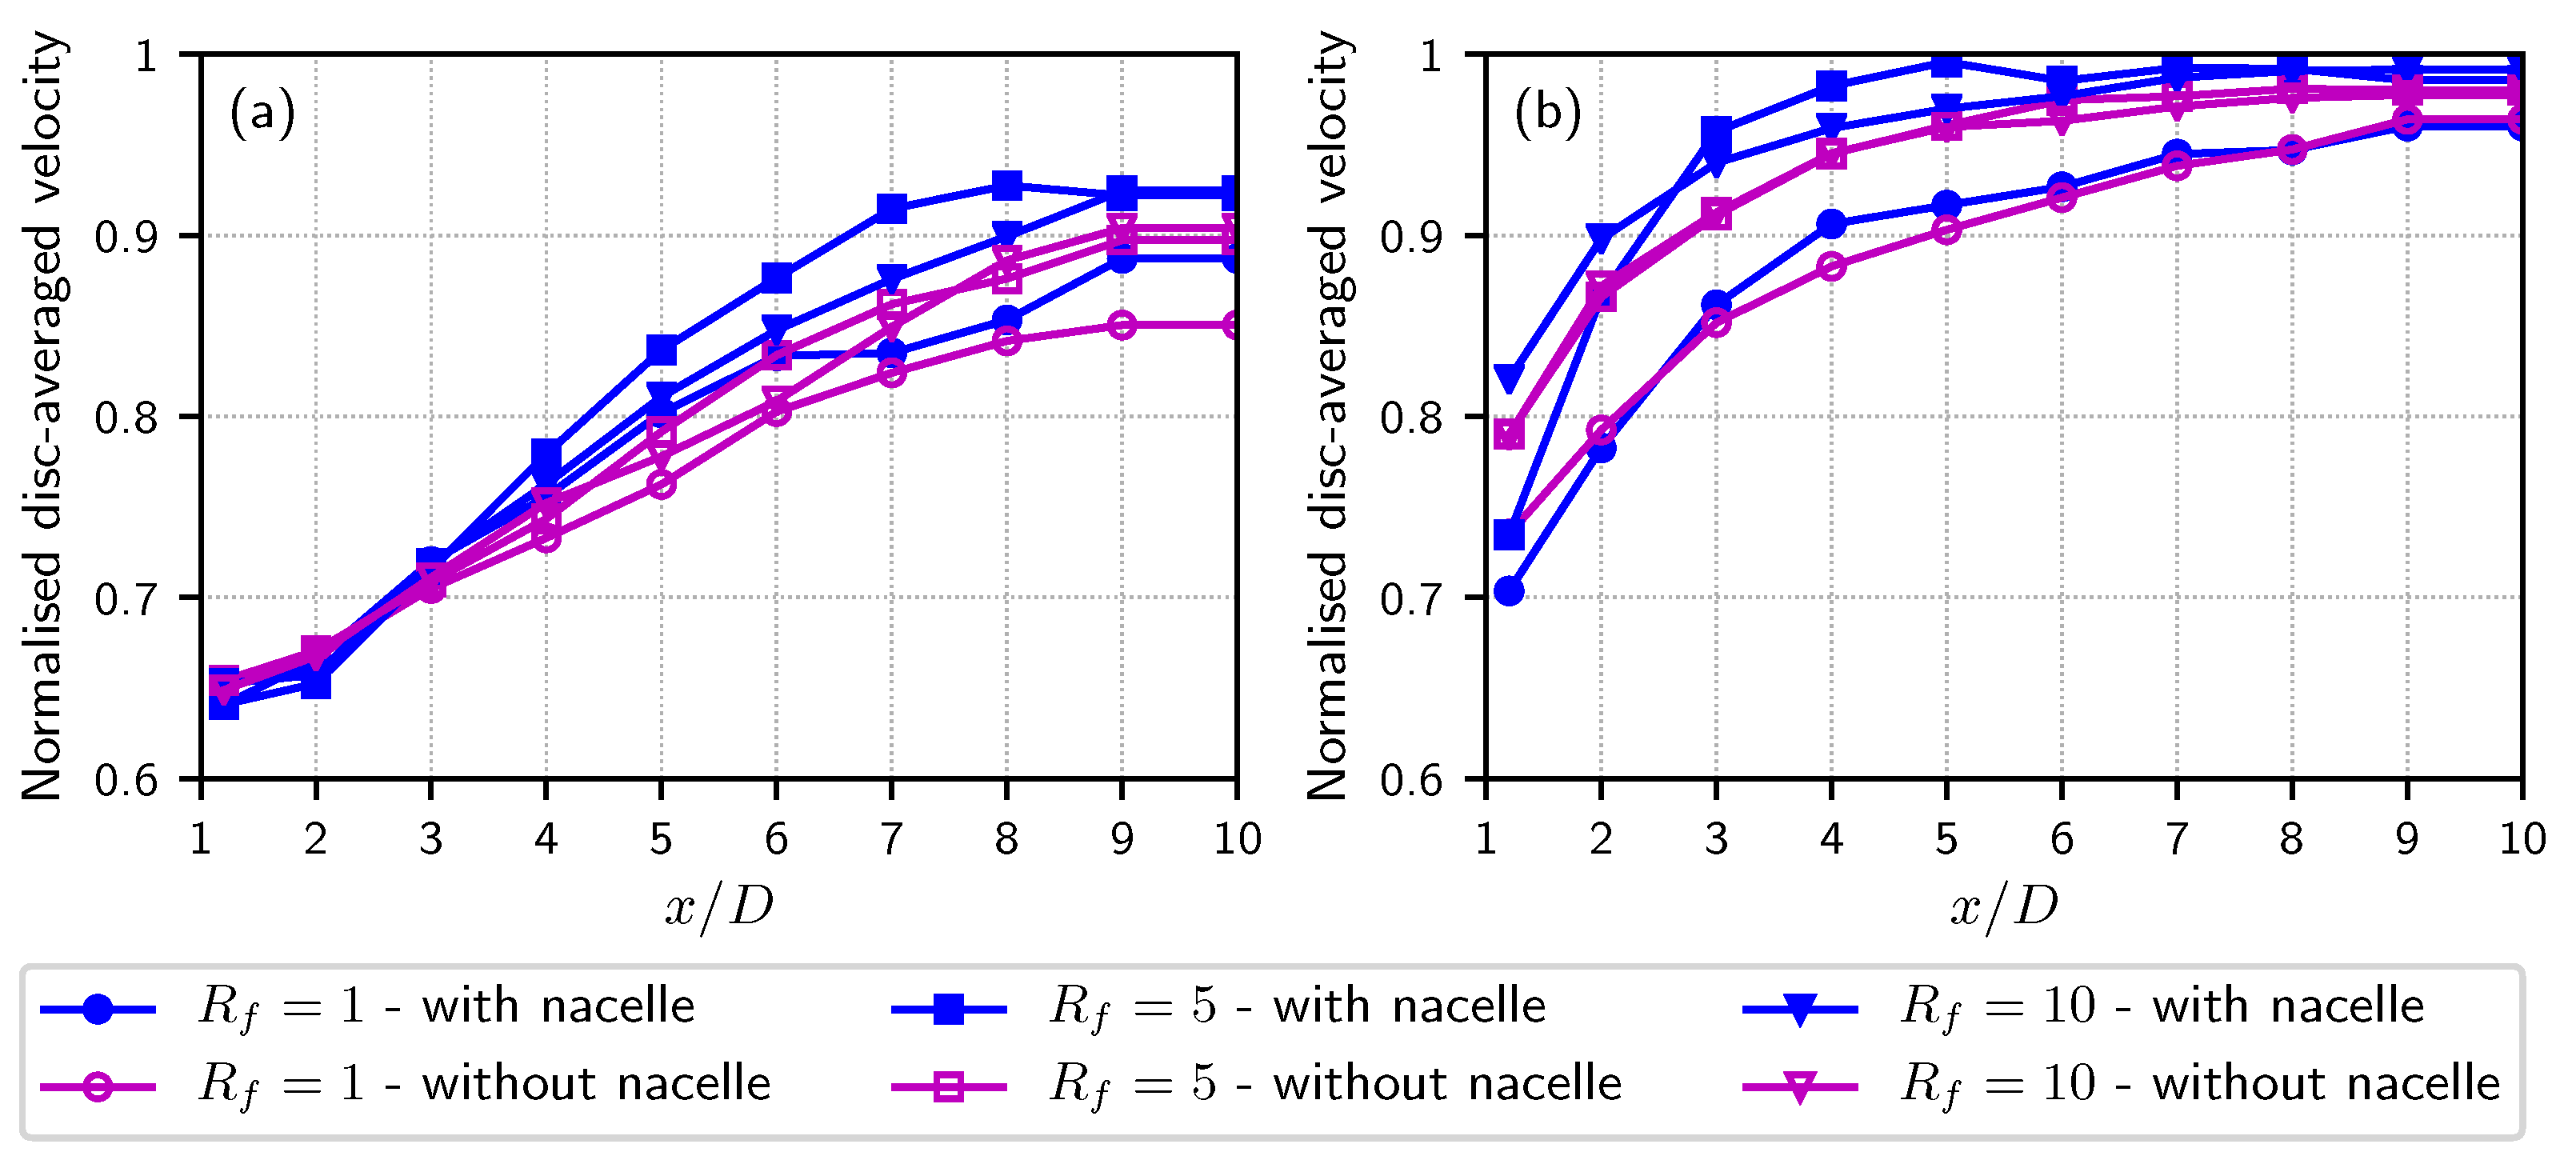
In order to evidence and compare more succinctly the shape of these turbine wakes, we consider the value of the average wake velocity integrated on the area of discs of the same diameter as that of the turbine, sampled at various distances in the turbine wake and normalised by the disc integrated value of the average upstream velocity U . This procedure of wake integration is clearly presented in [55] for experimental results. Figure 6 shows that the differences on this quantity caused by the omission of the nacelle are minimal. Moreover, both numerical curves with I = 1.5 % are underestimating the experimental integrated velocity (see Figure 6a), which is a problem already identified and possibly due to a too high numerical dissipation, particularly visible at low ambient turbulence. However, for the highest ambient turbulence value of I = 15 % , the comparison of both numerical results with the experimental results depicted in Figure 6b are really encouraging us towards the simplest solution. Therefore, for the remainder of this paper, the turbine nacelle will not be taken into consideration as a matter of numerical simplification and speed-up.

3.3. Influence of the Filling Ratio Rf

The present subsection focuses on the evaluation of the influence of the filling ratio R f defined in Equation (16) of Section 2. Due to the nature of the SEM as a stochastic representation of the ambient turbulent velocity field, a large number of turbulent structures and hence a high value of R f is necessary to statistically represent the turbulent velocity field. The numerical assessment on this statistical convergence of the numerically obtained I presented in [32,56] concluded that a R f value higher than one is sufficient to have a statistical convergence, bearing in mind that the total number of structures should not be too low to have enough statistical representation. However, as the turbulent structure size λ is increased to better represent the in situ turbulence integral length scale L, a higher value than one may be necessary to have enough structures to ensure the above mentioned statistical representation. In that respect, Figure 7 shows the disc-averaged velocity deficit for turbulence intensities of I = 1.5% in Figure 7a and I = 15% in Figure 7b. For the lower I value, the numerical disc-averaged velocity deficit was already too dissipative as indicated in Section 3.2 (Figure 6a). A higher value of R f is slightly intensifying the phenomenon of numerical dissipation and even more for the far wake from x / D 5 D in Figure 7a. For I = 15%, the results with R f = 1 are in accordance with the experimental results, as highlighted in Figure 6b. However, an overestimation of the disc-averaged velocity is also visible for R f 5 as depicted in Figure 7b. As the ambient turbulence value is higher and the turbulence structures are more numerous with R f > 1 , such a phenomenon is understandable and physically interpretable.
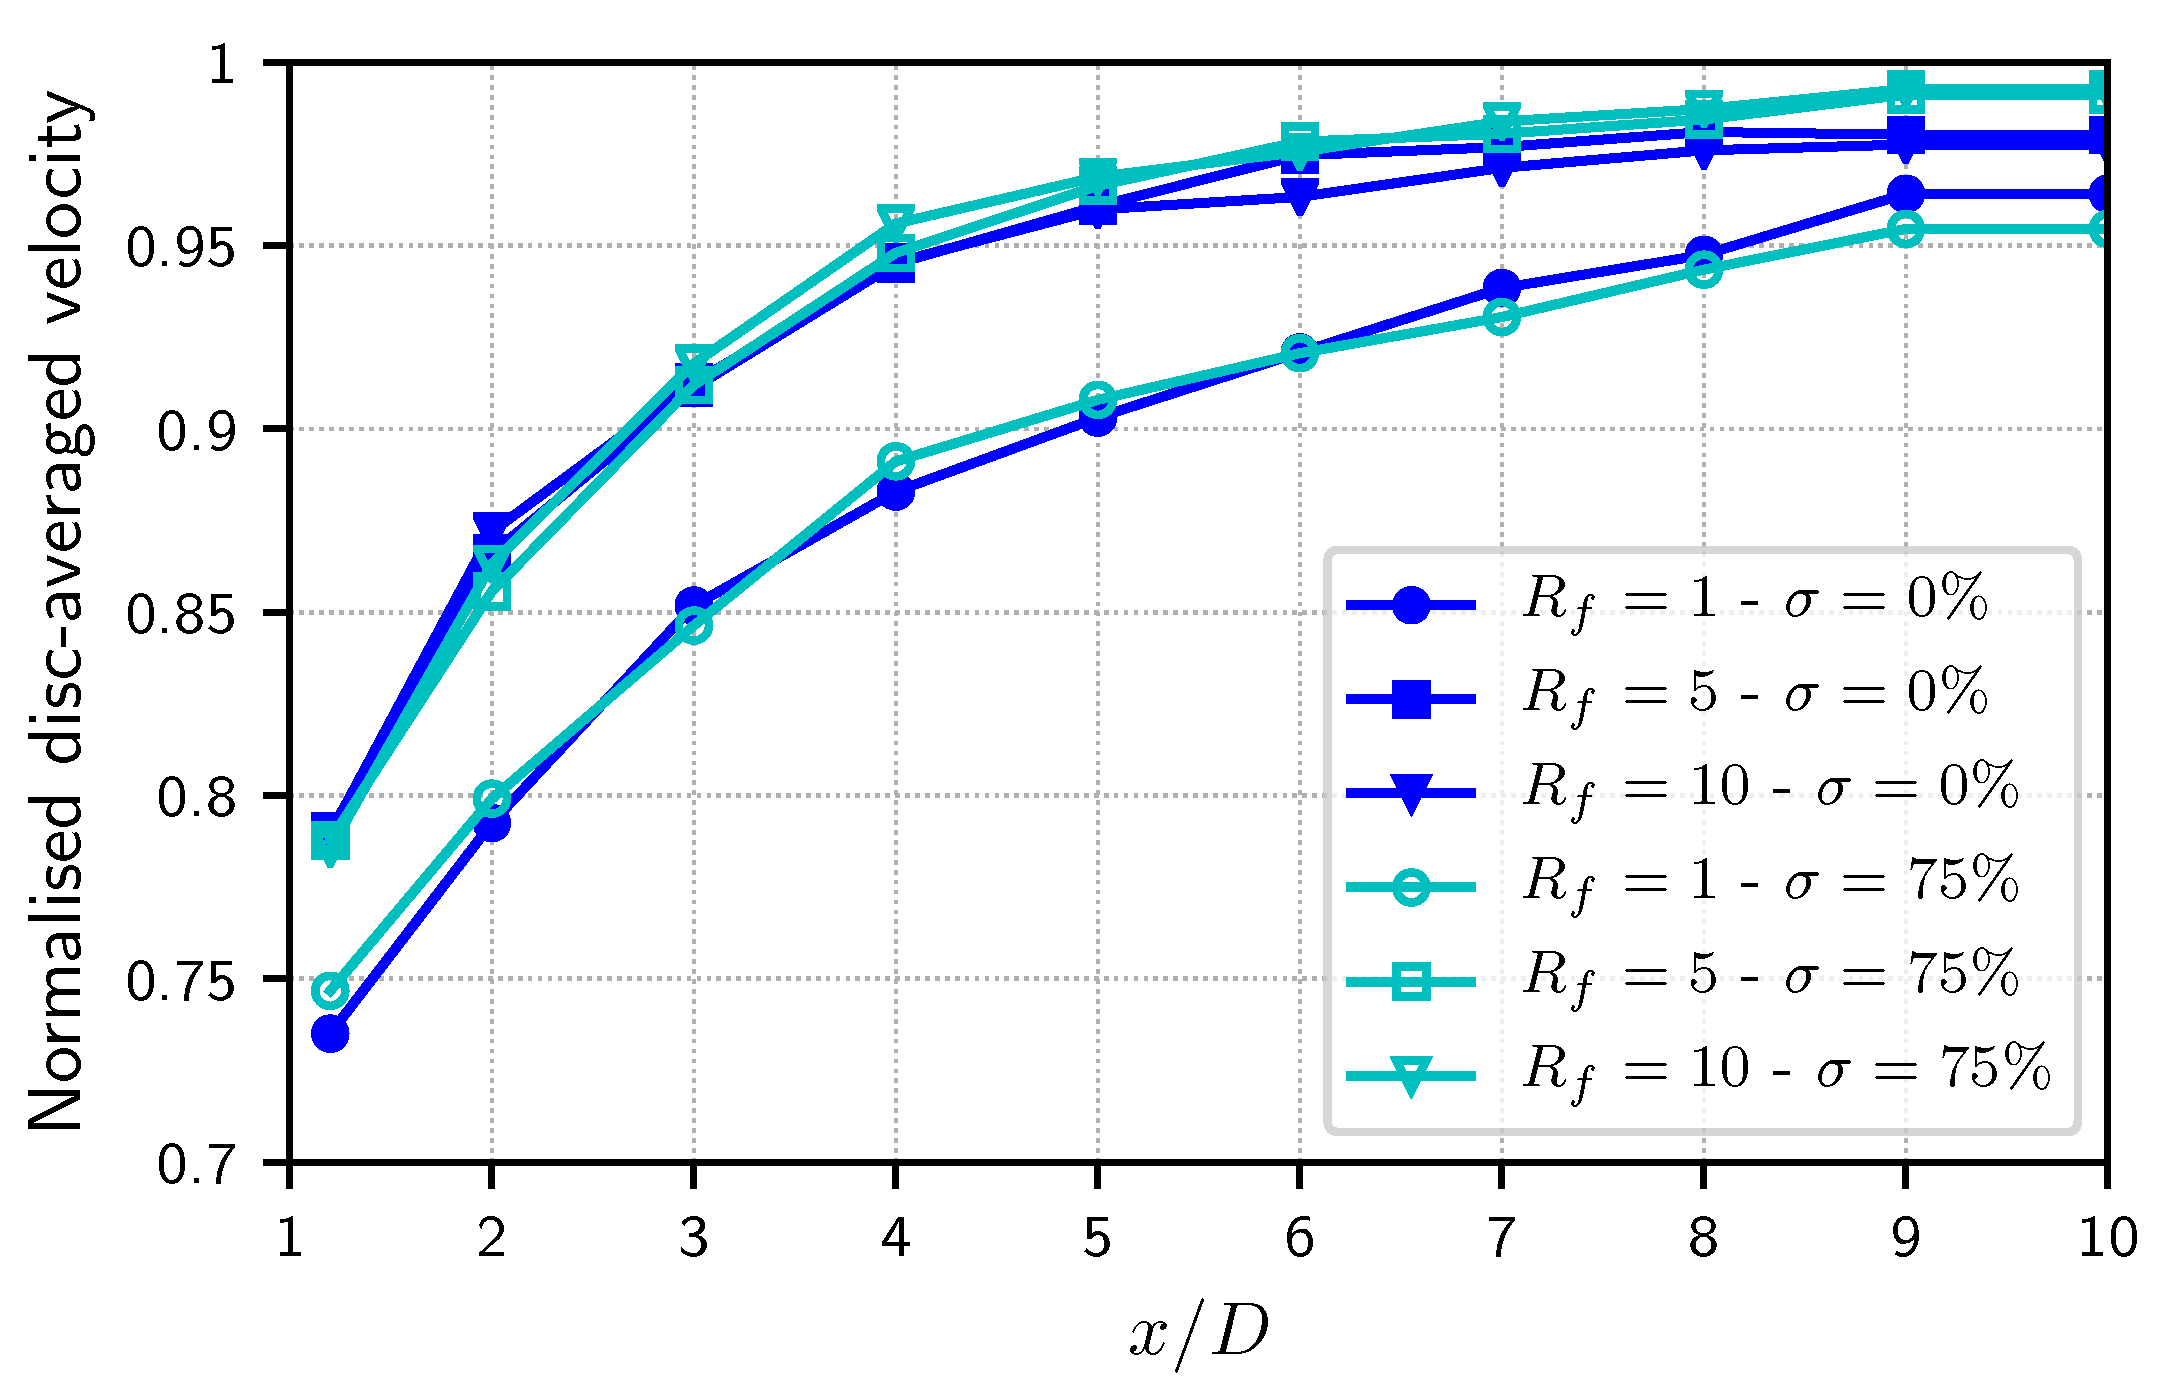
The influence of the turbulent structure size variation, represented by the value of σ ( λ ) , does not change the tendency as one can observe from the data presented in Figure 8 for I = 15%. Choma Bex et al. [32,56] reported that a higher value of σ ( λ ) would improve the spectral representation of the turbulent kinetic energy cascade, a 5 / 3 slope being nearly obtained from σ ( λ ) = 75 % and above. However, as shown in Figure 8, σ ( λ ) = 75 % still really overestimates the dissipation of the experimental disc-averaged velocity deficit for the higher values of R f . As a conclusion on that aspect, the value of σ ( λ ) does not have an influence on the velocity deficit and the driving parameter is the filling ratio R f , the experimental disc-averaged velocity deficit being accurately reproduced both for σ ( λ ) = 75 % or σ ( λ ) = 0 % with R f = 1 and always overdissipated with higher values of R f .

3.4. Influence of the Turbulent Structure Size λ

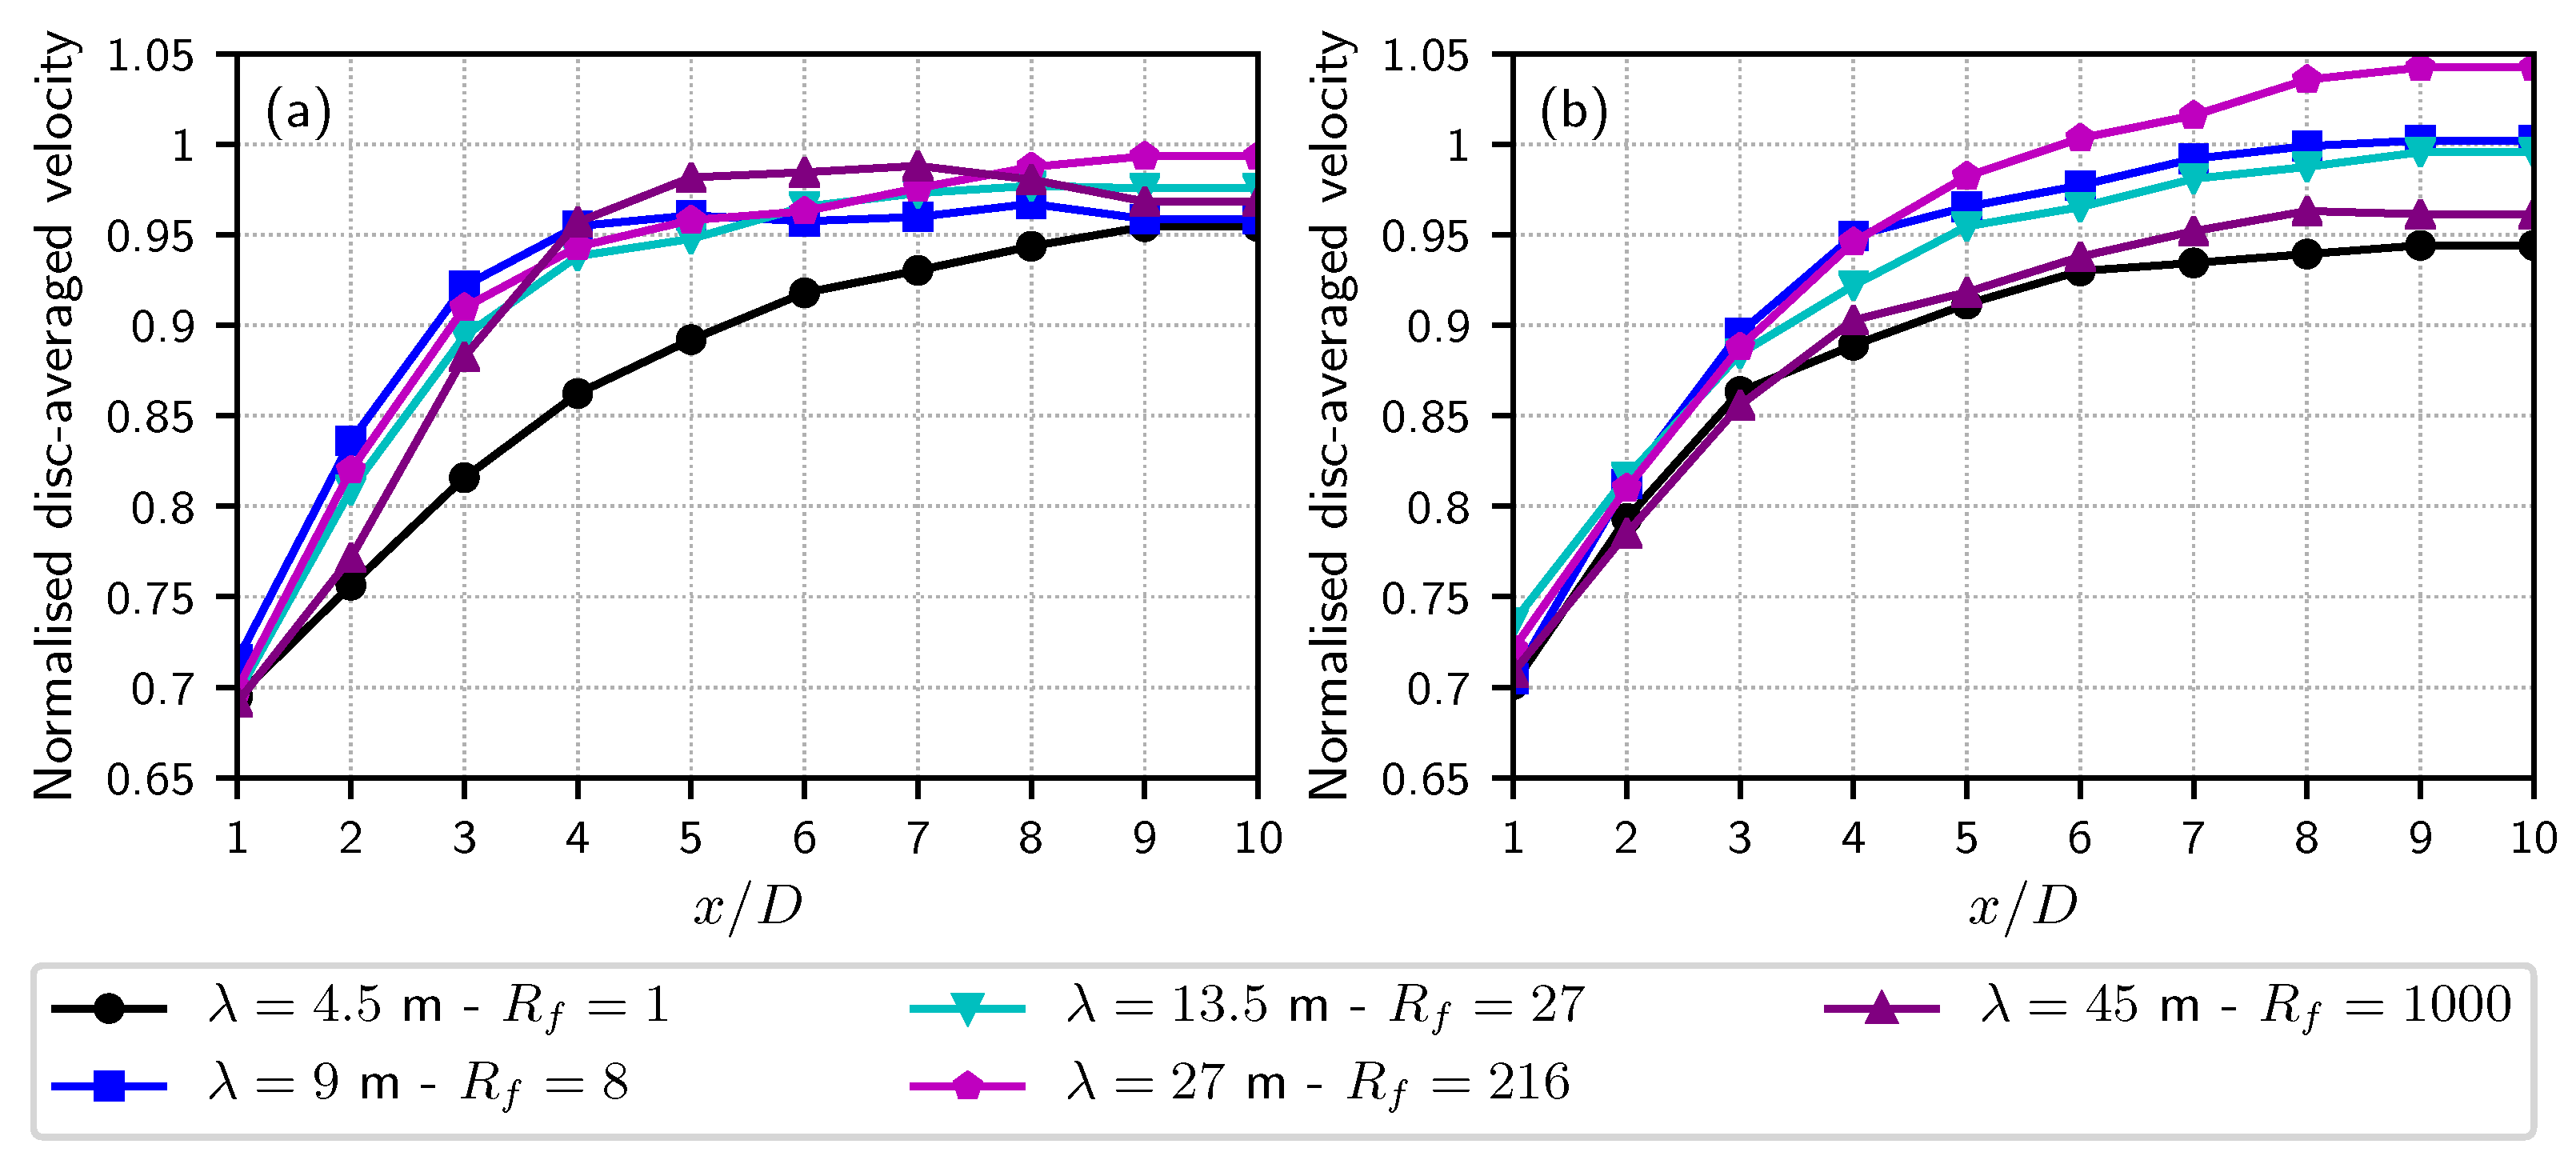
Lastly, the influence of the turbulent structure size λ and hence the integral length scale L, is presented in Figure 9. To better represent the physical turbulence characteristics of the Alderney Race as reported in the literature [15,16,18,21] for instance, higher values of λ were evaluated to physically represent the L values of a couple of decametres as experimentally measured in the race. With λ = 4.5 m, R f = 1 corresponds to N = 7426 turbulent structures. In order to have a sufficient statistical representation of the flow with higher values of L or λ , we chose to keep the same number of structures, which increases the value of the filling ratio R f (see Equation (16)). Once again, an overdissipation phenomenon is obtained for both σ ( λ ) = 0 % and σ ( λ ) = 75 % as shown in Figure 9. The case with σ ( λ ) = 75 % is even noisier but tremendous turbulent structure sizes of up to 2 λ can be regularly obtained in the flow field with σ ( λ ) = 75 % . This might not be so physical as the integral length scale is closer to the larger size encountered in the in situ flow. Therefore, a new asymmetric law for the distribution of λ is under works to better represent the physical characteristics that are: a lower number of large structures and much more smaller structures possibly reproducing the real turbulent cascade structure distribution in homogeneous turbulence. This will be tested soon but, for the time being, the present implementation is still worth investigating on a real 4 tidal turbine farm configuration.

4. Four Tidal Turbine Array: The NEPTHYD Layout

4.1. Description of the Selected Configuration: The NEPTHYD Project

As mentioned in the introduction, the NEPTHYD precommercial farm was meant to be made up of four of Alstom’s Oceade™ 3-bladed 18 m diameter turbines, with geometrical characteristics and blade profiles inspired by those of the former TGL turbine. This same TGL geometry also served as a basis for the open-geometry turbine of IFREMER since the first work of Maganga et al. [57]. This open-geometry model (defined in [9]) is used in this work, as indicated in the previous section. According to the report of the Autorité Environnementale [36], the optimal production current velocity for the Oceade™ turbine is higher than 3.1 m/s, which is why we chose an upstream velocity U of 3.2 m/s. The TSR was set as 4.1 , which corresponds to the optimal rotational speed of the device (see Table 1 of [36]). According to the projected configuration shown in Figure 1, the four turbines are positioned at approximately the same depth of 38 ± 1 m . In order to simplify this configuration, and as the bathymetry cannot be taken into account in the present approach, all turbines were set to the same vertical position.
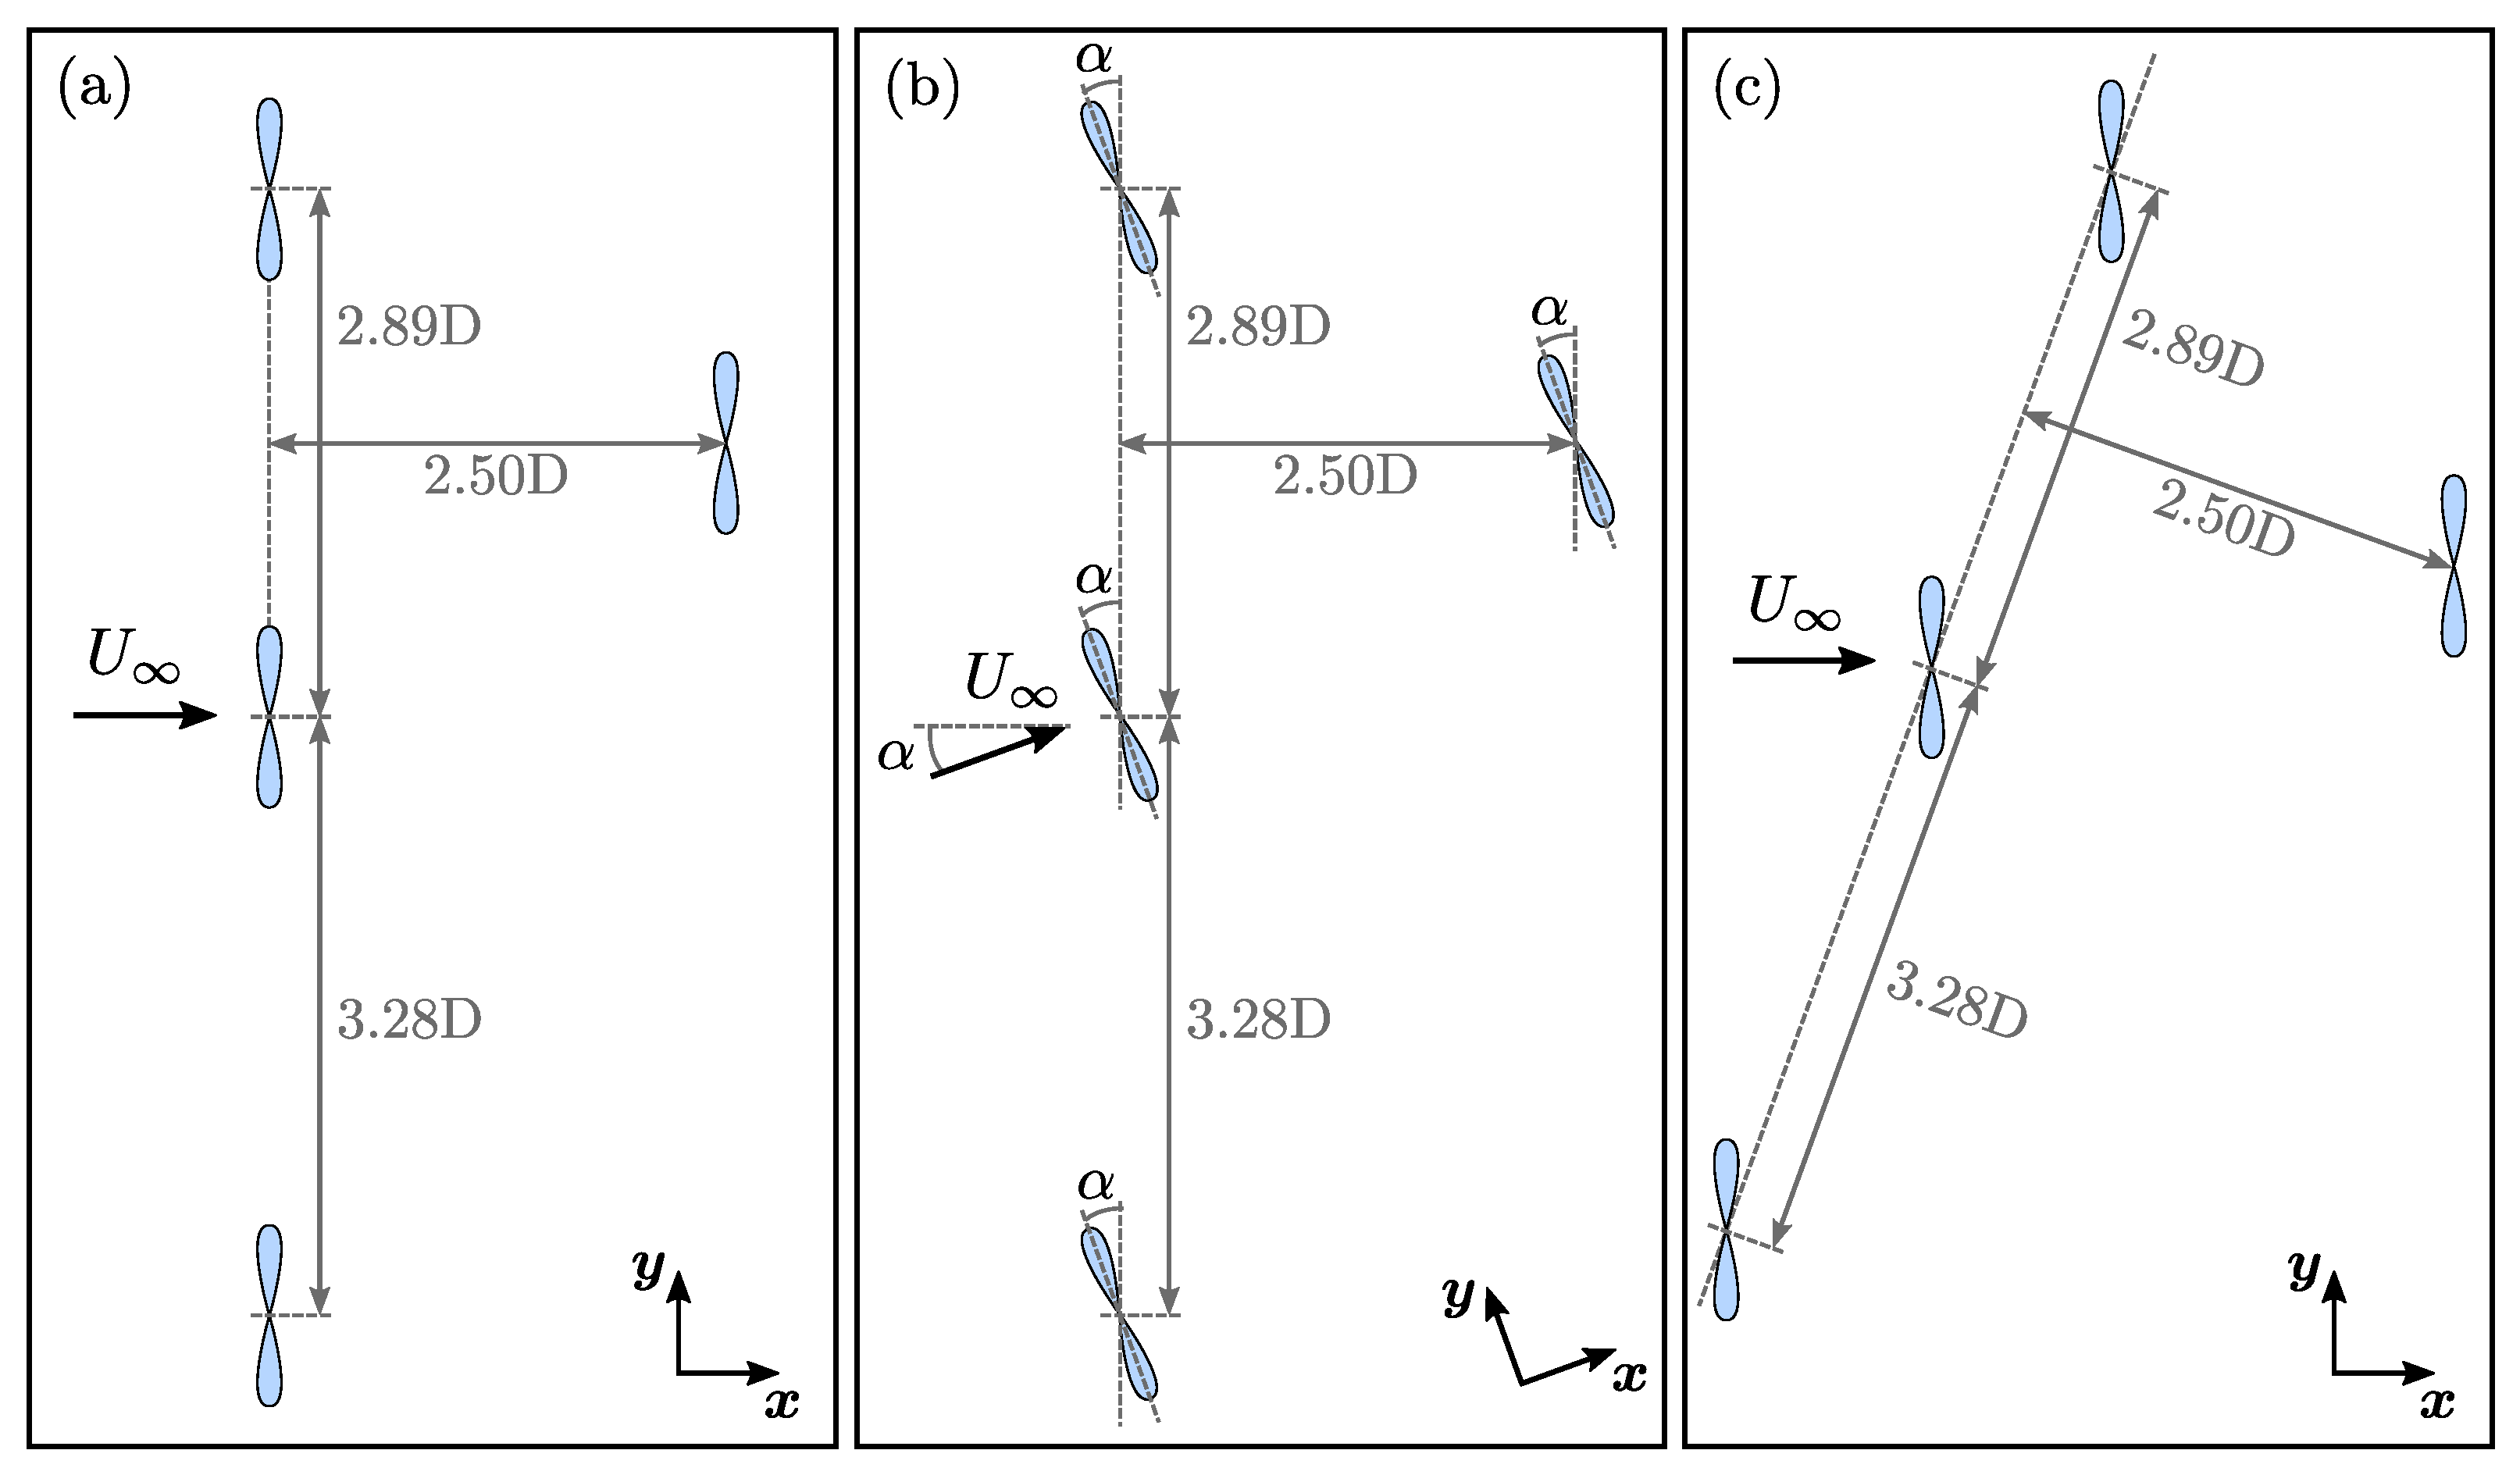
The schematic representations of Figure 10 show the turbine layout and spacing within the computed domain. As shown in Figure 1, the first front row of three turbines is perpendicular to a direction inclined at an angle of 20 from the north. This specific direction corresponds approximately to the main flood and ebb direction at this position of the Alderney Race. Therefore, the incoming velocity vector is mostly perpendicular to the three upstream turbines as presented in Figure 10a. Keeping in mind that tidal flows are not always bidirectional, Harding and Bryden [58] studied directionality issues a few years ago and they reported many sites in the UK waters with peak spring velocities higher than 2 m/s and the flow direction rotated up to 20 (or even more sometimes) from the principal axis. Frost et al. [59] also studied this aspect in detail in Ramsey Sound (Wales, UK) where they reported many tidal velocity conditions at up to +/−20 in this well known energetic site. For France, Maslov et al. [60] for instance reported approximately 15 and 35 in two sites of Brittany and Guillou et al. [61] performed a very interesting study where a couple of sites in the Alderney Race were assessed numerically with experimental validation. From this last study, based on the presented results, similar angular asymmetry could be estimated for sites referred to as # 2 and # 3 in the paper. Even though they are not the most energetic ones in the race based on the velocity results, tidal angular asymmetry can vary to a great degree in the Alderney Race. So as angular asymmetry may reasonably occur, an inclination of this velocity vector is indicated in Figure 10b with an angle α . However, as the turbines are equipped with a yaw mechanism, they can rotate to align with the new flow direction. Therefore, and in the present configuration of Figure 10b, interaction will be highly enhanced between the middle upstream turbine and the downstream one. The higher the angle of the tidal asymmetry, the more intense the interaction will be. Such configurations will be tested with several tidal angular asymmetry angles, namely 5 , 10 , 15 and 20 . These results will be presented in Section 4.3. To facilitate the flow representation for the simulations in Section 4.3, the configuration of Figure 10b will be rotated by the angle α so that the incoming velocity vector always aligns with the x-axis, as depicted in Figure 10c. The turbine layout is not modified; the turbines are only yawed to align with the incoming velocity direction. However, before studying enhanced wake–turbine interaction, the influence of the ambient turbulence characteristics will be evaluated in Section 4.2.

4.2. Initial Configuration

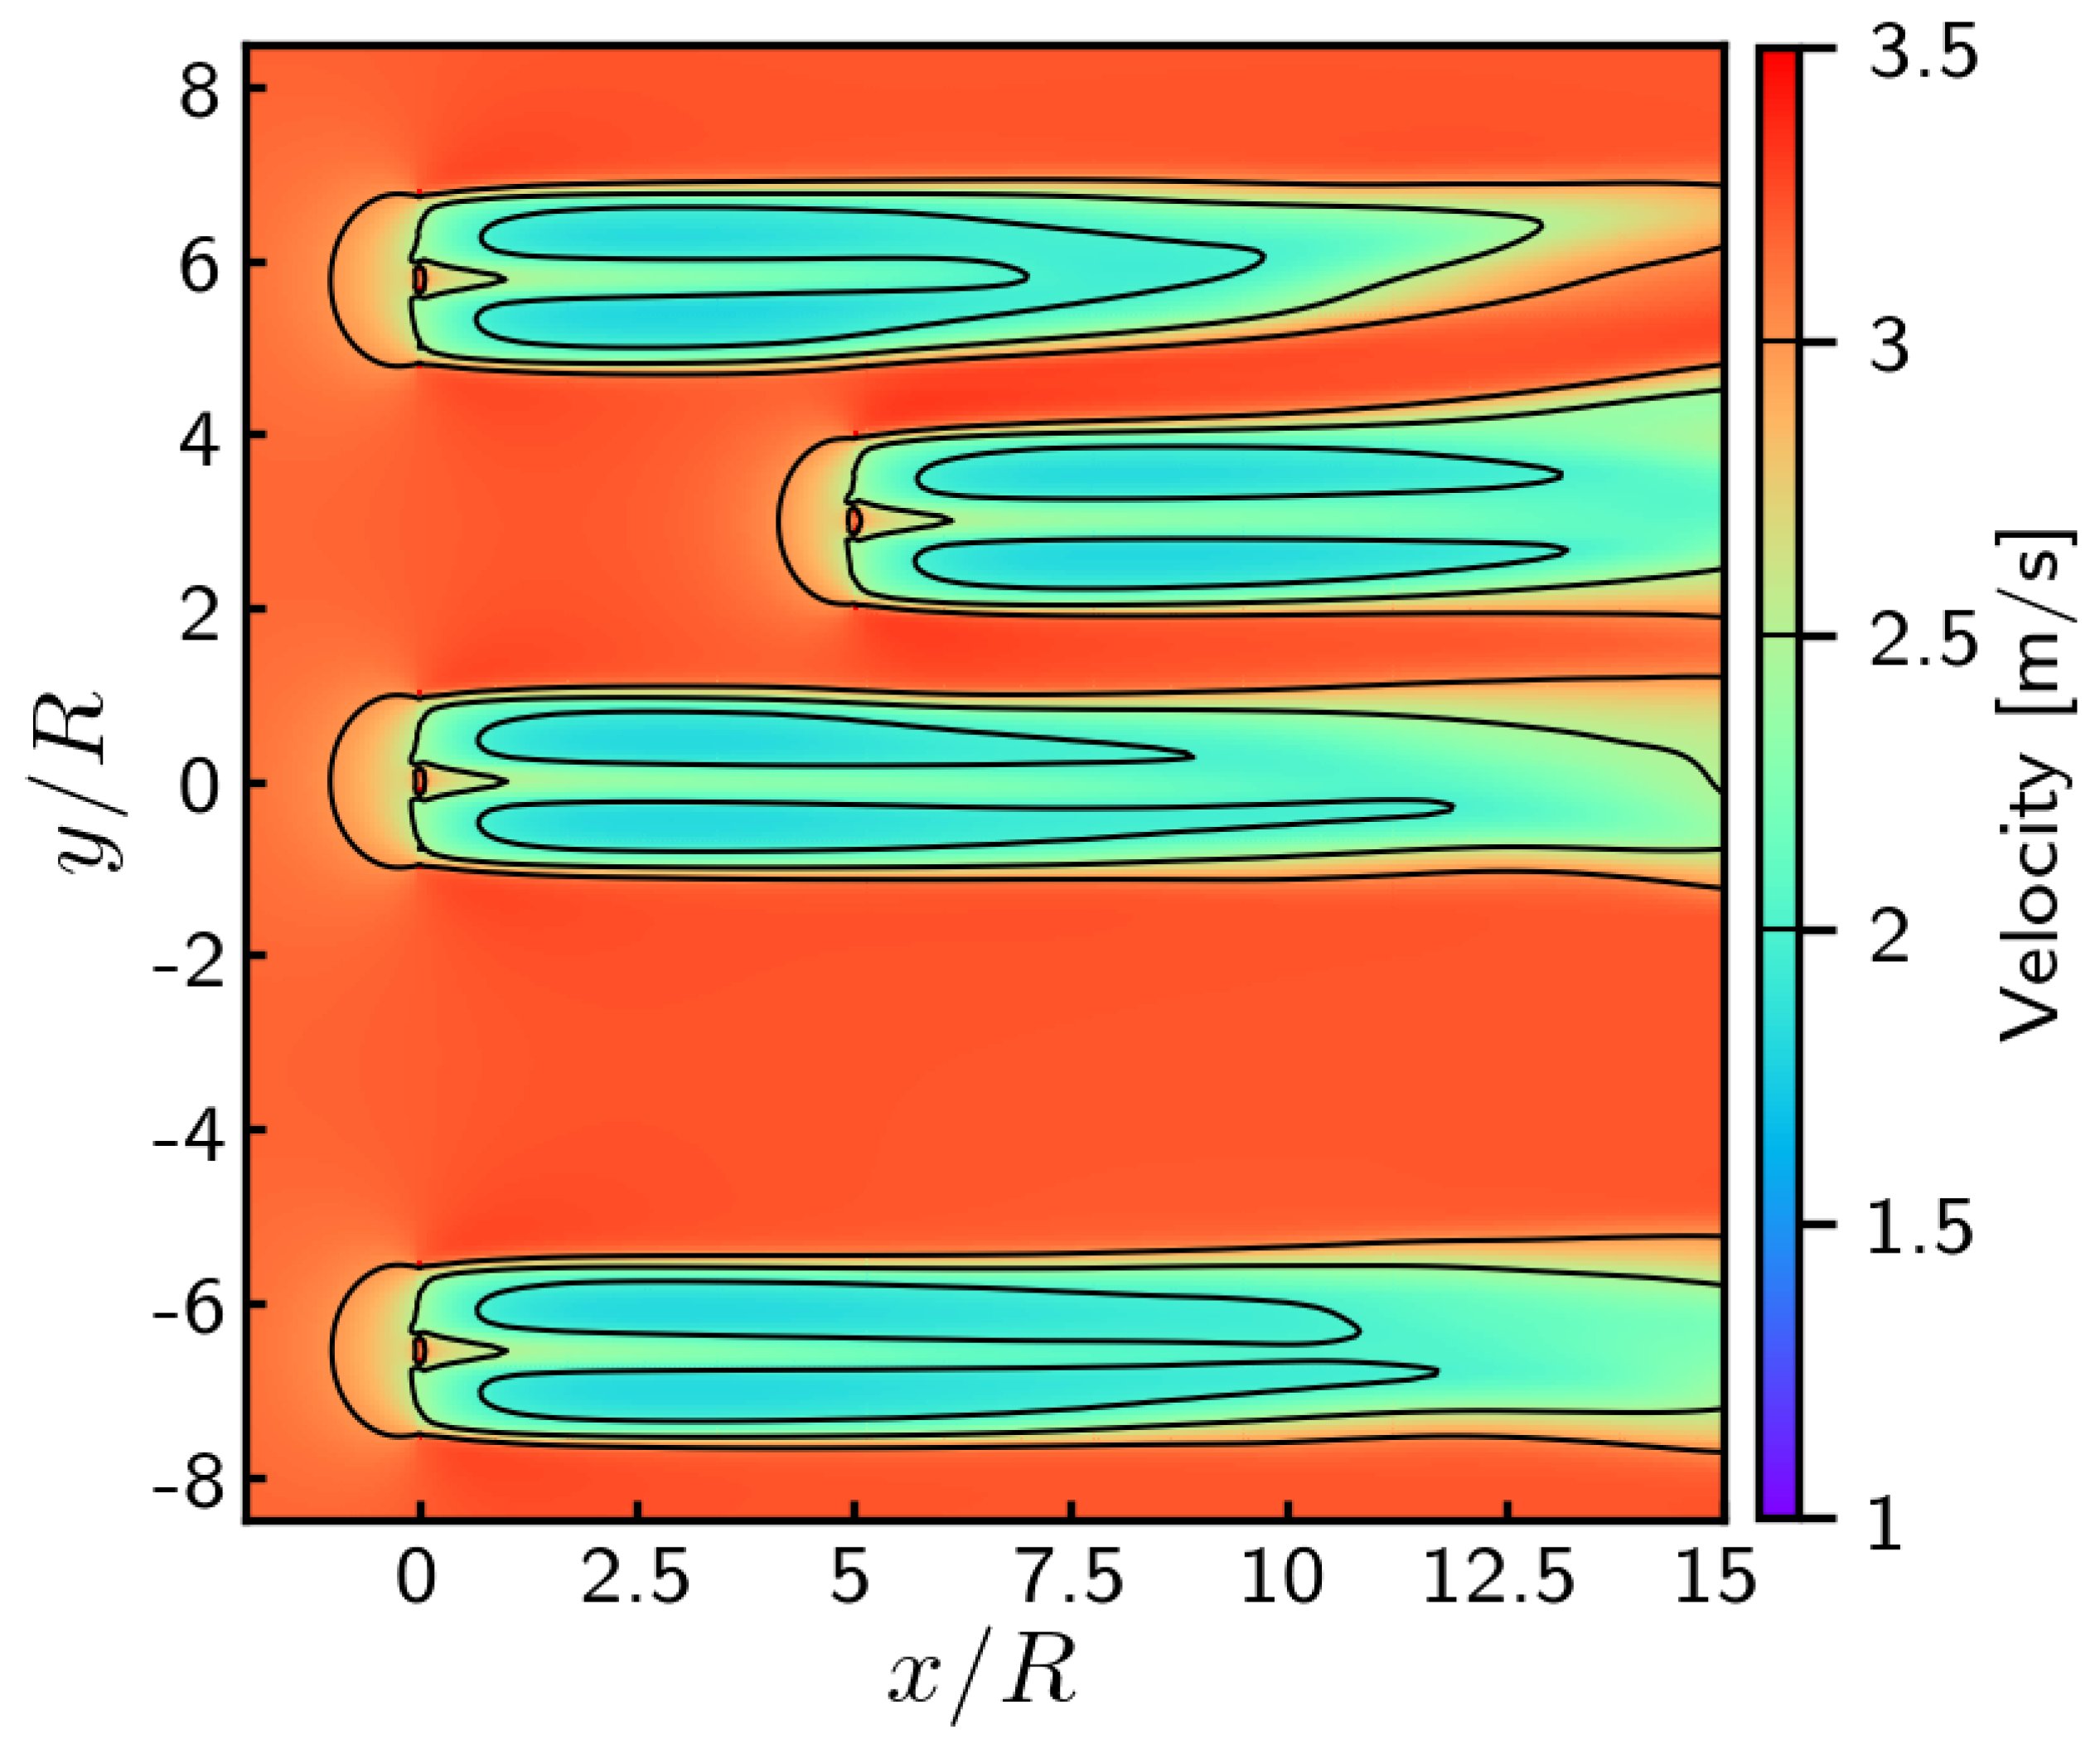
For the sake of comparison, Figure 11 shows the flow around the four turbines in the configuration of Figure 10a without ambient turbulence. For this computation, wake induced turbulence and dissipation were accounted for using only the LES model based on the PSE method implemented in the code [9]. The SEM contribution was switched off imposing an absolute constant incoming velocity U = 3.2 m/s. From Figure 11, it can be seen that there is hardly any interaction between the turbines except for a slight wake deflection of the two upstream upper turbines. Besides, the wake extension is very long and exceeds the 12.5 D length presented in this figure. This proves the conservative property of the code even on long distances.
The account for ambient turbulence will drastically modify the flow pattern. From the ample literature existing on the turbulence characterisation of the Alderney Race, only the ambient turbulence values reproduced from the paper of Sentchev et al. [16] will be tested and presented here. Depending on the ebb or flood conditions and for a distance from bottom of 16 m (which is close to the hub height), two ambient turbulence intensities are encountered: I = 10 % and I = 14 % . The corresponding integral length scales L are 26.6 m and 30.0 m respectively. As these values are close, we considered the highest one for the computation but chose to also test out a smaller length scale of L = 18 m. The selected values, L = 18 m and L = 30 m, correspond to λ = 27.5 m and λ = 45.9 m respectively (according to the linear relationship between turbulent structure size and integral length scale, see Section 2.3).
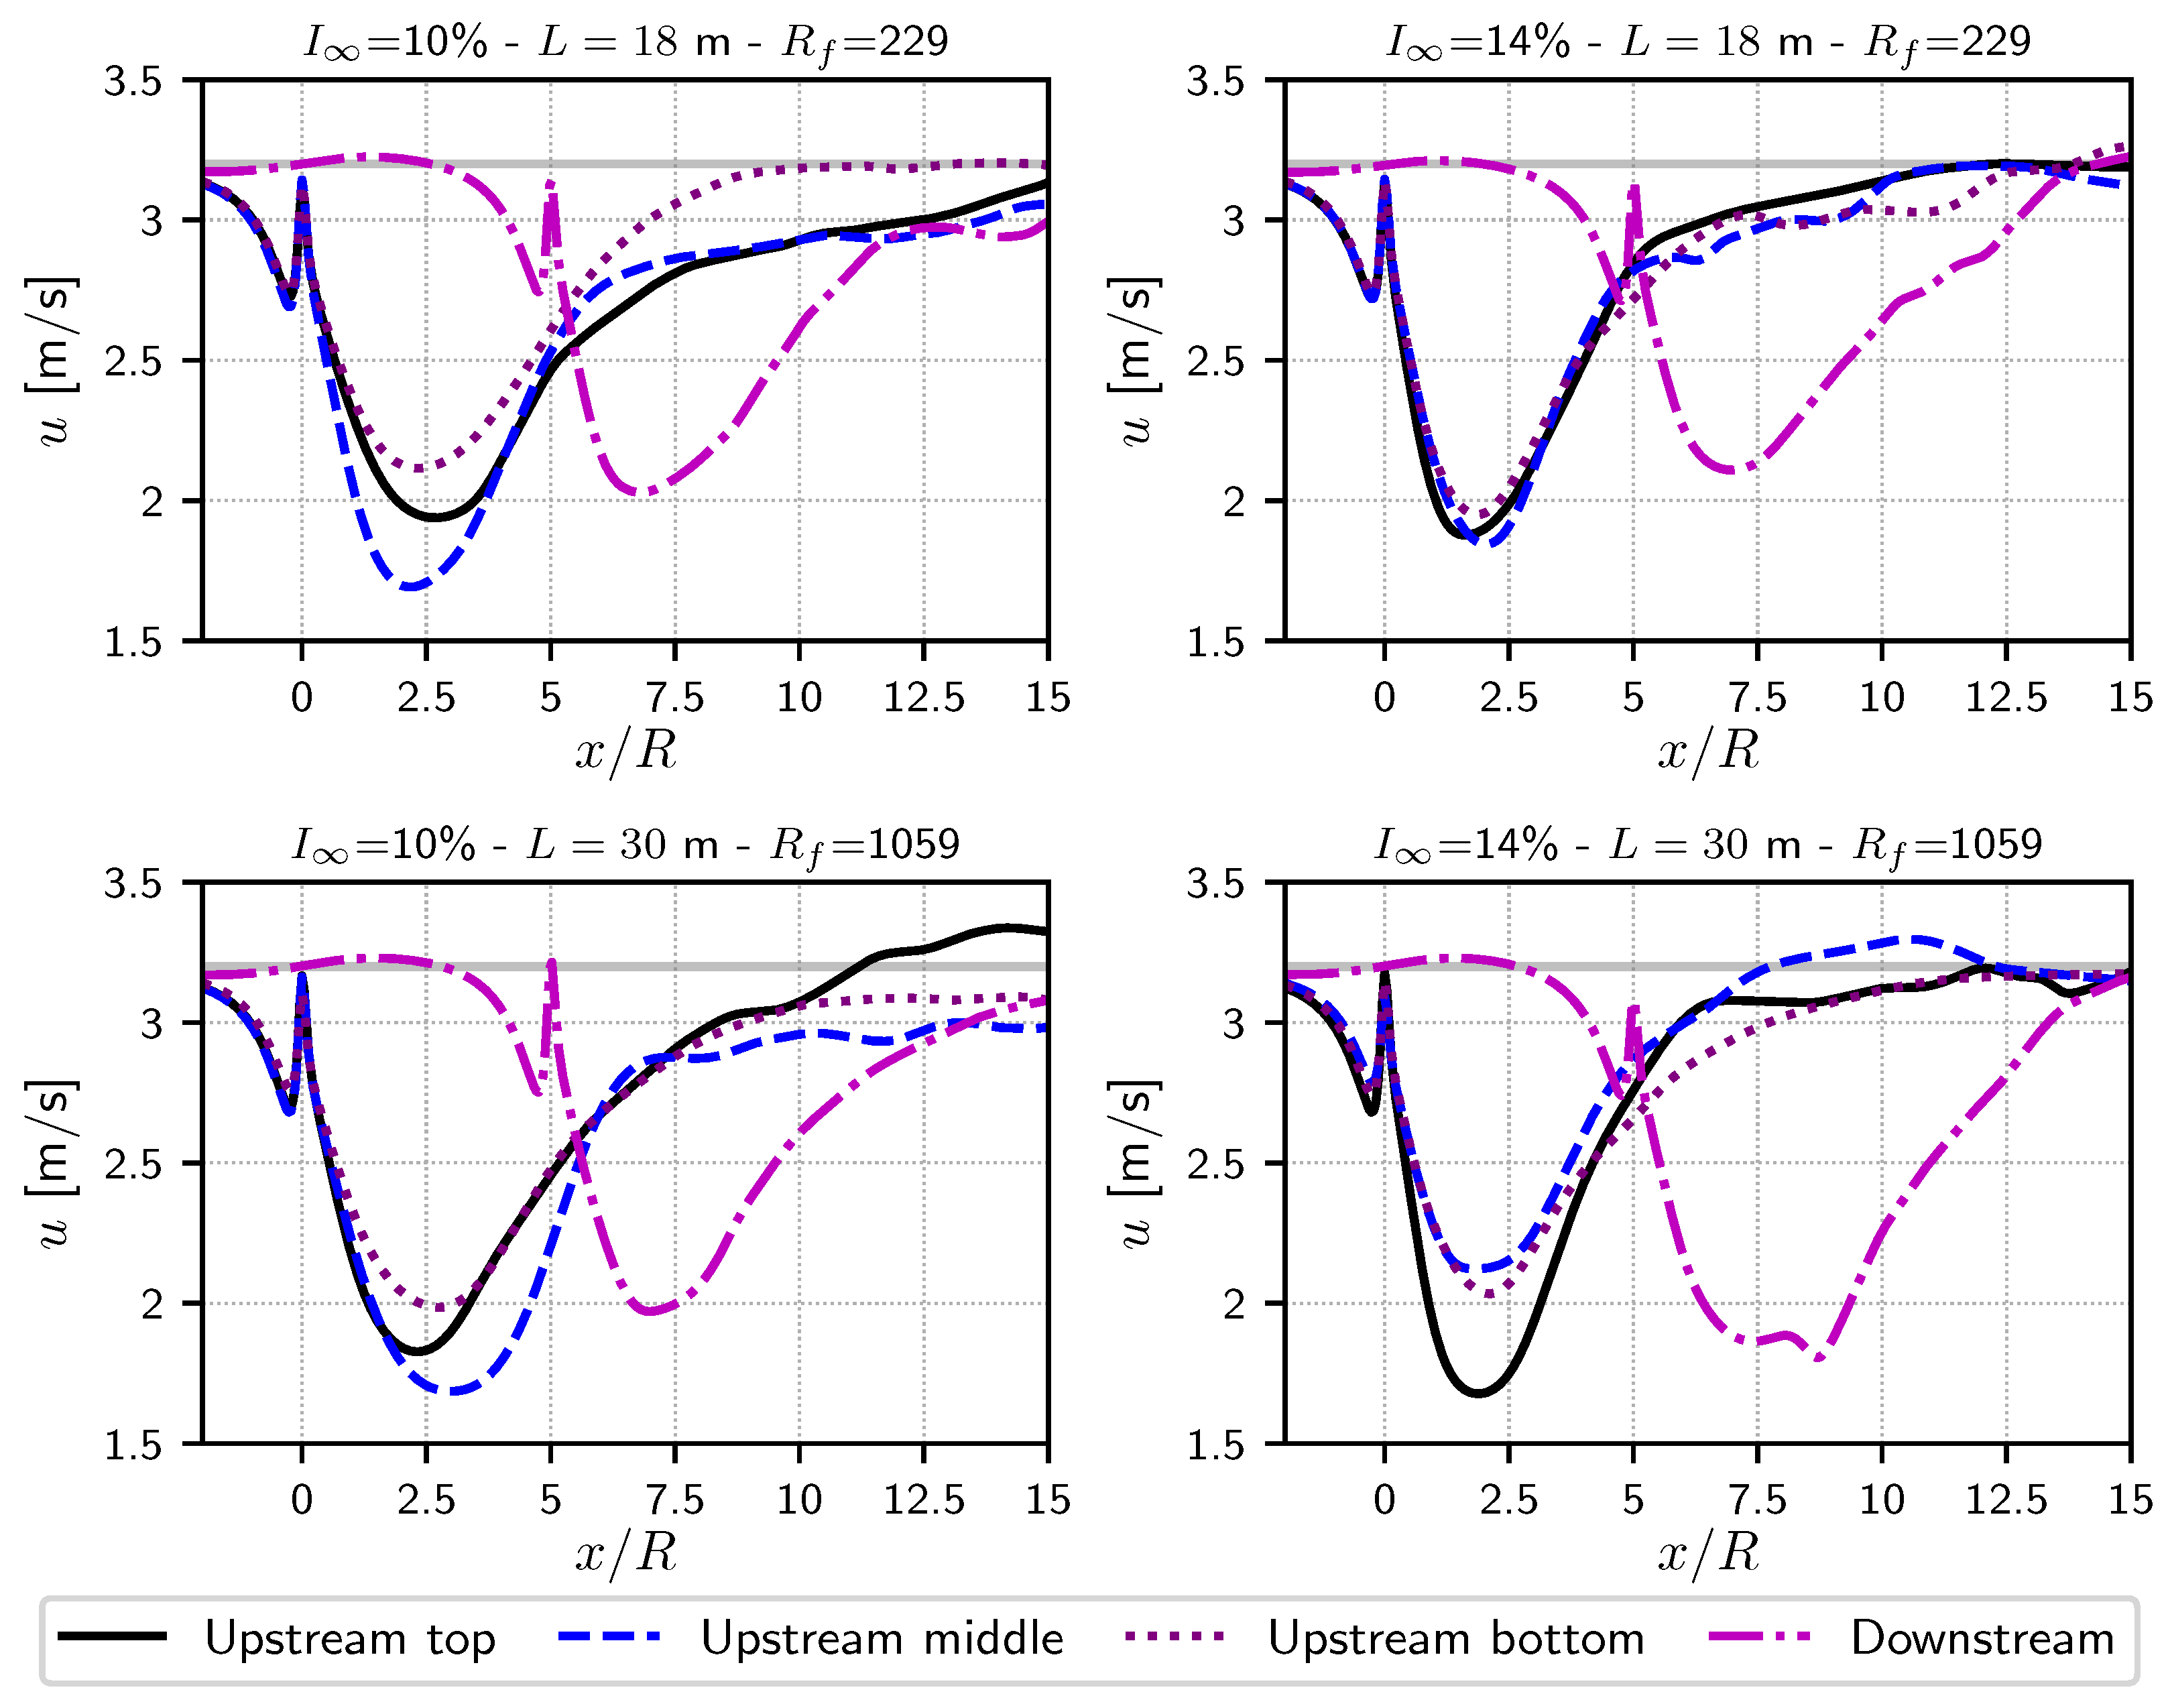
For the four configurations presented in Figure 12, a single value of σ ( λ ) = 75 % is considered for the variation of the turbulent structure size. Therefore, the only values that differ are the ambient turbulence intensity I = 10 % or 14 % and the associated integral length scale L = 18 m or 30 m. Due to the size of the structures, a filling ratio R f of one would have led to an incredibly low number of structures (e.g., N 10 for L = 30 m) which would have compromised the statistical representation of the flow. Thus, a higher value than R f = 1 had to be chosen and the decision was made to fix the number of turbulent structures to N = 10472 for all the computations, in order to avoid too much difference between these configurations. Owing to the size of the computational study space, this constant number of N = 10472 turbulent structures leads to the filling ratios R f = 229 for L = 18 m and R f = 1059 for L = 30 m. Following the results presented in Figure 7, Figure 8 and Figure 9 of the previous section, it is anticipated that the wake dissipation will be overestimated. In that sense, the results presented in Figure 12 would have a tendency to estimate shorter wakes and hence lower interactions than would be the case in reality. When compared to the result without ambient turbulence of Figure 11, the wakes of the four configurations in Figure 12 are in fact much shorter. However, mostly due to an increase in wake meandering with ambient turbulence, higher and more numerous interaction phenomena are encountered. In three out of the four studied configurations an interaction phenomenon is observed between an upstream turbine wake and the downstream turbine. Although a higher ambient turbulence intensity should reduce the wake length, it is not obviously observable from the left ( I = 10 % ) and right ( I = 14 % ) wake maps of Figure 12 nor from the wake lines presented in Figure 13. Even though these results were averaged over 188 instantaneous velocity fields, representing an average over 89.6 s of physical time, this should still not be long enough for such high ambient turbulence levels.
The curves presented in Figure 13 are very interesting in the way that axial induction is well represented in front of each turbine. A small acceleration in the upstream bypass can also be observed for the downstream turbine (purple dashed-dotted line). Much longer computations, possibly with a refined discretisation will be required in a near future to better identify the influence of the integral length scale on the turbine wake. As mentioned in the previous section, a new asymmetric distribution for the turbulent structure size λ would also improve the results. This would lead to a better representation of the physical phenomenon, which is to say many more smaller structures than larger ones for a given central average value of λ 0 (see also [32]). Although this hypothesis remains to be validated, it could also be assumed that a number of turbulent structures high enough to ensure a statistical convergence but still verifying a filling ratio R f close to one (rather than the over 1000 considered here) would lead to better results. If a R f of one is achievable, the overestimation of the dissipation could be avoided leaving more space for possible variations depending on the integral length scale L and/or a small variation of ambient turbulence, as it is the case between I = 10 % and I = 14 % here. However, the current numerical set-up can already give very interesting insights into interaction configurations, such as in the case of this NEPTHYD layout with an incoming velocity yawed with respect to the main flow direction.

4.3. Yawed Flows

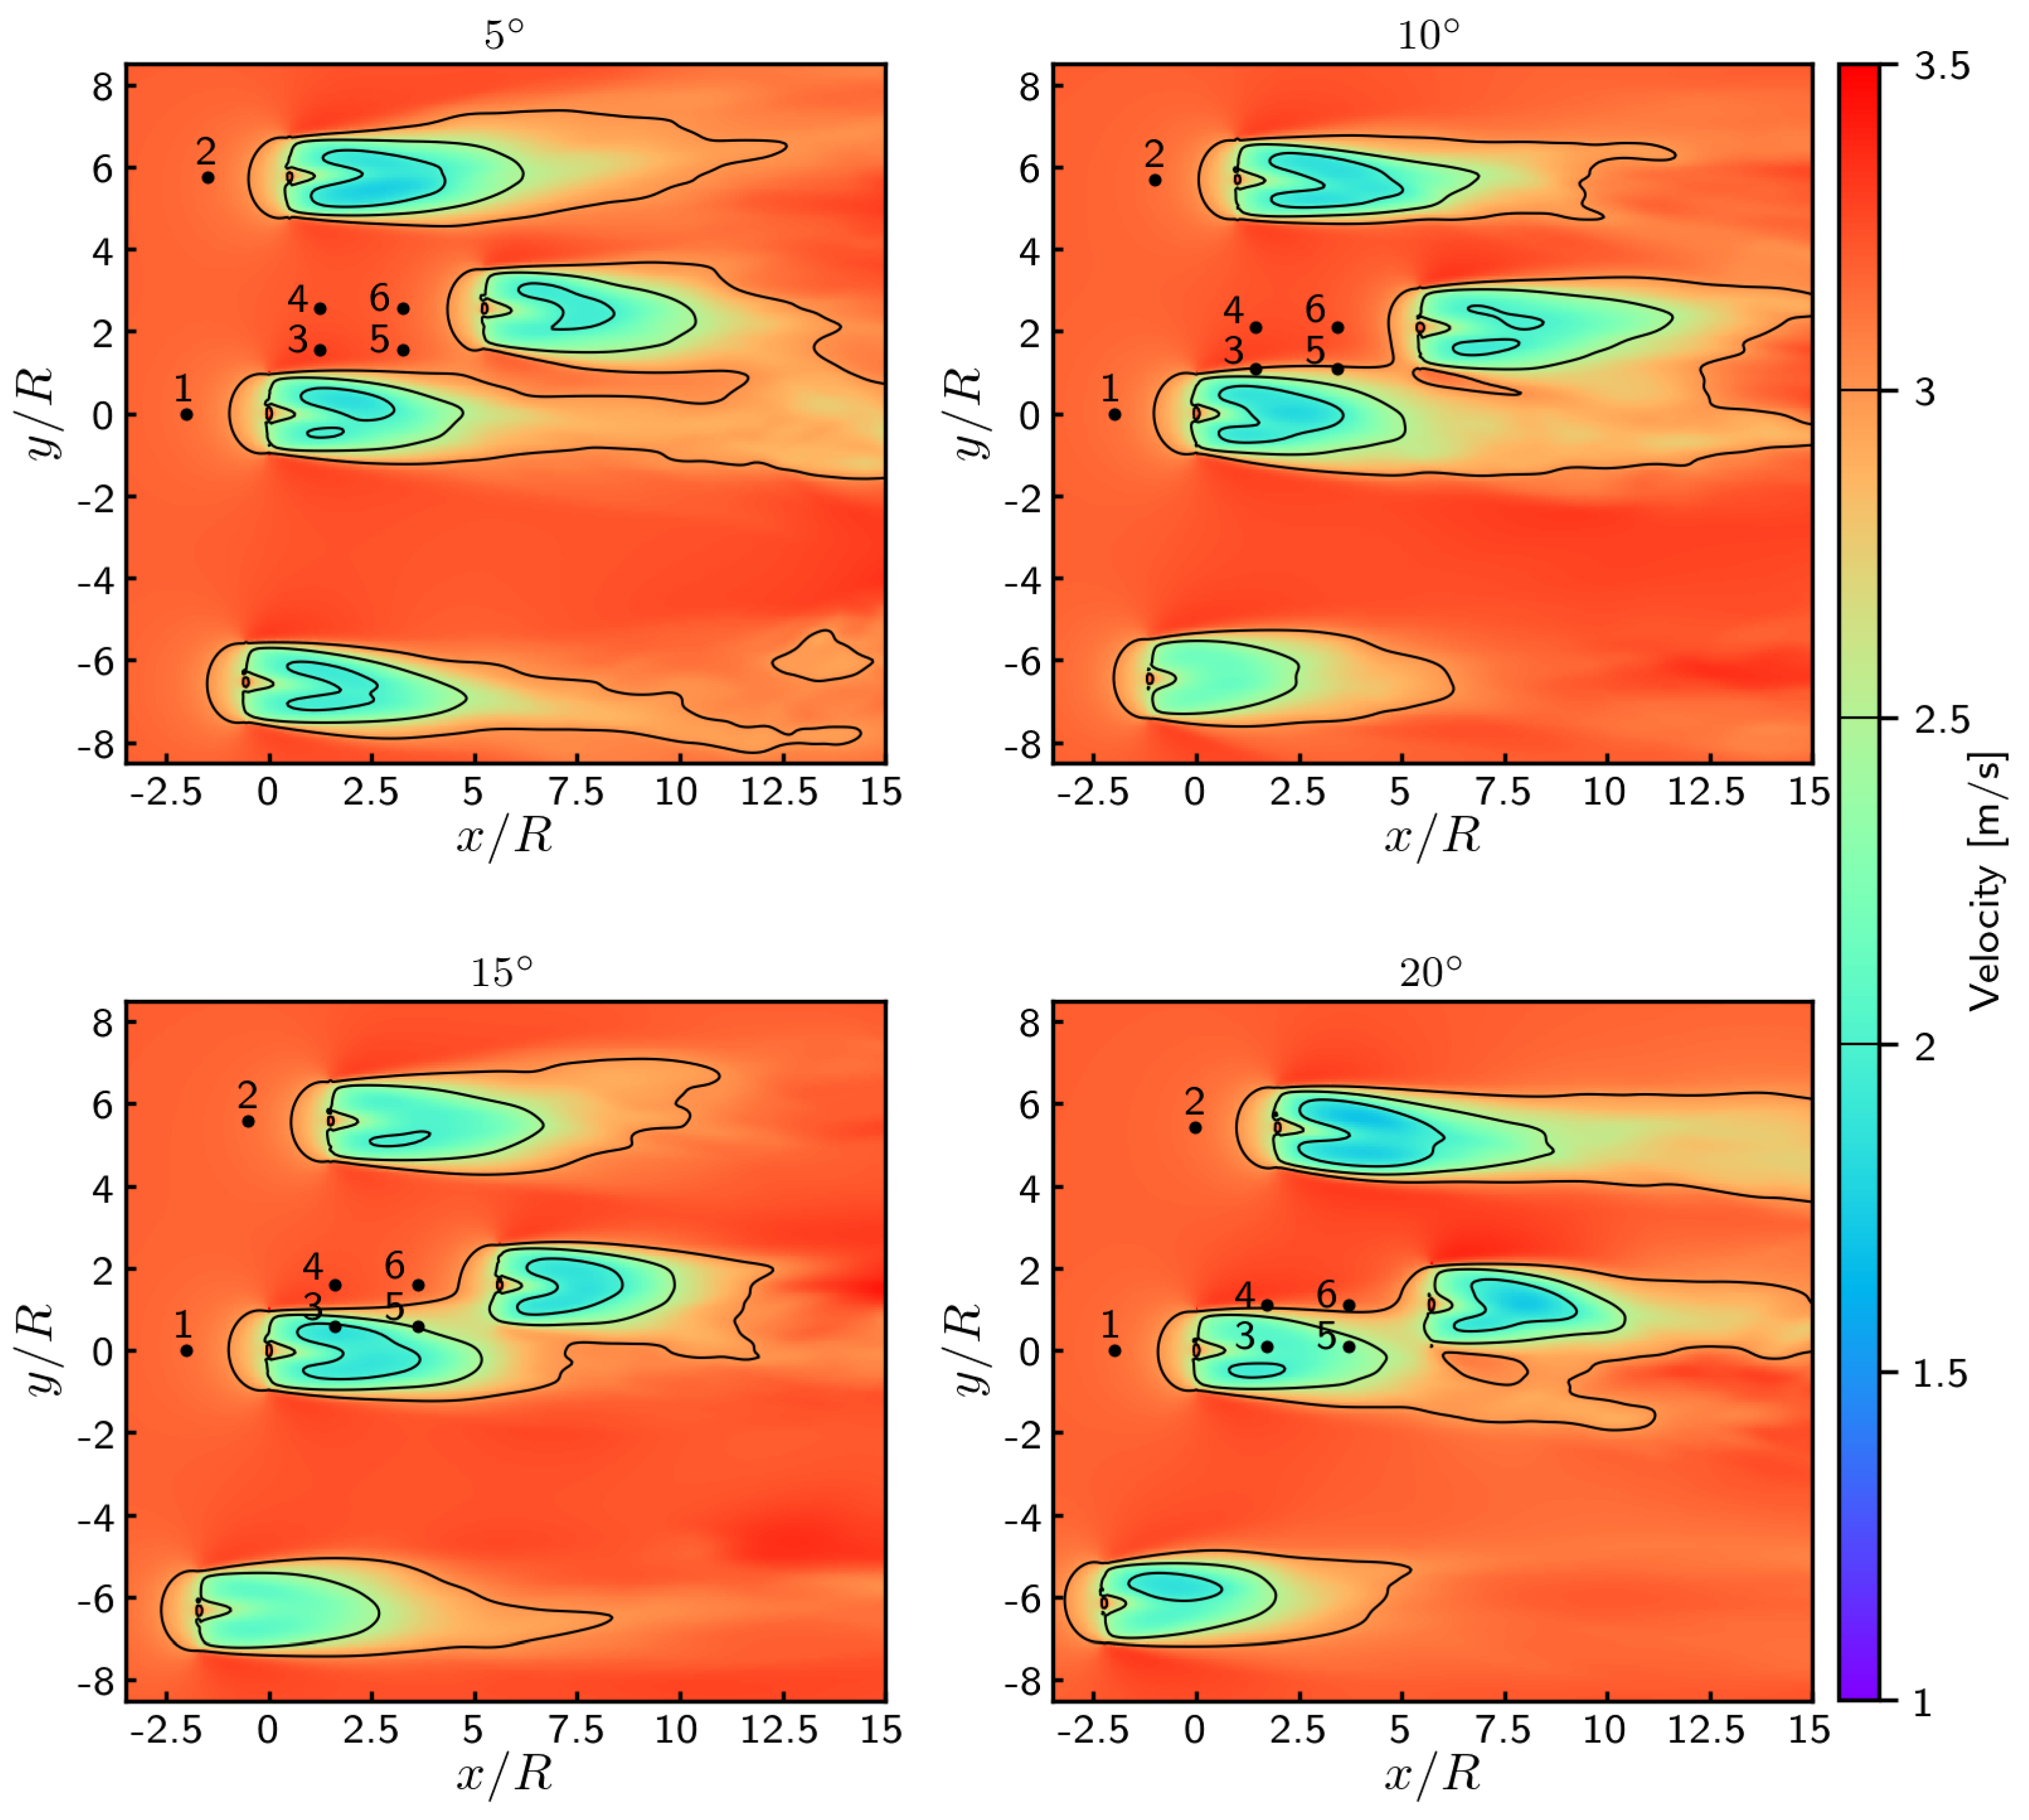
Figure 14 shows the wake configurations for an incoming flow inclined with angles ranging from 5 to 20 with respect to the main current direction. The positions of the turbines correspond to the configuration shown in Figure 10c. For these computations, the same numerical parameters were chosen as for the case with I = 10 % and L = 18 m, imposing R f 229 with σ ( λ ) = 75 % . All the turbines are rotating at TSR = 4.1 .
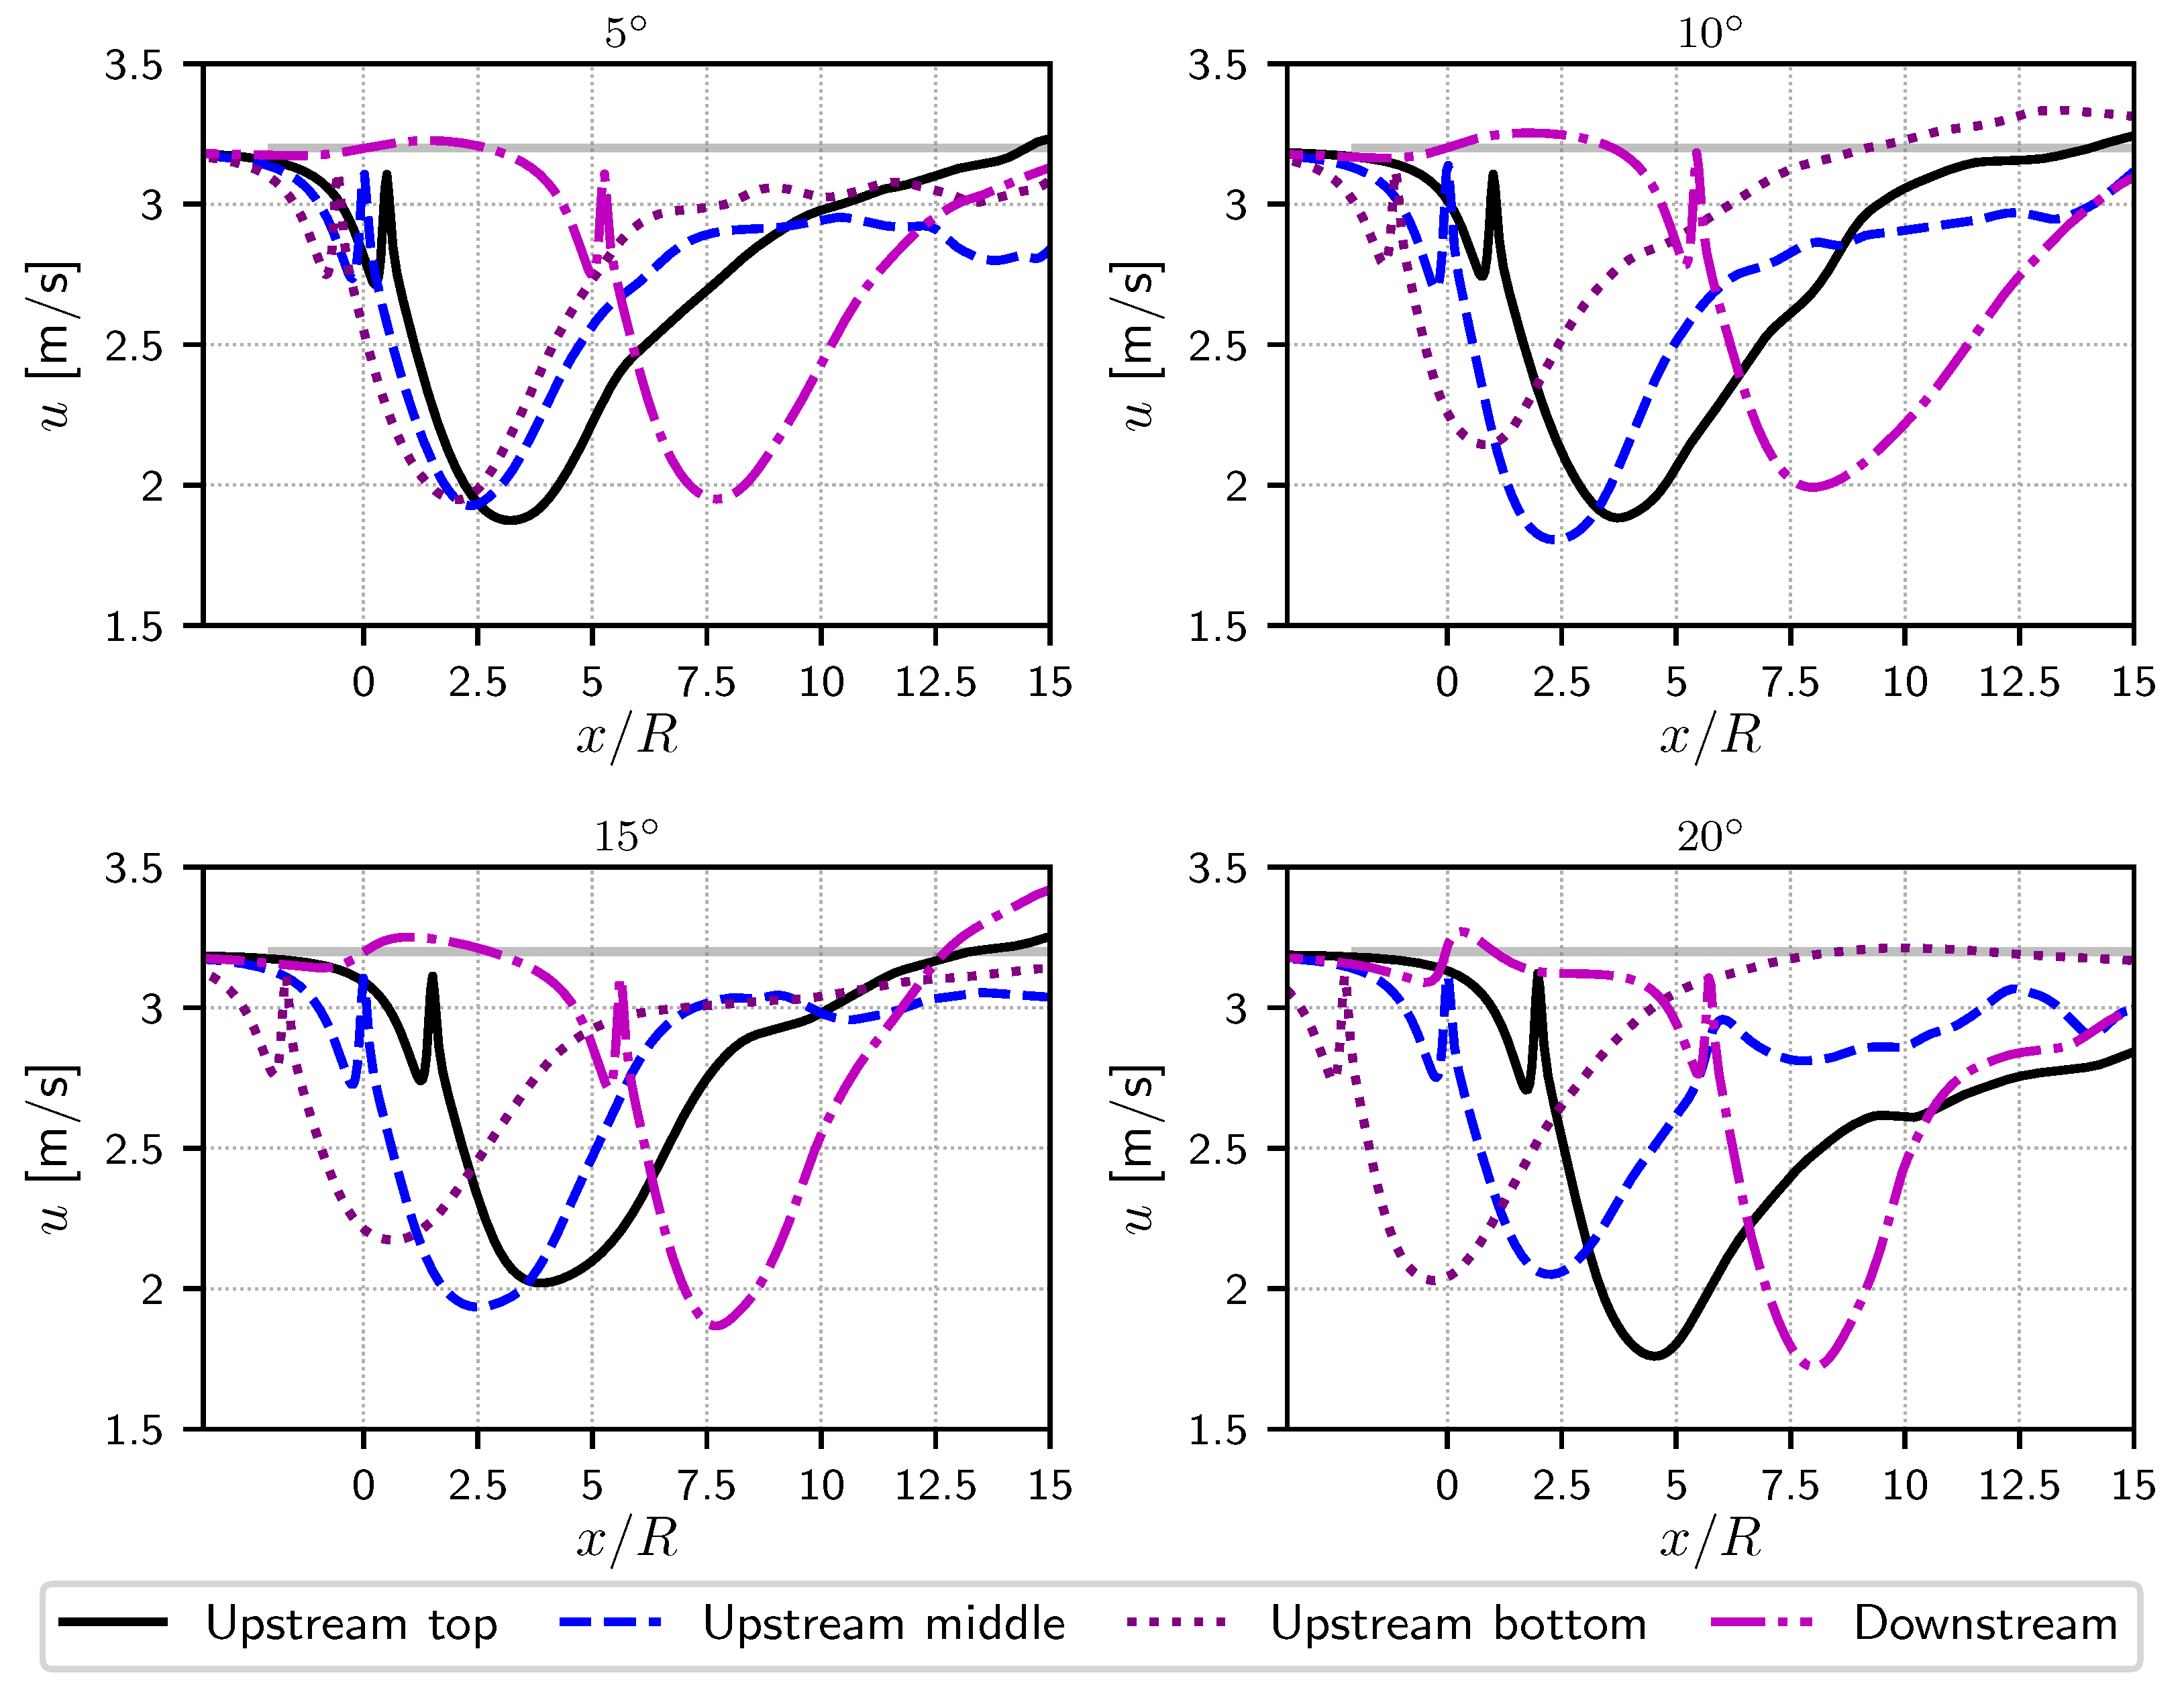
Individually, each turbine wake looks similar to those presented in the previous subsection. However, as the angle increases, more and more interaction can be observed. At an inclination angle of 10 , a weak interaction can already be observed on the image of Figure 14 but nothing is observable on the corresponding wake lines of Figure 15 (keeping in mind that the wake lines are taken from the turbine centre of rotation and aligned with the turbine direction). Although a weak interaction is visible around the tip of the blades, nothing is yet visible on the lines. However, for the last two configurations with 15 and 20 inclinations of the current, very clear interactions can be observed on the corresponding plots of Figure 14. The induction zone of the downstream turbine is clearly connected to the wake of the upstream middle turbine. The interaction is higher for the last 20 case, where approximately half of the downstream turbine will be perceiving the upstream wake and also associated additional velocity fluctuations. From the downstream wake lines (violet dashed-dotted lines of Figure 15), a small modification is already visible upstream of the turbine but a large modification of the downstream wake is evidenced, the velocity deficit becoming progressively higher for the 15 and 20 inclinations. Such modifications and impacts on the flow perceived by the downstream turbine were anticipated but the present numerical approach can now much better quantify these interactions and even deliver more quantitative information, such as mean velocity deficit, mean shear flow profile and also additional velocity fluctuations.
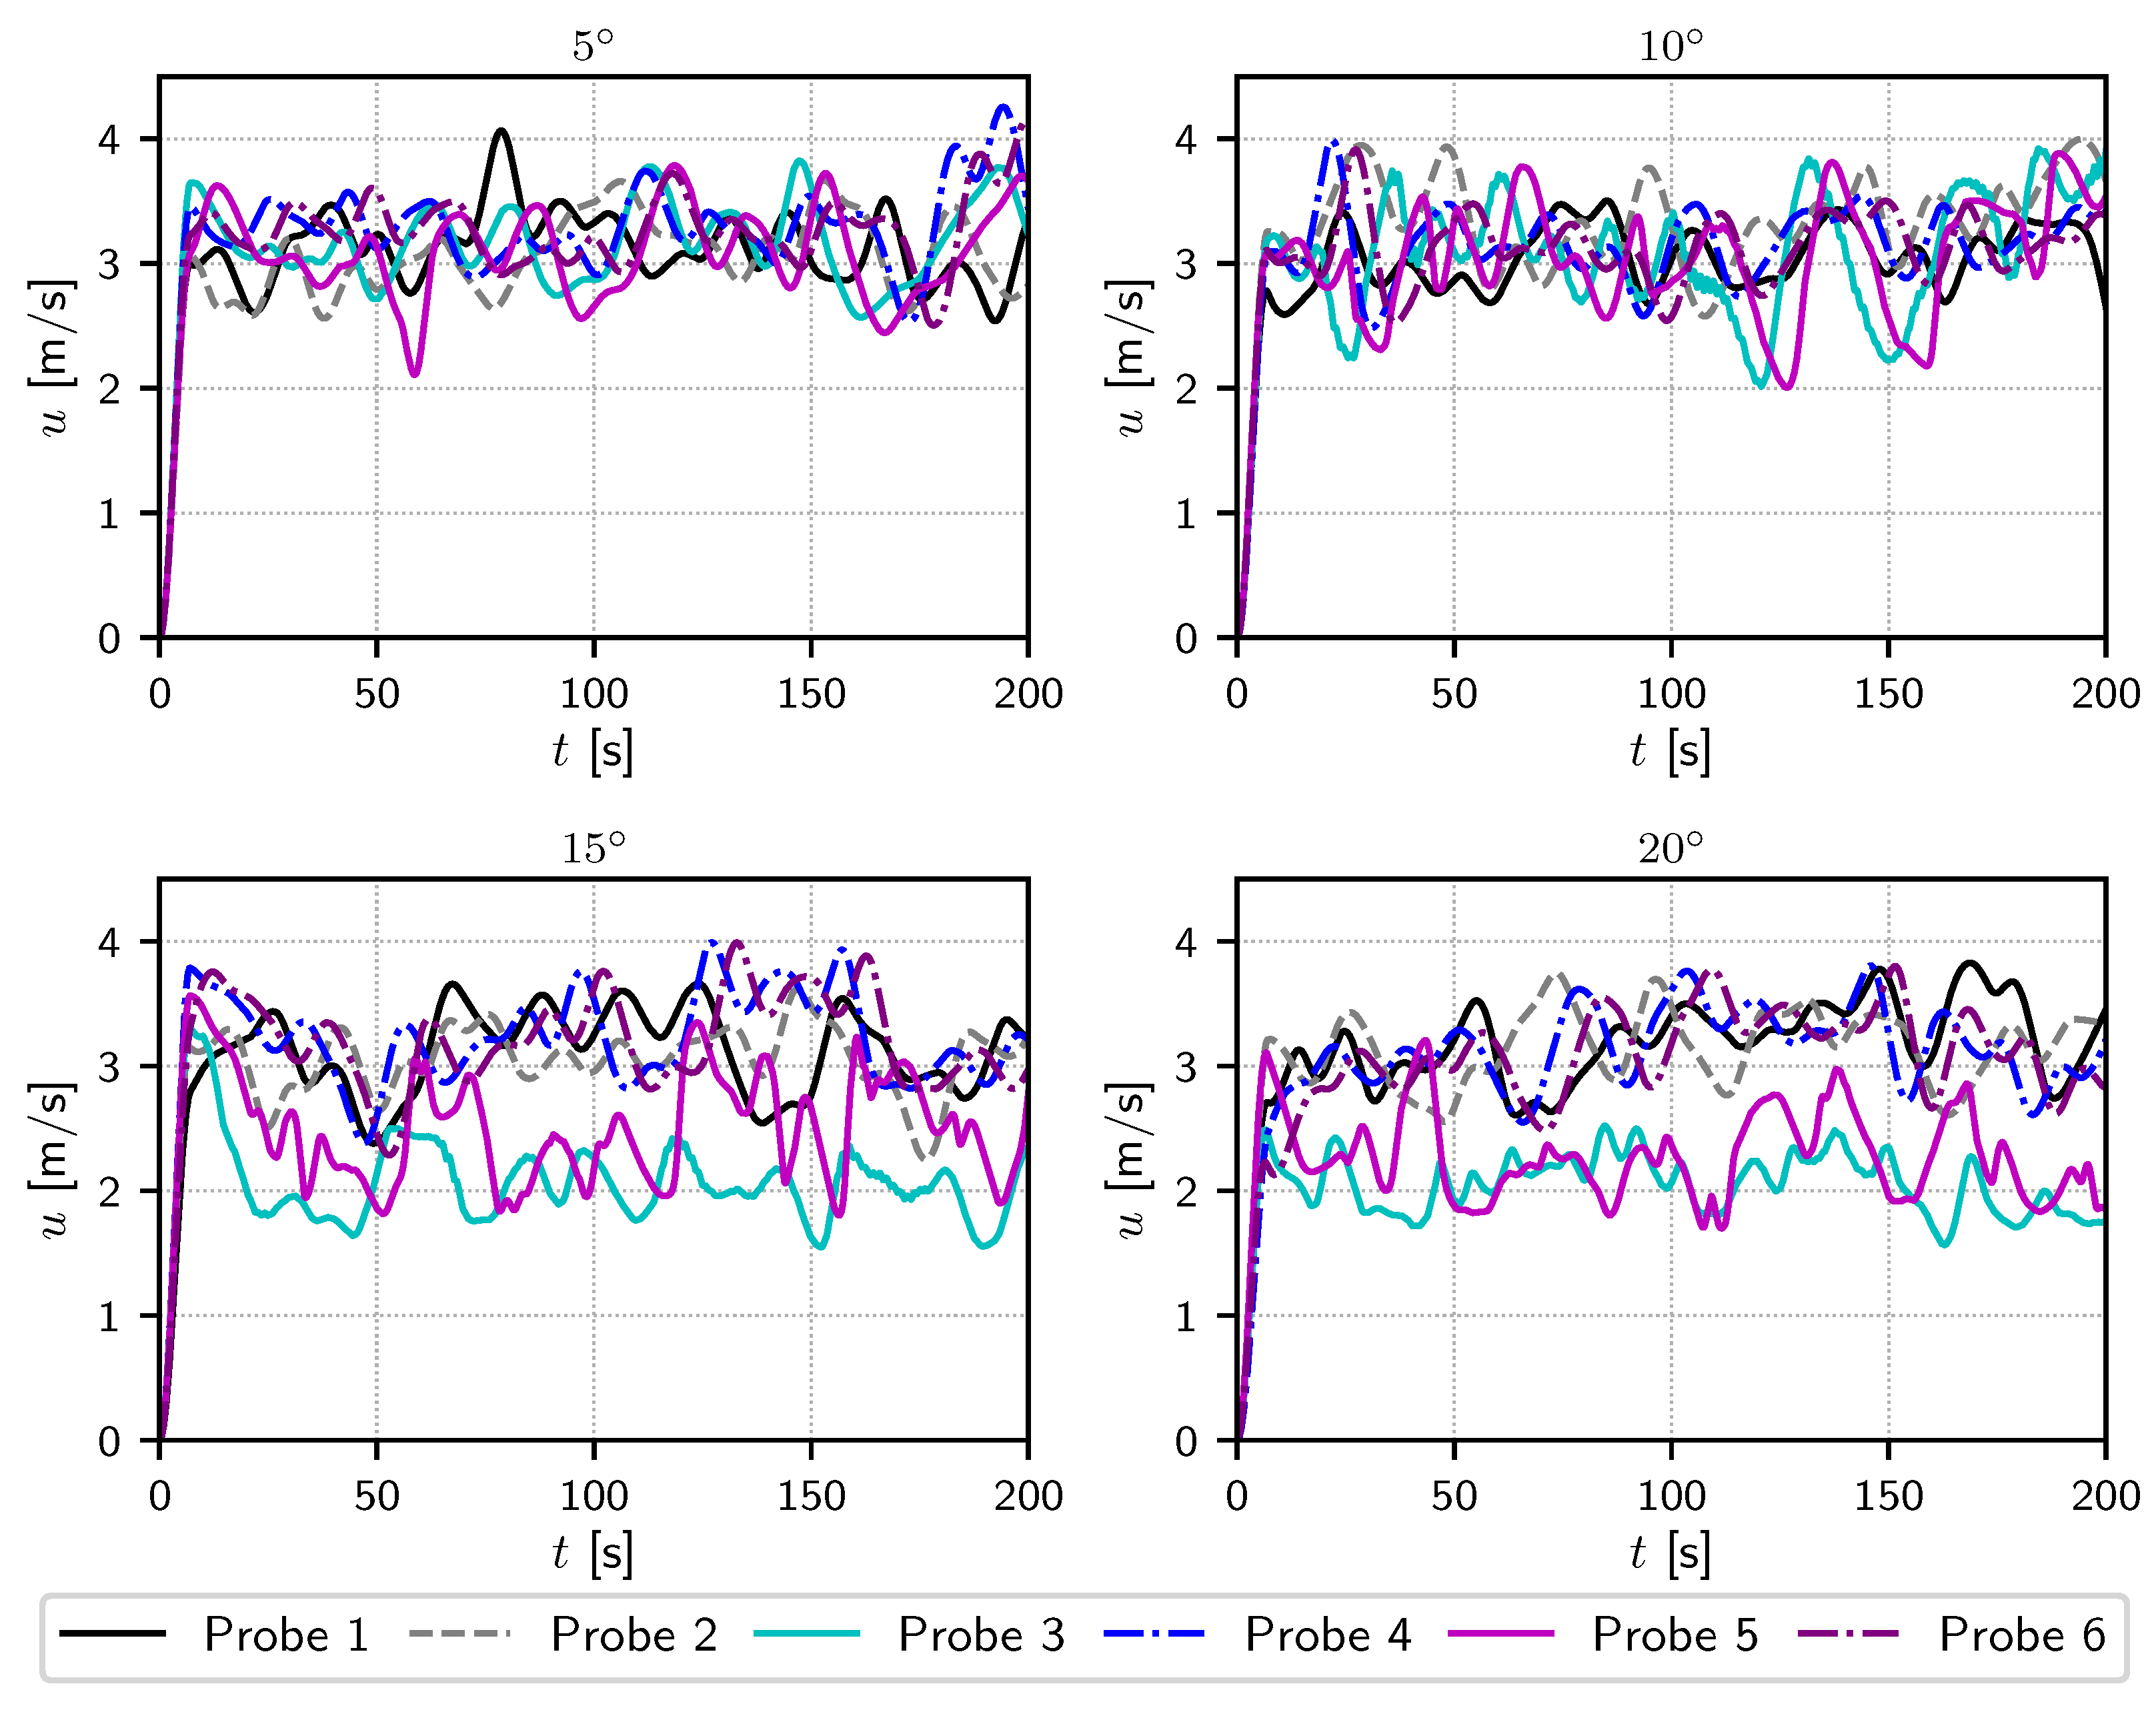
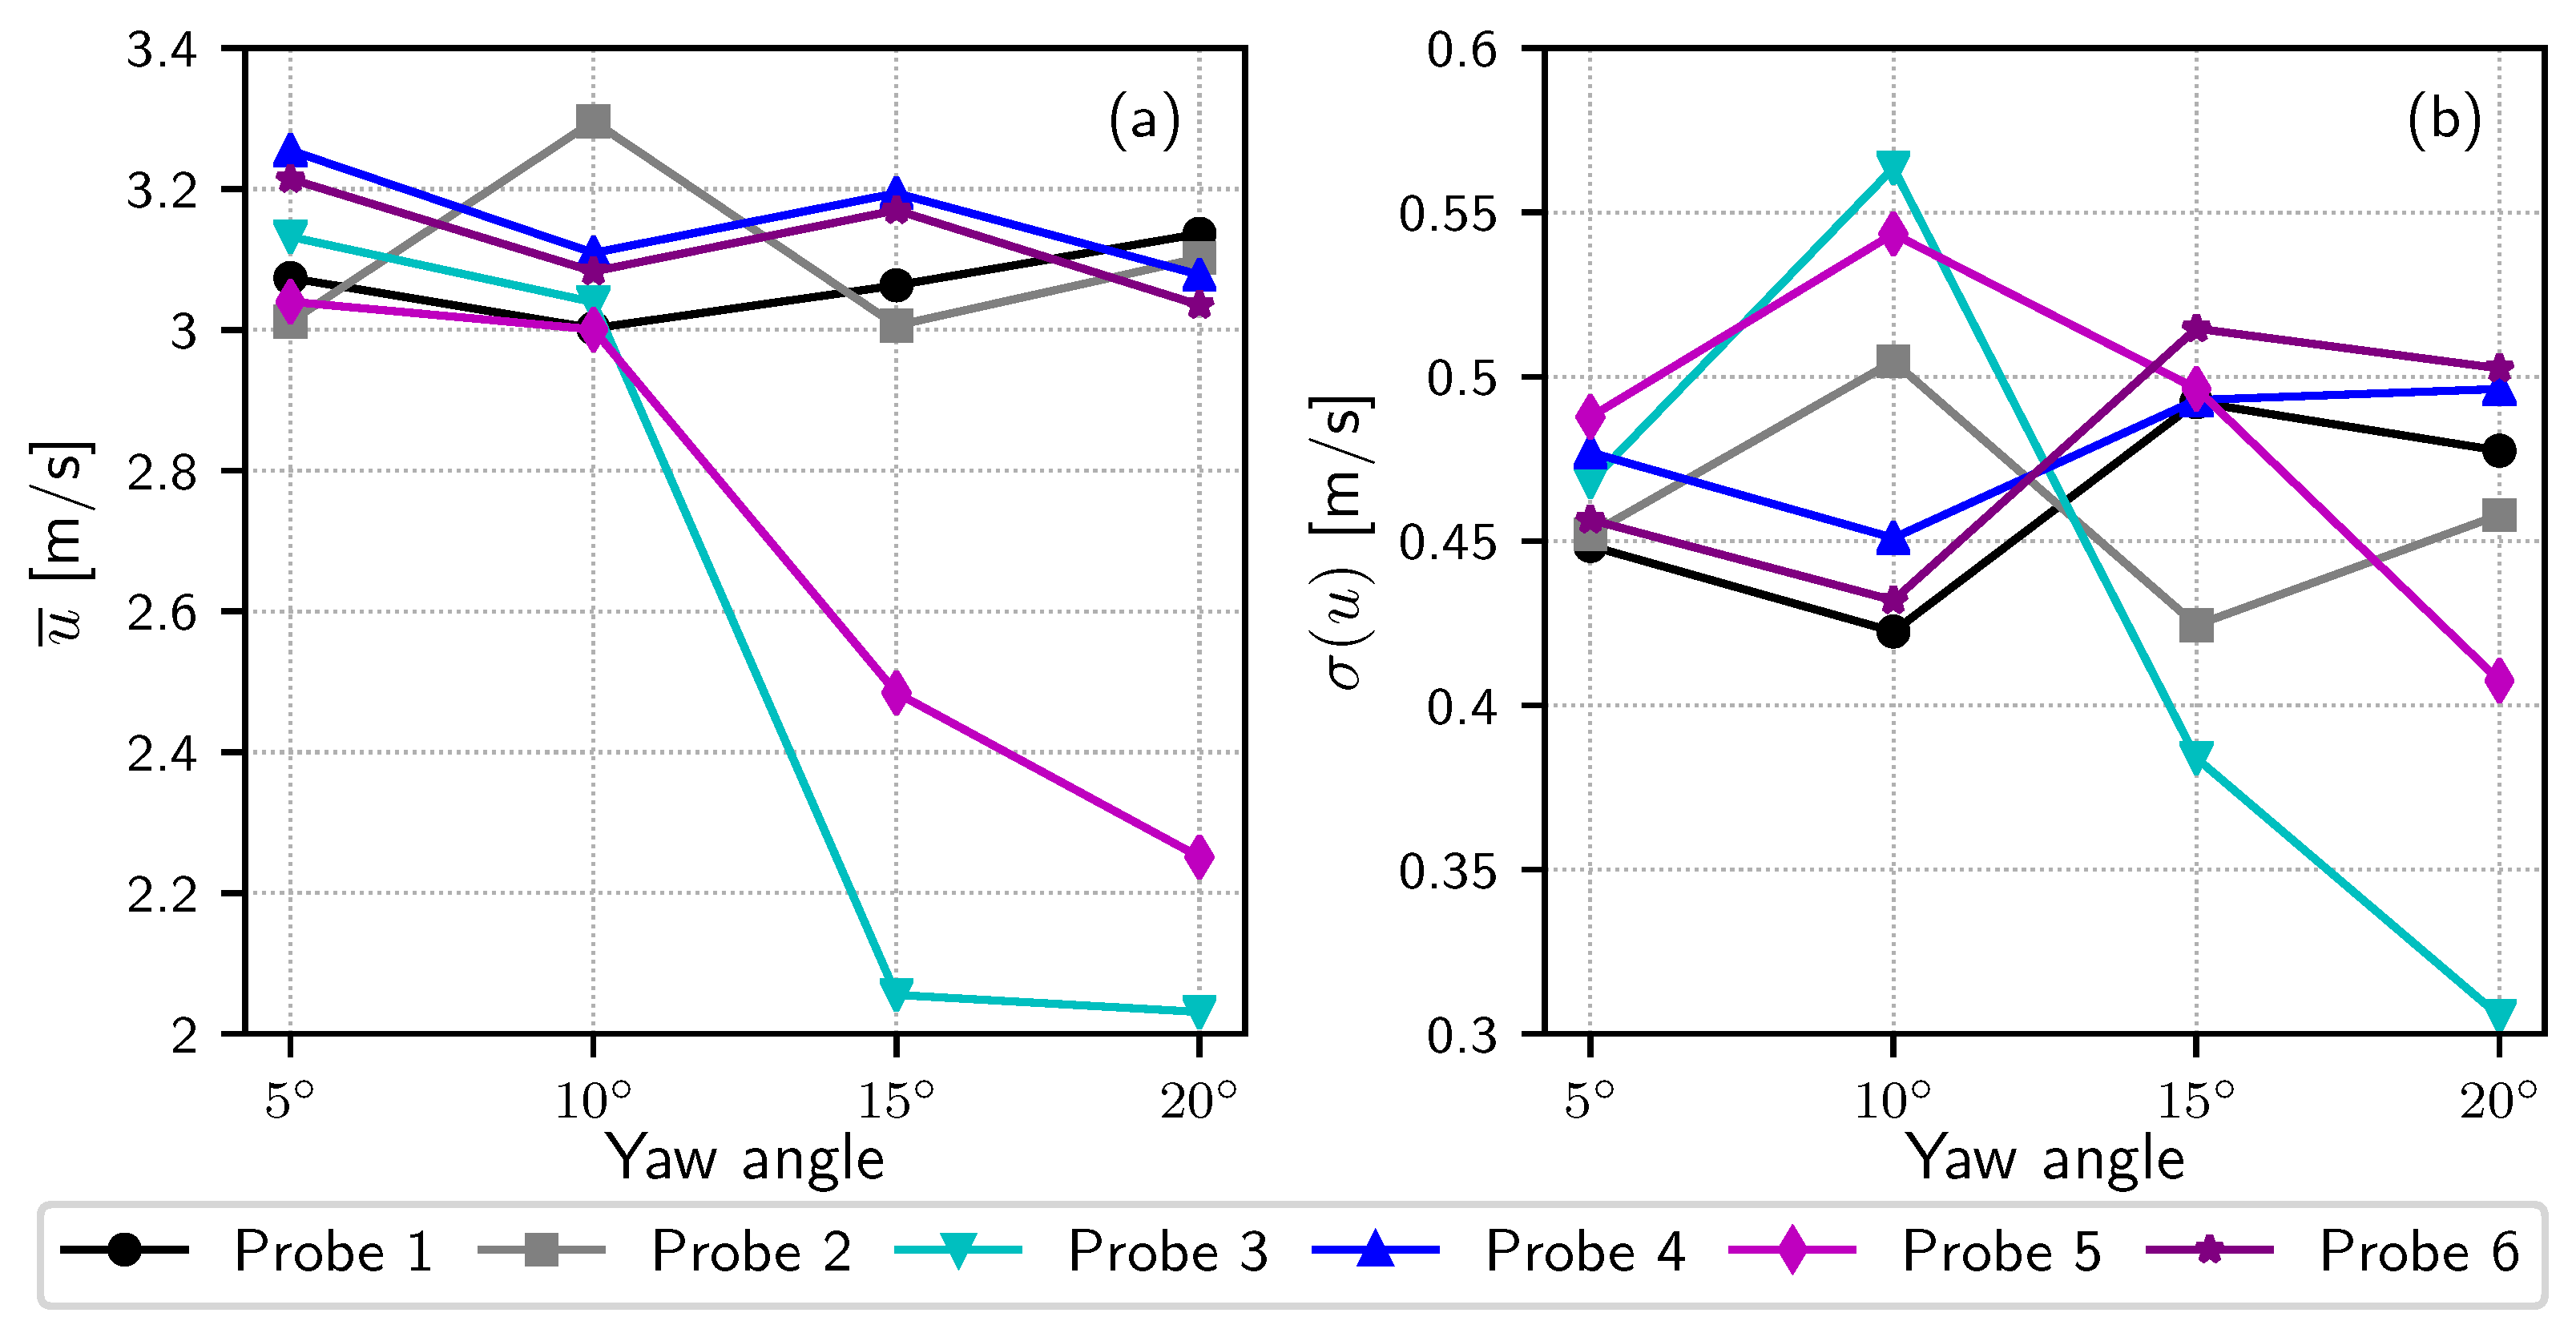
To better quantify these aspects, numerical probes were defined in the flow domain and are represented by the points denoted from 1 to 6 in each plot of Figure 14. Probes 1 and 2 are centred one diameter upstream of the upper and middle upstream turbines respectively. These probes are included in order to show the incoming flow disrupted only by ambient turbulence. Probes 4 and 6 are centred one and two diameters upstream of the downstream turbine respectively, whereas probes 3 and 5 are located in front of the blade tip of the downstream turbine, still one and two diameters upstream respectively. These probe locations highly emphasise the tightness of this layout proposed by Engie-Alstom at the time. As it is an official precommercial set-up proposed by real major companies in the field, it is worth investigating. The 200 s of velocity measurements recorded by each probe are reproduced for each given configuration in Figure 16. This measurement duration is possibly not long enough to have fully converged mean and standard deviation values, but clear tendencies can already be observed on the results shown in Figure 17. As anticipated, for a 5 yaw angle, no significant impact can be observed: probes 1 and 2 display a mean velocity a little lower than the far upstream incoming velocity of 3.2 m/s due to axial induction; probes 3 to 6 display higher values due to a small acceleration in the bypass; and a slightly higher mean velocity than 3.2 m/s is recorded for probes 4 and 6 as expected. What is more, no conclusions can be drawn from the standard deviations of these quantities (Figure 17b).
For a 10 yaw angle, some interesting phenomena can be identified. Firstly, probe 2 shows a higher mean velocity value together with a higher standard deviation. There is no other explanation than the possibility of “natural” oscillations due to the passing of turbulent structures which cause the velocity to increase and were not counterbalanced by a sufficient averaging duration. Probes 3 and 5 show close to the same mean velocity values (Figure 17a) but highly impacted standard deviations (Figure 17b). For these two probes, clear explanations can be given: the mean velocities are not highly impacted because they are at the outer limit of the wake, as shown in Figure 14 but a higher standard deviation is observed because these probes are in the mixing layer of the wake. As a conclusion for the downstream turbine, the mean flow velocity profile will not be highly modified (no real shear in the velocity profile) but the turbine will perceive much higher velocity fluctuations at the tip, possibly leading to advanced ageing and possible damage of the blades and drivetrain.
For the 15 and 20 yaw angles, these two configurations will be treated together as the evidenced phenomena are similar, although intensified for the higher angle. Probes 1 and 2 show a close to regular behaviour, as shown by the averaged velocity (Figure 17a). The major influence of interaction can be observed for probes 3 and 5 directly from the velocity records of Figure 16, showing an important velocity deficit. This deficit translates into a lower averaged velocity value (Figure 17a) and even more so for the larger yaw angle of 20 . Therefore, the downstream turbine will experience a large shear in the averaged velocity profile since the mean value of probes 4 and 6 remains unchanged. This important shear flow will only affect one side of the turbine which will inevitably create load fluctuations. For all four of the tested configurations (from 5 to 20 ), these probes are very little affected by the interaction phenomena. Finally, coming back to probes 3 and 5, a decrease of the standard deviations can be observed. This is explained by these probes being situated clearly in the wake of the upstream turbine. This is somewhat obvious, although an increase of these values in the wake would have been expected instead. This aspect will need further validation and confirmation, which would be facilitated by longer simulations: computations run on a longer duration will have much better convergence of these standard deviations. Computations with smaller interparticles spacing (the Lagrangian equivalent of the mesh size) will also be considered for a better spatial discretisation of the concerned interaction phenomena.

5. Conclusions

This paper presented an industrial application of the recent implementation of the SEM (Synthetic Eddy Method) in the Lagrangian Vortex framework, of which the theoretical basis is detailed in Choma Bex et al. [32]. The influence of the turbulence intensity, turbulence integral length scale, the distribution of the turbulent structure sizes and also the turbulent structure filling ratio were studied and analysed. All these analyses were applied to an 18 m diameter 3 bladed turbine, similar to Alstom’s Oceade™ turbine. The upstream mean velocity, turbulence intensities and integral length scales were chosen from recent published works dedicated to analysing the Alderney Race turbulence characteristics.
Additionally, a four turbine array was also simulated and analysed. This array is the reproduction of the NEPTHYD precommercial farm that was granted by the French government in the past year to the consortium composed by Engie-Alstom, just before the Alstom-GE decision to halt tidal energy development. In that respect, the tested farm is really representative of an industrial configuration, both in terms of geometrical layout and also in terms of the tested velocity and turbulence characteristics. From the presented results, the individual computed wakes have a downstream extension of approximately 3 to 4 diameters. However, these computations may be somewhat too dissipative as pointed out from the aforementioned filling ratio analysis. Unfortunately, the influence of the different turbulence integral length scales did not show a clear tendency in the present results. Nevertheless, this is the first attempt at taking into account these integral length scales for such a configuration and several points of improvement are already identified. The account of tidal angular asymmetry was also tested on the NEPTHYD four turbine configuration in order to emphasise possible mutual interaction among turbines. For a 10 yaw angle, the downstream turbine is not clearly in the wake of the upstream turbine, and the average velocity profile is not largely modified. However, the computed velocity record issuing from numerical probes located 1 D and 2 D upstream of the downstream turbine showed increased velocity fluctuations, most probably due to the fact that the tip of the downstream turbine blades is in the mixing layer of the upstream wake. For an increased yaw angle up to 20 , an important shear in the mean velocity profile will be experienced all over the blade on nearly half of the turbine swept area. From these two configurations, it is clear that the induced blade and drivetrain fluctuating loads will be largely affected.
The account of fluctuation of loads on the turbine blades will be the next major task for the numerical code considered here. The numerical approach of Baltazar and Falcao [62,63] or more recently Boujleben et al. [64] consider a 3D blade capable of better modelling the force experienced by the blade. Unfortunately, this approach cannot deal with dynamic stall, which is an obvious situation encountered by the turbine in such configurations. From the developments of Riziotis et al. [65] or Zanon et al. [66], both in the Lagrangian framework but in 2D, improvements of the blade model are possible in that respect. An extension in 3D is envisioned in the near future. Another very interesting work of Salvatore et al. [67], which is very close to our formulation, is also considered. However, their approach with Lagrangian vortex sheets prevents the use of the PSE-LES diffusion model as well as the presented ambient turbulence model, both of these aspects being of major importance in the present study. A new formulation will be proposed soon in order to improve on the already published work of Togneri et al. [68] using synthetic turbulence but not in the framework of turbine interactions.

Author Contributions

Conceptualisation, G.P.; methodology, G.P.; software, C.C.B. and M.S.; formal analysis, M.S.; data curation, M.S.; writing—original draft preparation, M.S., G.P. and C.C.B.; writing—review and editing, M.T. and I.E.; visualisation, M.S.; project administration, M.T.; funding acquisition, M.T. and G.P. All authors have read and agreed to the published version of the manuscript.

Funding

This work was performed during the MONITOR project co-financed by the European Regional Development Fund (ERDF) through the Interreg Atlantic Area Programme. This work was also supported in part by the ERDF and the Normandy Regional Council via programmes such as NEPTUNE, SEMARIN and DIADEMAR. CCB acknowledge the financial support of IFREMER for the funding of her Ph.D. grants. Some authors of this work are also co-financed by the European Regional Development Fund through the Interreg FCE (France Channel England), via the TIGER project. The present work was performed on computing resources provided by CRIANN (Normandy, France).

Institutional Review Board Statement

Not applicable.

Informed Consent Statement

Not applicable.

Data Availability Statement

Not applicable.

Conflicts of Interest

The authors declare no conflict of interest. The funders had no role in the design of the study; in the collection, analyses, or interpretation of data; in the writing of the manuscript, or in the decision to publish the results.

Abbreviations

The following abbreviations are used in this manuscript:
LESLarge Eddy Simulation
PSEParticle Strength Exchange
SEMSynthetic Eddy Method
TSRTip Speed Ratio

References

  1. EnFAIT. Enabling Future Arrays in Tidal. Available online: https://www.enfait.eu/ (accessed on 14 June 2021).
  2. SIMEC Atlantis Energy. Tidal Stream Projects MeyGen. Available online: https://simecatlantis.com/projects/meygen/ (accessed on 14 June 2021).
  3. Karsten, R.; Swan, A.; Culina, J. Assessment of arrays of in-stream tidal turbines in the Bay of Fundy. Philos. Trans. R. Soc. A Math. Eng. Sci. 2013, 371. [Google Scholar] [CrossRef] [Green Version]
  4. Divett, T.; Vennell, R.; Stevens, C. Optimization of multiple turbine arrays in a channel with tidally reversing flow by numerical modelling with adaptive mesh. Philos. Trans. R. Soc. A Math. Phys. Eng. Sci. 2013, 371. [Google Scholar] [CrossRef]
  5. Gerris Flow Solver. Available online: http://gfs.sourceforge.net/wiki/index.php/Main_Page (accessed on 14 June 2021).
  6. Churchfield, M.J.; Li, Y.; Moriarty, P.J. A large-eddy simulation study of wake propagation and power production in an array of tidal-current turbines. Philos. Trans. R. Soc. A Math. Phys. Eng. Sci. 2013, 371. [Google Scholar] [CrossRef] [Green Version]
  7. Mycek, P.; Gaurier, B.; Germain, G.; Pinon, G.; Rivoalen, E. Experimental study of the turbulence intensity effects on marine current turbines behaviour. Part II: Two interacting turbines. Renew. Energy 2014, 68, 876–892. [Google Scholar] [CrossRef] [Green Version]
  8. Mycek, P. Étude Numérique et Expérimentale du Comportement d’Hydroliennes. Ph.D. Thesis, Université du Havre, Le Havre, France, 2013. [Google Scholar]
  9. Pinon, G.; Mycek, P.; Germain, G.; Rivoalen, E. Numerical simulation of the wake of marine current turbines with a particle method. Renew. Energy 2012, 46, 111–126. [Google Scholar] [CrossRef] [Green Version]
  10. Osalusi, E.; Side, J.; Harris, R. Structure of turbulent flow in EMEC’s tidal energy test site. Int. Commun. Heat Mass Transf. 2009, 36, 422–431. [Google Scholar] [CrossRef]
  11. Osalusi, E.; Side, J.; Harris, R. Reynolds stress and turbulence estimates in bottom boundary layer of Fall of Warness. Int. Commun. Heat Mass Transf. 2009, 36, 412–421. [Google Scholar] [CrossRef]
  12. Thomson, J.; Polagye, B.; Durgesh, V.; Richmond, M. Measurements of Turbulence at Two Tidal Energy Sites in Puget Sound, WA. IEEE J. Ocean. Eng. 2012, 37, 363–374. [Google Scholar] [CrossRef]
  13. Milne, I.A.; Sharma, R.N.; Flay, R.G.J.; Bickerton, S. Characteristics of the turbulence in the flow at a tidal stream power site. Philos. Trans. R. Soc. A Math. Phys. Eng. Sci. 2013, 371. [Google Scholar] [CrossRef] [PubMed]
  14. McCaffrey, K.; Fox-Kemper, B.; Hamlington, P.E.; Thomson, J. Characterization of turbulence anisotropy, coherence, and intermittency at a prospective tidal energy site: Observational data analysis. Renew. Energy 2015, 76, 441–453. [Google Scholar] [CrossRef] [Green Version]
  15. Thiébaut, M.; Filipot, J.F.; Maisondieu, C.; Damblans, G.; Duarte, R.; Droniou, E.; Chaplain, N.; Guillou, S. A comprehensive assessment of turbulence at a tidal-stream energy site influenced by wind-generated ocean waves. Energy 2020, 191, 116550. [Google Scholar] [CrossRef]
  16. Sentchev, A.; Thiébaut, M.; Guillou, S. Turbulence characterization at tidal-stream energy site in Alderney Race. In Developments in Renewable Energies Offshore; Soares, C.G., Ed.; CRC Press: Boca Raton, FL, USA, 2020. [Google Scholar] [CrossRef]
  17. Mercier, P.; Thiébaut, M.; Guillou, S.; Maisondieu, C.; Poizot, E.; Pieterse, A.; Thiébot, J.; Filipot, J.F.; Grondeau, M. Turbulence measurements: An assessment of Acoustic Doppler Current Profiler accuracy in rough environment. Ocean Eng. 2021, 226, 108819. [Google Scholar] [CrossRef]
  18. Furgerot, L.; Sentchev, A.; Bailly du Bois, P.; Lopez, G.; Morillon, M.; Poizot, E.; Méar, Y.; Bennis, A.C. One year of measurements in Alderney Race: Preliminary results from database analysis. Philos. Trans. R. Soc. A Math. Phys. Eng. Sci. 2020, 378. [Google Scholar] [CrossRef] [PubMed]
  19. Sentchev, A.; Nguyen, T.D.; Furgerot, L.; Bailly du Bois, P. Underway velocity measurements in the Alderney Race: Towards a three-dimensional representation of tidal motions. Philos. Trans. R. Soc. A Math. Phys. Eng. Sci. 2020, 378. [Google Scholar] [CrossRef] [PubMed]
  20. Thiébaut, M.; Filipot, J.F.; Maisondieu, C.; Damblans, G.; Jochum, C.; Kilcher, L.F.; Guillou, S. Characterization of the vertical evolution of the three-dimensional turbulence for fatigue design of tidal turbines. Philos. Trans. R. Soc. A Math. Phys. Eng. Sci. 2020, 378. [Google Scholar] [CrossRef] [PubMed]
  21. Thiébaut, M.; Filipot, J.F.; Maisondieu, C.; Damblans, G.; Duarte, R.; Droniou, E.; Guillou, S. Assessing the turbulent kinetic energy budget in an energetic tidal flow from measurements of coupled ADCPs. Philos. Trans. R. Soc. A Math. Phys. Eng. Sci. 2020, 378. [Google Scholar] [CrossRef]
  22. Bourgoin, A.C.L.; Guillou, S.S.; Thiébot, J.; Ata, R. Turbulence characterization at a tidal energy site using large-eddy simulations: Case of the Alderney Race. Philos. Trans. R. Soc. A Math. Phys. Eng. Sci. 2020, 378. [Google Scholar] [CrossRef]
  23. Guillou, N.; Neill, S.P.; Thiébot, J. Spatio-temporal variability of tidal-stream energy in north-western Europe. Philos. Trans. R. Soc. A Math. Phys. Eng. Sci. 2020, 378. [Google Scholar] [CrossRef] [PubMed]
  24. Lopez, G.; Bennis, A.C.; Barbin, Y.; Sentchev, A.; Benoit, L.; Marié, L. Surface currents in the Alderney Race from high-frequency radar measurements and three-dimensional modelling. Philos. Trans. R. Soc. A Math. Phys. Eng. Sci. 2020, 378. [Google Scholar] [CrossRef]
  25. Bailly du Bois, P.; Dumas, F.; Morillon, M.; Furgerot, L.; Voiseux, C.; Poizot, E.; Méar, Y.; Bennis, A.C. The Alderney Race: General hydrodynamic and particular features. Philos. Trans. R. Soc. A Math. Phys. Eng. Sci. 2020, 378. [Google Scholar] [CrossRef]
  26. Jarrin, N.; Benhamadouche, S.; Laurence, D.; Prosser, R. A Synthetic-Eddy-Method for Generating Inflow Conditions for Large-Eddy Simulations. Int. J. Heat Fluid Flow 2006, 27, 585–593. [Google Scholar] [CrossRef] [Green Version]
  27. Jonkman, B.J.; Kilcher, L. TurbSim User’s Guide: Version 1.06.00 (Draft Version); Technical Report; National Renewable Energy Laboratory: Golden, CO, USA, 2012.
  28. Bernard, P.; Viré, A.; Moureau, V.; Lartigue, G.; Beaudet, L.; Deglaire, P.; Bricteux, L. Large-Eddy Simulation of wind turbines wakes including geometrical effects. Comput. Fluids 2018, 173, 133–139. [Google Scholar] [CrossRef]
  29. Ahmed, U.; Apsley, D.; Afgan, I.; Stallard, T.; Stansby, P. Fluctuating loads on a tidal turbine due to velocity shear and turbulence: Comparison of CFD with field data. Renew. Energy 2017, 112, 235–246. [Google Scholar] [CrossRef] [Green Version]
  30. Mercier, P.; Grondeau, M.; Guillou, S.; Thiébot, J.; Poizot, E. Numerical study of the turbulent eddies generated by the seabed roughness. Case study at a tidal power site. Appl. Ocean Res. 2020, 97, 102082. [Google Scholar] [CrossRef]
  31. Pinon, G.; Carlier, C.; Fur, A.; Gaurier, B.; Germain, G.; Rivoalen, E. Account of ambient turbulence for turbine wakes using a Synthetic-Eddy-Method. J. Phys. Conf. Ser. 2017, 854, 012016. [Google Scholar] [CrossRef] [Green Version]
  32. Choma Bex, C.; Carlier, C.; Fur, A.; Pinon, G.; Germain, G.; Rivoalen, É. A stochastic method to account for the ambient turbulence in Lagrangian Vortex computations. Appl. Math. Model. 2020, 88, 38–54. [Google Scholar] [CrossRef]
  33. Chatelain, P.; Backaert, S.; Winckelmans, G.; Kern, S. Large Eddy Simulation of Wind Turbine Wakes. Flow Turbul. Combust. 2013, 91, 587–605. [Google Scholar] [CrossRef]
  34. Bossy, M.; Espina, J.; Moricel, J.; Paris, C.; Rousseau, A. Modeling the wind circulation around mills with a Lagrangian stochastic approach. SMAI J. Comput. Math. 2016, 2, 177–214. [Google Scholar] [CrossRef] [Green Version]
  35. Mycek, P.; Pinon, G.; Lothodé, C.; Dezotti, A.; Carlier, C. Iterative solver approach for turbine interactions: Application to wind or marine current turbine farms. Appl. Math. Model. 2017, 41, 331–349. [Google Scholar] [CrossRef] [Green Version]
  36. Autorité Environnementale. Projet Nepthyd. Technical report, Conseil Général de l’environement et du développement durable. Available online: http://www.cgedd.developpement-durable.gouv.fr/IMG/pdf/160406_-_Hydroliennes_Raz_Blanchard_-_Nepthyd_50_-_delibere_cle05849f.pdf (accessed on 9 March 2021).
  37. Rehbach, C. Calcul numérique d’écoulements tridimensionnels instationnaires avec nappes tourbillonaires. La Rech. Aérosp. 1977, 5, 289–298. [Google Scholar]
  38. Lewis, R. Vortex Element Methods for Fluid Dynamic Analysis of Engineering Systems; Cambridge University Press: Cambridge, UK, 1991. [Google Scholar]
  39. Cottet, G.; Koumoutsakos, P. Vortex Methods: Theory and Practice; Cambridge University Press: Cambridge, UK, 2000. [Google Scholar]
  40. Degond, P.; Mas-Gallic, S. The weighted particle method for convection-diffusion equations. Part I: The case of an isotropic viscosity. Math. Comp. 1989, 53, 485–507. [Google Scholar] [CrossRef]
  41. Choquin, J.; Huberson, S. Particles simulation of viscous flow. Comput. Fluids 1989, 17, 397–410. [Google Scholar] [CrossRef]
  42. Sagaut, P. Large Eddy Simulation for Incompressible Flows: An Introduction; Scientific Computation; Springer: Berlin/Heidelberg, Germany, 2006. [Google Scholar]
  43. Mansour, N.; Ferziger, J.; Reynolds, W. Large-Eddy Simulation of a Turbulent Mixing Layer; Technical Report, Report TF-11; Thermosciences Div., Dept. of Mech. Eng., Stanford University: Stanford, CA, USA, 1978. [Google Scholar]
  44. Ogami, Y.; Akamatsu, T. Viscous flow simulation using the discrete vortex model—The diffusion velocity method. Comput. Fluids 1991, 19, 433–441. [Google Scholar] [CrossRef]
  45. Mycek, P.; Pinon, G.; Germain, G.; Rivoalen, E. Formulation and analysis of a diffusion-velocity particle model for transport-dispersion equations. Comput. Appl. Math. 2016, 35, 447–473. [Google Scholar] [CrossRef]
  46. Leonard, A. Vortex methods for flow simulation. J. Comput. Phys. 1980, 37, 289–335. [Google Scholar] [CrossRef]
  47. Winckelmans, G.S.; Leonard, A. Contributions to Vortex Particle Methods for the Computation of Three-Dimensional Incompressible Unsteady Flows. J. Comput. Phys. 1993, 109, 247–273. [Google Scholar] [CrossRef]
  48. Lindsay, K.; Krasny, R. A particle method and adaptive treecode for vortex sheet motion in three-dimensional flow. J. Comput. Phys. 2001, 172, 879–907. [Google Scholar] [CrossRef] [Green Version]
  49. Pinon, G.; Bratec, H.; Huberson, S.; Pignot, G.; Rivoalen, E. Vortex method for simulation of a 3D round jet in a cross-stream. J. Turbul. 2005, 6, 1–25. [Google Scholar] [CrossRef]
  50. Hauville, F.; Roux, Y. Réglage Dynamique d’une Voile par une Méthode d’Intéraction Fluide/Structure. 9èmes Journées de l’Hydrodynamique. 2003. Available online: http://website.ec-nantes.fr/actesjh/images/9JH/Annexe/16-04-05.pdf (accessed on 23 June 2021).
  51. Luersen, M.; Le Riche, R.; Lemosse, D.; Le Maître, O. A computationally efficient approach to swimming monofin optimization. Struct. Multidiscip. Optim. 2006, 31, 488–496. [Google Scholar] [CrossRef]
  52. Carlier, C.; Pinon, G.; Gaurier, B.; Germain, G.; Rivoalen, E. Numerical and experimental study of elementary interactions in marine current turbines array. In Proceedings of the 11th European Wave and Tidal Energy Conference (EWTEC), Nantes, France, 6–11 September 2015. [Google Scholar]
  53. Lund, T.S.; Wu, X.; Squires, K.D. Generation of Turbulent Inflow Data for Spatially-Developing Boundary Layer Simulations. J. Comput. Phys. 1998, 140, 233–258. [Google Scholar] [CrossRef] [Green Version]
  54. Jarrin, N. Synthetic Inflow Boundary Conditions for the Numerical Simulation of Turbulence. Ph.D. Thesis, University of Manchester, Manchester, UK, 2008. [Google Scholar]
  55. Mycek, P.; Gaurier, B.; Germain, G.; Pinon, G.; Rivoalen, E. Experimental study of the turbulence intensity effects on marine current turbines behaviour. Part I: One single turbine. Renew. Energy 2014, 66, 729–746. [Google Scholar] [CrossRef] [Green Version]
  56. Choma Bex, C.; Pinon, G.; Slama, M.; Gaston, B.; Germain, G.; Rivoalen, E. Lagrangian Vortex computations of turbine wakes: Recent improvements using Poletto’s Synthetic Eddy Method (SEM) to account for ambient turbulence. J. Phys. Conf. Ser. 2020, 1618, 062028. [Google Scholar] [CrossRef]
  57. Maganga, F.; Germain, G.; King, J.; Pinon, G.; Rivoalen, E. Experimental characterisation of flow effects on marine current turbine behaviour and on its wake properties. IET Renew. Power Gener. 2010, 4, 498–509. [Google Scholar] [CrossRef] [Green Version]
  58. Harding, S.; Bryden, I. Directionality in prospective Northern UK tidal current energy deployment sites. Renew. Energy 2012, 44, 474–477. [Google Scholar] [CrossRef]
  59. Frost, C.H.; Evans, P.S.; Harrold, M.J.; Mason-Jones, A.; O’Doherty, T.; O’Doherty, D.M. The impact of axial flow misalignment on a tidal turbine. Renew. Energy 2017, 113, 1333–1344. [Google Scholar] [CrossRef]
  60. Maslov, N.; Charpentier, J.F.; Claramunt, C. A modelling approach for a cost-based evaluation of the energy produced by a marine energy farm. Int. J. Mar. Energy 2015, 9, 1–19. [Google Scholar] [CrossRef] [Green Version]
  61. Guillou, N.; Neill, S.P.; Robins, P.E. Characterising the tidal stream power resource around France using a high-resolution harmonic database. Renew. Energy 2018, 123, 706–718. [Google Scholar] [CrossRef] [Green Version]
  62. Baltazar, J.; Falcão de Campos, J.A.C. Hydrodynamic Analysis of a Horizontal Axis Marine Current Turbine With a Boundary Element Method. In Proceedings of the ASME 27th Conference on Offshore Mechanics and Arctic Engineering (OMAE), Estoril, Portugal, 15–20 June 2008; pp. 883–893. [Google Scholar] [CrossRef]
  63. Baltazar, J.; Falcão de Campos, J. An iteratively coupled solution of the cavitating flow on marine propellers using BEM. J. Hydrodyn. Ser. B 2010, 22, 838–843. [Google Scholar] [CrossRef]
  64. Boujleben, A.; Ibrahimbegovic, A.; Lefrançois, E. An efficient computational model for fluid-structure interaction in application to large overall motion of wind turbine with flexible blades. Appl. Math. Model. 2020, 77, 392–407. [Google Scholar] [CrossRef]
  65. Riziotis, V.A.; Voutsinas, S.G. Dynamic stall modelling on airfoils based on strong viscous–inviscid interaction coupling. Int. J. Numer. Methods Fluids 2008, 56, 185–208. [Google Scholar] [CrossRef]
  66. Zanon, A.; Giannattasio, P.; Simão Ferreira, C. A vortex panel model for the simulation of the wake flow past a vertical axis wind turbine in dynamic stall. Wind Energy 2013, 16, 661–680. [Google Scholar] [CrossRef]
  67. Salvatore, F.; Sarichloo, Z.; Calcagni, D. Marine Turbine Hydrodynamics by a Boundary Element Method with Viscous Flow Correction. J. Mar. Sci. Eng. 2018, 6, 53. [Google Scholar] [CrossRef] [Green Version]
  68. Togneri, M.; Pinon, G.; Carlier, C.; Choma Bex, C.; Masters, I. Comparison of synthetic turbulence approaches for blade element momentum theory prediction of tidal turbine performance and loads. Renew. Energy 2020, 145, 408–418. [Google Scholar] [CrossRef]
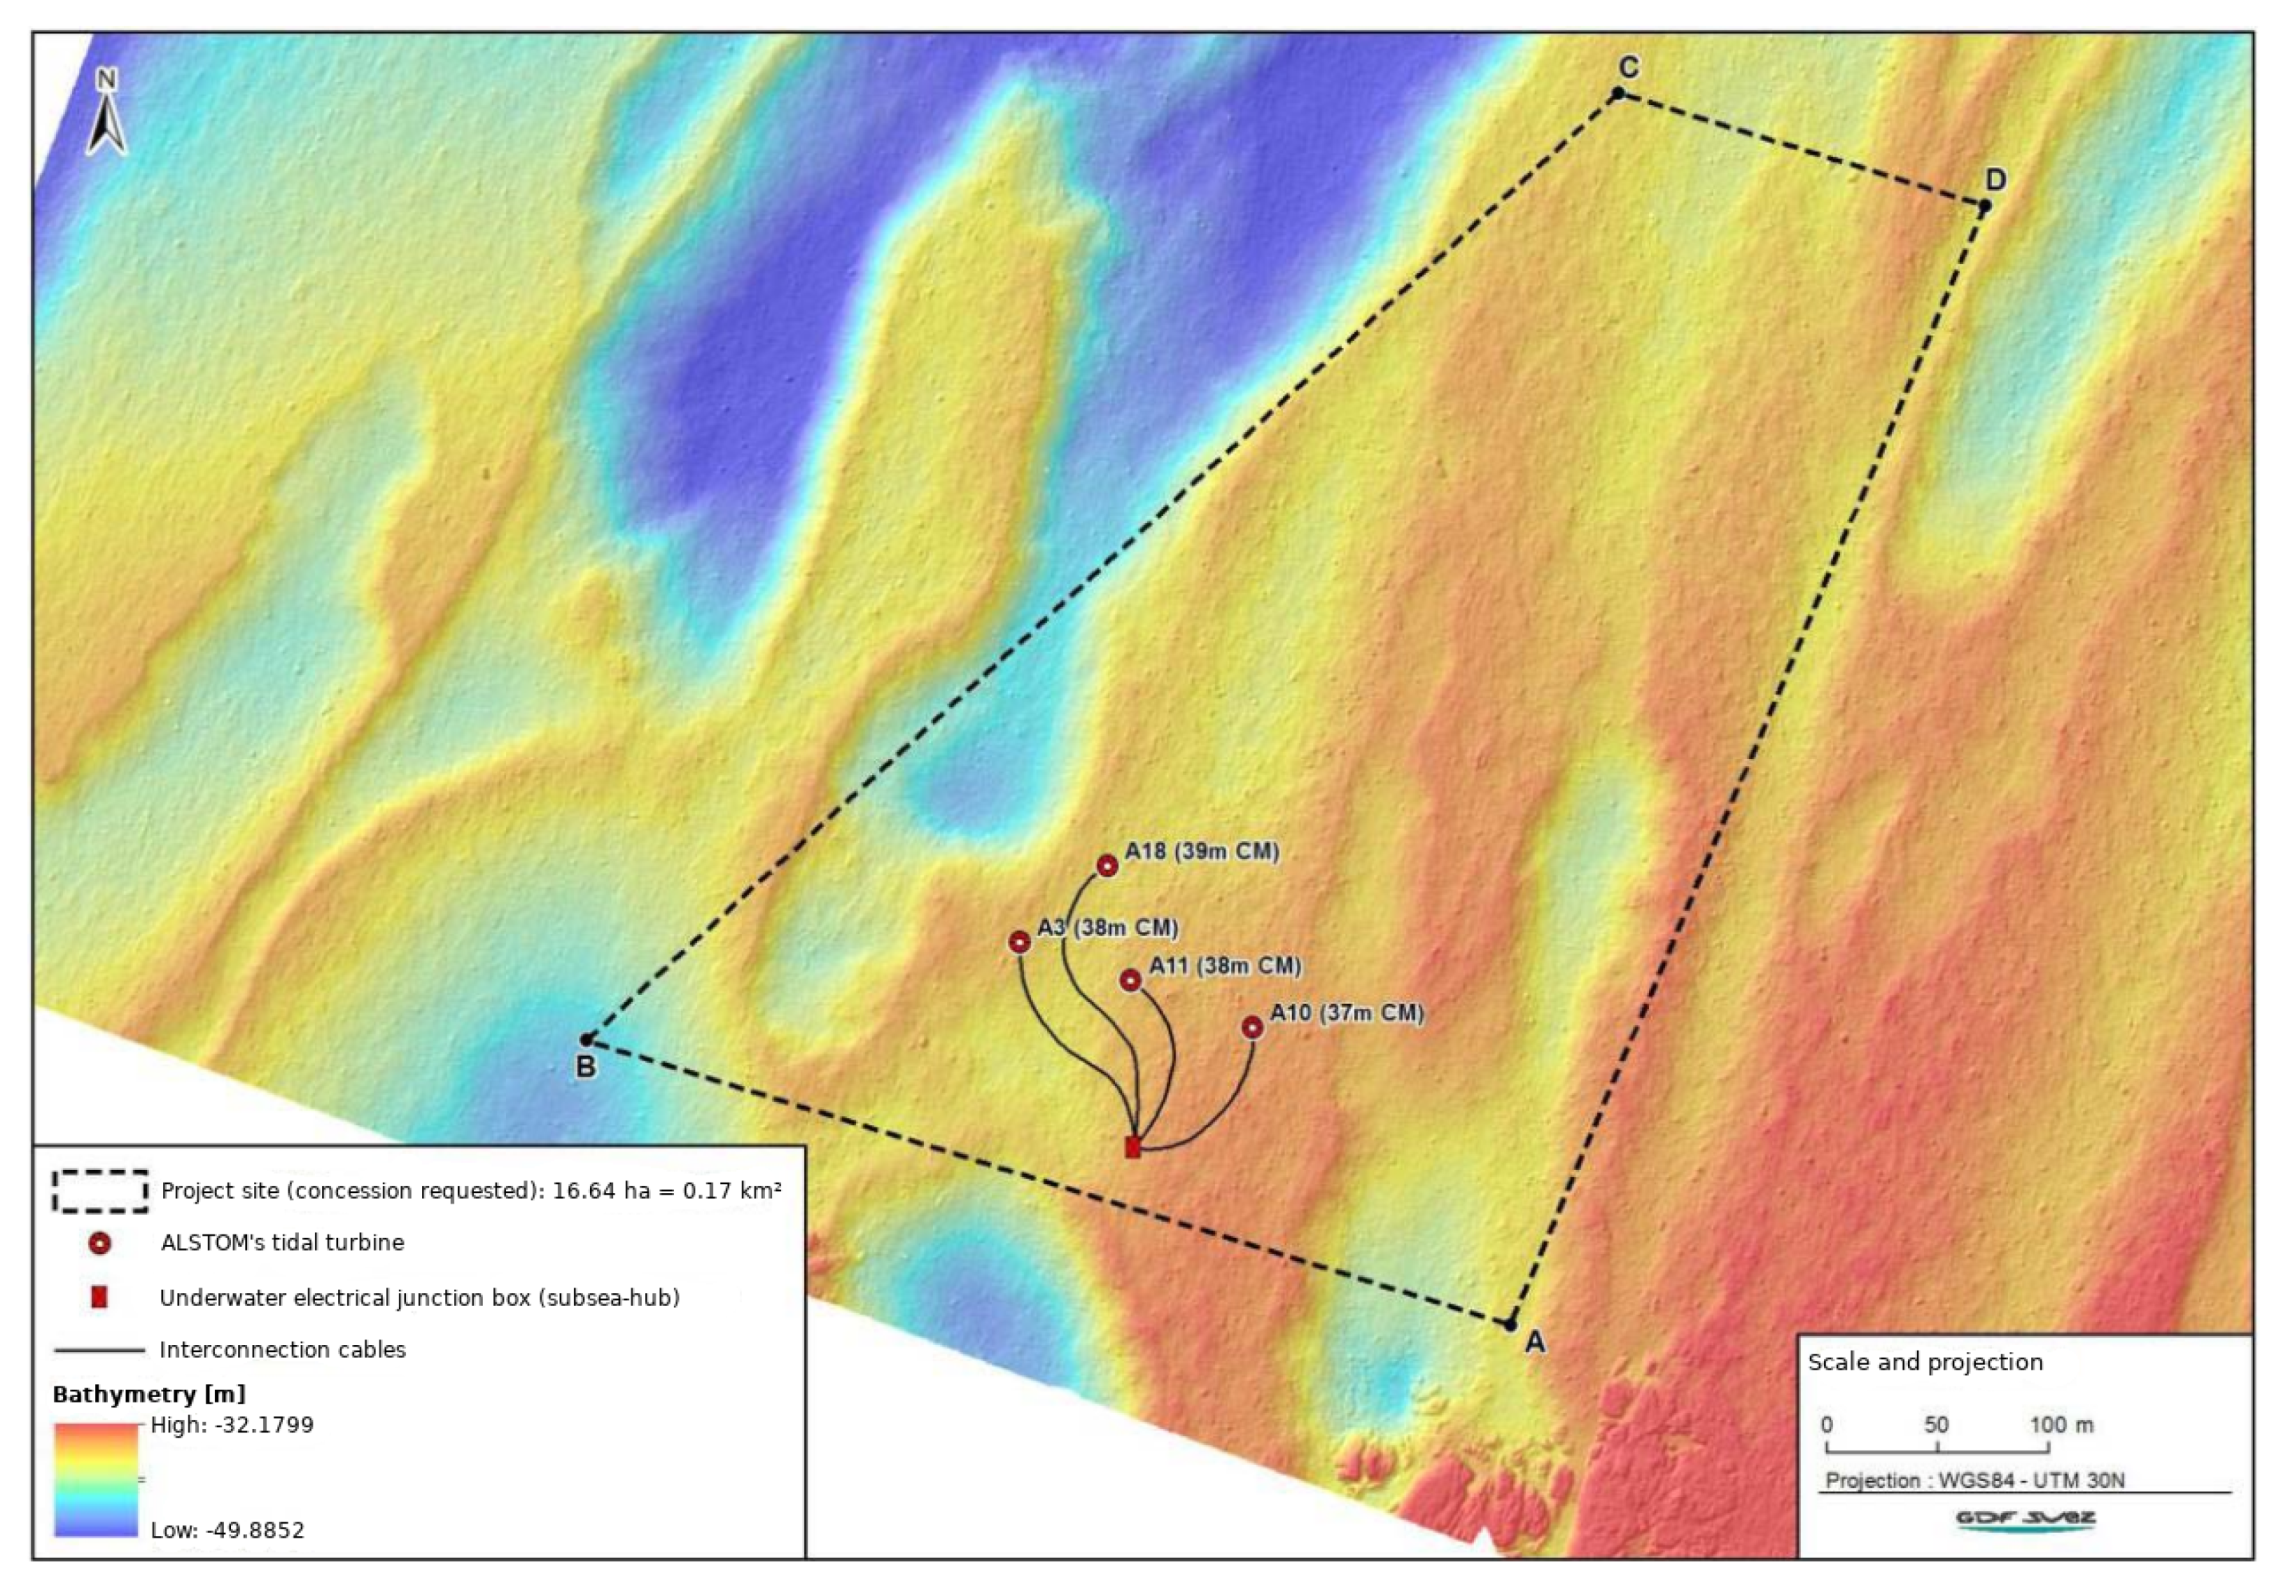
Figure 1. Configuration of the NEPTHYD project: a four turbine precommercial farm developed by Engie in 2014 and supposed to be equipped with Alstom’s Oceade™ turbine. The image is reproduced and adapted from the report [36] of the Autorité Environnementale, an agency of the French Ministry of Energy and Environment.
Energies 14 03826 g001
Figure 2. Turbulent structures (red and blue marks) immersed in the incoming flow.
Energies 14 03826 g002
Figure 3. Example of surface mesh for the turbine.
Energies 14 03826 g003
Figure 4. Time-averaged wakes obtained for I = 1.5%, TSR = 3.67, λ = 4.5 m, σ ( λ ) = 0 % and R f = 1. (a) with nacelle. (b) without nacelle.
Energies 14 03826 g004
Figure 5. Comparison of the experimental velocity profiles with the numerical results obtained with and without nacelle, for I = 1.5%, TSR = 3.67, λ = 4.5 m, σ ( λ ) = 0 % and R f = 1.
Energies 14 03826 g005
Figure 6. Comparison of the experimental and numerical disc-averaged velocities (TSR = 3.67, λ = 4.5 m, σ ( λ ) = 0 % and R f = 1). (a) I = 1.5%. (b) I = 15%.
Energies 14 03826 g006
Figure 7. Comparison of the numerical disc-averaged velocities obtained for three filling ratios R f and two turbulence intensities (TSR = 3.67, λ = 4.5 m, σ = 0 % ). (a) I = 1.5%. (b) I = 15%.
Energies 14 03826 g007
Figure 8. Comparison of the numerical disc-averaged velocities obtained for three filling ratios R f and two standard deviations σ ( λ ) (TSR = 3.67, λ = 4.5 m, I = 15%).
Energies 14 03826 g008
Figure 9. Comparison of the numerical disc-averaged velocities obtained for TSR = 4.1, I = 10% and several λ . (a) σ ( λ ) = 0 % . (b) σ ( λ ) = 75 % .
Energies 14 03826 g009
Figure 10. Four tidal turbine array configurations: (a) initial configuration (straight flow), (b) configuration with a yawed flow, (c) configuration with a yawed flow used for the simulation.
Energies 14 03826 g010
Figure 11. Time-averaged wakes obtained without ambient turbulence for TSR = 4.1.
Energies 14 03826 g011
Figure 12. Time-averaged wakes obtained for two turbulence intensities and two integral length scales (TSR = 4.1, σ ( λ ) = 75 % ).
Energies 14 03826 g012
Figure 13. Time-averaged wake lines obtained for two turbulence intensities and two integral length scales (TSR = 4.1, σ ( λ ) = 75 % ). For each turbine, the corresponding line passes through its centre. The solid grey line depicts the incoming velocity U = 3.2 m/s.
Energies 14 03826 g013
Figure 14. Time-averaged wakes obtained for several yaw angles ( I = 10 % , L = 18 m, R f 229 , TSR = 4.1, σ ( λ ) = 75 % ).
Energies 14 03826 g014
Figure 15. Time-averaged wake lines obtained for four yaw angles ( I = 10 % , L = 18 m, R f 229 , TSR = 4.1, σ ( λ ) = 75 % ). For each turbine, the corresponding line passes through its centre. The solid grey line depicts the incoming velocity U = 3.2 m/s.
Energies 14 03826 g015
Figure 16. Velocity u measured by six numerical probes, for four yaw angles ( I = 10 % , L = 18 m, R f 229 , TSR = 4.1, σ ( λ ) = 75 % ).
Energies 14 03826 g016
Figure 17. Time average and standard deviation of the velocity u ( I = 10 % , L = 18 m, R f 229 , TSR = 4.1, σ ( λ ) = 75 % ). (a) Time average of the velocity; (b) Standard deviation of the velocity.
Energies 14 03826 g017
Publisher’s Note: MDPI stays neutral with regard to jurisdictional claims in published maps and institutional affiliations.