
Verification of MPACT for the APR1400 Benchmark


Abstract
:1. Introduction
2. Benchmark Problems
3. Results and Discussion
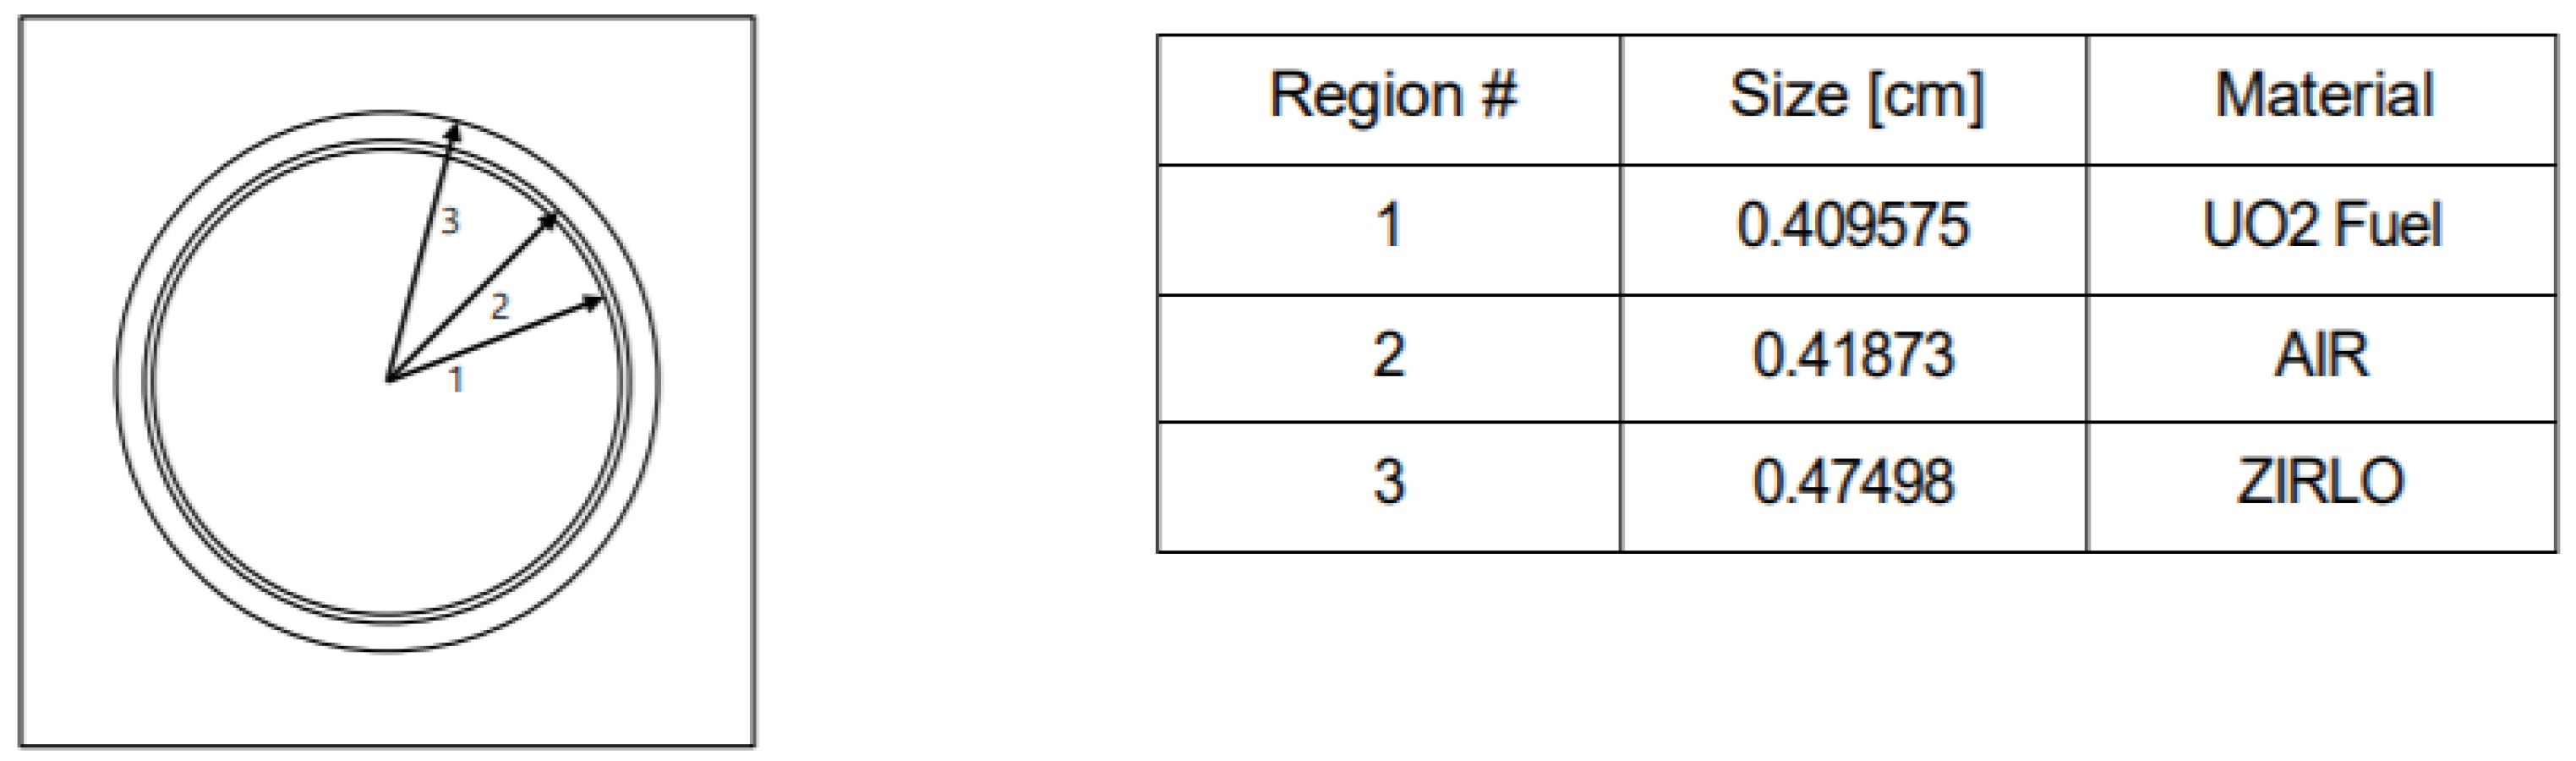
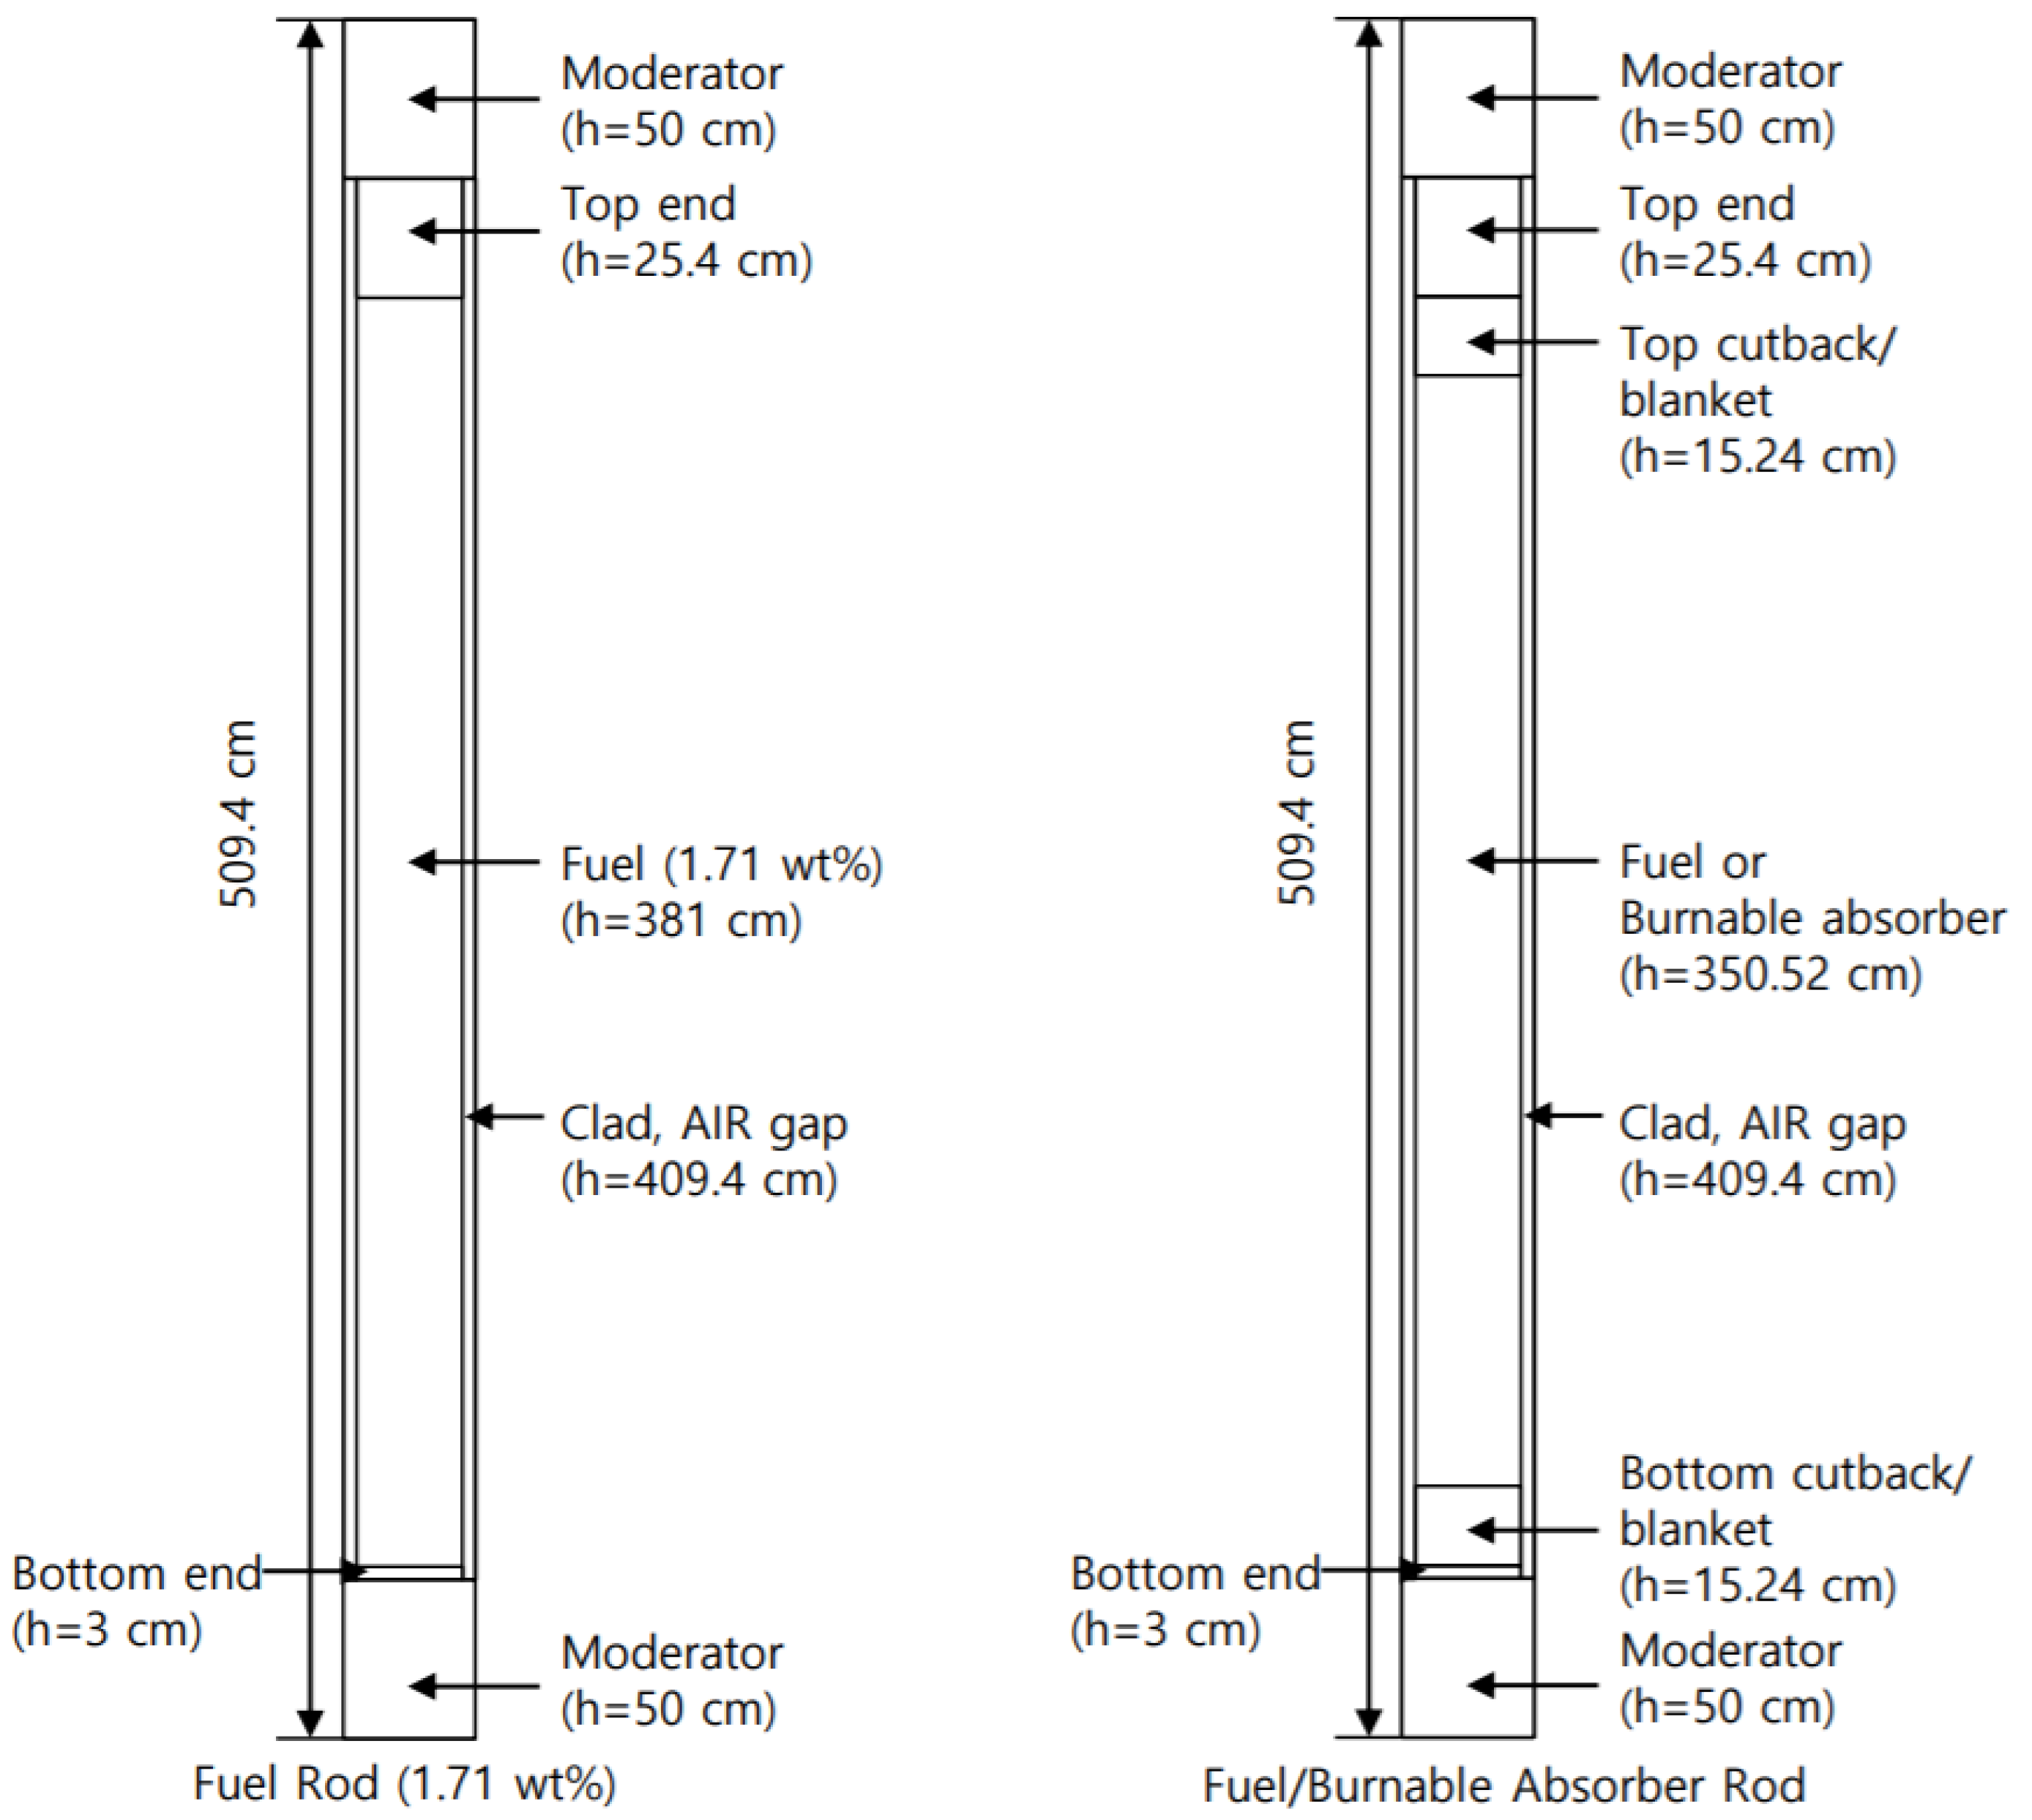
3.1. Single Fuel Pin
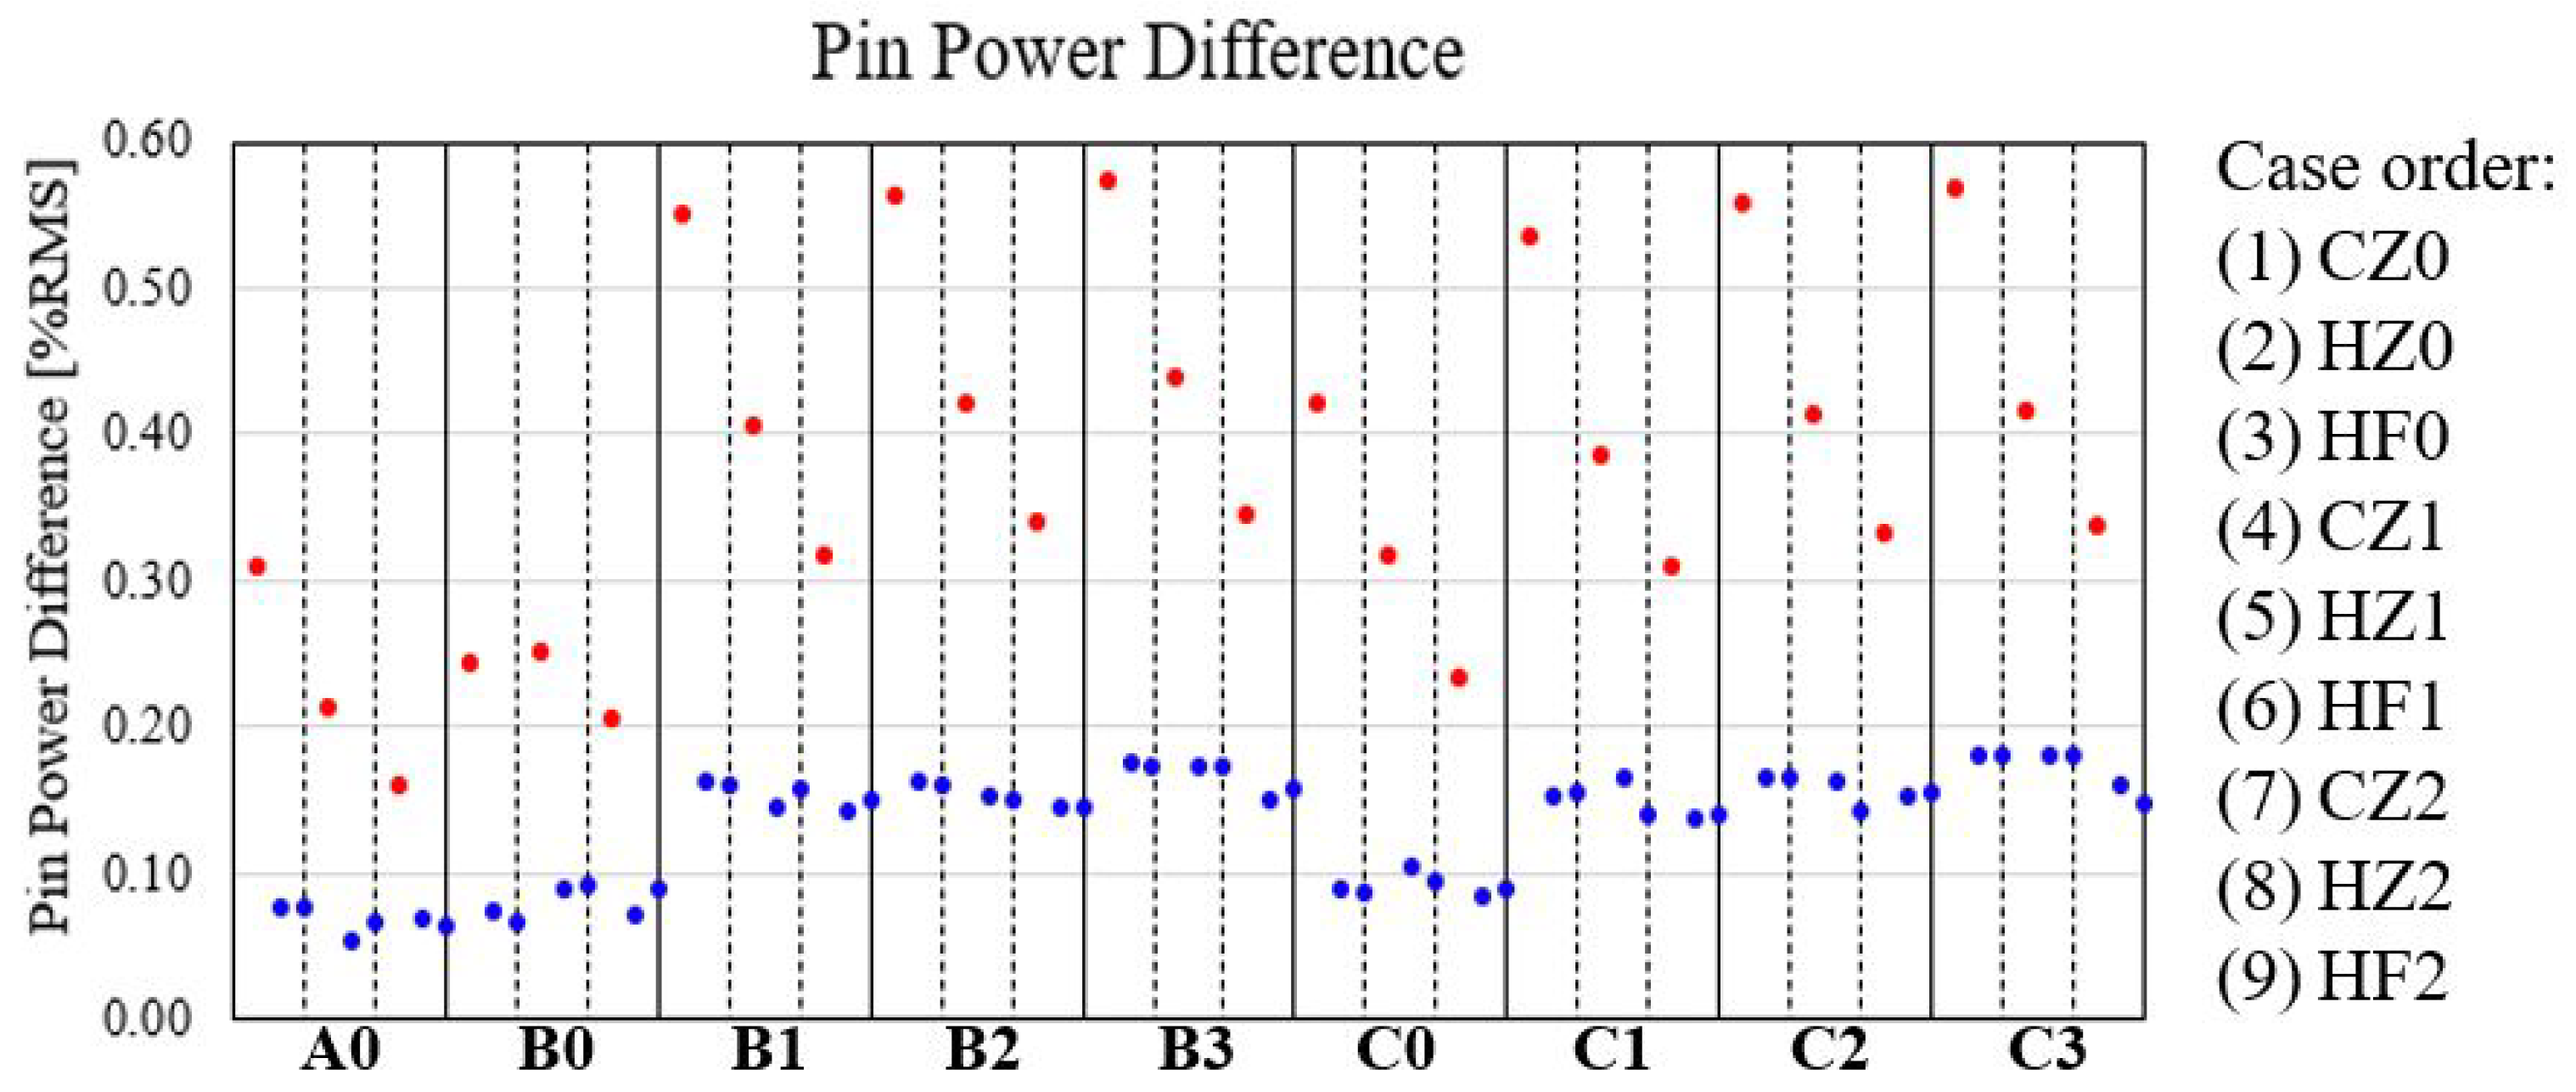
3.1.1. Benchmark Problem Results
3.1.2. MOC Parametric Studies
3.1.3. Spatial Mesh Parametric Studies
3.1.4. Moderator Mesh Parametric Studies
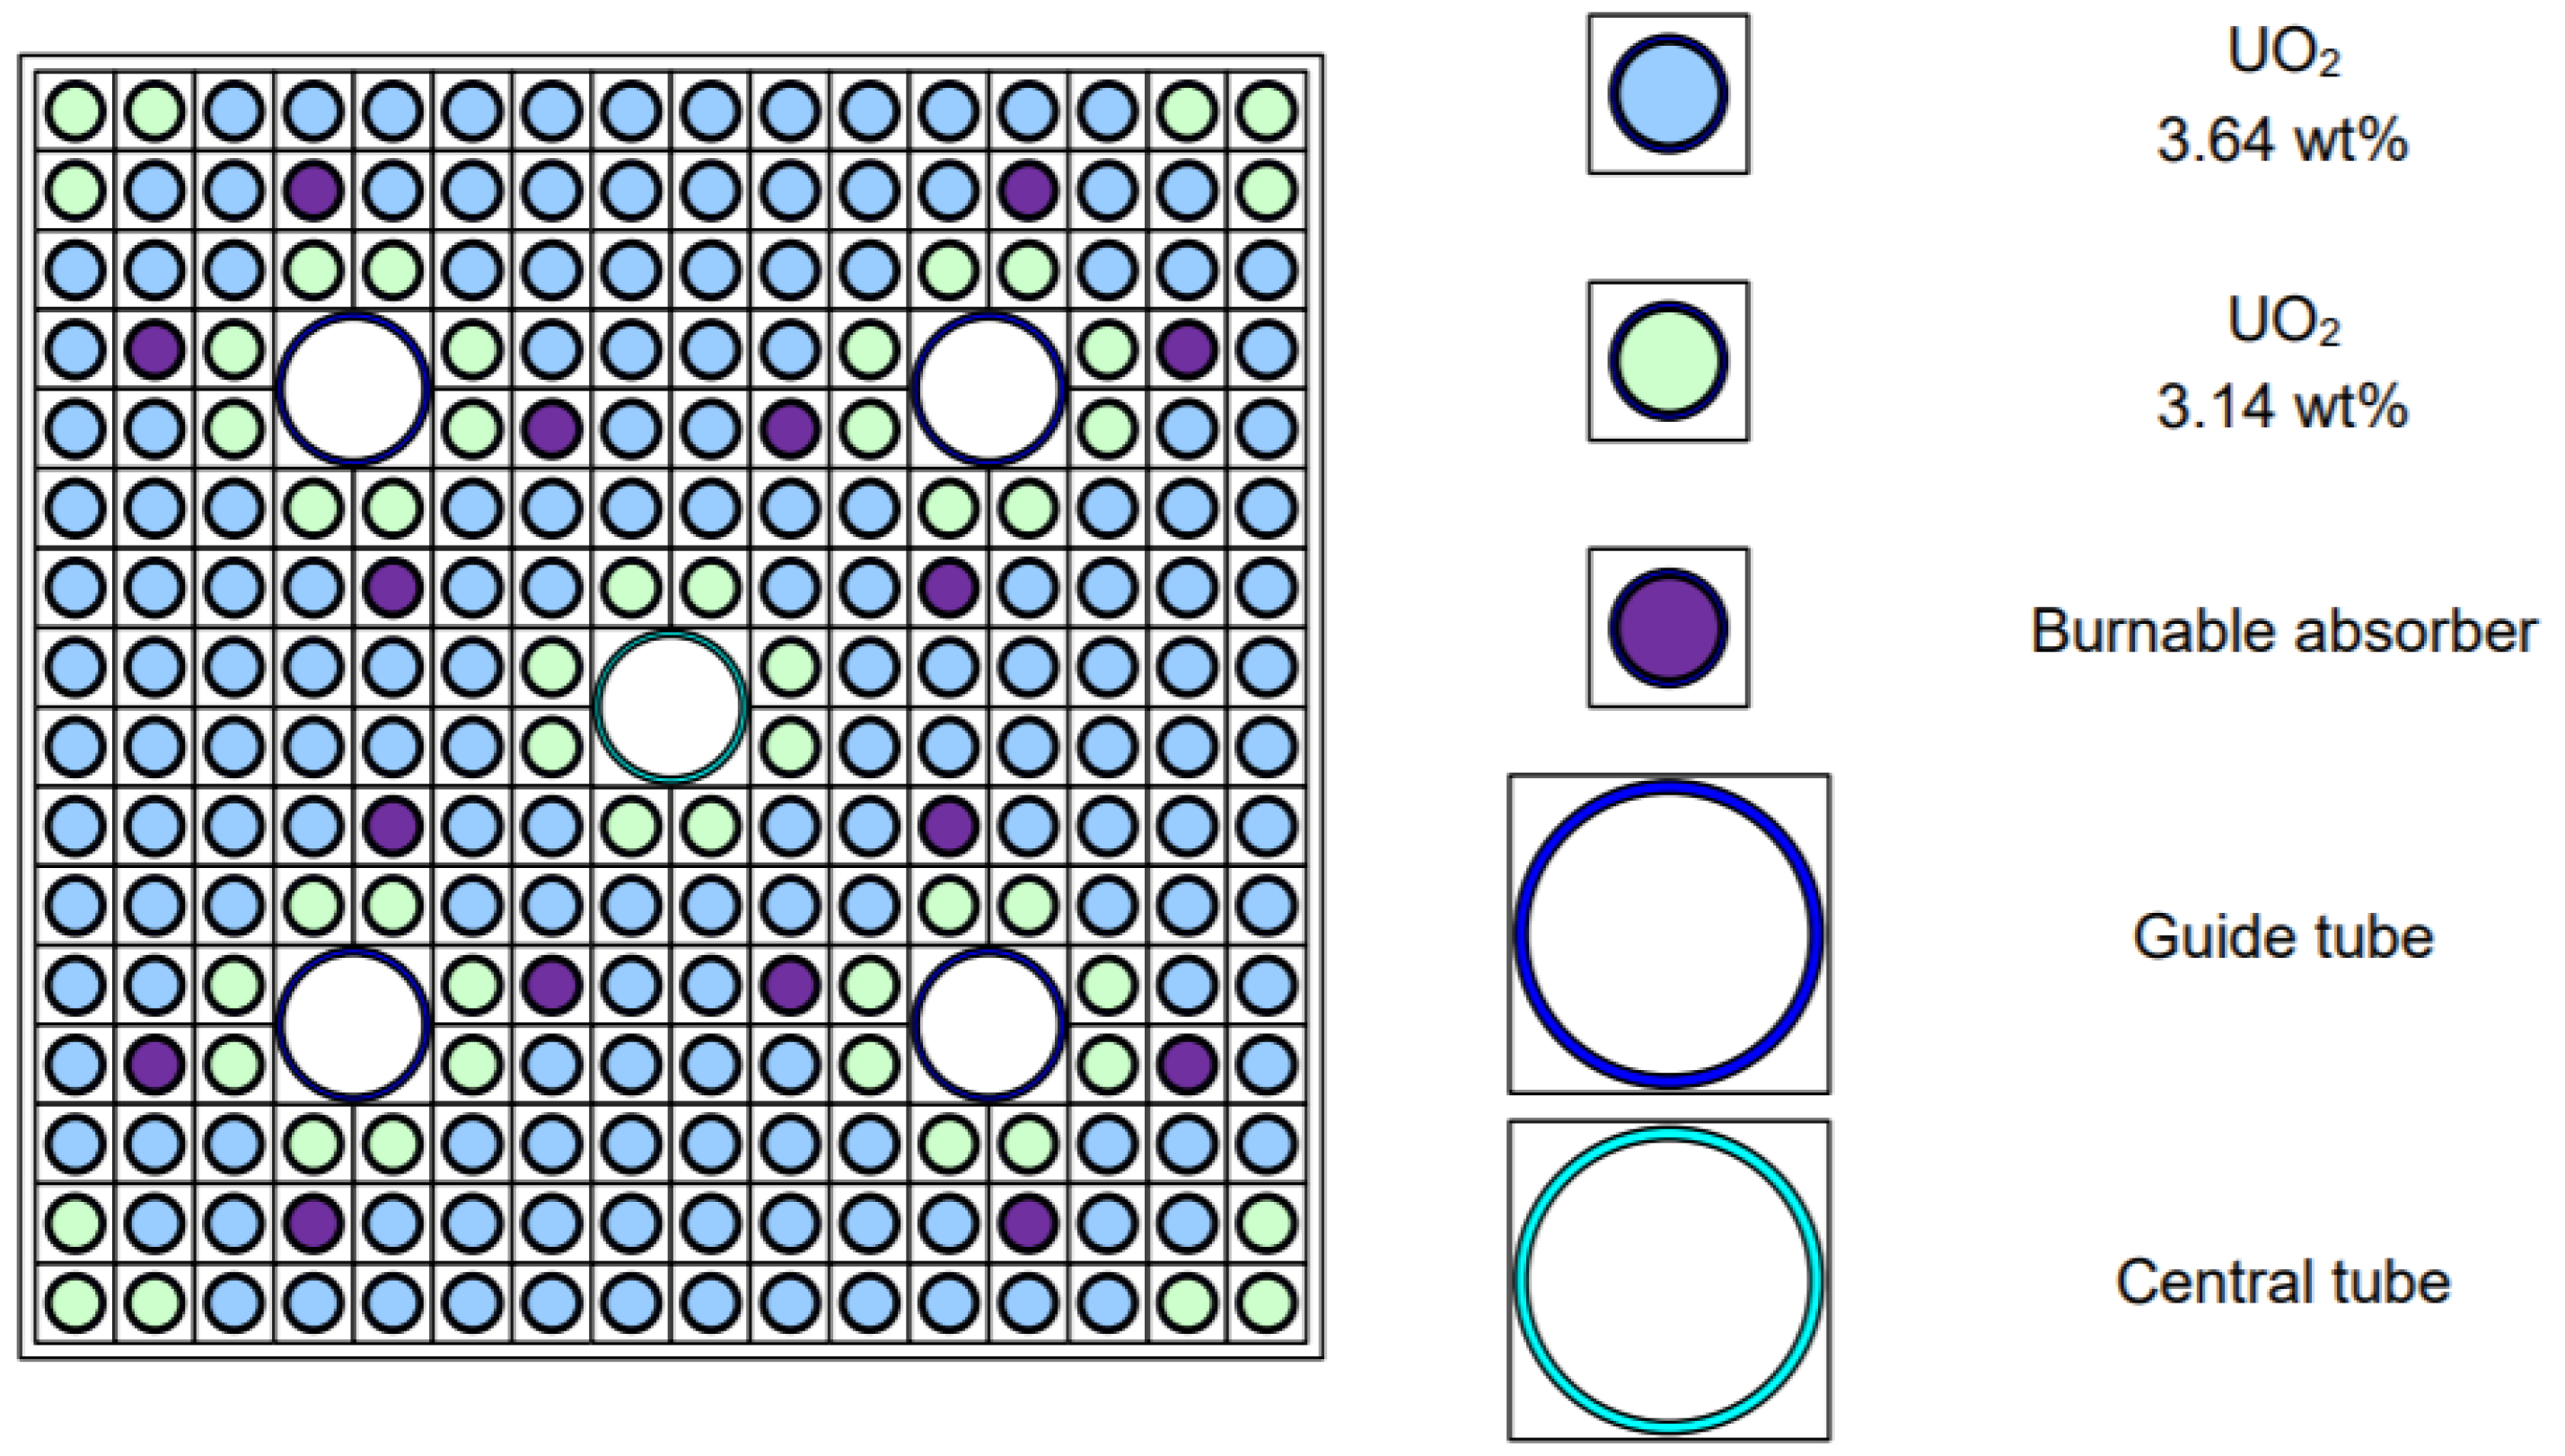
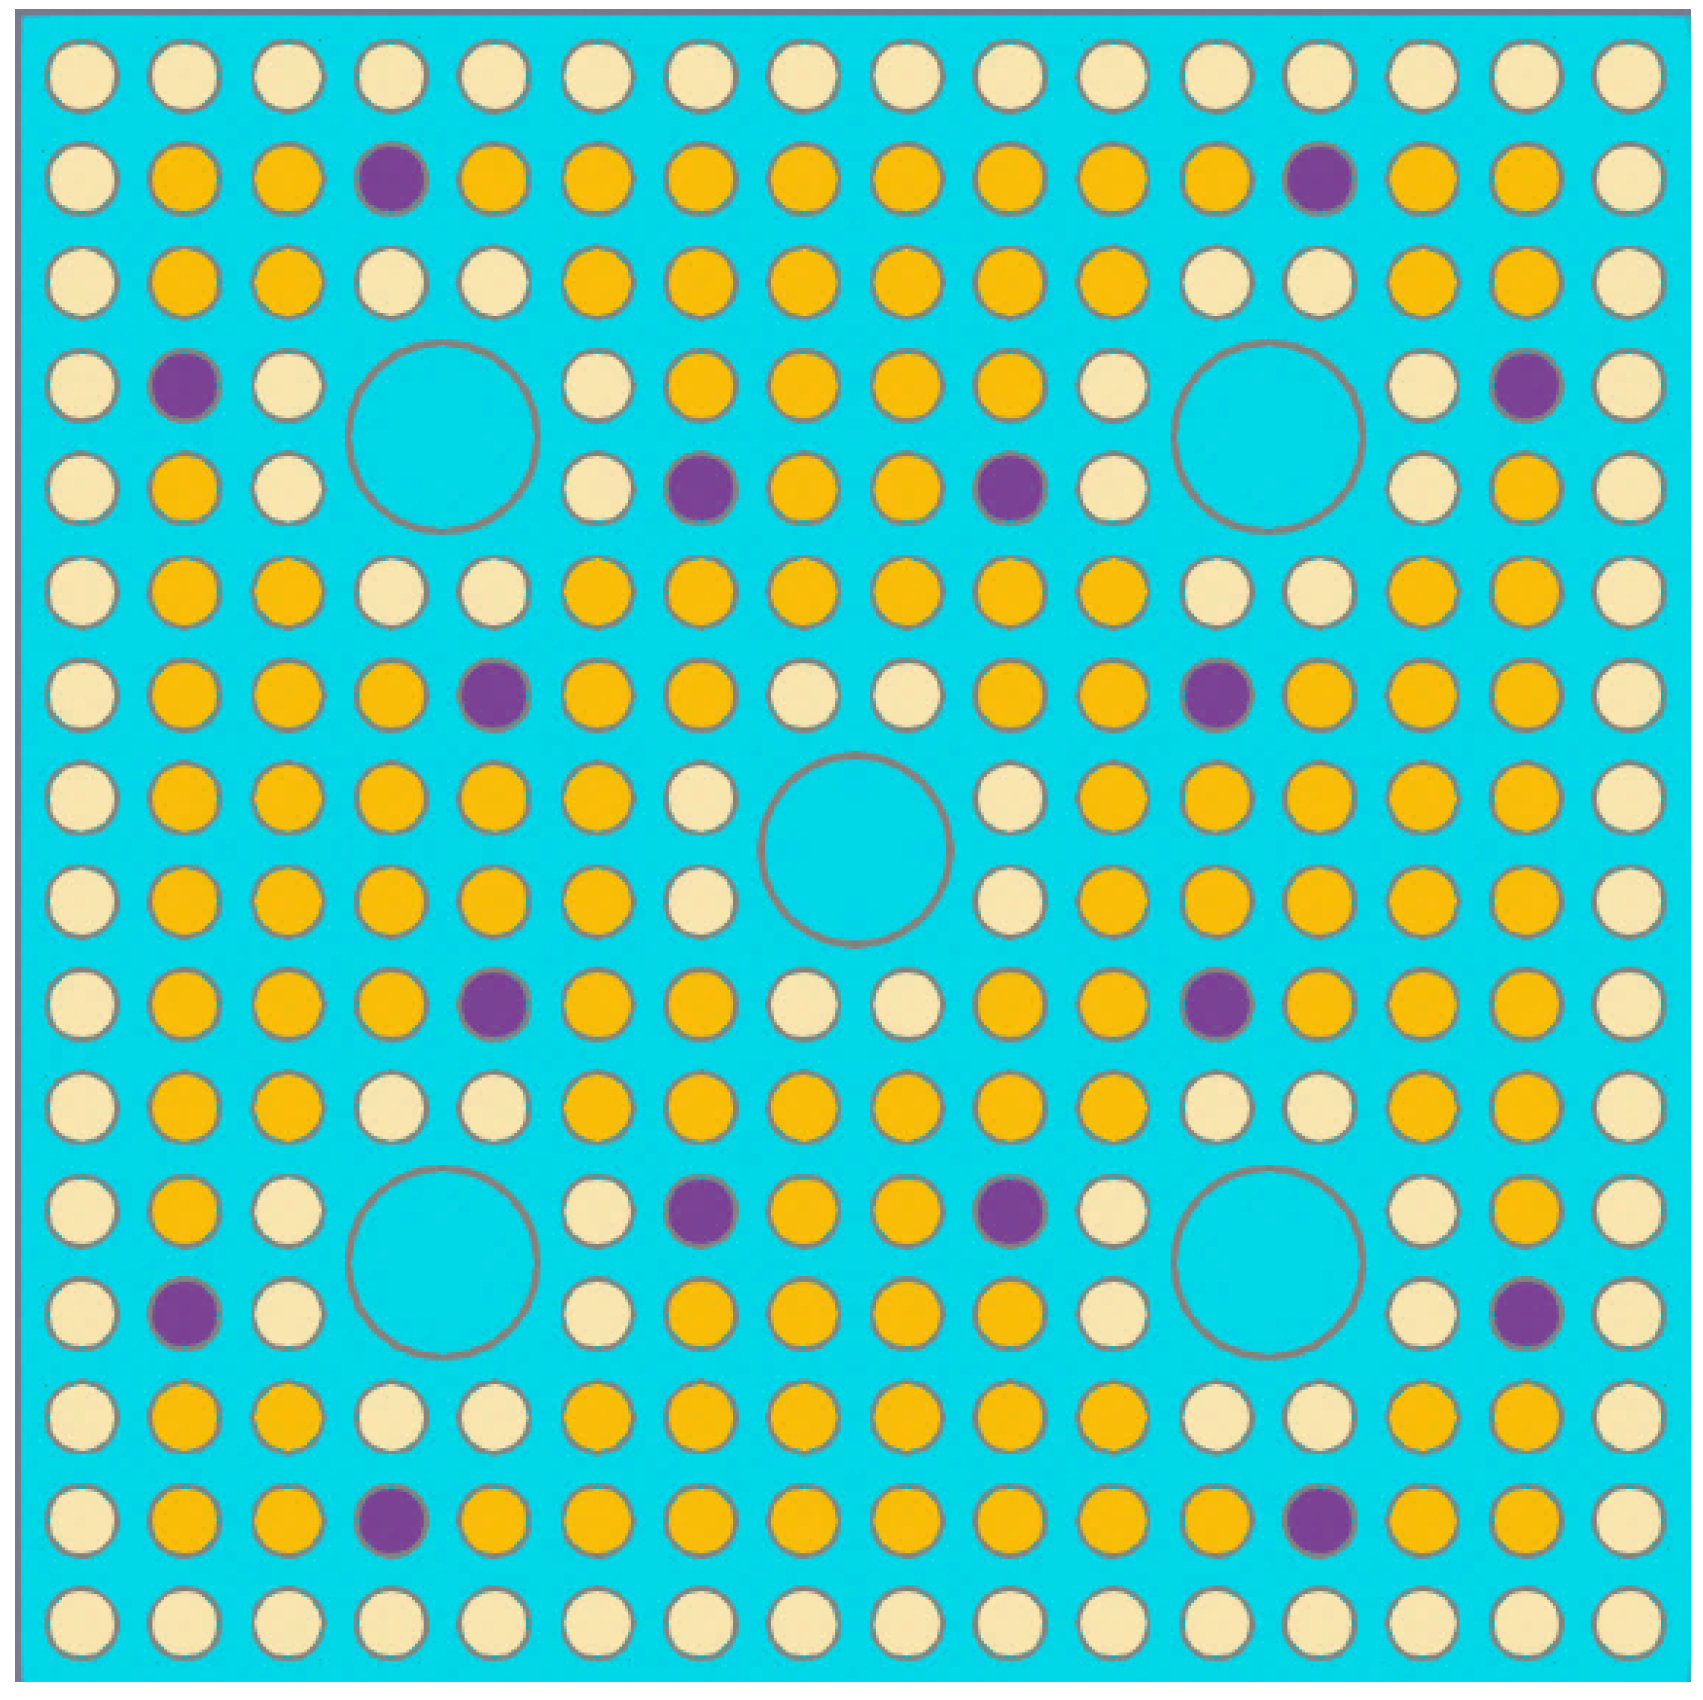
3.2. Single 2-D Assembly
3.2.1. Benchmark Problem Results
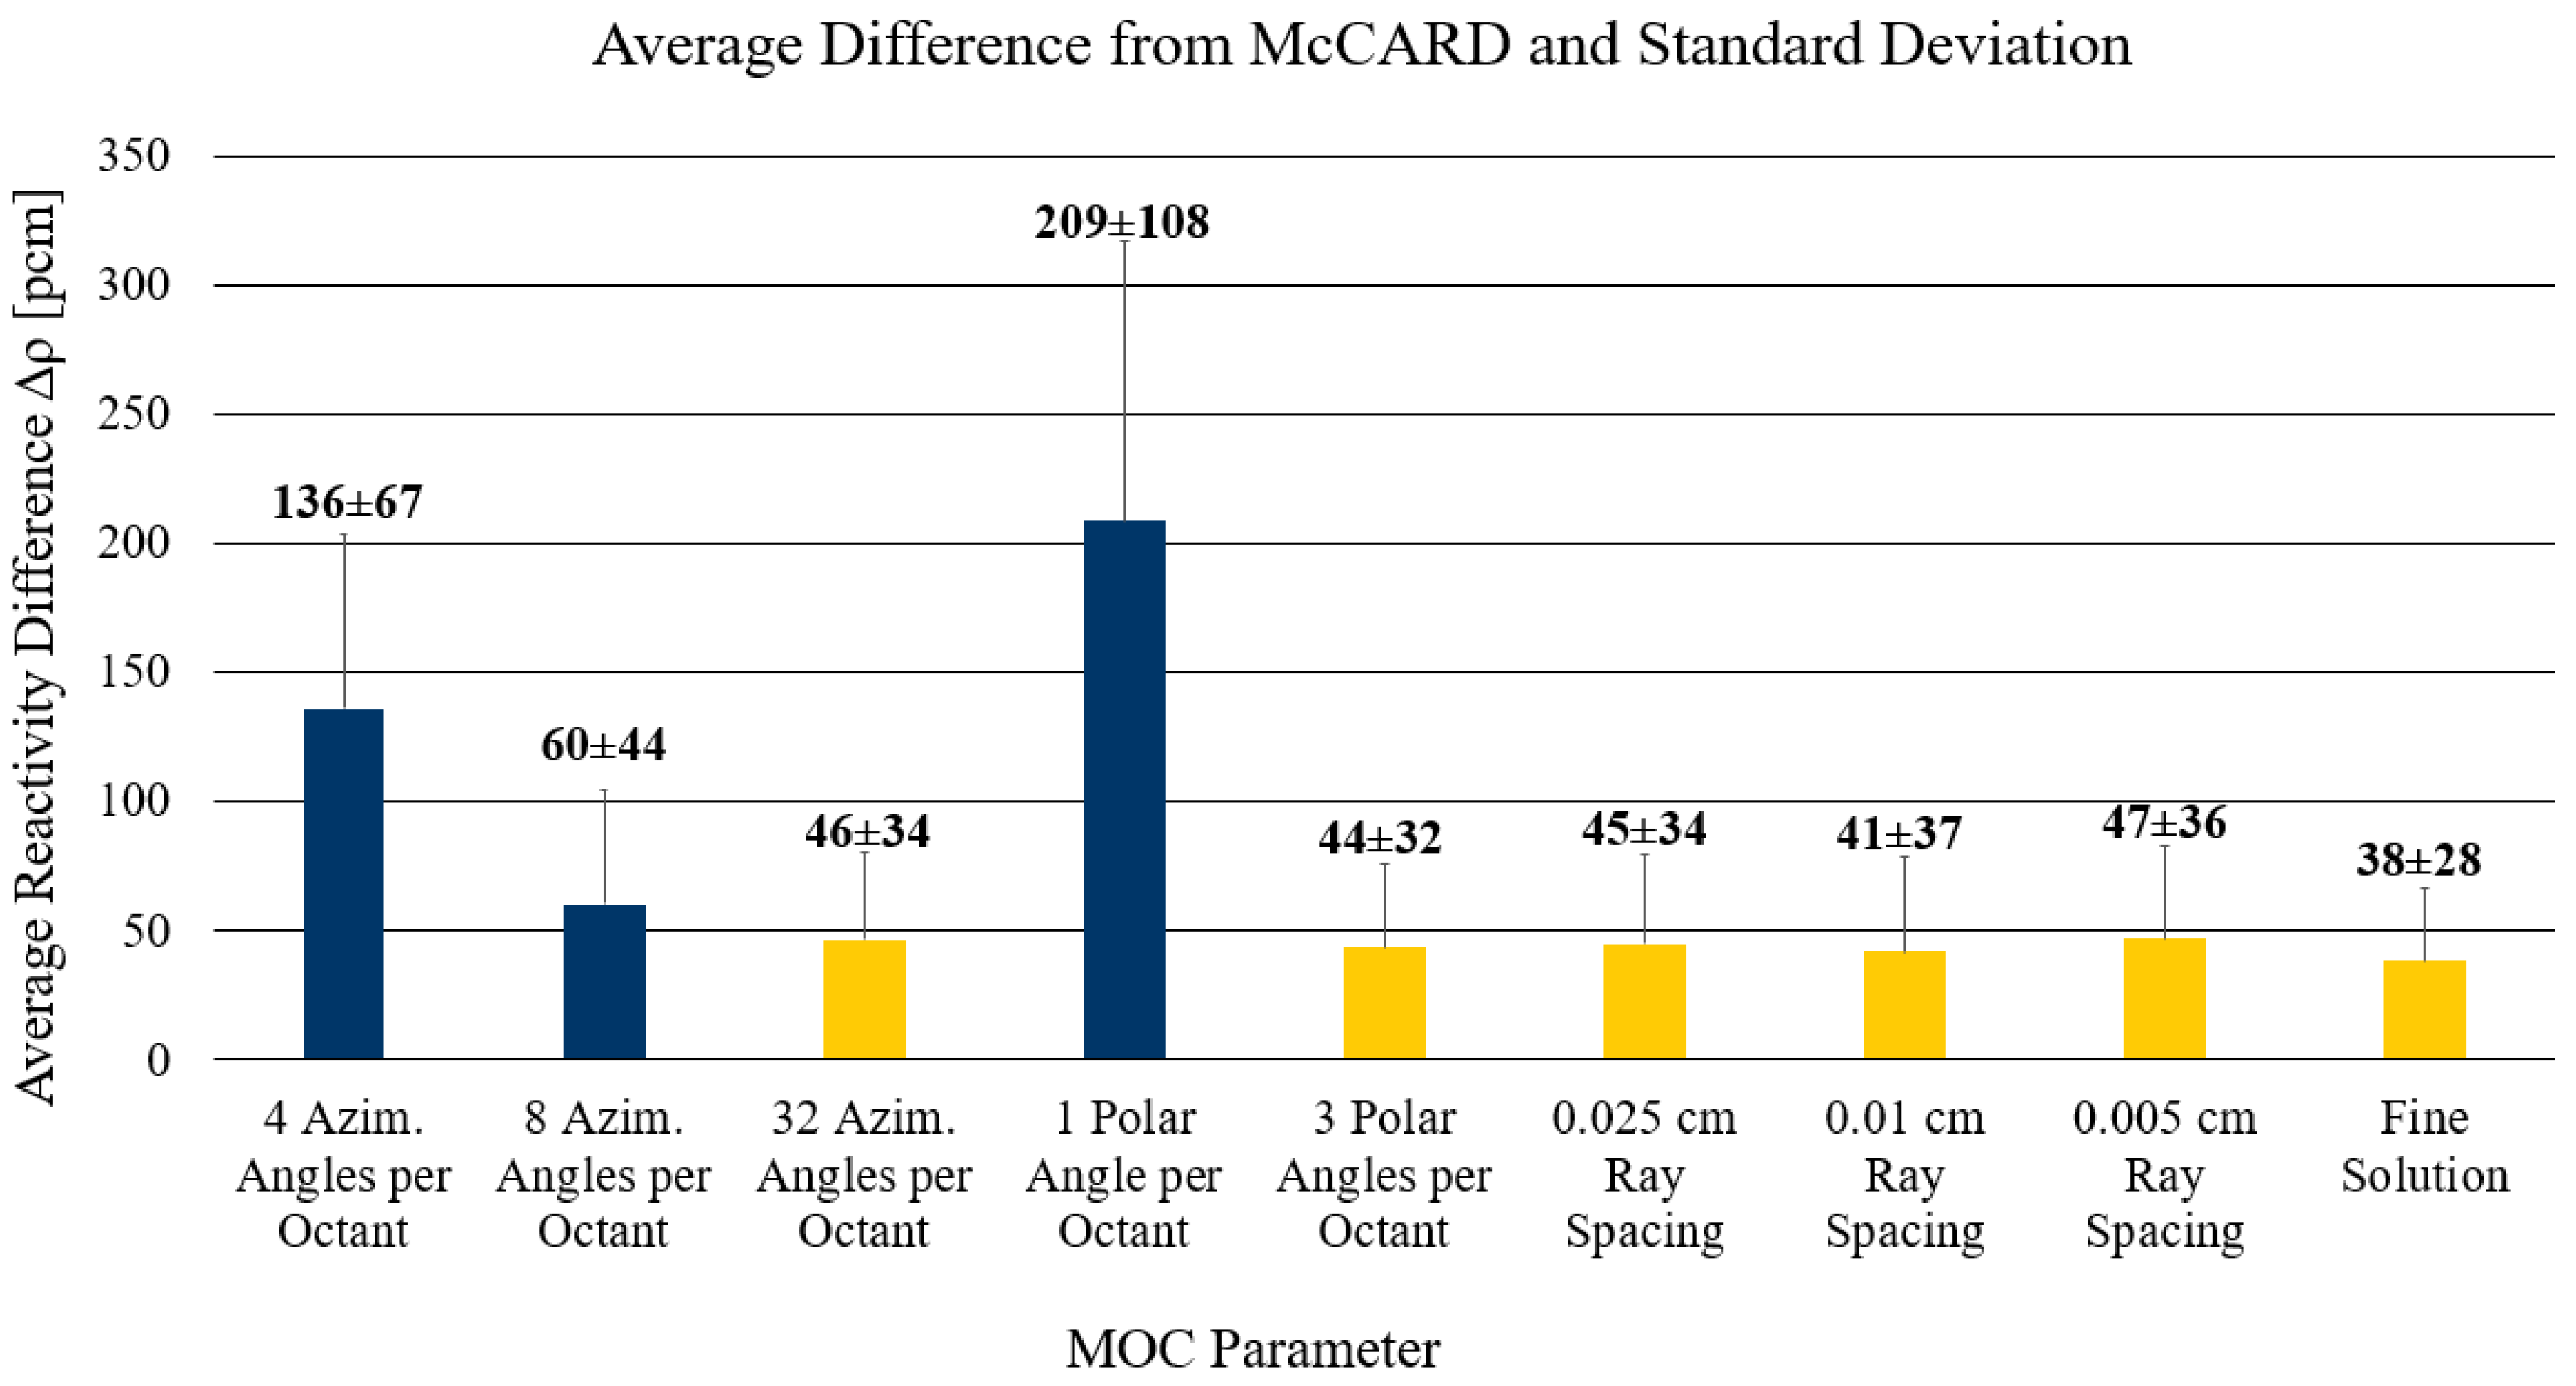
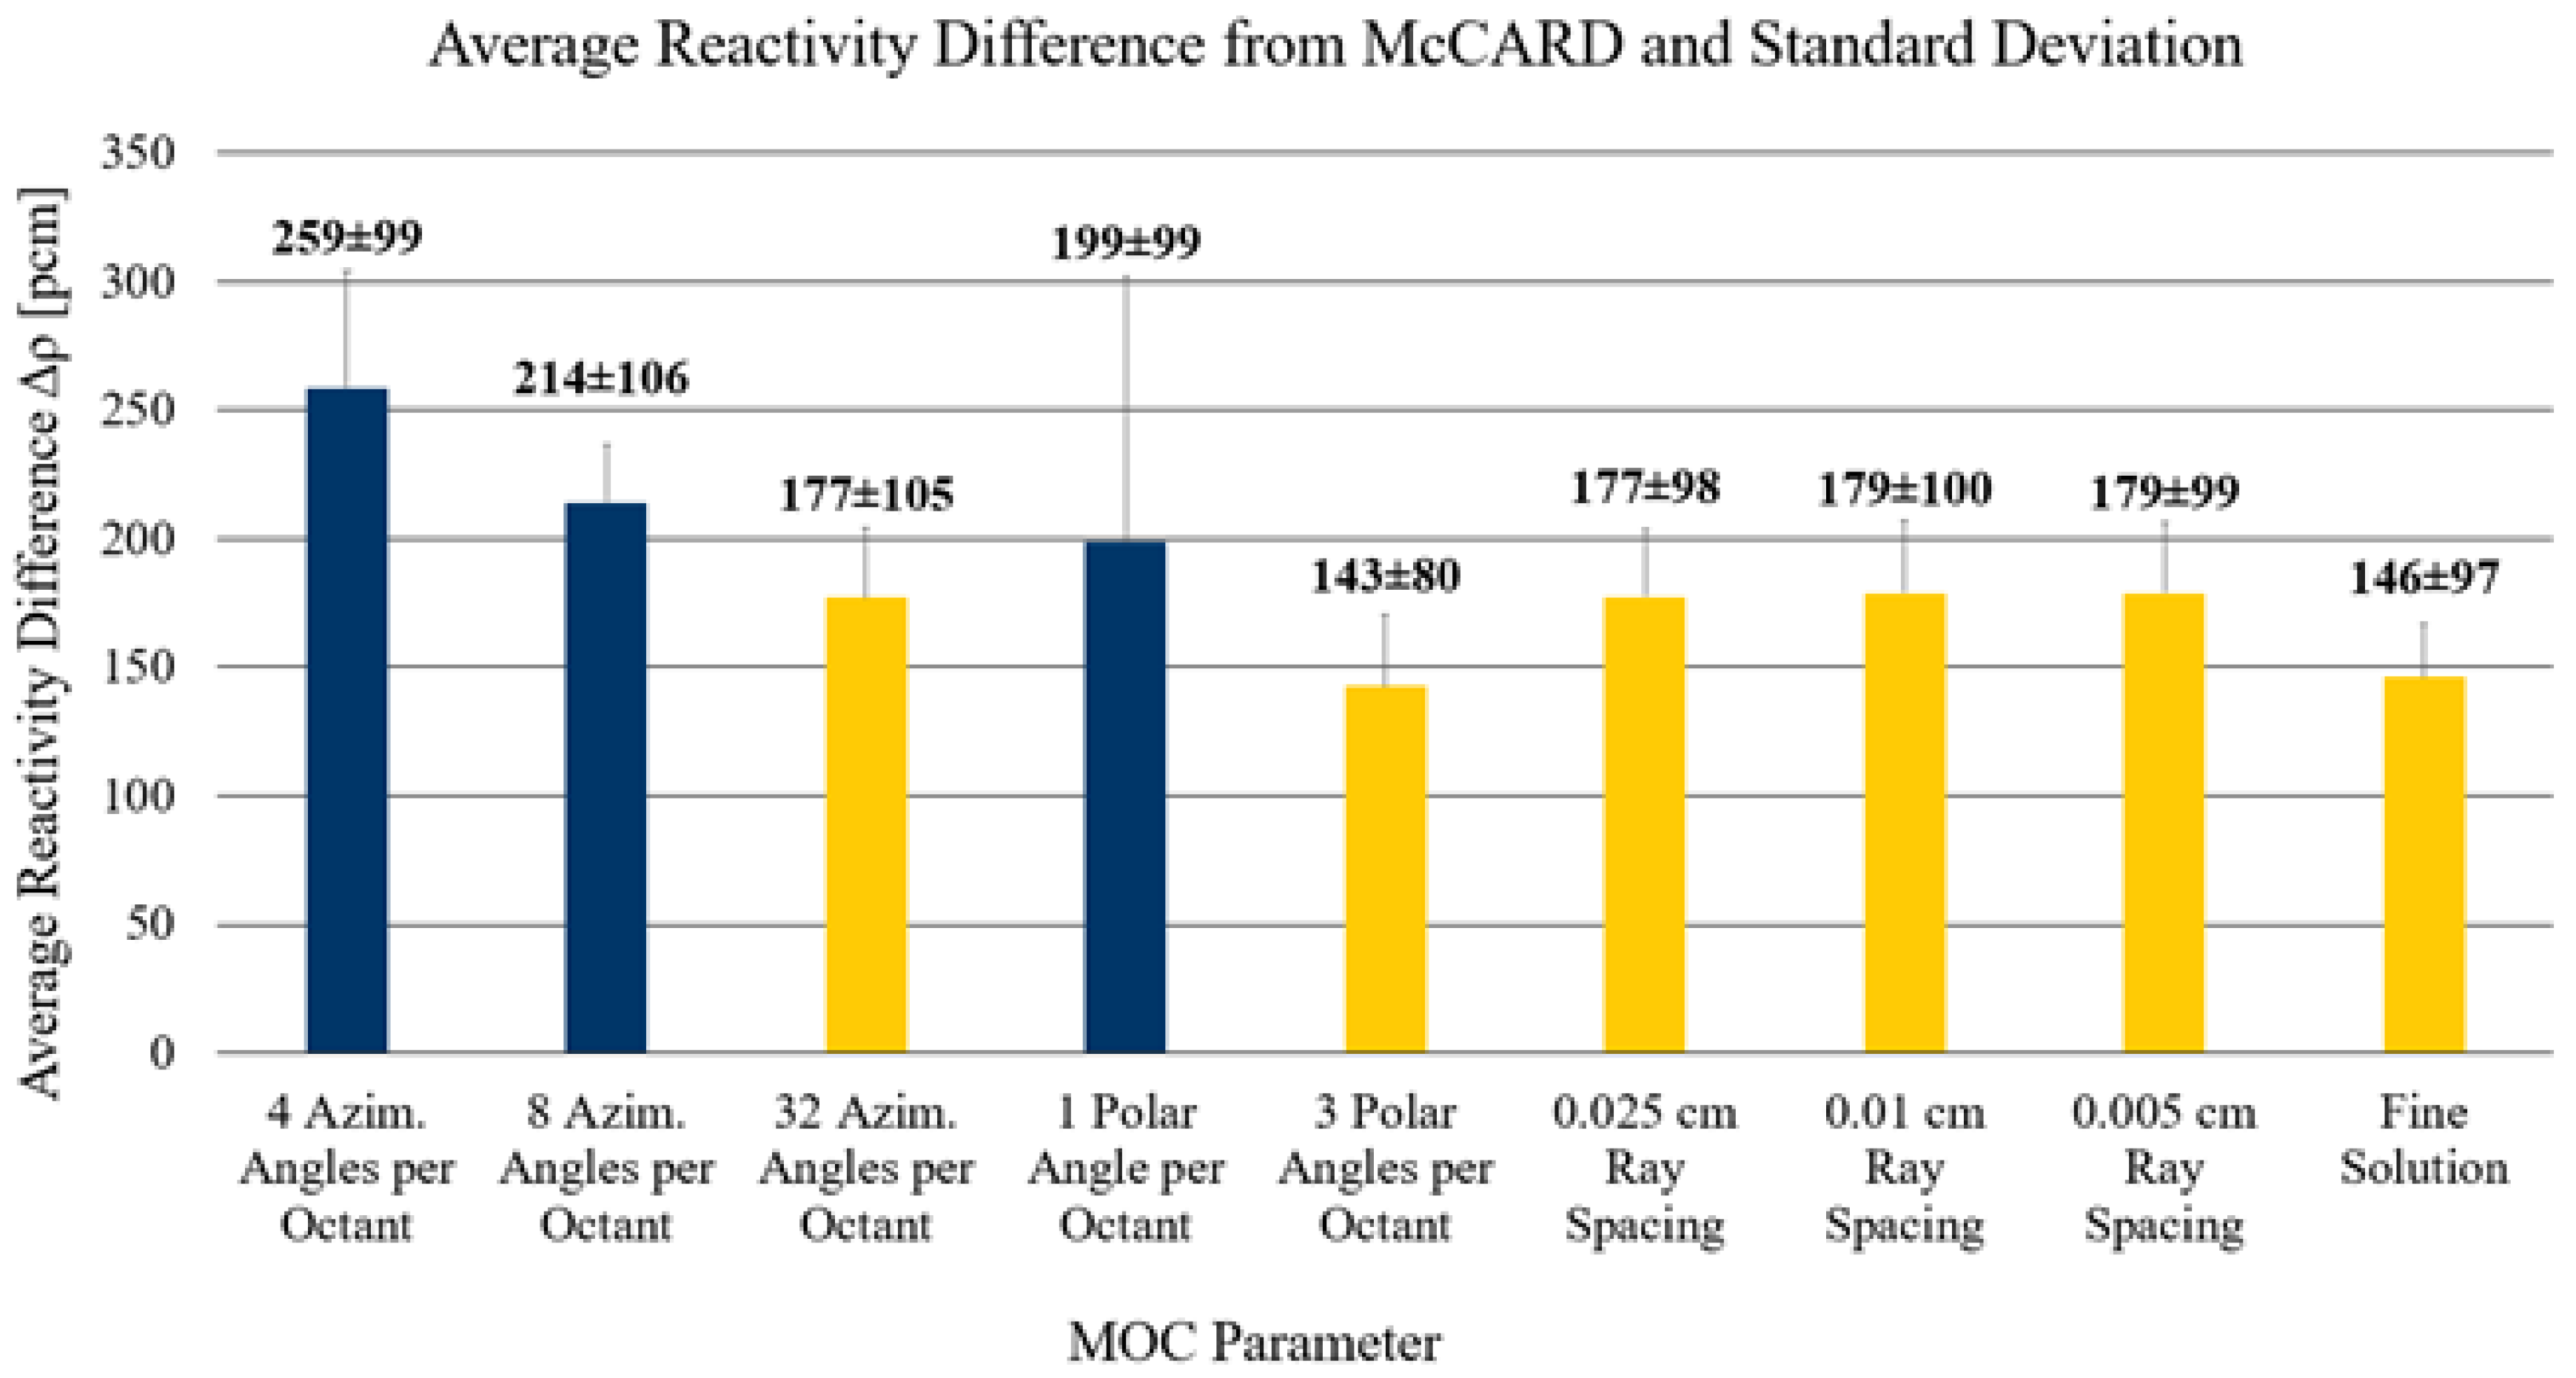
3.2.2. MOC Parametric Studies
3.2.3. Spatial Mesh Parametric Studies
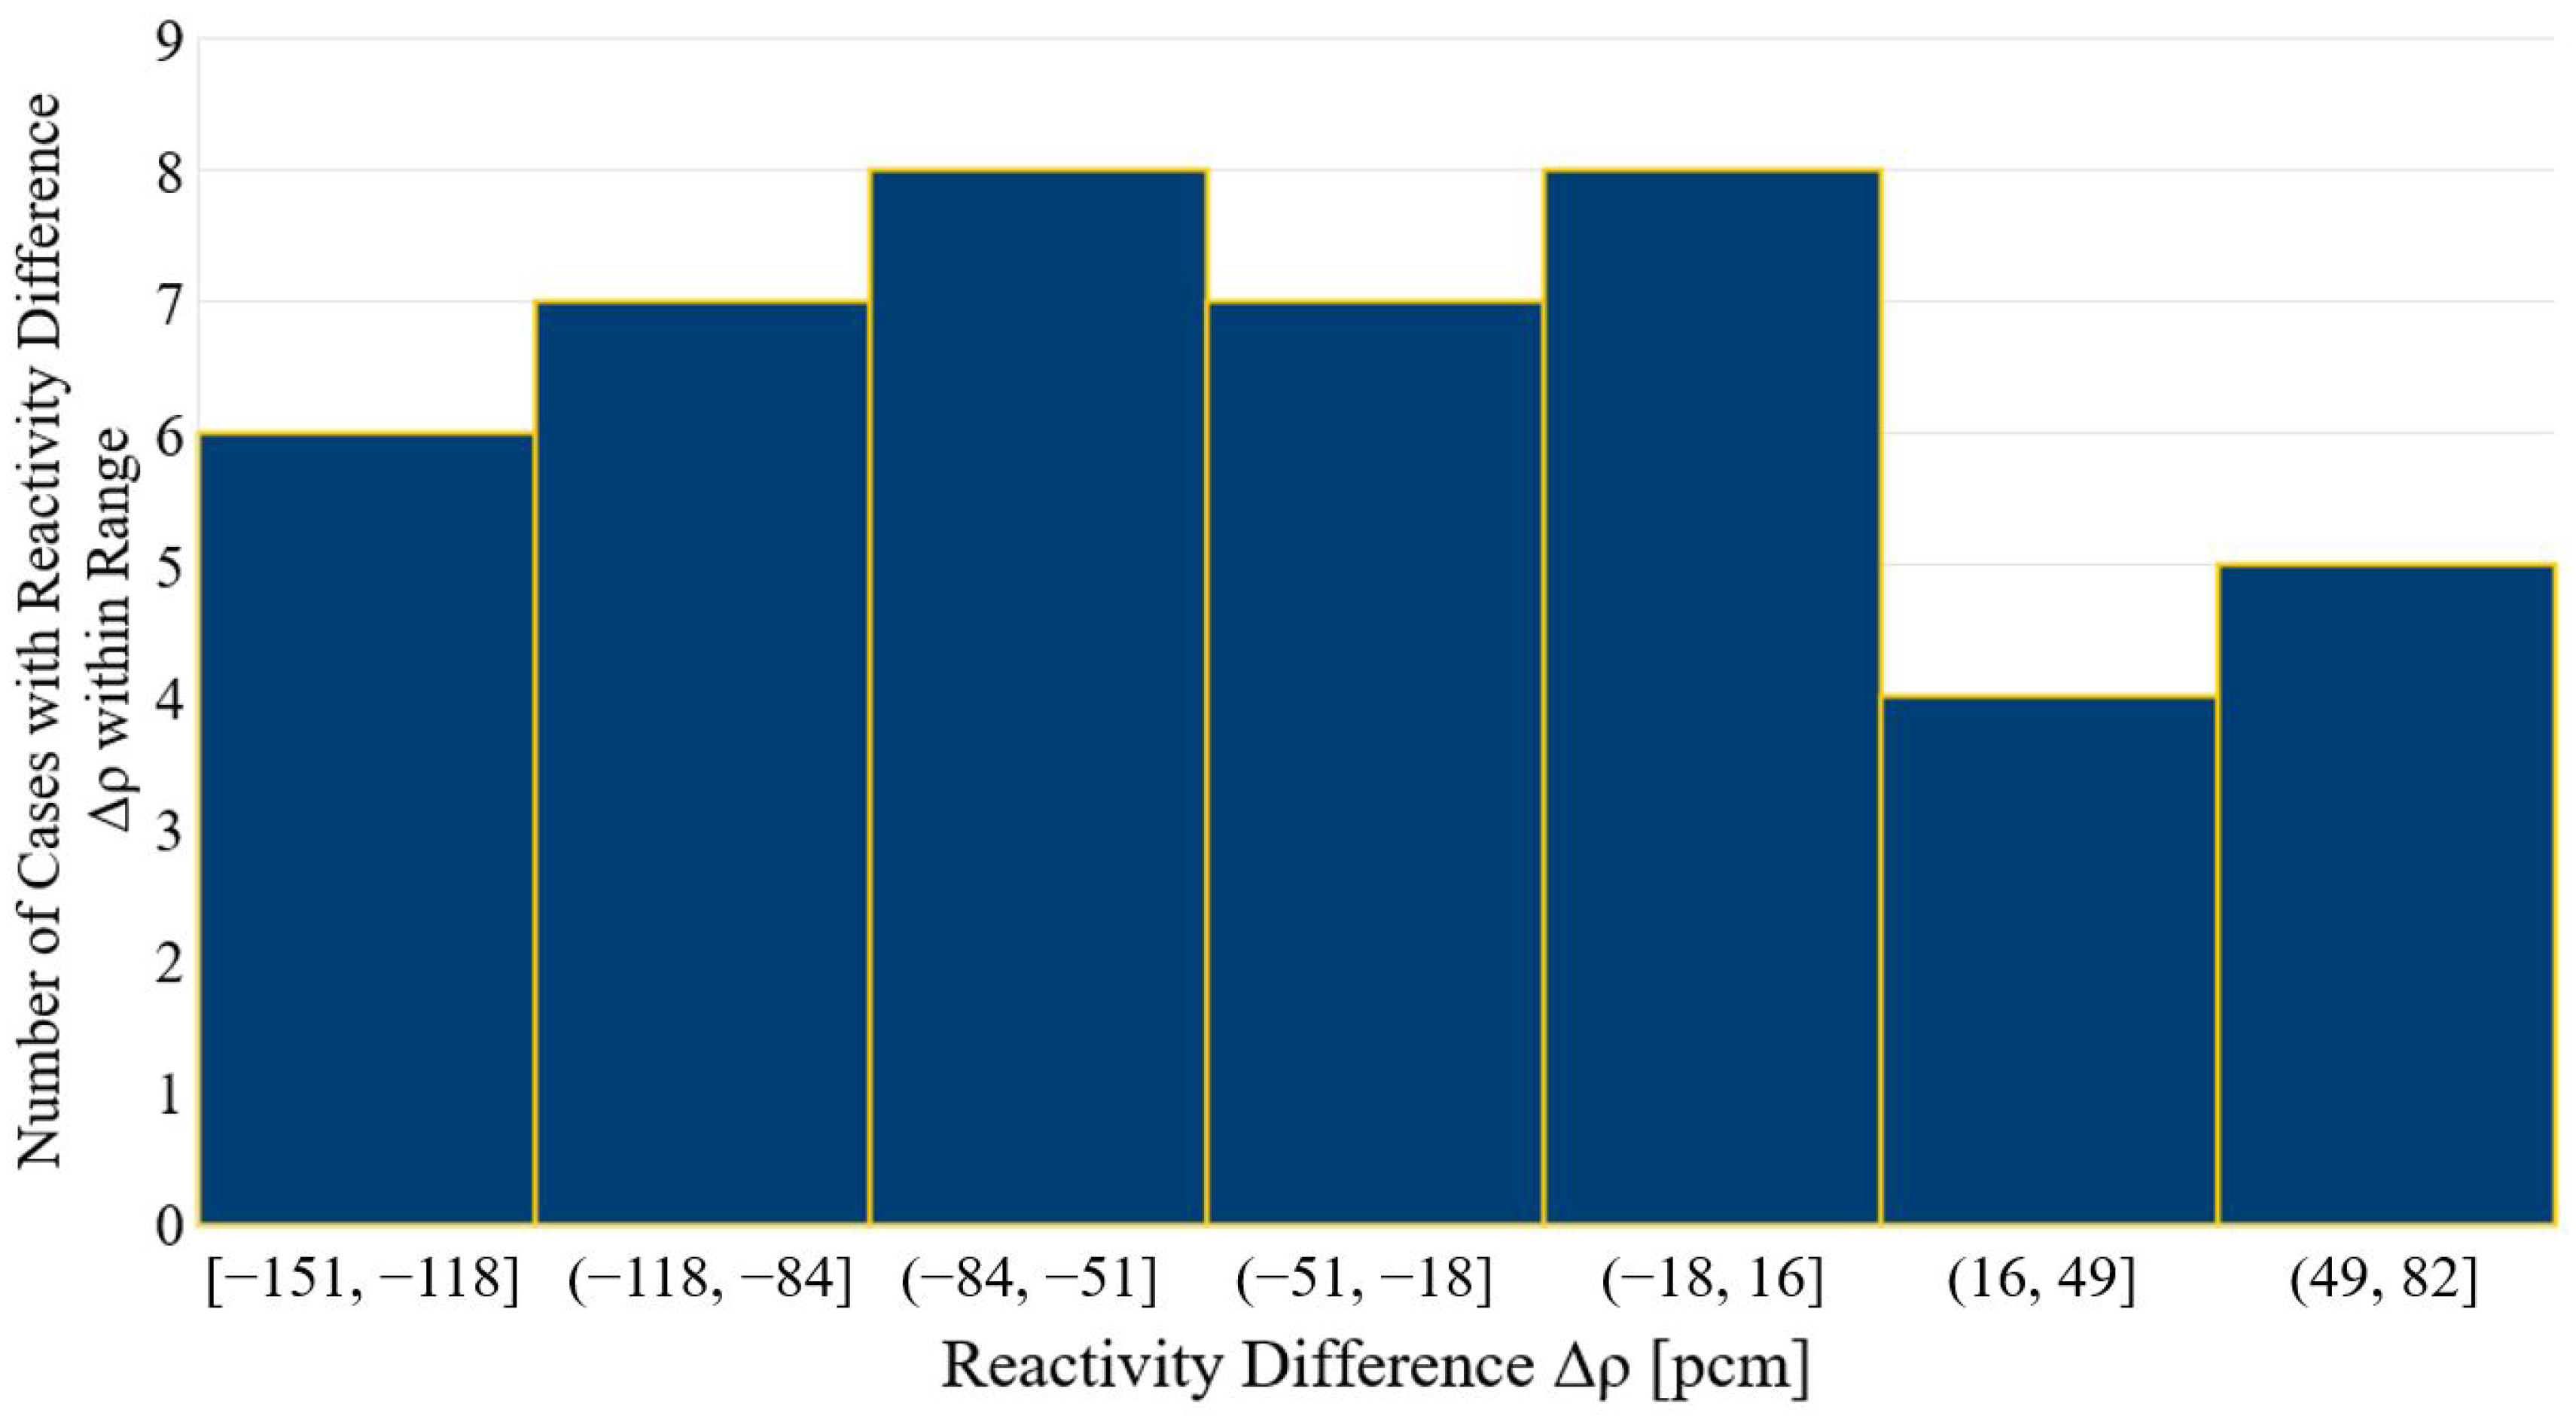
3.2.4. Comparison of 2-D Assembly MPACT “Fine” Solution to McCARD
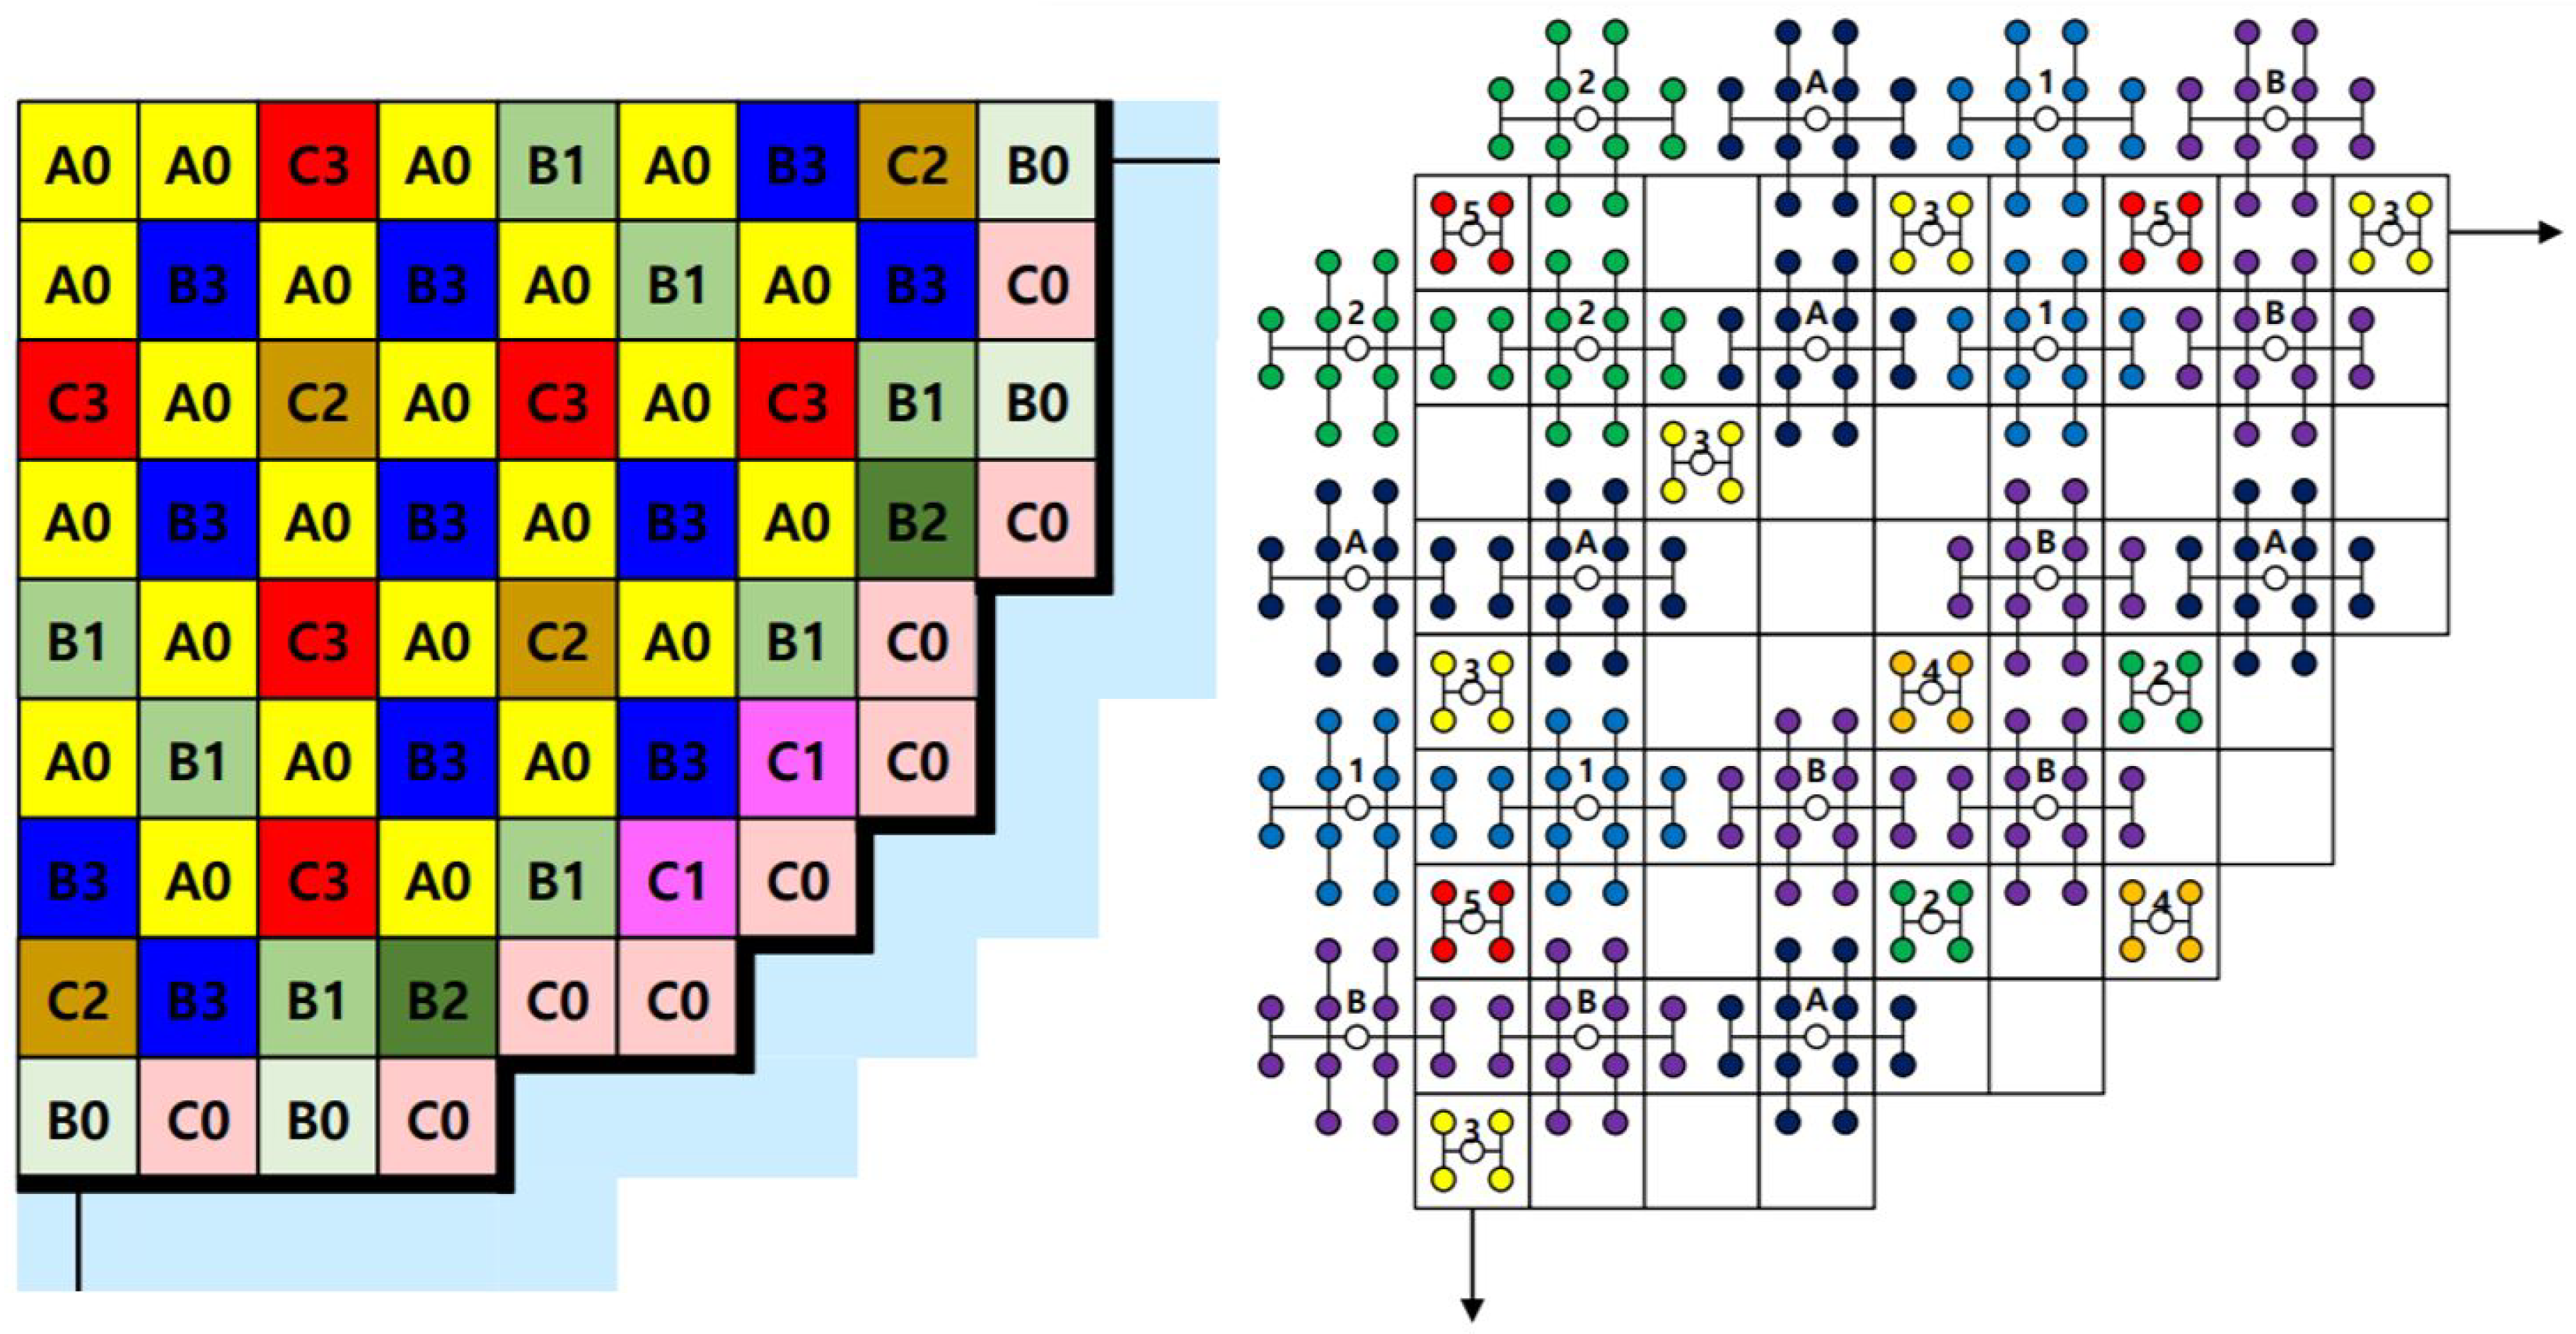
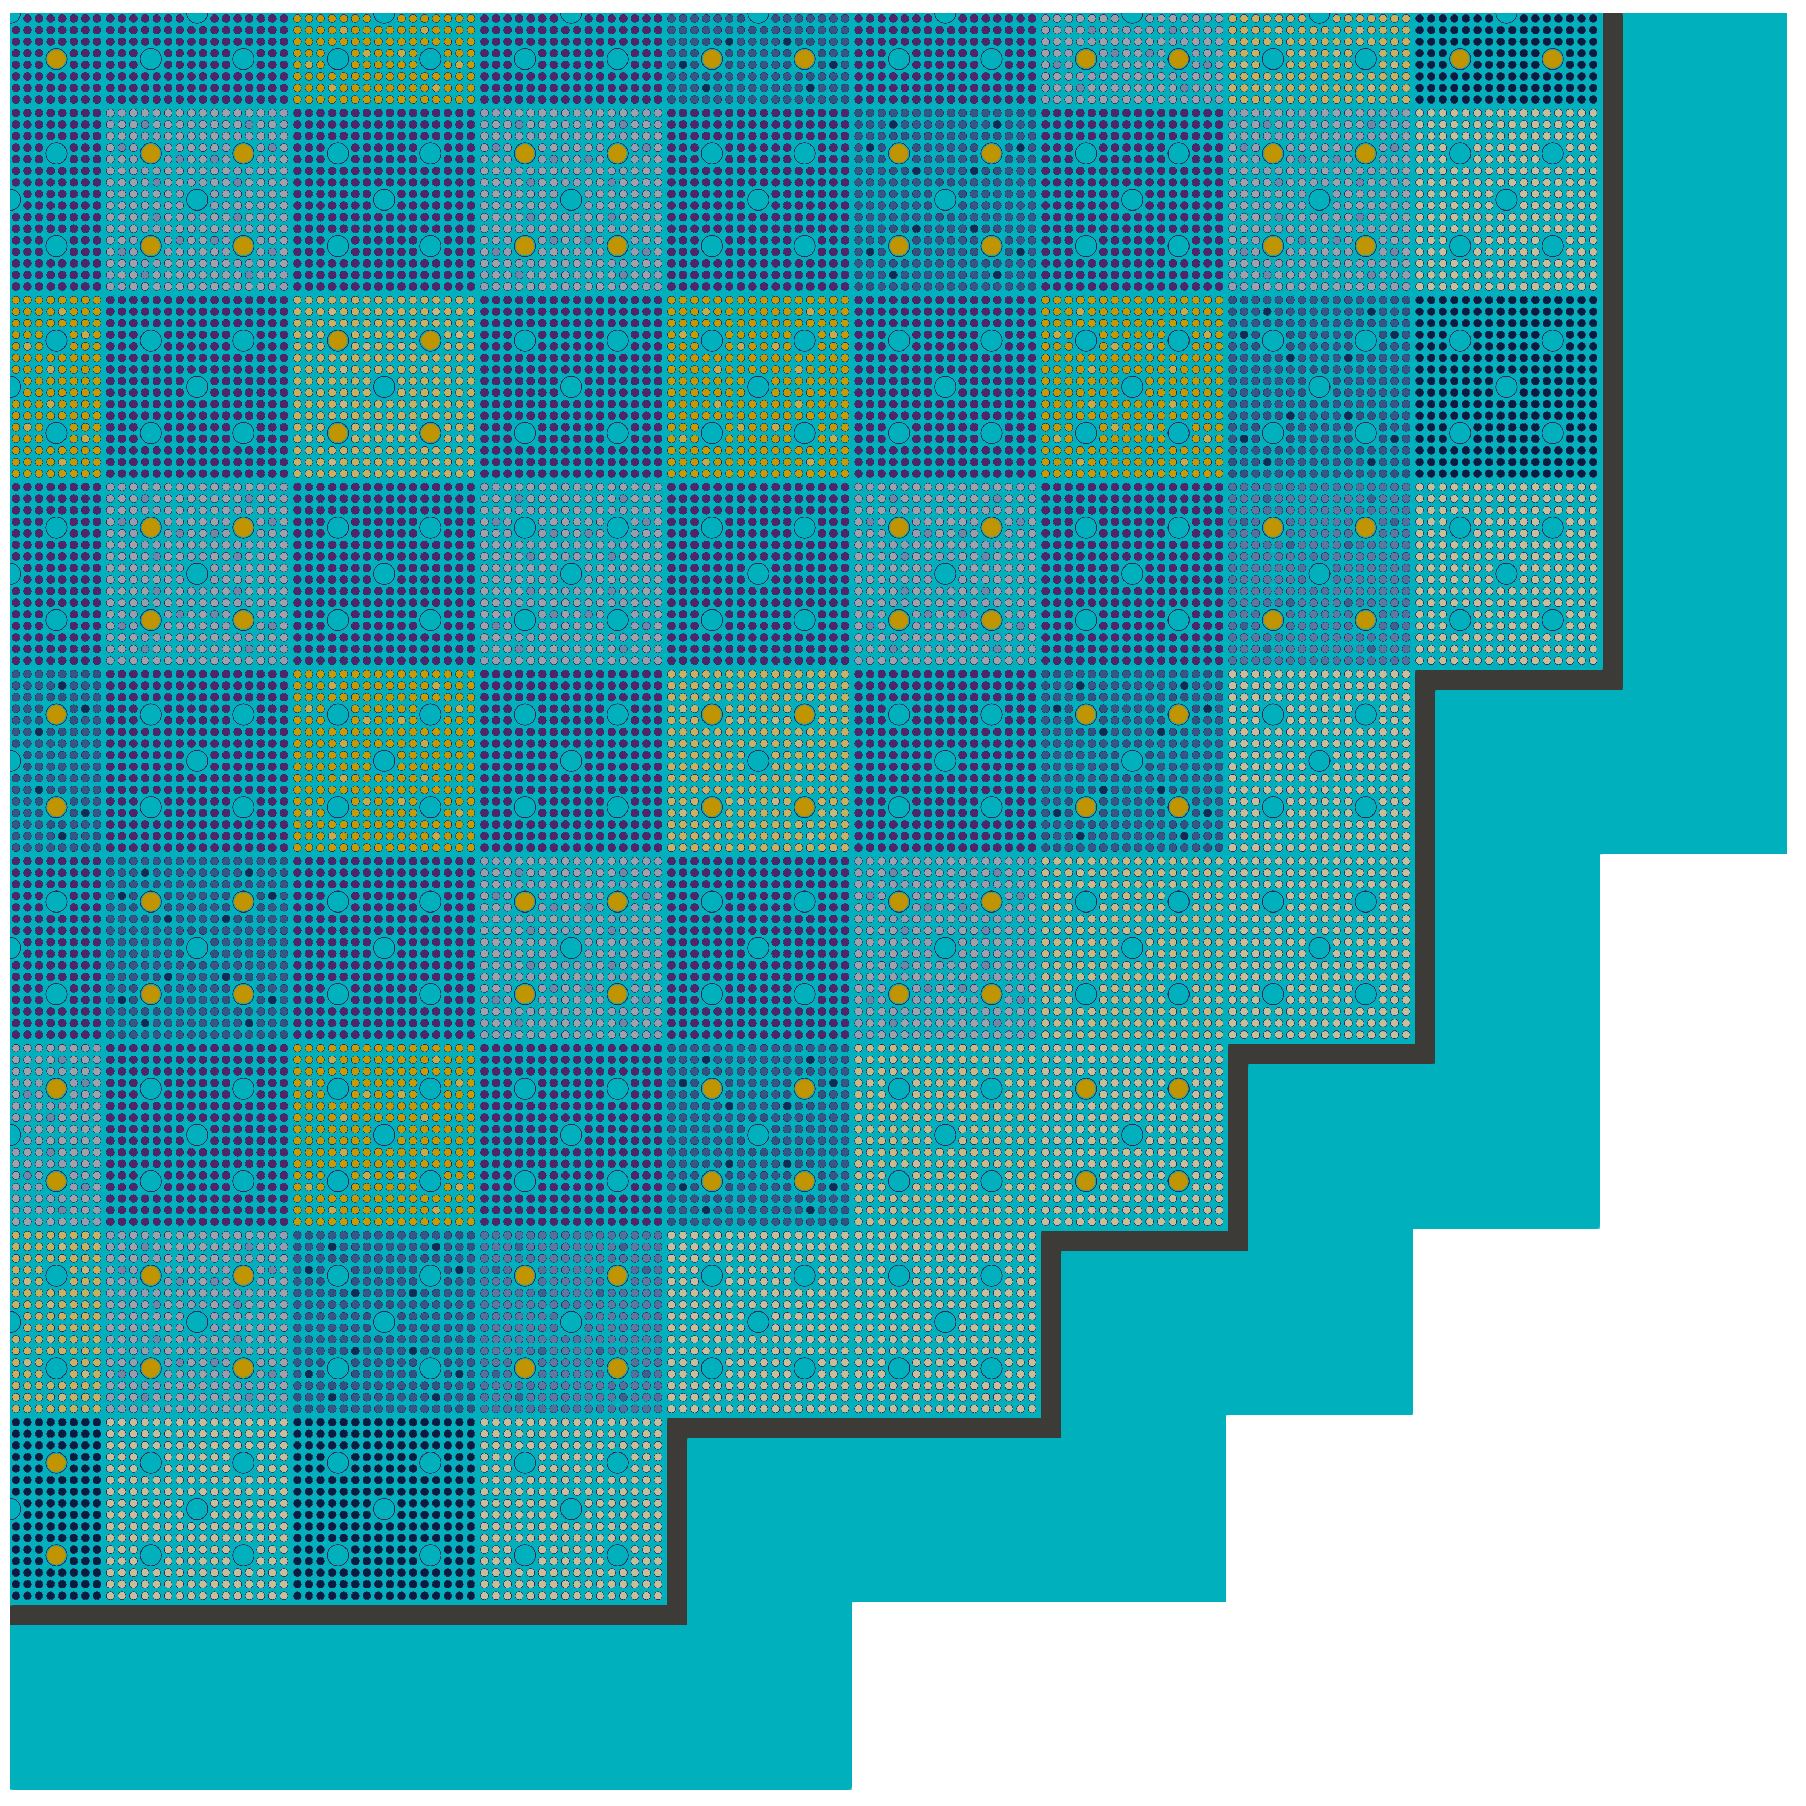
3.3. 2-D Core
3.3.1. In-Out Tilt with TCP Scattering
3.3.2. Results Generated Using P Scattering
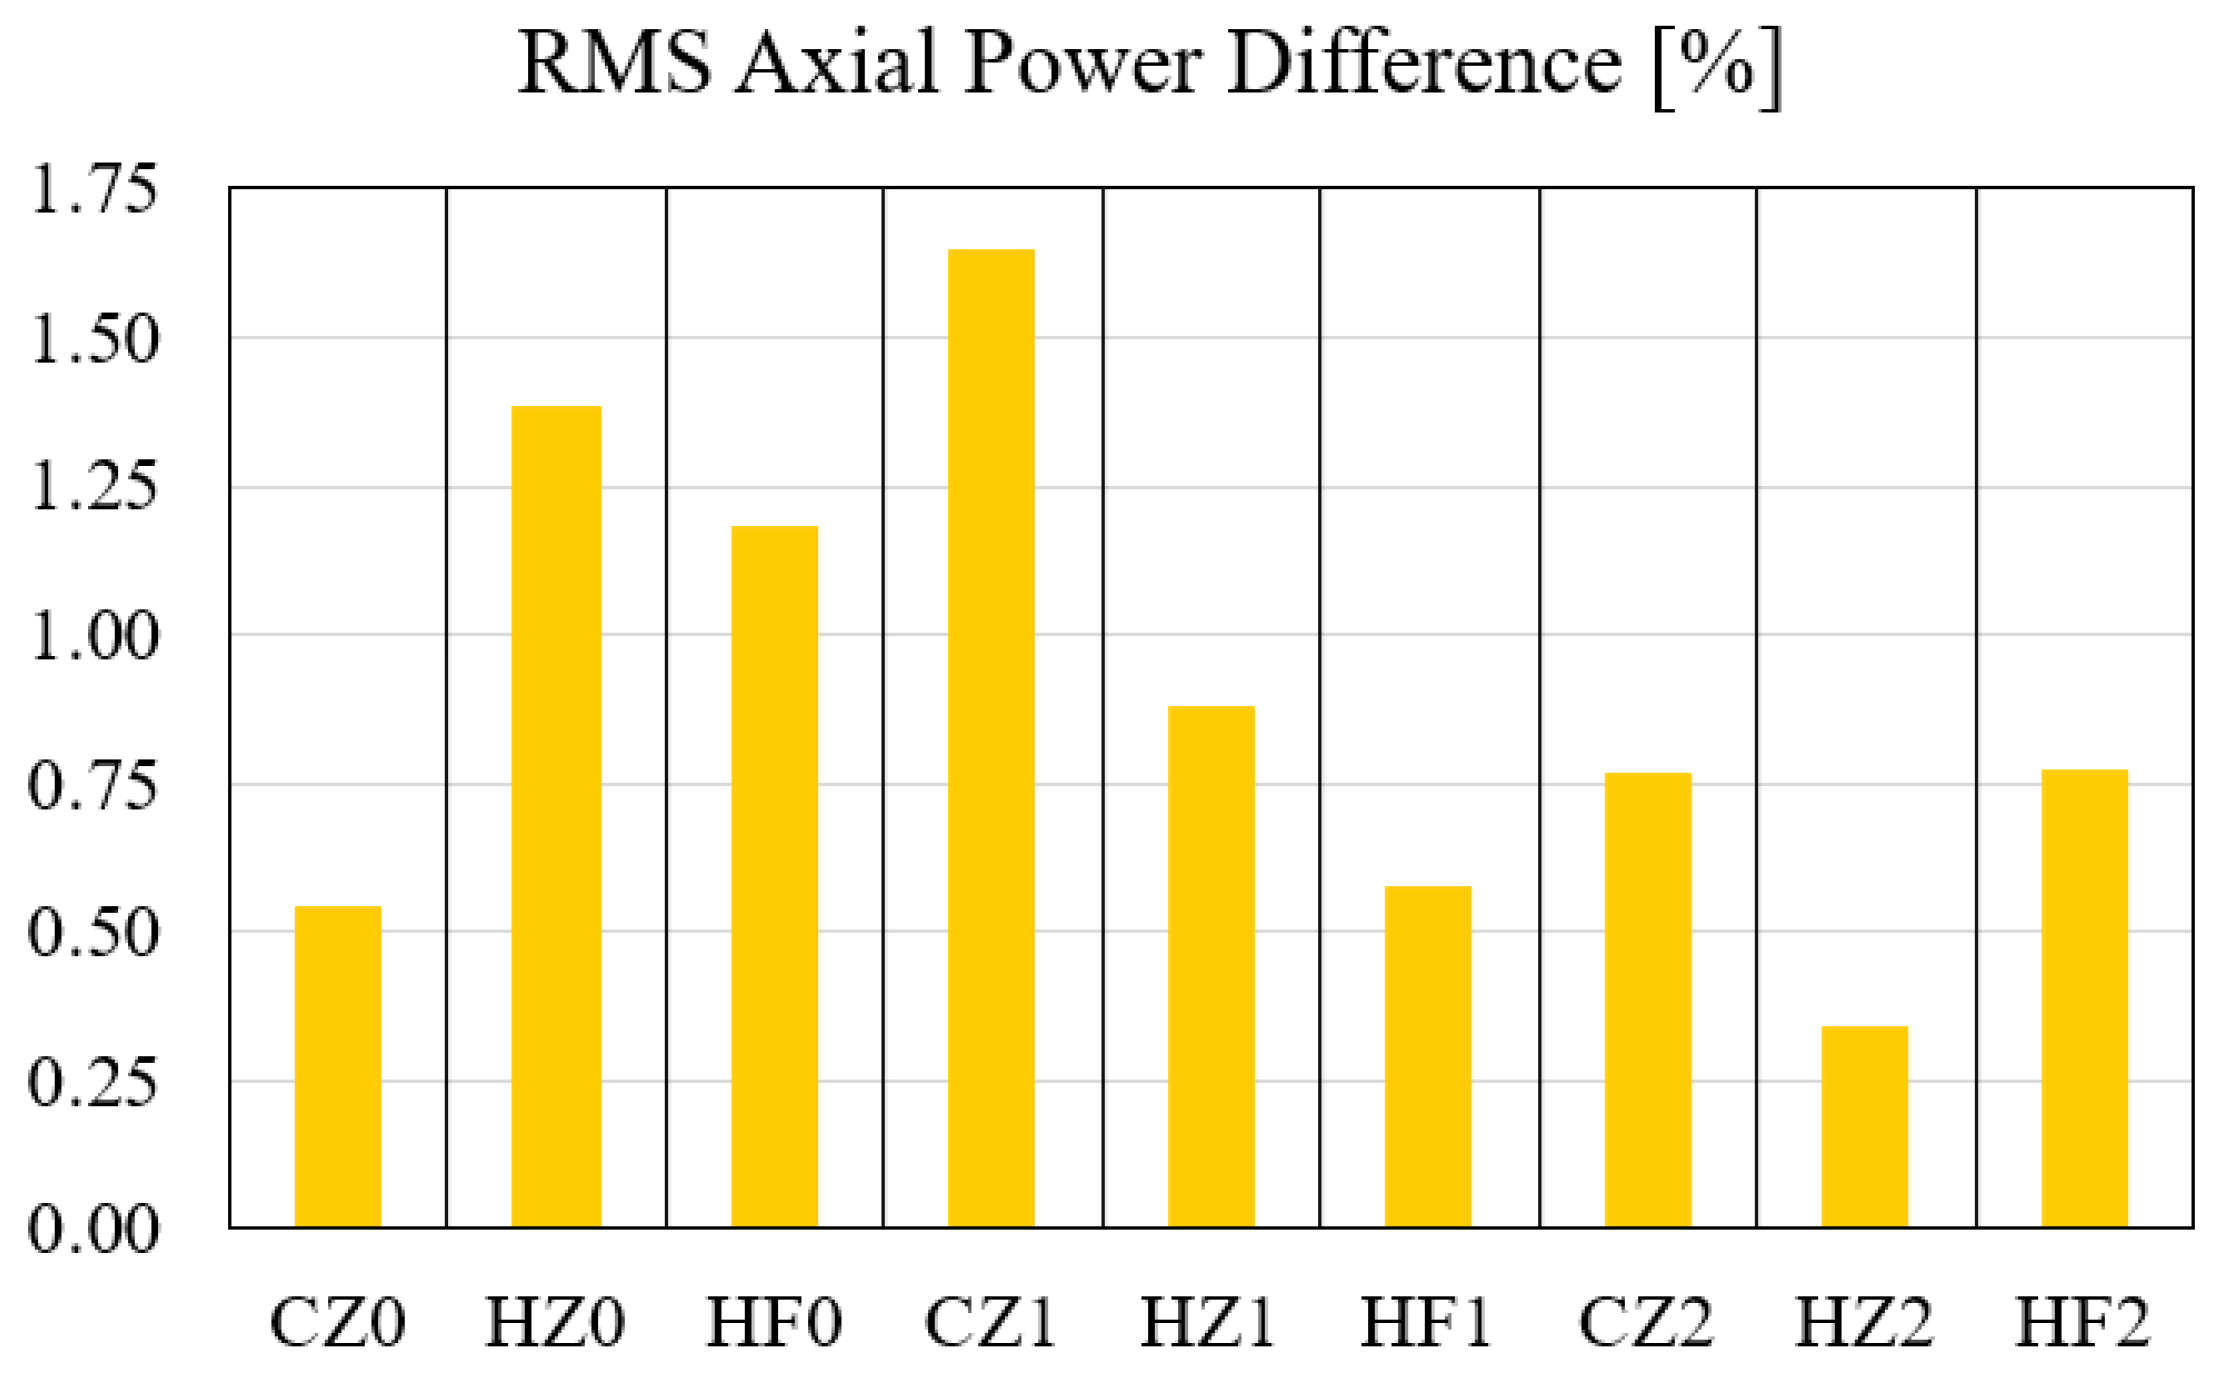
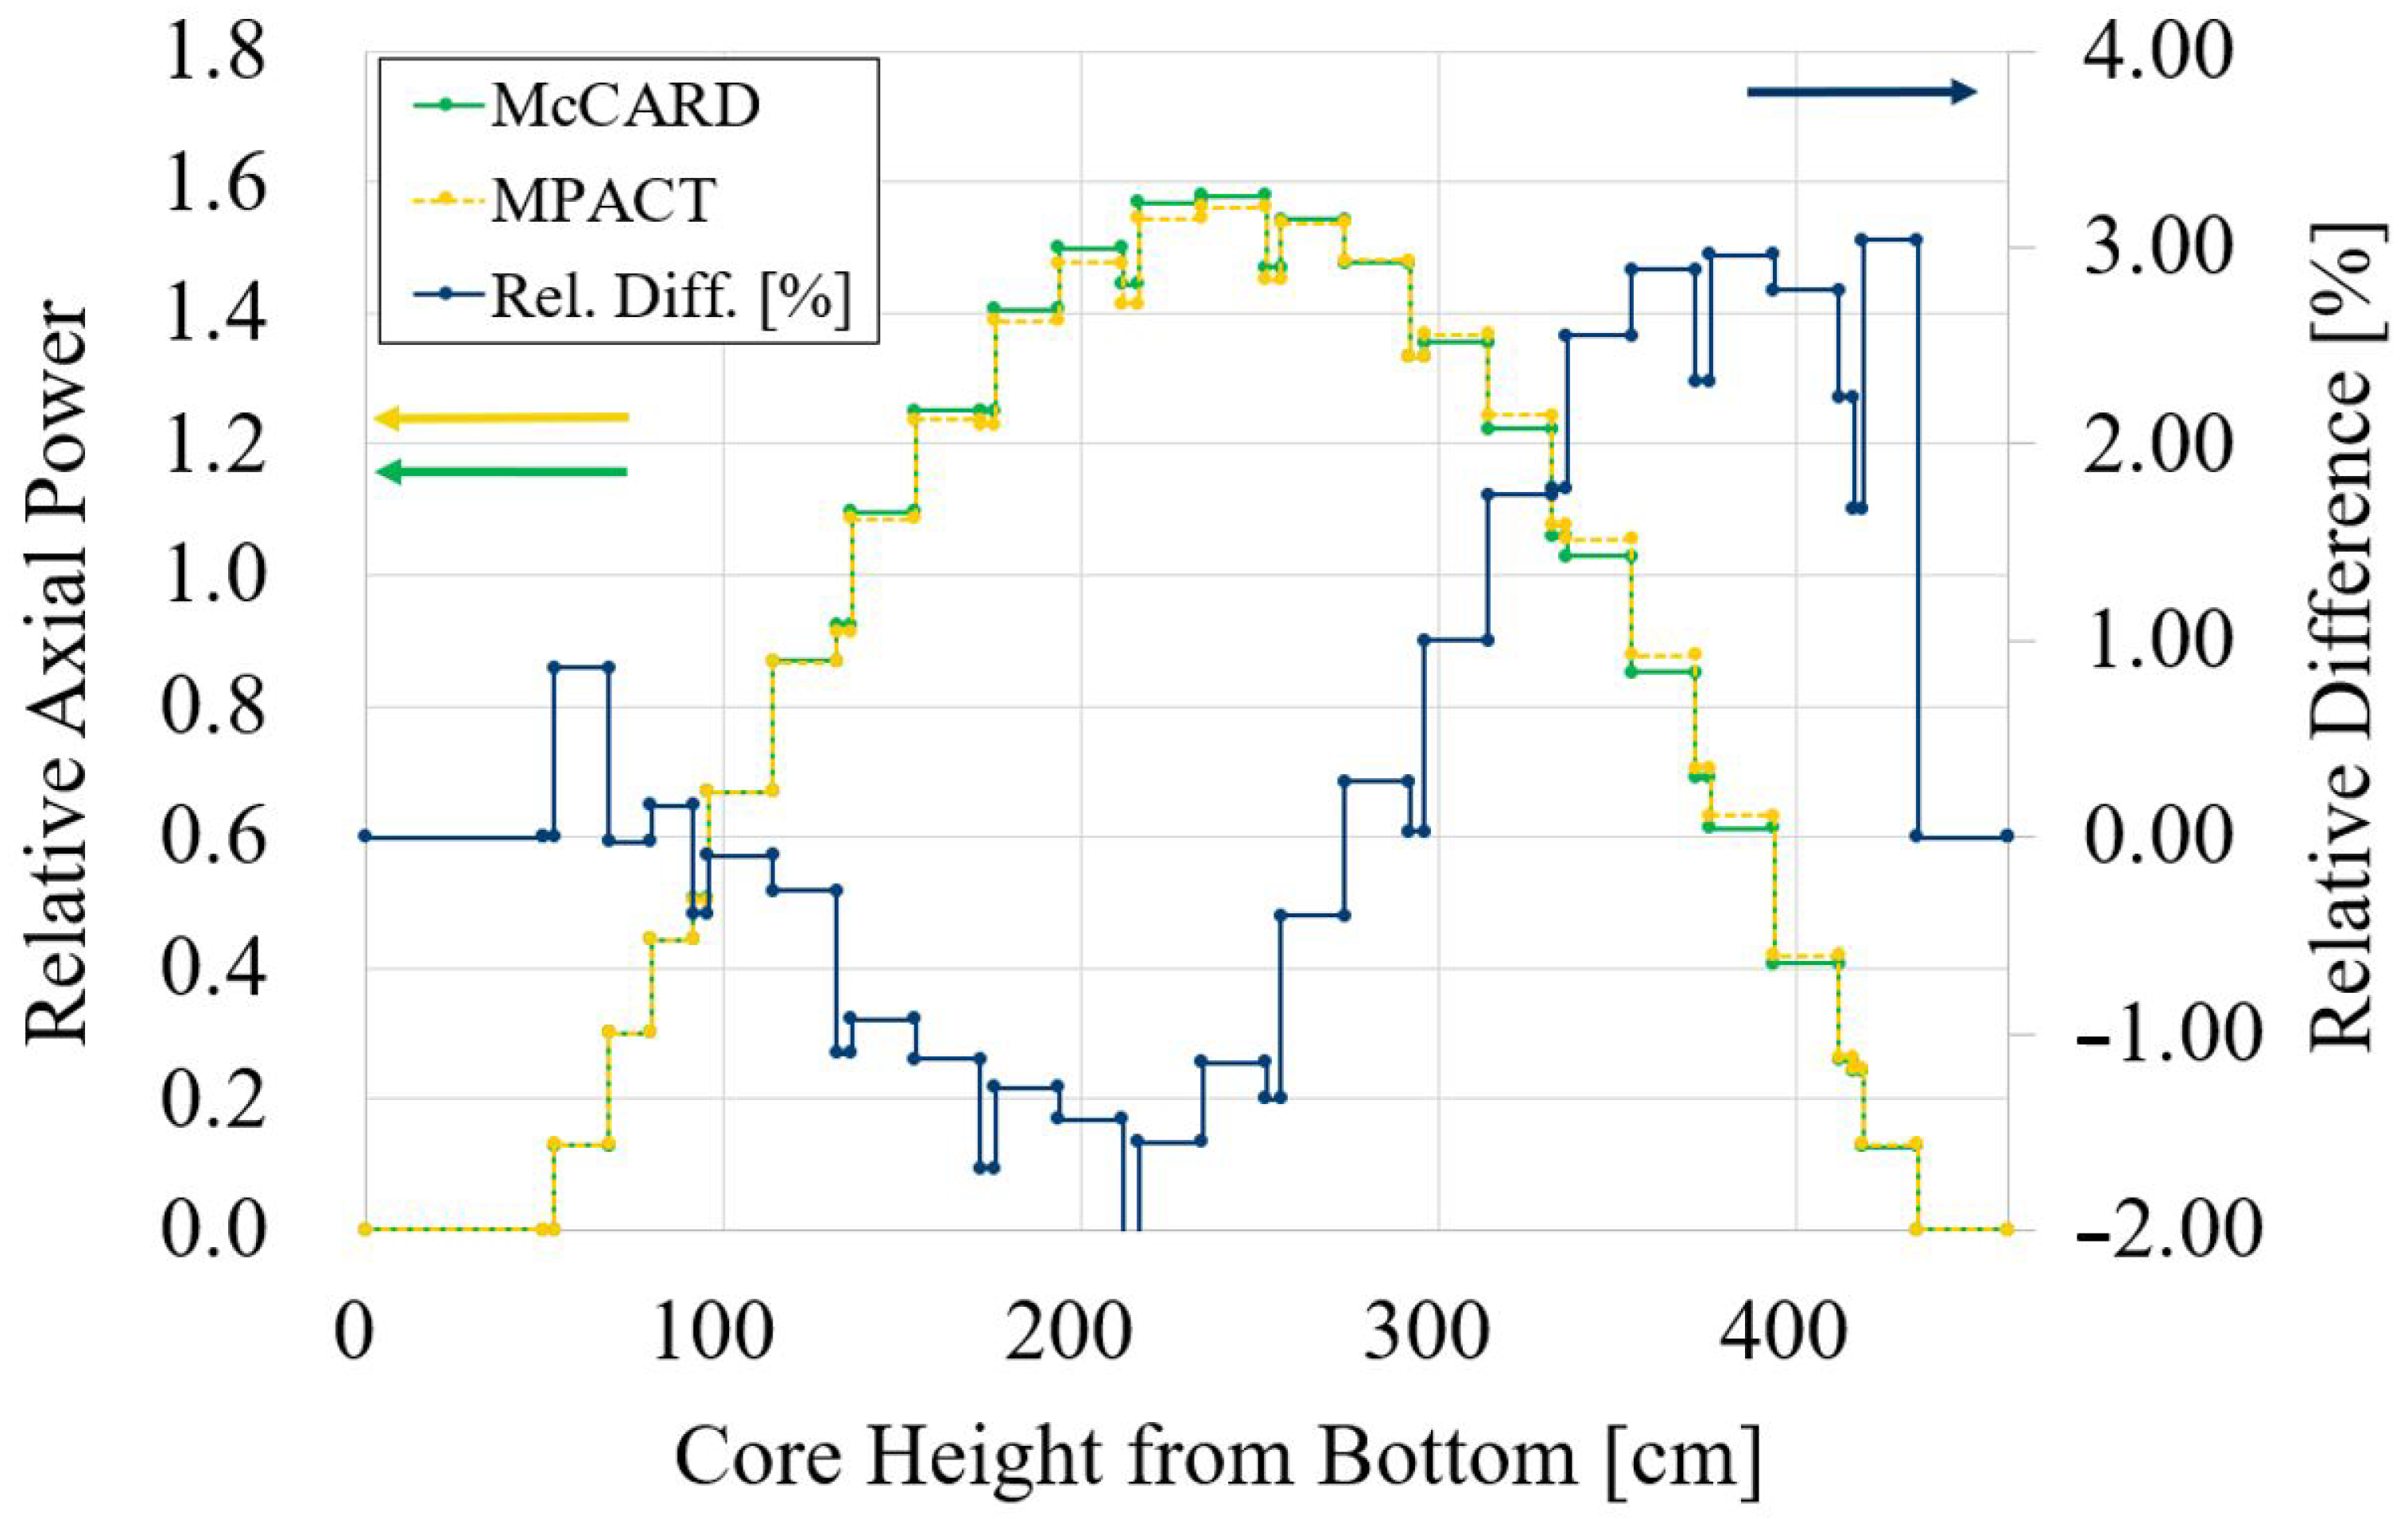
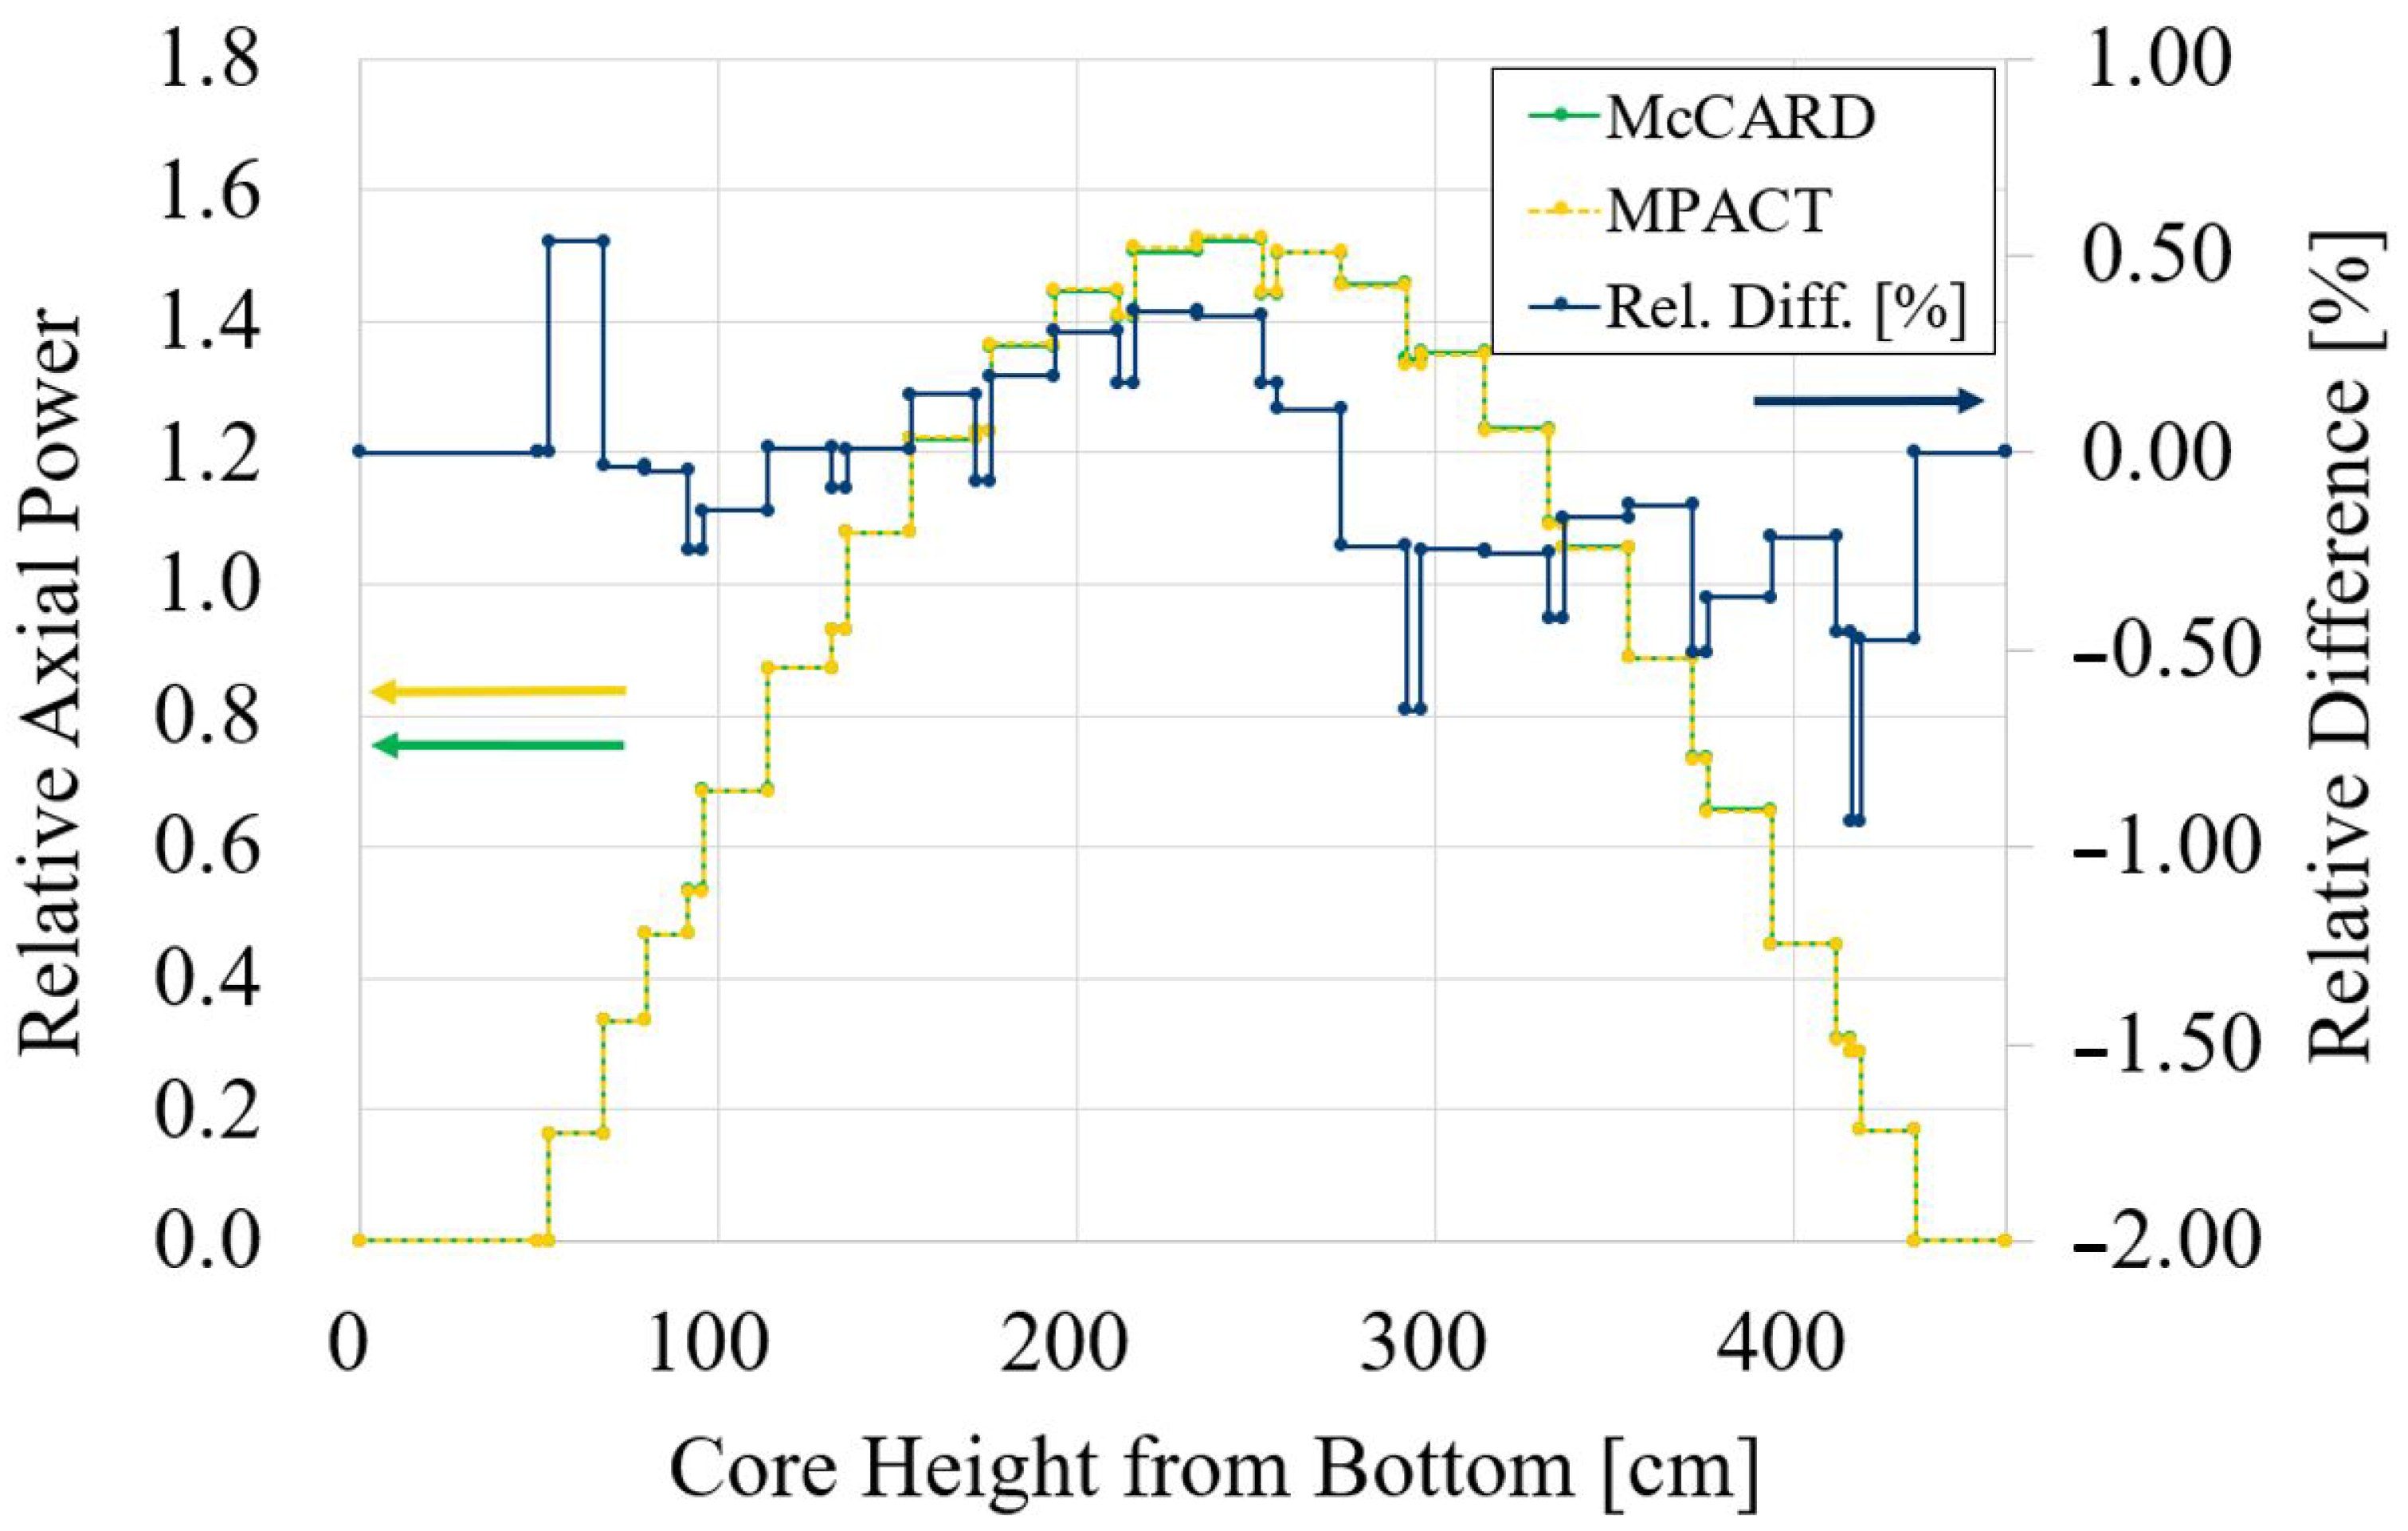
3.4. 3-D Core
3-D Core Results
3.5. Control Rod Worth
3.5.1. Control Rod Assembly Configuration and Problem Setup
3.5.2. Worth Equation
3.5.3. Accumulated Worth
3.5.4. Group Worth
3.5.5. Control Rod Worth Results
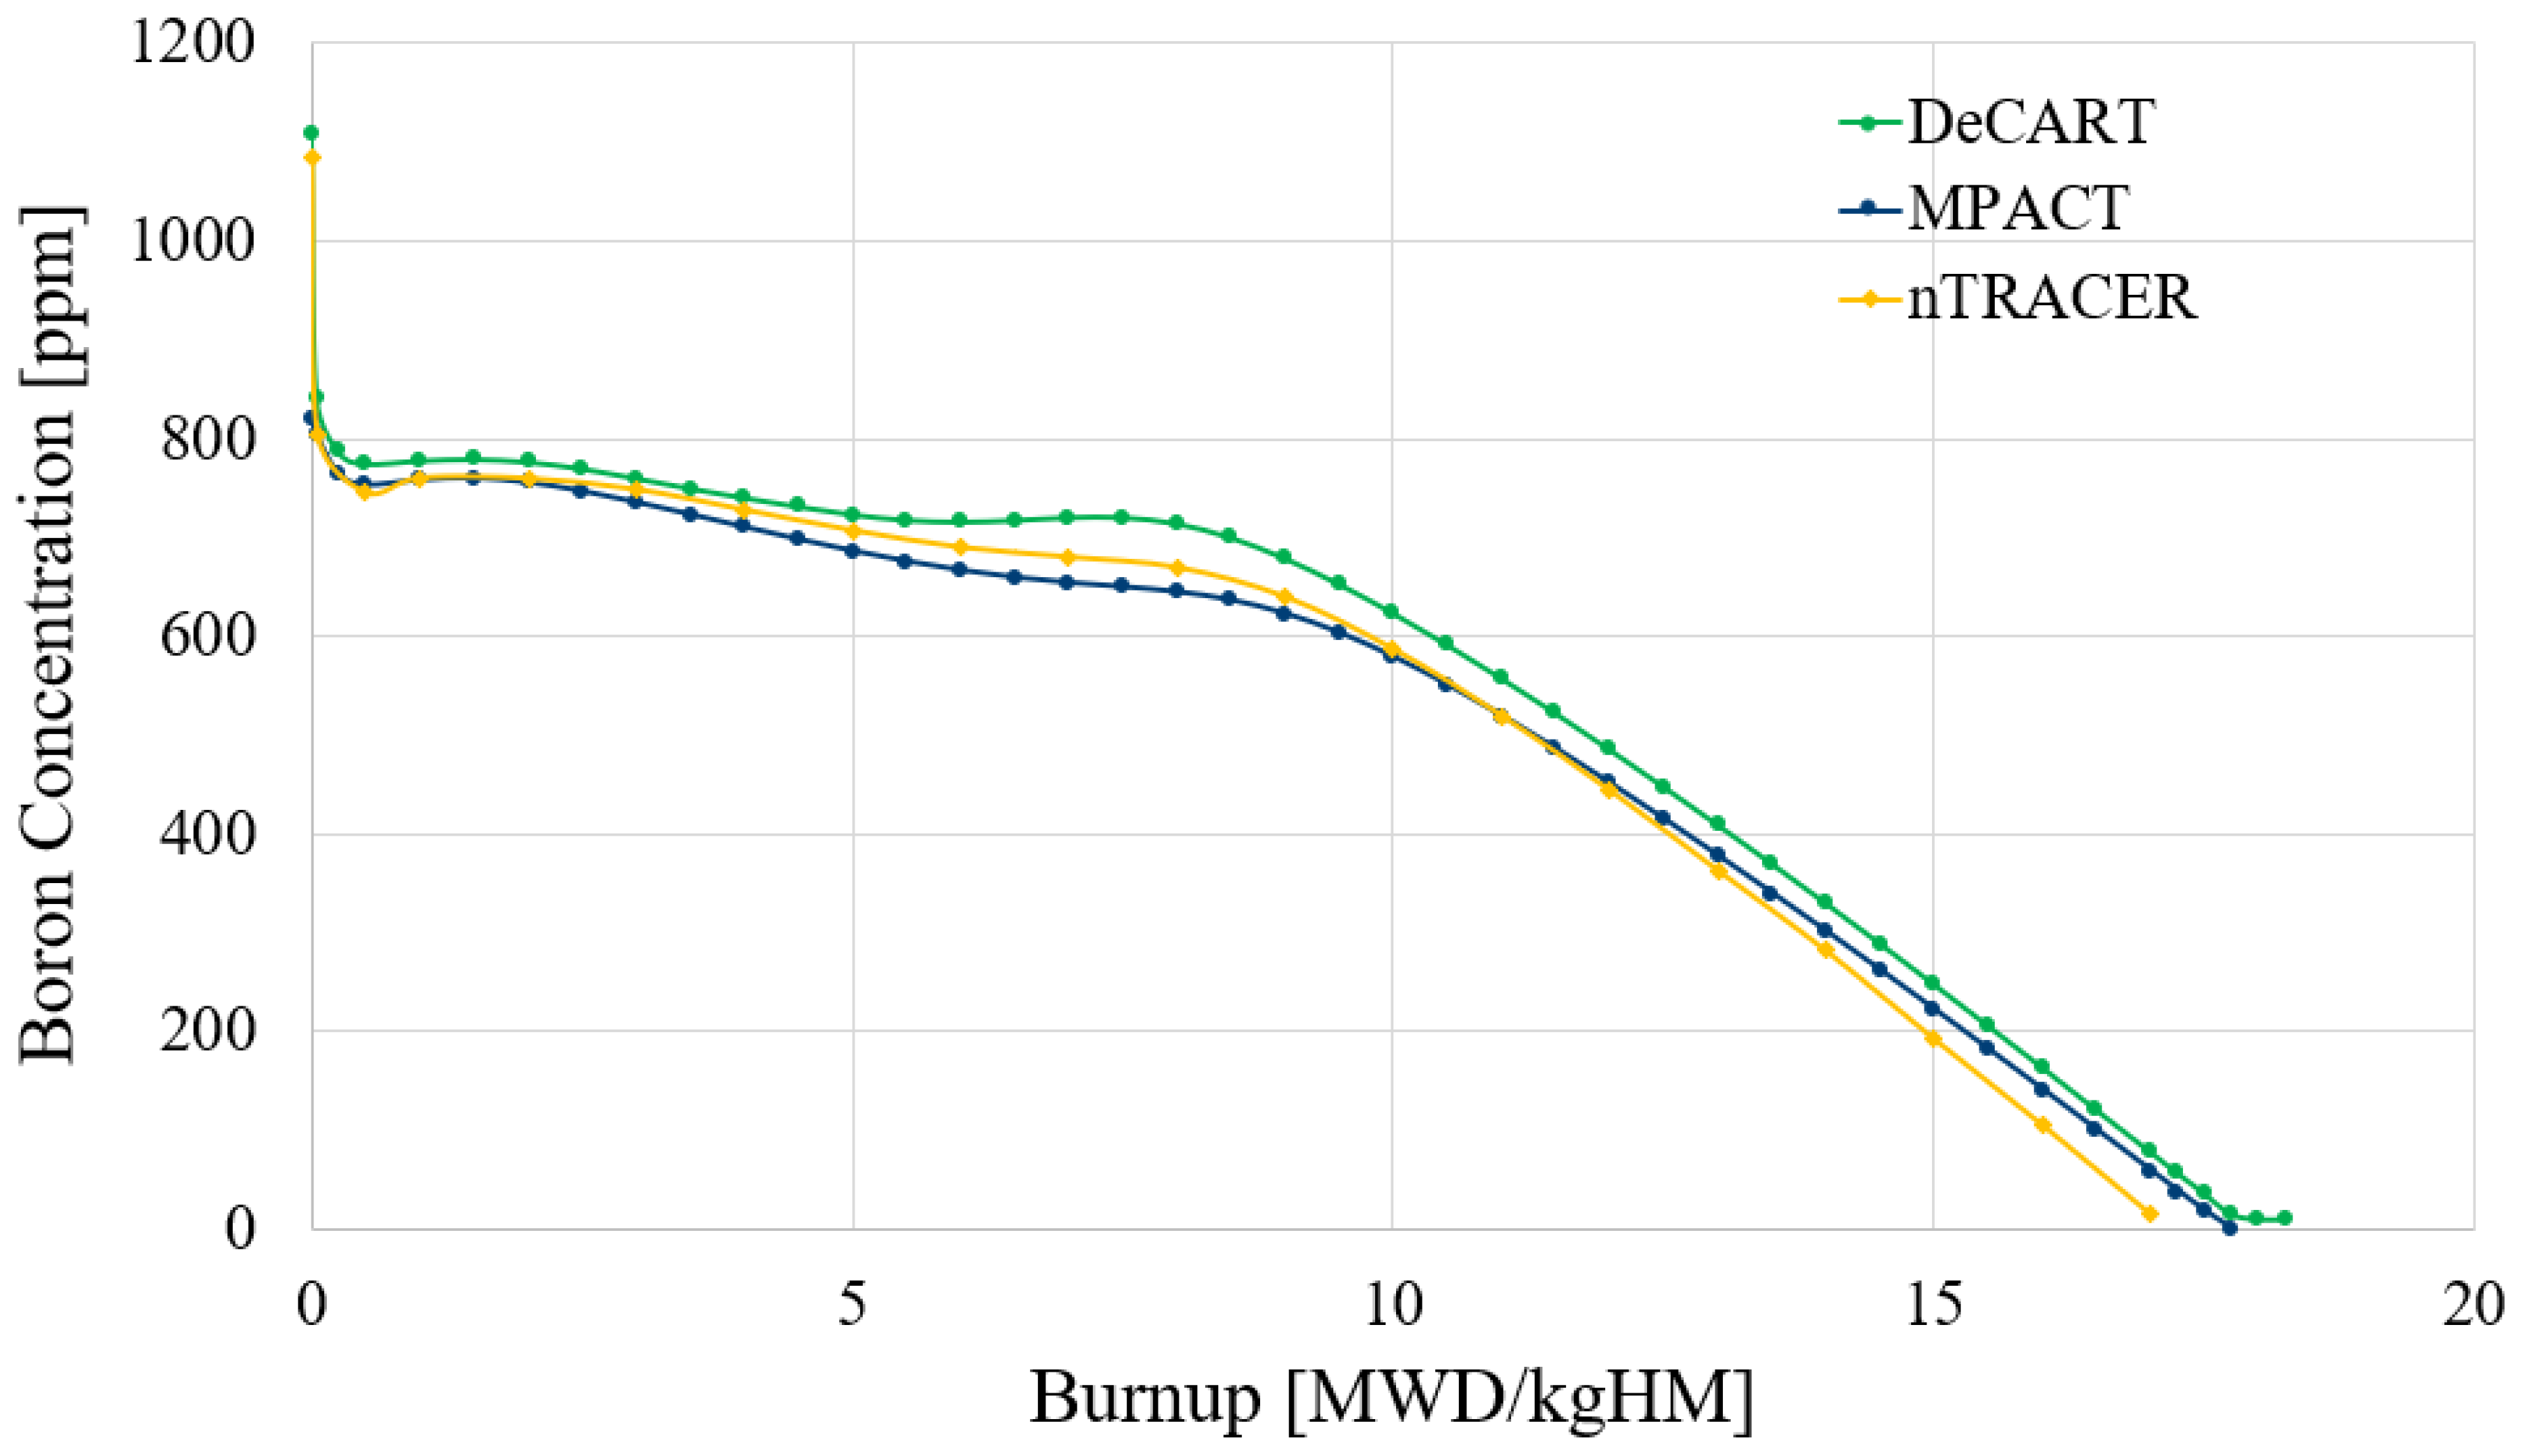
3.6. 3-D Core Hot Full Power Depletion
3.6.1. 3-D Core Depletion Results
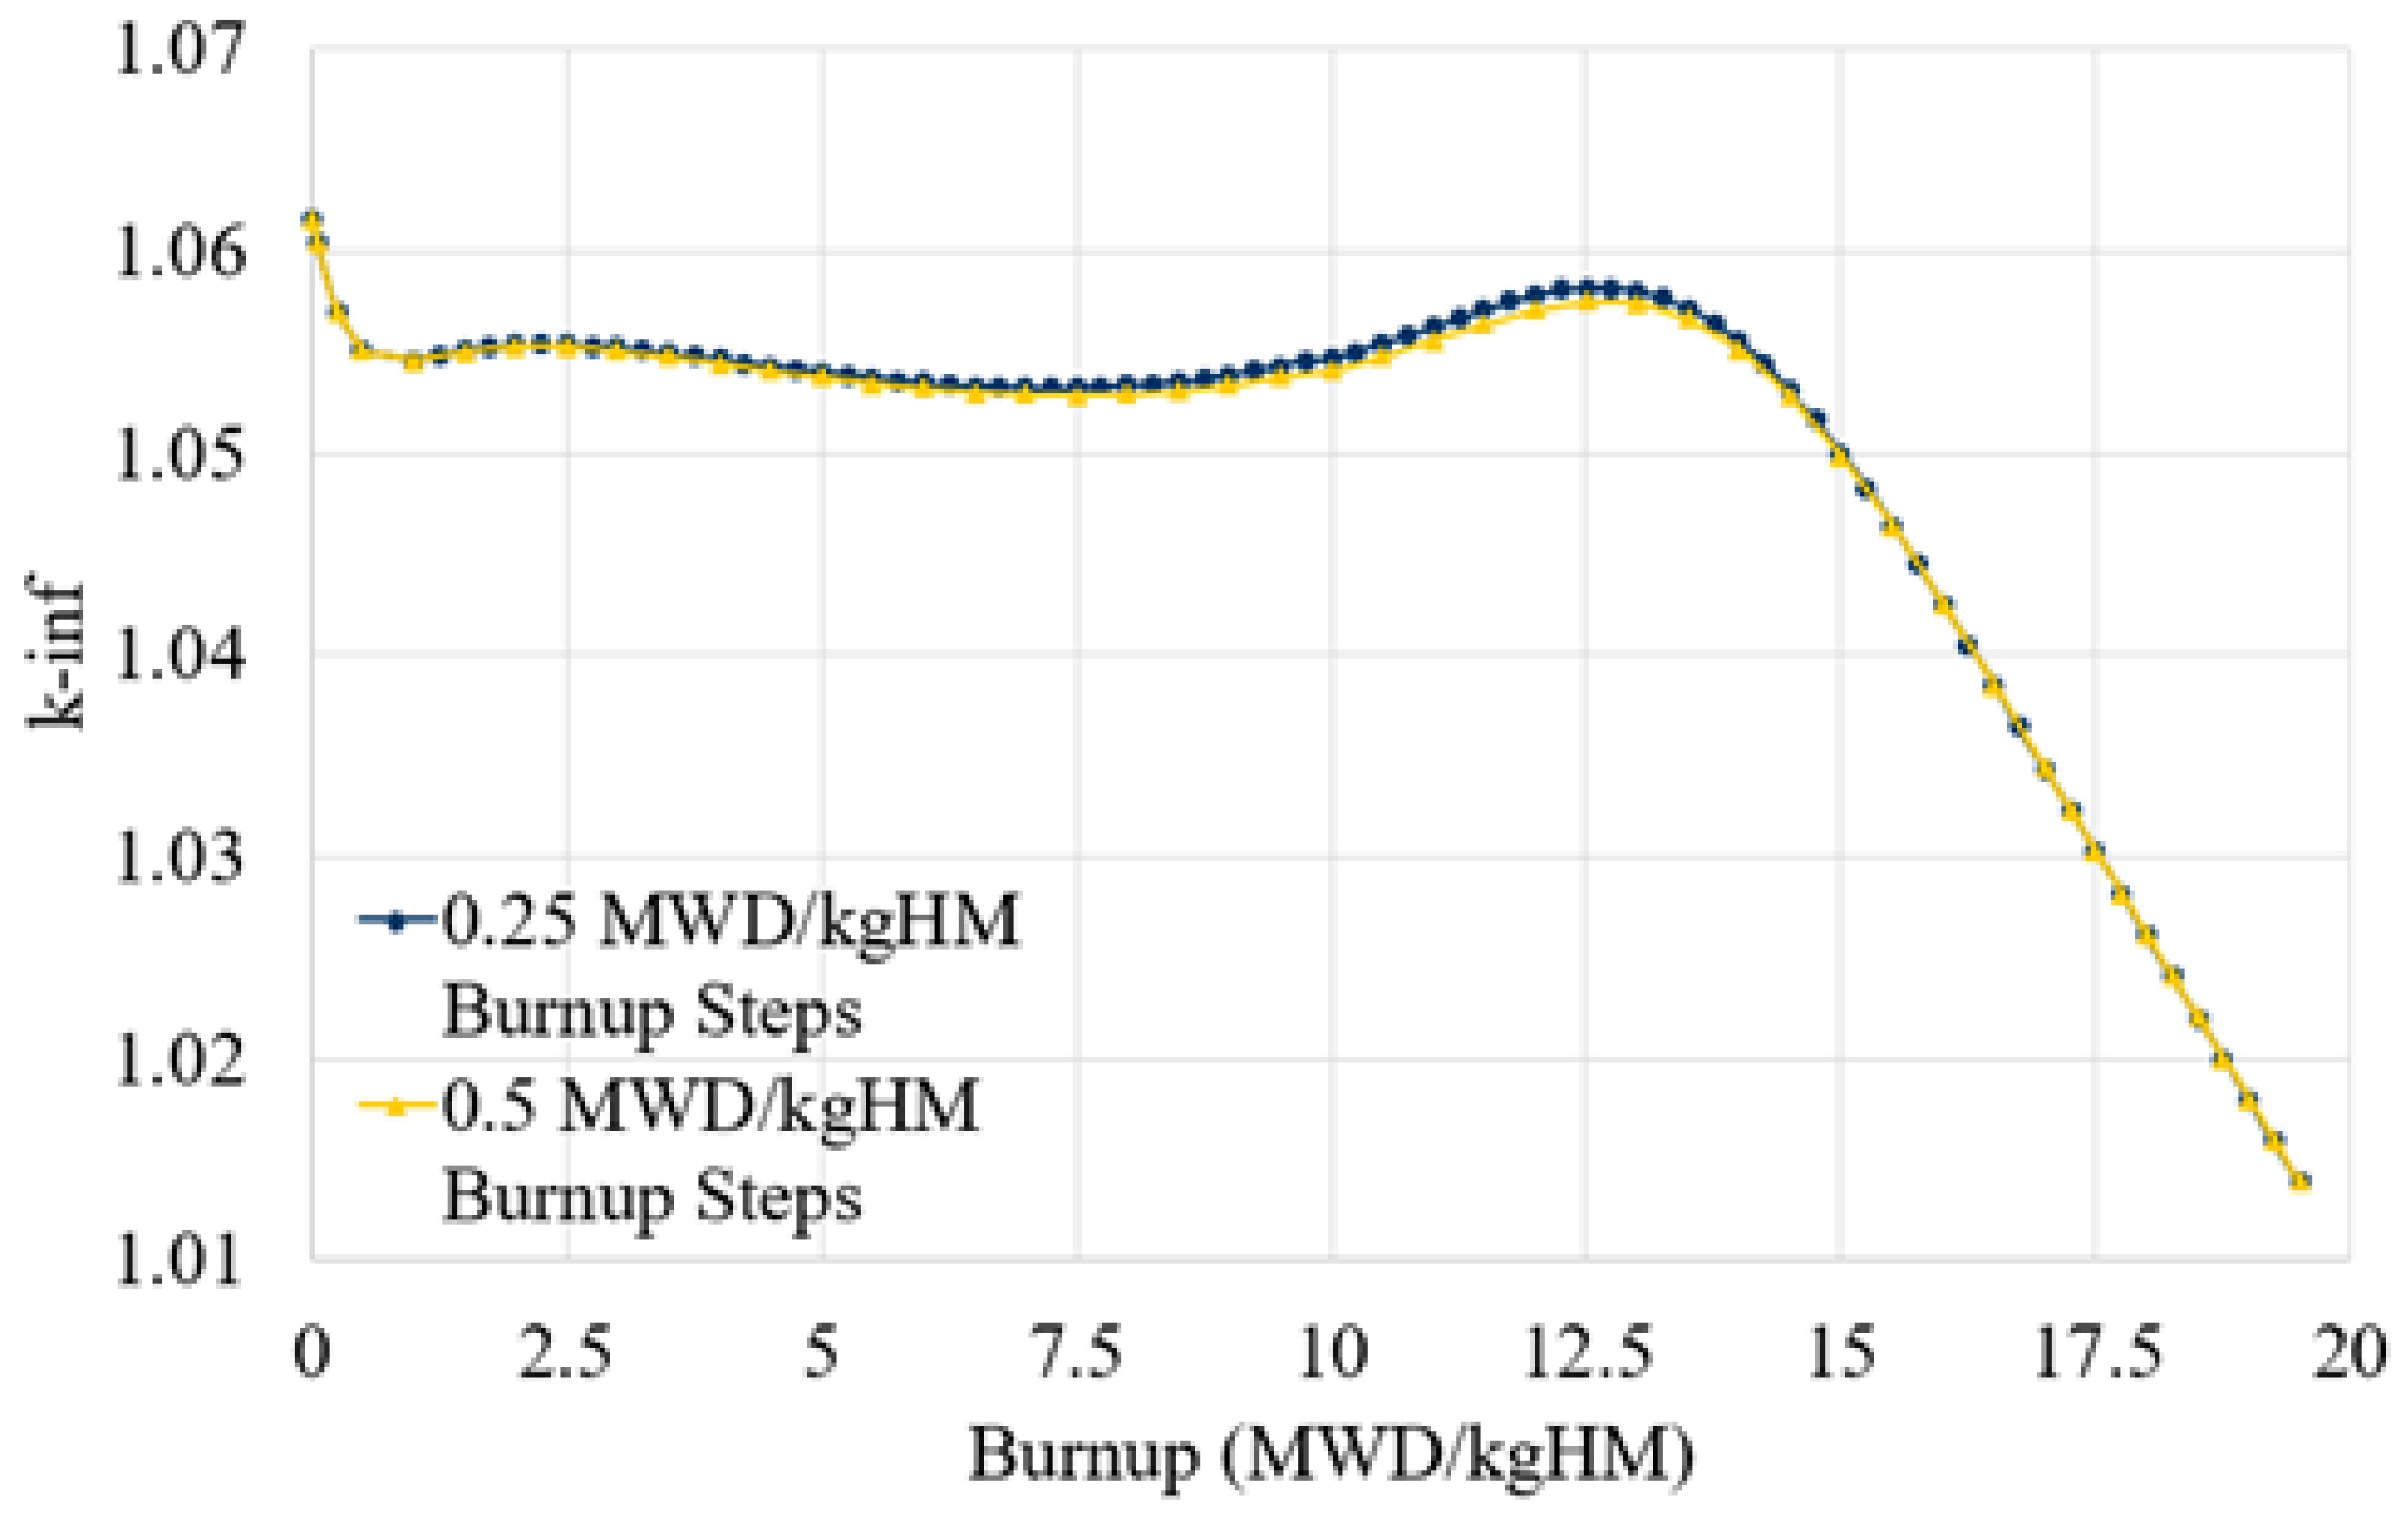
3.6.2. Burnup Interval Sensitivity for Gadolinia
4. Methodology
4.1. Methodologies in MPACT
4.2. Modeling Parameters
4.3. Relevant Equations for Analysis
4.3.1. Reactivity Differences
4.3.2. Pin and Assembly Power Comparisons
5. Conclusions
6. Future Work
Author Contributions
Funding
Institutional Review Board Statement
Informed Consent Statement
Data Availability Statement
Acknowledgments
Conflicts of Interest
Abbreviations
| APR1400 | Advanced Power Reactor 1400 MWe |
| ANL | Argonne National Laboratory |
| CZ | Cold zero |
| DeCART | Deterministic Core Analysis based on Ray Tracing |
| HF | Hot full |
| HZ | Hot zero |
| I-NERI | International Nuclear Energy Research Initiative |
| KAERI | Korea Atomic Energy Research Institute |
| MOC | Method of Characteristics |
| MPACT | Michigan PArallel Characteristics Transport |
| NURAM | Nuclear Reactor Analysis and Methods |
| ORNL | Oak Ridge National Laboratory |
| %RMS | Relative Root Mean Square |
| SPH | Super homogenization |
| UM | University of Michigan |
References
- Downar, T.; Kochunas, B.; Collins, B. MPACT Verification and Validation Manual (Rev 4); Technical Report CASL-U-2018-1641-000; Consortium for Advanced Simulation of Light Water Reactors: Oak Ridge, TN, USA, 2018. [Google Scholar]
- Collins, B.; Godfrey, A.T.; Stimpson, S.; Palmtag, S. Simulation of the BEAVRS Benchmark using VERA. In Proceedings of the International Conference Mathematics and Computational Methods Applied to Nuclear Science and Engineering, Jeju, Korea, 16–20 April 2017. [Google Scholar]
- Godfrey, A.T.; Collins, B.; Kim, K.S.; Montgomery, R.; Powers, J.J.; Salko, R.K.; Stimpson, S.; Wieselquist, W.A.; Clarno, K.T.; Gehin, J.C.; et al. VERA Benchmarking Results for Watts Bar Nuclear Plant Unit 1 Cycles 1–12; Technical Report CASL-U-2015-0206-000; Consortium for Advanced Simulation of Light Water Reactors: Oak Ridge, TN, USA, 2018. [Google Scholar]
- Liu, Y.; Vaughn, K.; Kochunas, B.; Downar, T.J. Validation of Pin-Resolved Reaction Rates, Kinetics Parameters, and Linear Source MOC in MPACT. Nucl. Sci. Eng. 2021, 195, 50–68. [Google Scholar] [CrossRef]
- Fiscal Year 2013 Annual Report; Technical Report I-NERI-2013; U.S. Department of Energy Office for Nuclear Energy: Washington, DC, USA, 2013.
- Yuk, S. APR1400 Reactor Core Benchmark Problem Book; Technical Report RPL-INERICA-004; Korea Atomic Energy Research Institute: Daejeon, Korea, 2019. [Google Scholar]
- Shim, H.J.; Han, B.S.; Jung, J.S.; Park, H.J.; Kim, C.H. McCARD: Monte Carlo Code for Advanced Reactor Design and Analysis. Nucl. Eng. Technol. 2012, 44, 161–176. [Google Scholar] [CrossRef] [Green Version]
- MPACT Theory Manual Version 2.2.0; Technical Report CASL-U-2016-1107-000; Consortium for Advanced Simulation of Light Water Reactors: Oak Ridge, TN, USA, 2016.
- Joo, H.G.; Cho, J.Y.; Kim, K.S.; Lee, C.C.; Zee, S.Q. Methods and Performance of a Three-Dimensional Whole-Core Transport Code DeCART. In Proceedings of the PHYSOR, Chicago, IL, USA, 25–29 April 2004; pp. 134–156. [Google Scholar]
- Hong, H.; Joo, H. Analysis of the APR1400 PWR Initial Core with the nTRACER Direct Whole Core Calculation Code and the McCARD Monte Carlo Code. In Proceedings of the Transaction of the KNS Spring Meeting, Jeju, Korea, 17–19 May 2017. [Google Scholar]
- Yuk, S. DeCART Solutions of APR1400 Reactor Core Benchmark Problems; Technical Report KAERI/TR-7826/2019; Korea Atomic Energy Research Institute: Daejeon, Korea, 2019. [Google Scholar]
- Kim, K.S.; Clarno, K.T.; Gentry, C.; Wiarda, D.; Williams, M.L.; Kochunas, B.; Liu, Y.; Palmtag, S.; Godfrey, A.T. Development of the V4.2m5 and V5.0m0 Multigroup Cross Section Libraries for MPACT for PWR and BWR; Technical Report CASL-U-2017-1280-000; Consortium for Advanced Simulation of Light Water Reactors: Oak Ridge, TN, USA, 2017. [Google Scholar]
- Park, H. Resonance Treatment Innovations for Efficiency and Accuracy Enhancement in Direct Whole Core Calculations of Water-Cooled Power Reactors. Ph.D. Thesis, Seoul National University, Seoul, Korea, 2018. [Google Scholar]
- Leppänen, J.; Pusa, M.; Viitanen, T.; Valtavirta, V.; Kaltiaisenaho, T. The Serpent Monte Carlo code: Status, development and applications in 2013. Ann. Nucl. Energy 2014, 82, 142–150. [Google Scholar] [CrossRef]
- Smith, K.; Forget, B. Challenges in the Development of High-Fidelity LWR Core Neutronics Tools. In Proceedings of the International Conference on Mathematics and Computational Methods Applied to Nuclear Science and Engineering, Sun Valley, ID, USA, 5–9 May 2013. [Google Scholar]
- Kang, J.; Joo, H.G. nTRACER Solutions of APR1400 Benchmark and Fast Reactor Analysis Status. In Proceedings of the 3rd I-NERI Progress Meeting, Atlanta, Georgia, 29 March–3 April 2019. [Google Scholar]
- Zhu, A.; Jarrett, M.; Xu, Y.; Kochunas, B.; Larsen, E.; Downar, T. An Optimally Diffusive Coarse Mesh Finite Difference Method to Accelerate Neutron Transport Calculations. Ann. Nucl. Energy 2016, 95, 116–124. [Google Scholar] [CrossRef] [Green Version]
- Gauld, I.C.; Radulescu, G.; Ilas, G.; Murphy, M.D.; Williams, M.L.; Wiarda, D. Isotopic Depletion and Decay Methods and Analysis Capabilities in SCALE. Nucl. Technol. 2011, 174, 169. [Google Scholar] [CrossRef]
- Godfrey, A.T. MPACT Testing and Benchmarking Results; Technical Report CASL-U2014-0045-000; Consortium for Advanced Simulation of Light Water Reactors: Oak Ridge, TN, USA, 2014. [Google Scholar]


| Boron Concentration [ppm] | Temperature Conditions | ||
|---|---|---|---|
| CZP Fuel: 300 K Mod: 300 K | HZP Fuel: 600 K Mod: 600 K | HFP Fuel: 900 K Mod: 600 K | |
| 0 | CZ0 | HZ0 | HF0 |
| 1000 | CZ1 | HZ1 | HF1 |
| 2000 | CZ2 | HZ2 | HF2 |
| Condition | Average kinf [pcm] | Standard Deviation [pcm] | Maximum Difference [pcm] |
|---|---|---|---|
| Overall | 63 | 44 | 151 |
| 0 ppm | 110 | 22 | 151 |
| 1000 ppm | 44 | 32 | 123 |
| 2000 ppm | 28 | 35 | 82 |
| 1.71 wt.% | 79 | 76 | 151 |
| 2.00 wt.% | 66 | 73 | 134 |
| 2.64 wt.% | 58 | 67 | 122 |
| 3.00 wt.% | 53 | 61 | 116 |
| 3.64 wt.% | 48 | 57 | 104 |
| CZ | 75 | 87 | 151 |
| HZ | 64 | 47 | 104 |
| HF | 60 | 49 | 138 |
| Assembly Type | Average kinf [pcm] | Max. kinf [pcm] | RMS Pin Power Diff. [%] | Max. Pin Power Diff. [%] |
|---|---|---|---|---|
| A0 | 83 68 | 234 | 0.12 | 0.69 |
| B0 | 76 67 | 225 | 0.13 | 0.60 |
| B1 | 100 64 | 201 | 0.24 | 1.09 |
| B2 | 103 67 | 218 | 0.25 | 1.15 |
| B3 | 143 64 | 250 | 0.26 | 1.10 |
| C0 | 71 74 | 237 | 0.17 | 0.90 |
| C1 | 83 51 | 151 | 0.22 | 1.06 |
| C2 | 113 52 | 182 | 0.25 | 1.08 |
| C3 | 117 57 | 204 | 0.26 | 1.10 |
| Assembly Type | k [pcm] | RMS Pin Power Diff. [%] | ||
|---|---|---|---|---|
| Default Solution | “Fine” Solution | Default Solution | “Fine” Solution | |
| A0 | −76 | −56 | 0.12 | 0.31 |
| B0 | −91 | −29 | 0.12 | 0.54 |
| B1 | −201 | −120 | 0.25 | 0.50 |
| B2 | −218 | −220 | 0.26 | 0.57 |
| B3 | −250 | −270 | 0.27 | 0.58 |
| C0 | −25 | −7 | 0.17 | 0.42 |
| C1 | −106 | −167 | 0.24 | 0.54 |
| C2 | −113 | −221 | 0.26 | 0.56 |
| C3 | −114 | −224 | 0.27 | 0.57 |
| Average | −133 74 | −146 97 | 0.22 | 0.51 |
| Case Condition | RMS Difference [%] | Max. Difference [%] | ||
|---|---|---|---|---|
| TCP | P | TCP | P | |
| CZ0 | 1.15 | 0.41 | 2.54 | 0.85 |
| HZ0 | 0.55 | 0.34 | 1.31 | 0.82 |
| HF0 | 0.51 | 0.36 | 1.13 | 0.67 |
| CZ1 | 1.24 | 0.42 | 3.10 | 0.85 |
| HZ1 | 0.45 | 0.22 | 1.03 | 0.48 |
| HF1 | 0.84 | 0.39 | 1.77 | 1.02 |
| CZ2 | 1.92 | 0.47 | 4.52 | 0.87 |
| HZ2 | 1.05 | 0.18 | 2.24 | 0.40 |
| HF2 | 1.36 | 0.21 | 2.53 | 0.48 |
| Average | 1.01 | 0.33 | 2.24 | 0.72 |
| Case Condition | McCARD | MPACT | Comparison of MPACT and McCARD | |||
|---|---|---|---|---|---|---|
| keff | std. [pcm] | k | [pcm] | Assembly Power Diff. | ||
| RMS [%] | Max. [%] | |||||
| CZ0 | 1.22261 | 6 | 1.22040 | −148 | 0.41 | 0.85 |
| CZ1 | 1.03687 | 7 | 1.03670 | 47 | 0.42 | 0.85 |
| CZ2 | 0.91050 | 7 | 0.91098 | 182 | 0.47 | 0.87 |
| HZ0 | 1.14693 | 6 | 1.14693 | 0 | 0.34 | 0.82 |
| HZ1 | 1.02305 | 6 | 1.02328 | 72 | 0.22 | 0.48 |
| HZ2 | 0.93015 | 6 | 0.93044 | 131 | 0.18 | 0.40 |
| HF0 | 1.13808 | 6 | 1.13768 | −31 | 0.36 | 0.67 |
| HF1 | 1.01523 | 6 | 1.01512 | 40 | 0.39 | 1.02 |
| HF2 | 0.92316 | 6 | 0.92401 | 99 | 0.25 | 0.64 |
| Average | - | - | - | 83 61 | 0.34 | 0.73 |
| Case Condition | McCARD | MPACT | Comparison of MPACT and McCARD | ||||
|---|---|---|---|---|---|---|---|
| k | k | [pcm] | Assembly Power Diff. | Axial Power Diff. | |||
| RMS [%] | Max [%] | RMS [%] | Max [%] | ||||
| CZ0 | 1.21765 | 1.21534 | −156 | 0.46 | 1.07 | 0.55 | 1.95 |
| CZ1 | 1.03406 | 1.03448 | 39 | 0.46 | 0.98 | 1.65 | 3.04 |
| CZ2 | 0.90907 | 0.91046 | 168 | 1.17 | 2.57 | 0.77 | 1.39 |
| HZ0 | 1.13942 | 1.13938 | −3 | 0.48 | 1.27 | 1.38 | 2.53 |
| HZ1 | 1.01760 | 1.01829 | 67 | 0.38 | 0.79 | 0.88 | 1.65 |
| HZ2 | 0.92594 | 0.92709 | 134 | 0.22 | 0.57 | 0.34 | 0.93 |
| HF0 | 1.13061 | 1.13013 | −38 | 0.56 | 1.26 | 1.18 | 2.81 |
| HF1 | 1.00973 | 1.01013 | 39 | 0.32 | 0.72 | 0.58 | 1.91 |
| HF2 | 0.91899 | 0.91979 | 94 | 0.30 | 1.03 | 0.77 | 1.39 |
| Average | - | - | 82 59 | 0.49 | 1.14 | 0.90 | 1.96 |
| Bank(s) Inserted | McCARD | MPACT | Comparison of MPACT and McCARD | |||||
|---|---|---|---|---|---|---|---|---|
| Group Worth [pcm] | Accum. Worth [pcm] | Group Worth [pcm] | Accum. Worth [pcm] | Group Diff. [%] | Accum. Diff. [%] | Assembly Power Diff. | ||
| RMS [%] | Max [%] | |||||||
| ARO | 0.0 | 0.0 | 0.0 | 0.0 | - | - | - | - |
| 5 | 369.0 | 369.0 | 366.7 | 366.7 | −0.6 | −0.6 | 0.21 | 0.37 |
| 5-4 | 322.7 | 691.7 | 323.2 | 689.9 | 0.1 | −0.3 | 0.31 | 0.90 |
| 5-4-3 | 999.4 | 1691.1 | 1001.3 | 1691.2 | 0.2 | 0.0 | 0.37 | 0.66 |
| 5-4-3-2 | 1041.9 | 2733.0 | 1042.7 | 2733.9 | 0.1 | 0.0 | 0.29 | 0.67 |
| 5-4-3-2-1 | 2010.0 | 4743.0 | 2005.4 | 4739.3 | −0.2 | −0.1 | 0.62 | 1.44 |
| 5-4-3-2-1-B | 4142.2 | 8885.2 | 4163.1 | 8902.3 | 0.5 | 0.2 | 0.71 | 1.86 |
| 5-4-3-2-1-B-A | 7234.0 | 16,119.2 | 7203.4 | 16,105.7 | −0.4 | −0.1 | 0.35 | 0.84 |
| Burnup [MWD/kgHM] | MPACT | DeCART | nTRACER | ||
|---|---|---|---|---|---|
| Boron Conc. [ppm] | Boron Conc. [ppm] | Diff. from MPACT | Boron Conc. [ppm] | Diff. from MPACT | |
| 0 | 1083.50 | 1107.56 | −24.06 | 1085.05 | −1.55 |
| 0.05 | 804.13 | 840.73 | −36.60 | 804.85 | −0.72 |
| 0.5 | 753.12 | 774.49 | −21.37 | 745.33 | 7.79 |
| 1 | 758.04 | 777.70 | −19.66 | 760.32 | −2.28 |
| 2 | 755.54 | 776.44 | −20.90 | 759.79 | −4.25 |
| 3 | 735.58 | 759.99 | −24.41 | 748.58 | −13.00 |
| 4 | 710.47 | 740.27 | −29.80 | 727.85 | −17.38 |
| 5 | 686.32 | 723.33 | −37.01 | 707.17 | −-20.85 |
| 6 | 666.70 | 715.86 | −49.17 | 690.03 | −23.33 |
| 7 | 654.05 | 720.33 | −66.28 | 680.34 | −26.29 |
| 8 | 644.79 | 714.19 | −69.40 | 669.75 | −24.96 |
| 9 | 622.80 | 679.05 | −56.25 | 639.88 | −17.08 |
| 10 | 579.05 | 623.64 | −44.59 | 586.93 | −7.88 |
| 11 | 519.56 | 557.81 | −38.25 | 519.66 | 0.10 |
| 12 | 451.16 | 485.78 | −34.62 | 444.04 | 7.12 |
| 13 | 377.69 | 409.59 | −31.60 | 362.94 | 14.75 |
| 14 | 301.01 | 330.27 | −29.26 | 281.73 | 19.28 |
| 15 | 221.85 | 248.19 | −26.34 | 192.45 | 29.40 |
| 16 | 140.83 | 164.13 | −23.30 | 105.68 | 35.15 |
| 17 | 58.76 | 78.57 | −19.81 | 15.43 | 43.33 |
| 18 | 0.00 | 10.00 | −10.00 | 0.00 | 0.00 |
| Average | - | - | 34 16 | - | 15 20 |
Publisher’s Note: MDPI stays neutral with regard to jurisdictional claims in published maps and institutional affiliations. |
© 2021 by the authors. Licensee MDPI, Basel, Switzerland. This article is an open access article distributed under the terms and conditions of the Creative Commons Attribution (CC BY) license (https://creativecommons.org/licenses/by/4.0/).
Share and Cite
Barr, K.E.; Choi, S.; Kang, J.; Kochunas, B. Verification of MPACT for the APR1400 Benchmark. Energies 2021, 14, 3831. https://doi.org/10.3390/en14133831
Barr KE, Choi S, Kang J, Kochunas B. Verification of MPACT for the APR1400 Benchmark. Energies. 2021; 14(13):3831. https://doi.org/10.3390/en14133831
Chicago/Turabian StyleBarr, Kaitlyn Elizabeth, Sooyoung Choi, Junsu Kang, and Brendan Kochunas. 2021. "Verification of MPACT for the APR1400 Benchmark" Energies 14, no. 13: 3831. https://doi.org/10.3390/en14133831
APA StyleBarr, K. E., Choi, S., Kang, J., & Kochunas, B. (2021). Verification of MPACT for the APR1400 Benchmark. Energies, 14(13), 3831. https://doi.org/10.3390/en14133831