1. Introduction
Buildings are the largest consumers of energy and a more effective energy management requires real-time data analysis [
1,
2]. Humans spend a lot of time indoors, so that air quality has a direct impact on overall health [
3]. Home monitoring is a key element of a smart house. Two systems are typically employed. The first consists of energy monitoring to control energy usage [
4,
5] and the other consists of indoor air quality monitoring to improve the quality of life [
6,
7]. Sensors are used to measure various parameters of interest, and a communications system allows information to be gathered for decision making. Sensors related to energy monitoring measure parameters such as electric current consumption, power consumption, energy consumption, luminosity, movement detection, and acoustic event detection [
8,
9,
10,
11]. The major air quality parameters to be measured are carbon dioxide (CO
2), carbon monoxide (CO), sulfur dioxide (SO
2), nitrogen dioxide (NO
2), ozone (O
3), volatile organic compounds (VOC), particulate matter (PM), ambient temperature, and relative humidity [
6,
12,
13,
14]. Both monitoring systems can use common sensors. For instance, Lovett et al. [
15] use sensors designed to measure environmental properties, such as temperature, humidity, and CO
2, instead of measuring power consumption to predict energy usage. Several communication systems have been proposed to transmit the collected data. Many studies use Zigbee, based on the protocol IEEE802.15.4, created to support the area of wireless sensor networks [
6,
9,
16,
17,
18,
19]. Bluetooth low energy (BLE) is also proposed for the communication system [
20], while Bluetooth can be applied to configure smart devices [
21]. In [
8], Wi-Fi is used to communicate with actuator nodes, and ZigBee is used to transmit data from sensor nodes. In [
22], ESP8266 Wi-Fi modules are used in sensor nodes. Li et al. [
23] propose the nRF24L01 wireless transceiver (Nordic Semiconductor, Trondheim, Norway) to transmit data.
Energy monitoring systems aim to efficiently manage the energy usage of a house. However, the system also consumes energy in its operation. In many cases, the radio is the component with the highest power consumption. Therefore, the communication system used to collect data must be of low power. Different forms of supplying power to the monitoring systems have been considered. In the system presented by Benammar et al. [
7], the sensor nodes are powered from the mains sockets through an adapter and a charger. A 6600 mAh battery is used for the real time clock and for the backup in the case of temporary power failure. Peng and Huang [
24] also proposed a system based on AC/DC (Alternate Current /Direct Current) adapters that convert 220 V AC to 5 V. The 3.3 V required by the sensor nodes is obtained by means of a linear regulator. A similar proposal to power the sensor nodes is made in [
25], but for 110 V input voltage. In [
26], AC/DC converters are also used to power smart plugs, developed for power monitoring and control.
Froiz-Míguez et al. [
8] use two AA 1.5 V batteries to power XBee modules and three AA 1.5 V batteries to power the movement sensors. The average current consumption of the sensor during transmission is 55 mA, but they spend most of the time in sleep mode. Actuator nodes are powered with 5 V AC/DC converters and are continuously awake to respond to asynchronous commands. The system presented by Grindvoll et al. [
27] also uses 1.5 V AA batteries. The sampling rate of the LoWPAN sensor nodes was set to one sample every five minutes. Tan et al. [
9] present a system to report the energy consumption of appliances. This work considers alkaline batteries to power the sensor nodes. The authors mention a projected lifetime of TeloB modules of 79 days and the projected lifetime of Iris modules of 40 days. Kim et al. [
13] provided values for the consumption of the used sensors. The current consumption of the sensors is between 0.3 mA and 123 mA. As power sources, they propose connection to AC wall sockets or batteries. Batteries make it possible to power the mobile nodes and to back up in case of a power failure. Hashizume et al. [
17] also considered the power consumption of the monitoring system. A target in the proposed system was to maintain the power consumption of the monitoring system below the power saving. However, the power consumption of the gateway was 13.9 W, and the smart plugs consumed 9.8 W.
As can be seen from previous results, the typical solutions to power home monitoring systems are usually power supplies of 230 V or 110 V, or batteries. AC/DC adapters are used when higher power consumption is required, as in the case of systems that are always powered on. It is important to evaluate the efficiency of these systems because these adapters are always connected to the power source. Alkaline or lithium batteries are used when the sensor nodes can go into sleep mode most of the time. In this situation, the published works state that these systems must be able to operate for many weeks without changing the batteries [
9]. However, this is only possible because the sampling frequency is very low. In various situations, the data acquisition must be performed at a higher rate, which consumes more energy and reduces battery lifetime. As mentioned in [
13], the sampling frequency cannot be too low to maintain a real-time data acquisition. Another problem is that packet losses due to signal fading in indoor environments also increase power consumption. This situation was studied by Bleda et al. [
28], considering the effect of furniture on communication performance in smart homes. They stated that an increase in power consumption may occur due to the distance between nodes, and the battery life will be shorter.
In this paper, a new technique to power a home monitoring system is proposed. To demonstrate the effectiveness of the solution, a wireless sensor network was deployed in a home to monitor energy consumption and air quality parameters. A study was carried out on the power consumption of the main components of the system, namely in the AC/DC adapters and in the charging process of the lithium batteries. For always powered on sensor nodes and sensor nodes that may enter sleep mode, the power supply will be based on rechargeable batteries. An automatic control system will charge these batteries in a more efficient way. The proposed system also generates all the necessary energy for its operation by energy harvesting from a solar panel. This solution allows the creation of a sustainable home monitoring system.
3. Results
This section presents the results related to several aspects of the power consumption of the sensor nodes. The proposed system was tested to evaluate its efficiency.
3.1. Power Consumption of Sensor Nodes
The power consumption of sensor nodes was measured for three types of power sources: 3.7 V lithium batteries; 12 V batteries; 230 V AC power. The INA219 (Texas Instruments, Dallas, TX, USA) was used to measure the power consumption of the DC sources. The power of the AC source was obtained by measuring the AC voltage and the current. The current sensor was the one shown in
Figure 2, and the average power was determined by using Equation (2).
Figure 6 shows the measured waveforms of AC/DC adapters for the no-load condition.
Figure 6a refers to a 230 V AC to 3.3 V converter, the ECL10US03 from XP Power [
36]. The measured average power was about 110 mW, being inside the range of values given by the manufacturer that is below 300 mW for no load input power.
Figure 6b refers to a 230 V AC to 5 V converter used to charge cellphones. The measured average power was about 81 mW. The power consumption of other AC/DC adapters has been measured and the values can be even higher. These tests reveal the importance of avoiding the use of these adapters that are always connected to the electrical network to power low consumption devices.
Another energy source used in this study was a 12 V battery. In this case, a DC/DC converter was required to obtain 5 V to charge the lithium batteries. The power consumption of a 12 V to 5 V converter was measured for the no-load condition, giving 11.4 mW. Comparing this value with those of AC/DC converters, this result is much lower. It is interesting to note that the usual conversion from 12 V DC to 230 V AC from renewable energy systems to power low voltage equipment introduces a great waste of energy.
For the three mentioned energy sources, the power consumption of the sensor nodes is shown in
Table 1. The tests were carried out with the sensor nodes acting as routers or end devices when transmitting data with a period of 20 s. The results are presented for five nodes, consisting of an energy sensor node operating as a router (R) and another one as an end device (ED), a node to monitor temperature and humidity (T/H) operating as a router and as an end device, and a node to monitor carbon dioxide (CO
2) also being a router. Column two of the table shows the current consumption of these sensor nodes. Column three shows the power consumption for a voltage of 3.3 V. Column four shows the results for these sensor nodes powered by 3.7 V lithium batteries. Because a rechargeable lithium battery operates with voltages between 3.1 and 4.2 V, these measurements were made for different battery charges and the average was obtained. In another experiment, the average voltage during discharge was determined, with a result of about 3.8 V. This result is close to the average voltage used to obtain the values of the fourth column. Column five shows the average power consumption when the energy source was a 12 V battery. Comparing columns five and four, the efficiency of the DC/DC converter is about 56% for routers. Although this converter has an efficiency above 80%, this result is only valid for output currents above 60 mA. For routers, the output current is approximately 23 mA (@12 V). This conversion efficiency is even lower for end devices, giving 24% for the Energy–ED node and 17% for the T/H–ED node. Column six shows the results for sensor nodes powered through an AC/DC adapter of 230 V to 5 V. As expected, the conversion efficiency is low, and compared to the fourth column the efficiency is 42% for routers and below 10% for end devices.
Considering that the sensors used in this study, Arduino and XBee, operate at 3.3 V, the third column of
Table 1 refers to the power consumption of each sensor node. Thus, these values can be used as a reference for the efficiency calculations.
Figure 7 shows the efficiencies of the sensor nodes for the three energy sources. The efficiency of routers and end devices is above 85% when the sensor nodes are powered by 3.7 V batteries. For this energy source, there is practically no difference in efficiency when a sensor node operates as a router or as an end device. For the 12 V battery, the results are below 50% for routers and below 21% for end devices. In this case, there is a great waste of energy when the end devices were continuously connected to this source. When the energy source is the 230 V mains supply, the efficiencies are about 36% for routers, 9% for the Energy–ED node, and 4% for the T/H–ED node. These very low efficiencies have led to the use of batteries to power end device sensor nodes. Even for routers, the use of AC/DC adapters connected to the main power results in small efficiencies. Considering that these nodes are consuming about three times more energy than necessary and because AC/DC adapters are proposed in many studies to power routers, a more efficient way of power supply is required.
In addition to the sensor nodes, the system includes other components consuming energy, such as the home server. The Raspberry Pi 3 model B requires a power source of 5.1 V. For the Raspberry Pi [
37], the typical bare-board active current consumption is 400 mA, giving a power consumption of 2.04 W. This consumption can be higher depending on what is connected to the Raspberry. Due to the higher power requirements, the Raspberry Pi must use 12 V batteries or the 230 AC source. The average power consumption measured was 2.25 W for the 12 V battery. The minimum consumption was 2.1 W, and peaks of 5 W were obtained. This power source can be very efficient to operate the Raspberry because typical 12 V to 5 V converters have a high efficiency for higher current consumption. The average power consumption measured for the 230 V AC source was 2.58 W. The server also includes an LCD display that consumes an average 3.8 W when connected to 12 V and 4.1 W when connected to 230 V. It should be noted the Raspberry Pi is always connected to the power supply, and the display is only turned on when it is necessary to access the data.
3.2. Energy Consumption for Charging Lithium Batteries
From
Figure 7, it may be concluded that low voltage batteries are the most effective way to power sensor nodes. However, this requires periodic charging. Three battery capacities were considered to evaluate the energy consumed in this process.
Figure 8 shows the time evolution of power consumption to charge a 1800 mAh lithium battery from the 12 V battery. Considering an SoCV of 3.5 V, the average power consumption was 3.55 W for a time interval of 2 h and 30 min, giving an energy consumption of 31950 J. The energy consumption was also measured for batteries of 980 mAh and 2500 mAh, giving the results shown in
Figure 9. The graph also provides the results for the 230 V AC power supply. Charging from 12 V consumes 81%, 87%, and 91% compared to charging from 230 V, for 980 mAh, 1800 mAh, and 2500 mAh batteries, respectively. The relative difference in energy consumption between both cases is smaller for batteries of greater capacity.
Another study with battery charging was to assess the influence of the SoCV on efficiency.
Figure 10 shows the energy consumed to charge a 1800 mAh battery for different SoCVs. The power supply used in the measurements was 230 V AC.
3.3. Energy Consumed with Charging Control
In the previous subsection, the energy consumed to charge a 1800 mAh lithium battery for different SoCV was evaluated. On the other side, the energy consumed by a sensor node, so that the battery reaches an end of discharge equal to the SoCV represented in
Figure 10, will be evaluated. The reason for this is that higher SoCV values require less energy consumption, but the battery does not last as long.
Figure 11a shows the results when suppling power to a router. Comparing with the required energy to charge the battery (
Figure 10),
Figure 11b shows the efficiency of energy consumption in discharge. It is observed that greater efficiencies are obtained for lower values of end of discharge. Because the difference in the amount of energy is negligible between 3.3 V and 3.5 V, a value of 3.5 V was chosen for the end of discharge so as to not stress the batteries. For this situation, the efficiency of the system was 57%.
The discharge time of the batteries was measured when feeding the sensor nodes shown in
Table 1. As expected, the duration of the battery is proportional to the battery capacity. The battery life of routers was less than a day for the capacity of 980 mAh, about a day and a half for the capacity of 1800 mAh, and more than two days for 2500 mAh. The battery life of end devices was of several weeks. The energy consumed to charge the batteries shown in
Figure 9 was divided by the time taken by the battery to reach the 3.5 V EoCV. This allows one to determine the average power consumption when using the proposed system. Then, the efficiencies were determined considering the reference values presented in the third column of
Table 1.
Figure 12 shows the results for two routers and two end devices. The results of the T/H-R node are not shown as they are similar to those of the Energy-R node. “Plug” refers to the efficiencies represented in
Figure 7 for two situations.
Figure 12a shows the results for the 230 V AC supply, and
Figure 12b shows the results for the 12 V DC supply. Because the end devices do not require high battery capacities, no results were obtained with 2500 mAh batteries for these nodes.
For the batteries charged by the 230 V AC system, the efficiencies are about 50% for both types of sensor nodes. The improvement in the efficiencies of routers with the proposed system was, on average, 28%. The improvement in the efficiencies of end devices was, on average, 87%. For batteries charged by the 12 V DC system, the improvements are smaller than those in the previous case, but higher efficiencies were still obtained. The improvement in the efficiency of end devices was, on average, 71%, with efficiencies close to 60%.
3.4. Energy Harvesting
The monitoring system contains ten sensor nodes measuring energy consumption and air quality parameters. Before applying the power supply technique proposed in this study, the network was tested for a year to evaluate some practical characteristics. Two sensor nodes were defined as routers and eight as end devices. The end devices were battery operated. The parameter RSSI (Received Strength Signal Indicator) was measured and stored in the database to monitor the quality of the radio signals. Over time, it was found that the end devices occasionally lost their connection to the network for long periods. Evaluating the RSSI, the loss of connection did not seem to be due to the loss of radio signal. A possible reason for this loss could be the frequency range used by the system, since ZigBee and Wi-Fi operate in the same band. As a result, the loss of connection of a sensor node increased the power consumption due to data retransmission. Another problem faced was the recharging of batteries. Although the battery life was of several weeks, on average it was necessary to replace a battery every two weeks. This required constant monitoring of battery levels. Therefore, during the experiment, some batteries have run out of power and data has been lost. The way to solve this problem is to avoid the need for human intervention in the functioning of the network and make it fully automatic.
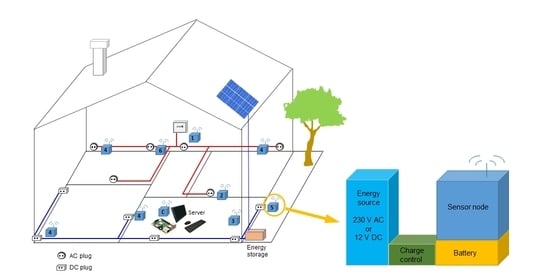
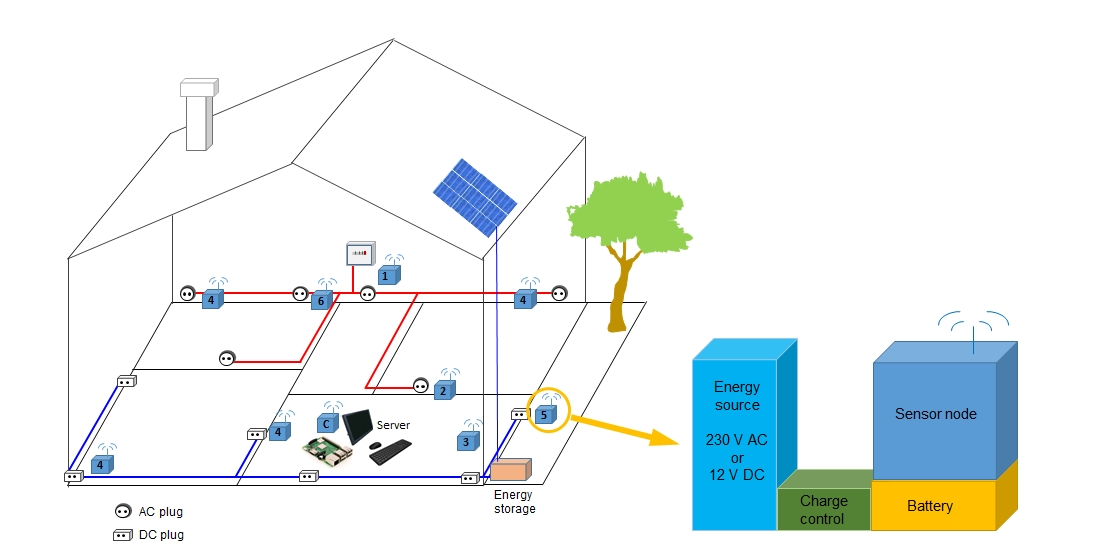
The experience gained from the tests carried out led to an increase in the number of routers. With five routers, the network has become much more stable. The problem of battery charging was solved by using the proposed system. The proposed system also uses energy harvesting to provide all energy necessary to operate the monitoring network, as shown in
Figure 1.
Figure 13 shows the average power production per month for the year 2020. The residence is located in the city of Funchal, Madeira Island.
The average power consumption of the developed system is 3.8 W. For this result, the LCD was considered to be turned on for half an hour a day. As can be observed from
Figure 13, the system generated more than the required energy in all months of this year. The worst month was December, with an average power production of 7 W. Because the energy production is not constant, the energy generation per day was evaluated for this month. On cloudy days, the energy generation was not enough to compensate the consumption. The power generation only exceeded the power consumption for an average of four days. The 100 Ah battery at full charge guarantees a system operating autonomy for more than ten days.
4. Discussion
The proposed technique of power supply home monitoring systems has several advantages, such as:
Decreasing the power consumption of routers;
Allowing an increase in the number of routers to increase network reliability;
Reducing costs by avoiding the use of alkaline batteries;
Avoiding the changing of batteries;
Allowing higher sampling frequencies of data with a reduced effect in power consumption;
Reducing loss of data by avoiding human intervention;
Reducing to zero the energy consumption from the main home power system;
Providing all energy via a renewal energy source;
Allowing the accommodation of higher power consumption to use low-cost sensors;
Providing a battery powered backup in case of mains power failure;
Extending battery lifetime due to not maintaining the battery at full charge.
In a ZigBee network, routers must always be powered on to allow routing data from other routers and end devices. Thus, the power consumption is high because they must be connected to the home’s power system. It was important to develop techniques to reduce this waste of energy. As shown in
Figure 12, the proposed system increased the power supply efficiency from about 36% to about 58%. Tests carried out in this work have shown that it may be effective to increase the number of routers to avoid loss of data by the ZigBee network. The renewable energy system allowed it to accommodate this increase of power consumption.
In several studies and many commercial devices, sensor nodes operating in sleep mode use alkaline batteries. This power source provides very high power supply efficiency. However, to control the consumption, data is sampled at very low frequencies. Furthermore, periodic change of batteries is required. To understand the cost associated with this solution, let us compare the price of batteries with the price of electricity. A pack of four AA-alkaline batteries usually costs more than €2. Supposing a battery lifetime of two months, and that an end device uses two batteries, the cost of batteries is 6 €/year per end device. Taking into account the prices of electricity in Portugal of about 0.18 €/kWh and an average power consumption of 10 mW for an end device using the proposed system, the energy cost is only 0.016 €/year. The use of rechargeable batteries reduces the costs in comparison to the use of alkaline batteries, but still requires a change of batteries. The proposed system avoids this change of batteries and keeps power consumption low. Another great advantage of the automatic recharging of end devices is to increase the sampling frequency of data. In fact, the typical usage of systems that run on batteries are only viable with low sampling frequencies to maximize battery lifetime. However, as mentioned in [
13], to maintain a real-time sampling, some mechanism must exist to reduce power consumption. With the proposed technique, the sampling period may be as desired because the power consumption of end devices is low, as can be seen from
Figure 12. In addition, removing the manual intervention reduces the probability of any possible loss of data due to human errors.
Energy harvesting is mandatory for outdoor systems operating in remote environments. For indoor monitoring systems, there are practically no energy harvesting systems because of the easy access to the power sources. As a home energy monitoring system aims to reduce energy consumption, it is important that the system avoids any increase in energy consumption. Harvesting from solar energy is a good solution for powering home monitoring systems, because a small photovoltaic panel placed on a roof or in any other small area oriented towards the sun generates all the energy required by the system.
Various published works propose batteries to support backup in the case of temporary power failure. The proposed system also solved this problem because all sensor nodes are battery powered.
5. Conclusions
In this work, a smart technique was proposed to power home monitoring systems. A wireless sensor network based on ZigBee was developed to test the proposed solution. The system measures energy consumption and air quality parameters. The charging process is controlled by a low-cost microcontroller through relays connected between the main power source and the charging system. Considering a router using a 230 V AC adapter, the power consumption is almost three times the power consumed by the node. It was verified that high power efficiencies are obtained if a low voltage device is powered by a low power system. In this case, low voltage batteries must be used. However, this solution has several drawbacks. Alkaline batteries are very expensive compared to the cost of energy. Rechargeable batteries require charging or changing batteries, which in many practical situations is carried out by human intervention. Furthermore, the data sampling frequency must be very low to decrease power consumption. The use of the main energy network to power monitoring systems is a very attractive solution as it removes human intervention and ensures continuous energy supply. Nevertheless, its efficiency is very low when applied to low power systems. To combine the advantages of both sources of energy, the proposed technique uses rechargeable batteries to power all sensor nodes, combined with a controlled charging system connected to the main power supply. The tests to evaluate the appropriate SoCV revealed that greater efficiencies are obtained if most of the energy stored in the batteries is used in the discharge process. For the routers, the proposed technique increased the power supply efficiency from about 36% to about 50% when using 230 V AC adapters and to about 58% when using 12 V DC batteries. End devices have been typically battery operated. In this work, end devices used 230 V AC plugs or 12 V DC batteries with power supply efficiencies between 50% and 60%. Furthermore, a small energy harvesting system based on a solar panel supplies all energy needed for the monitoring system. For a network with ten sensor nodes, the average power consumption was about 3.8 W. In 2020, the 80 W solar panel generated, on average, 8.4 W. The generated energy provided all energy consumed, and the extra production can be used to accommodate higher power consumption to use low-cost sensors. Future works include studying the application of the proposed technique to other low-power systems.


