Article

Numerical Study on Energy-Saving Performance of a New Type of Phase Change Material Room

1
School of Chemistry and Chemical Engineering, ZhongKai University of Agriculture and Engineering, Guangzhou 510225, China
2
Key Laboratory of Enhanced Heat Transfer and Energy Conservation, The Ministry of Education, School of Chemistry and Chemical Engineering, South China University of Technology, Guangzhou 510640, China
3
Guangdong Engineering Technology Research Center of Efficient Heat Storage and Application, South China University of Technology, Guangzhou 510640, China
*
Author to whom correspondence should be addressed.
Energies 2021, 14(13), 3874; https://doi.org/10.3390/en14133874
Submission received: 31 May 2021 / Revised: 19 June 2021 / Accepted: 21 June 2021 / Published: 28 June 2021

Abstract

:
The thermal performance of a phase change energy storage building envelope with the ventilated cavity was evaluated. CaCl2·6H2O-Mg(NO3)2·6H2O/expanded graphite (EG) was employed to combined with the building for year-round management. The energy consumption caused by the building under different influence parameters was evaluated numerically. The results indicated that CaCl2·6H2O-8wt %Mg(NO3)2·6H2O/EG should be installed on the south wall for the heating season, while CaCl2·6H2O-2wt %Mg(NO3)2·6H2O/EG should be integrated on the roof for the cooling season. When the air layer was ventilated and the south wall was coated with the solar absorbing coating, the room could save approximately 30% of energy consumption. Moreover, the energy consumption increased with an increase in the air layer thickness, and the air layers played a different role in the building envelope. The optimal value of the flow rate between air layer 2, air layer 3, and the room was 0.09 m3/s. To reduce the energy consumption, the phase change materials (PCMs) with large and small thermal conductivity should be installed in the south wall and roof, respectively. In general, the phase change energy storage building envelope with the ventilated cavity can save energy during the heating and cooling seasons.

1. Introduction

The three major energy-consuming sectors of China are industry, transportation, and building. The energy consumption of buildings accounts for a large proportion of the nation’s total energy use [1]. In buildings, heating, ventilation, and air conditioning (HVAC) systems are employed to meet people’s comfort requirements, which leads them to consume more energy [2,3]. Note that the building envelope is closely associated with the heat gain and loss of buildings [4,5]. Therefore, exploring novel building envelopes with enhanced heat preservation and heat insulation performance is of great significance for building energy conservation.
Phase change material (PCM) is a substance that can absorb or release a large amount of heat during the phase change process, which allows the efficient storage and utilization of energy [6,7,8,9,10]. A thermal energy storage system based on PCMs can provide an effective way for building energy conservation. The application of PCMs in the building can be classified as active and passive energy storage systems [11,12]. In the active energy storage systems, electrical equipment such as fans is employed to control the phase change process of PCMs, which can facilitate the melting and solidification of PCMs [13,14]. However, for some complex equipment and technologies, the economic benefits and investment payback period need to be analyzed carefully. As for the passive energy storage systems, it is more popular because of its economy and simplicity. The energy storage and release of PCMs depend on the ambient temperature [15,16,17]. It is noted that if the temperature change is relatively small at the position where the PCMs are located, the PCMs cannot be fully utilized. Moreover, the efficiency of PCMs is also affected by the building orientation, installation location, etc. [18,19,20]. Therefore, it is necessary to integrate passive energy storage using PCMs with active adjusting technology for achieving better energy savings.
To achieve better energy saving, natural or mechanical ventilation has been adopted to improve the utilization efficiency of PCMs [21,22,23,24]. Solgi et al. [25] evaluated the influence of night ventilation on the performance of a typical office building containing PCMs. They found that PCMs combined with night ventilation could significantly reduce the average room temperature and improve indoor thermal comfort. Moreover, the heat release of PCMs at night increased with the increase of the air change rate or the decrease of the outdoor temperature. Zhang et al. [26] studied the thermal performance and energy performance of the building containing PCM under different ventilation conditions from June to September. The results showed that night ventilation could more effectively improve the indoor thermal environment and reduce cooling energy consumption. In addition, the improvement effect of PCM on indoor thermal comfort increased as the amount of ventilation increased. Liu et al. [27] investigated the suitability of PCM coupled with night ventilation in transition and hot seasons. It was found that the optimal phase change temperature range of the PCM was between 23 °C and 29 °C. Compared with night ventilation alone, the strategy of applying PCM combined with night ventilation could reduce the discomfort hours in the transition season by at least 16%. Adilkhanova et al. [28] studied the potential of PCM and natural ventilation to enhance the thermal performance of a lightweight, relocatable building. The results showed that the combination of PCM26 and night ventilation resulted in the building’s best thermal performance, which allowed the value of total discomfort change and storage efficiency to reach 1818 and 39.1%, respectively. Gvola et al. [29] presented and evaluated a new method to improve the effectiveness of the PCM wallboard by means of a ventilated cavity. The ventilated cavity was arranged on the partition wall. By introducing outdoor air into the ventilated cavity at night, the solidification process of PCMs could be accelerated. Compared with the PCM room without the ventilated cavity, the average peak temperature of the PCM room with the ventilated cavity decreased by 0.3 °C, the frequency of thermal comfort increased by 8.1%, and the intensity of thermal discomfort decreased by 16.7%. Additionally, the storage efficiency of the PCM was also improved. However, night ventilation is only suitable for the cooling season. In addition, most studies only investigated the energy-saving effects of a PCM in a certain season, which cannot achieve the purpose of building year-round thermal management.
Recently, Luo et al. [30] put forward a novel dual-channel solar PCM storage wall system, which had the functions of passive solar heating, passive cooling, heat insulation, and heat preservation. In the summer test, the external and internal vents were kept open and closed, respectively, while the middle layer vents were closed during the day and opened at night. In the winter test, the external vents remained closed, while the middle layer and internal vents were opened during the day and closed at night. The results showed that the system could prevent overheating in summer and increase the maximum and average temperature in winter. However, the room temperature was too high in winter (above 30 °C). Moreover, according to the temperature of the PCM plate, it could be known that the PCM was in a molten state for most of the summer, and it was in a solidified state for most of the winter. Since the PCM plate was close to the outdoor environment, it was greatly affected by the outdoor temperature to an extent that the PCMs could not fully play its role. Therefore, the wall structure design needs to be further optimized. In addition, it is worth mentioning that the PCM plate was the commercial organic PCMs, which is expensive and flammable. To solve the investment cost and flammability problem, it can be inferred that integrating the inorganic PCMs with low price, nonflammable and phase change temperatures close to the comfortable temperature of the human body into novel building envelopes will be highly desirable.
In our previous work [31,32], a new type of PCM room containing CaCl2·6H2O-Mg(NO3)2·6H2O/EG (CM/EG) with different phase change temperatures was put forward. The results showed that the composite PCMs could improve the phase separation and supercooling of hydrated inorganic salts, and it had a practical application prospect. To further improve the utilization efficiency of PCMs and reduce the energy consumption of the room, a phase change energy storage building envelope with the ventilated cavity was proposed in this paper, in which the ventilated cavity was located on the roof and the south wall, respectively. By combining the ventilated cavity with PCMs, the problem of room overheating would be improved, and the purpose of year-round thermal management of the room would be realized. Firstly, the thermal characteristic of the phase change energy storage building envelope with or without ventilation was investigated. Additionally, then, the influence of phase change temperature, solar absorbing coating, air layer thickness, airflow rate, and thermal conductivity of PCMs on the room energy consumption was evaluated. This research explored the application of inorganic composite PCMs in the building envelope based on solar walls and evaluated its dynamic characteristics under different conditions, which had not been reported in the literature before. Through numerical simulation, it was found that the existence of the ventilated cavity could promote the heat storage and heat release of PCMs, thus further reducing the energy consumption of the room. When the air layer was ventilated, and the south wall was coated with the solar absorbing coating, the room had the best energy-saving potential.

2. Numerical Model

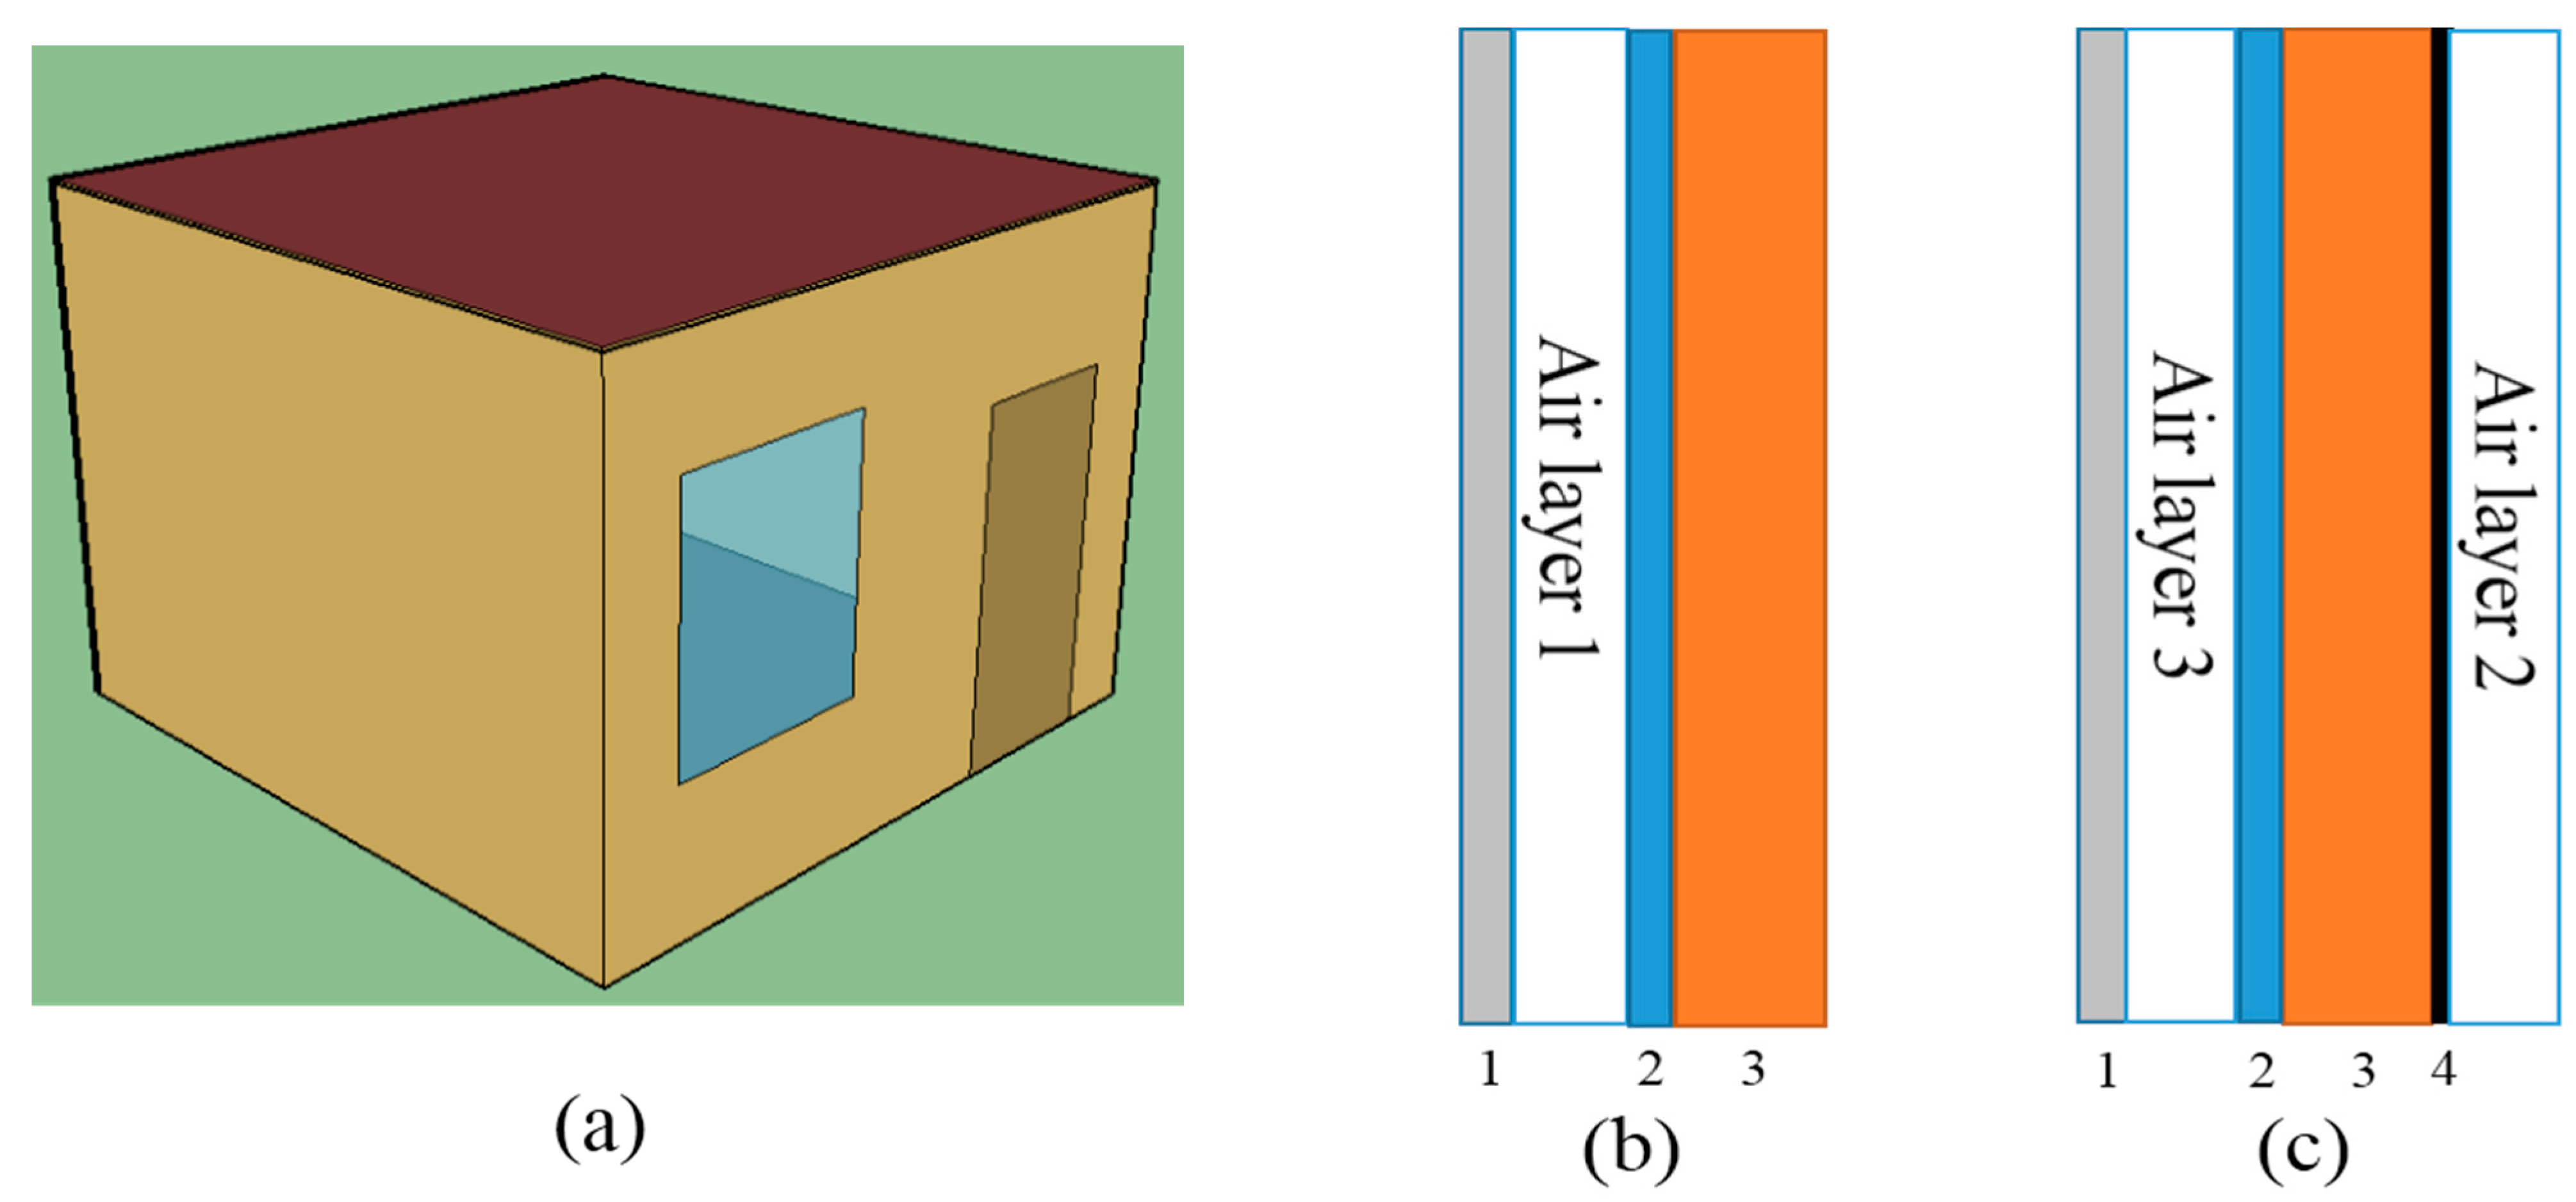
2.1. The Description of the Physical Model

As shown in Figure 1a, a single-zone building was selected for simulation. The dimensions of the building prototype were 4.0 m width × 4.0 m length × 3.0 m height with a window (1.2 m width × 1.5 m height) and door (0.9 m width × 2.1 m height) located on the north wall and a solar wall (3.8 m width × 2.8 m height) located on the south wall. To transfer more heat to the room during the heating season, the outer surface of the south wall was covered with a solar absorbing coating. The thermal absorptance, solar absorptance, and visible absorptance of the solar absorbing coating were 0.05, 0.85, and 0.85, respectively. Additionally, the schematic of the roof and south wall are shown in Figure 1b,c, respectively, where the air layer could be used for ventilation. The construction details of the building and the thermophysical properties of the materials used in the building are presented in Table 1 and Table 2, respectively. Based on our previous work [31], CM/EG was employed as the PCMs. The enthalpy temperature curves of CM/EG with different mass fractions of Mg(NO3)2·6H2O are shown in Figure 2. The composite PCMs with magnesium nitrate hexahydrate contents of 0, 2, 5, 8, 10, 12, and 15 wt % were recorded as PCM0, PCM2, PCM5, PCM8, PCM10, PCM12, and PCM15, respectively. Among them, the PCM with lower phase change temperature would be installed on the south wall for the heating season, while the PCM with higher phase change temperature would be integrated on the roof and the other three walls for the cooling season.

2.2. Numerical Methods

EnergyPlus includes two different options for the specific scheme or formulation used for the finite difference model, namely, the fully implicit scheme and the Crank–Nicholson scheme. In this study, version 8.4 of Energyplus with Crank–Nicholson scheme was employed. The model equation for the scheme is given in Equation (1) as follows:
C P ρ Δ x T i j + 1 T i j Δ t = 1 2 ( k W T i + 1 j + 1 T i j + 1 Δ x + k E T i 1 j + 1 T i j + 1 Δ x + k W T i + 1 j T i j Δ x + k E T i 1 j T i j Δ x )
where Cp (J·kg−1·K−1) = specific heat of material; Δx (m) = finite difference layer thickness (always less than construction layer thickness); ρ (kg·m−3) = density of material; T (°C) = node temperature; kW (W·m−1·K−1) = thermal conductivity of interface between i node and i + 1 node; kE (W·m−1·K−1) = thermal conductivity of interface between i node and i − 1 node; Δt = calculation time step; i = node being modeled; i + 1 = adjacent node to interior of building structure; i − 1 = adjacent node to exterior of building structure; j = previous time step and j + 1 = new time step.
Then, Equation (1) is accompanied by Equation (2) which relates enthalpy and temperature,
  h i = H T F ( T i )
where hi (J·kg−1) = node enthalpy; HTF = enthalpy–temperature function.
In the conduction finite difference (CondFD) model, surface discretization depends on Equation (3) as follows:
Δ x = C α Δ t = α Δ t F o
where C = space discretization constant; α (m2·s−1) = thermal diffusivity of the material; Fo = Fourier Number.
Due to the iteration scheme used for CondFD, the node enthalpies are updated at each iteration, and then a variable Cp is developed, which is written as Equation (4).
C p = h i , n e w h i , o l d T i , n e w T i , o l d
The Chinese Standard Weather Data (CSWD) of Ningxia Yinchuan was used for the simulation. The time step and space discretization constant were set to 3 min and 3, respectively. The outside and inside surface heat transfer convection algorithms were DOE-2 and Thermal Analysis Research Program (TARP), respectively.
To simulate the airflow between different air layers, the “Zone Mixing” and “Zone Cross Mixing” object was used. In addition, the objects “Zone Ventilation: Design Flow Rate” and “Zone Infiltration: Design Flow Rate” were employed to simulate the natural ventilation of the air layer and infiltration ventilation of the building, respectively. The “HVAC Template: Zone: Ideal Loads Air System” object was used to calculate the heat and cold load of the building. The building was exposed to the outdoor environment except for the floor. Therefore, the “Ground Heat Transfer: Slab” object was employed to simulate the heat transfer process between the ground and floor.

2.3. Operational Conditions

From the perspective of energy saving, the air conditioning temperature of the building was set to 18 °C during the heating season (01/11–31/03) and 26 °C during the cooling season (01/06–31/08). Moreover, other months were considered as the transition season, and the air conditioning system was turned off. The rate of infiltration ventilation was set to 0.5 ACH, which could meet the purpose of hygiene. To prevent the building from overheating during the cooling season and to transfer more heat into the building during the heating season, the specific ventilation mode of the air layer is shown in Table 3. All flow rates were set to 0.1 m3·s−1.
During the cooling season, in order to allow the PCM integrated into the roof to release the heat stored during the day, the air layer 1 would be ventilated between 20:00 and 06:00 by utilizing the cold air at night. Since Ningxia belongs to the severe cold region, the air layer1 was only ventilated during the hottest month (01/07–31/07). In addition, due to the presence of the solar absorbing coating on the south wall, air layer 2 was always ventilated except for the heating season (01/11–31/03) to prevent too much heat from entering the room.
During the heating season, the cold indoor air would pass through air layer 2. Due to the presence of the solar absorbing coating on the south wall, air layer 2 had a higher air temperature; thus, the incoming cold air could be heated. Subsequently, the hot air flowed to air layer 3 at a certain rate. At this point, part of the heat in the hot air was absorbed and stored by the PCM, and part of the heat flowed into the room. Due to the slightly higher outdoor temperature and solar radiation in November and March, ventilation among air layer 2, air layer 3, and the room was only performed from 01/12 to 28/02, and the daily ventilation time was from 11:00 to 19:00. Moreover, to prevent cold air from entering the room at night, air layer 2 would be closed from 19:00 to 11:00, while air layer 3 and the room still ventilated to each other. At this time, the cooler air in the room entered air layer 3, which contributes to the solidification of the PCM, and the heat released by the PCM can also be introduced into the room more quickly. In November and March, ventilation between air layer 3 and the room would be performed all the time. During the daytime, since the heat in air layer 2 had gradually weakened after passing through the wall, the temperature of air layer 3 was not particularly high. In other words, the air in air layer 3 could directly lead to the room without causing the room temperature to be too high.

2.4. Validation

It is worth mentioning that the simulation model of EnergyPlus had been verified by the EnergyPlus development team [33] and many researchers [17,34,35,36]. For the PCM model in EnergyPlus, Tabares-Velasco et al. [37] had validated and verified it using an approach similar to ASHRAE Standard 140. In addition, many researchers had also verified the PCM algorithm in EnergyPlus with the help of experimental data [38,39,40]. The data showed that the experimental and simulation results were in good agreement. Therefore, the PCM model was reliable.

3. Results and Discussion

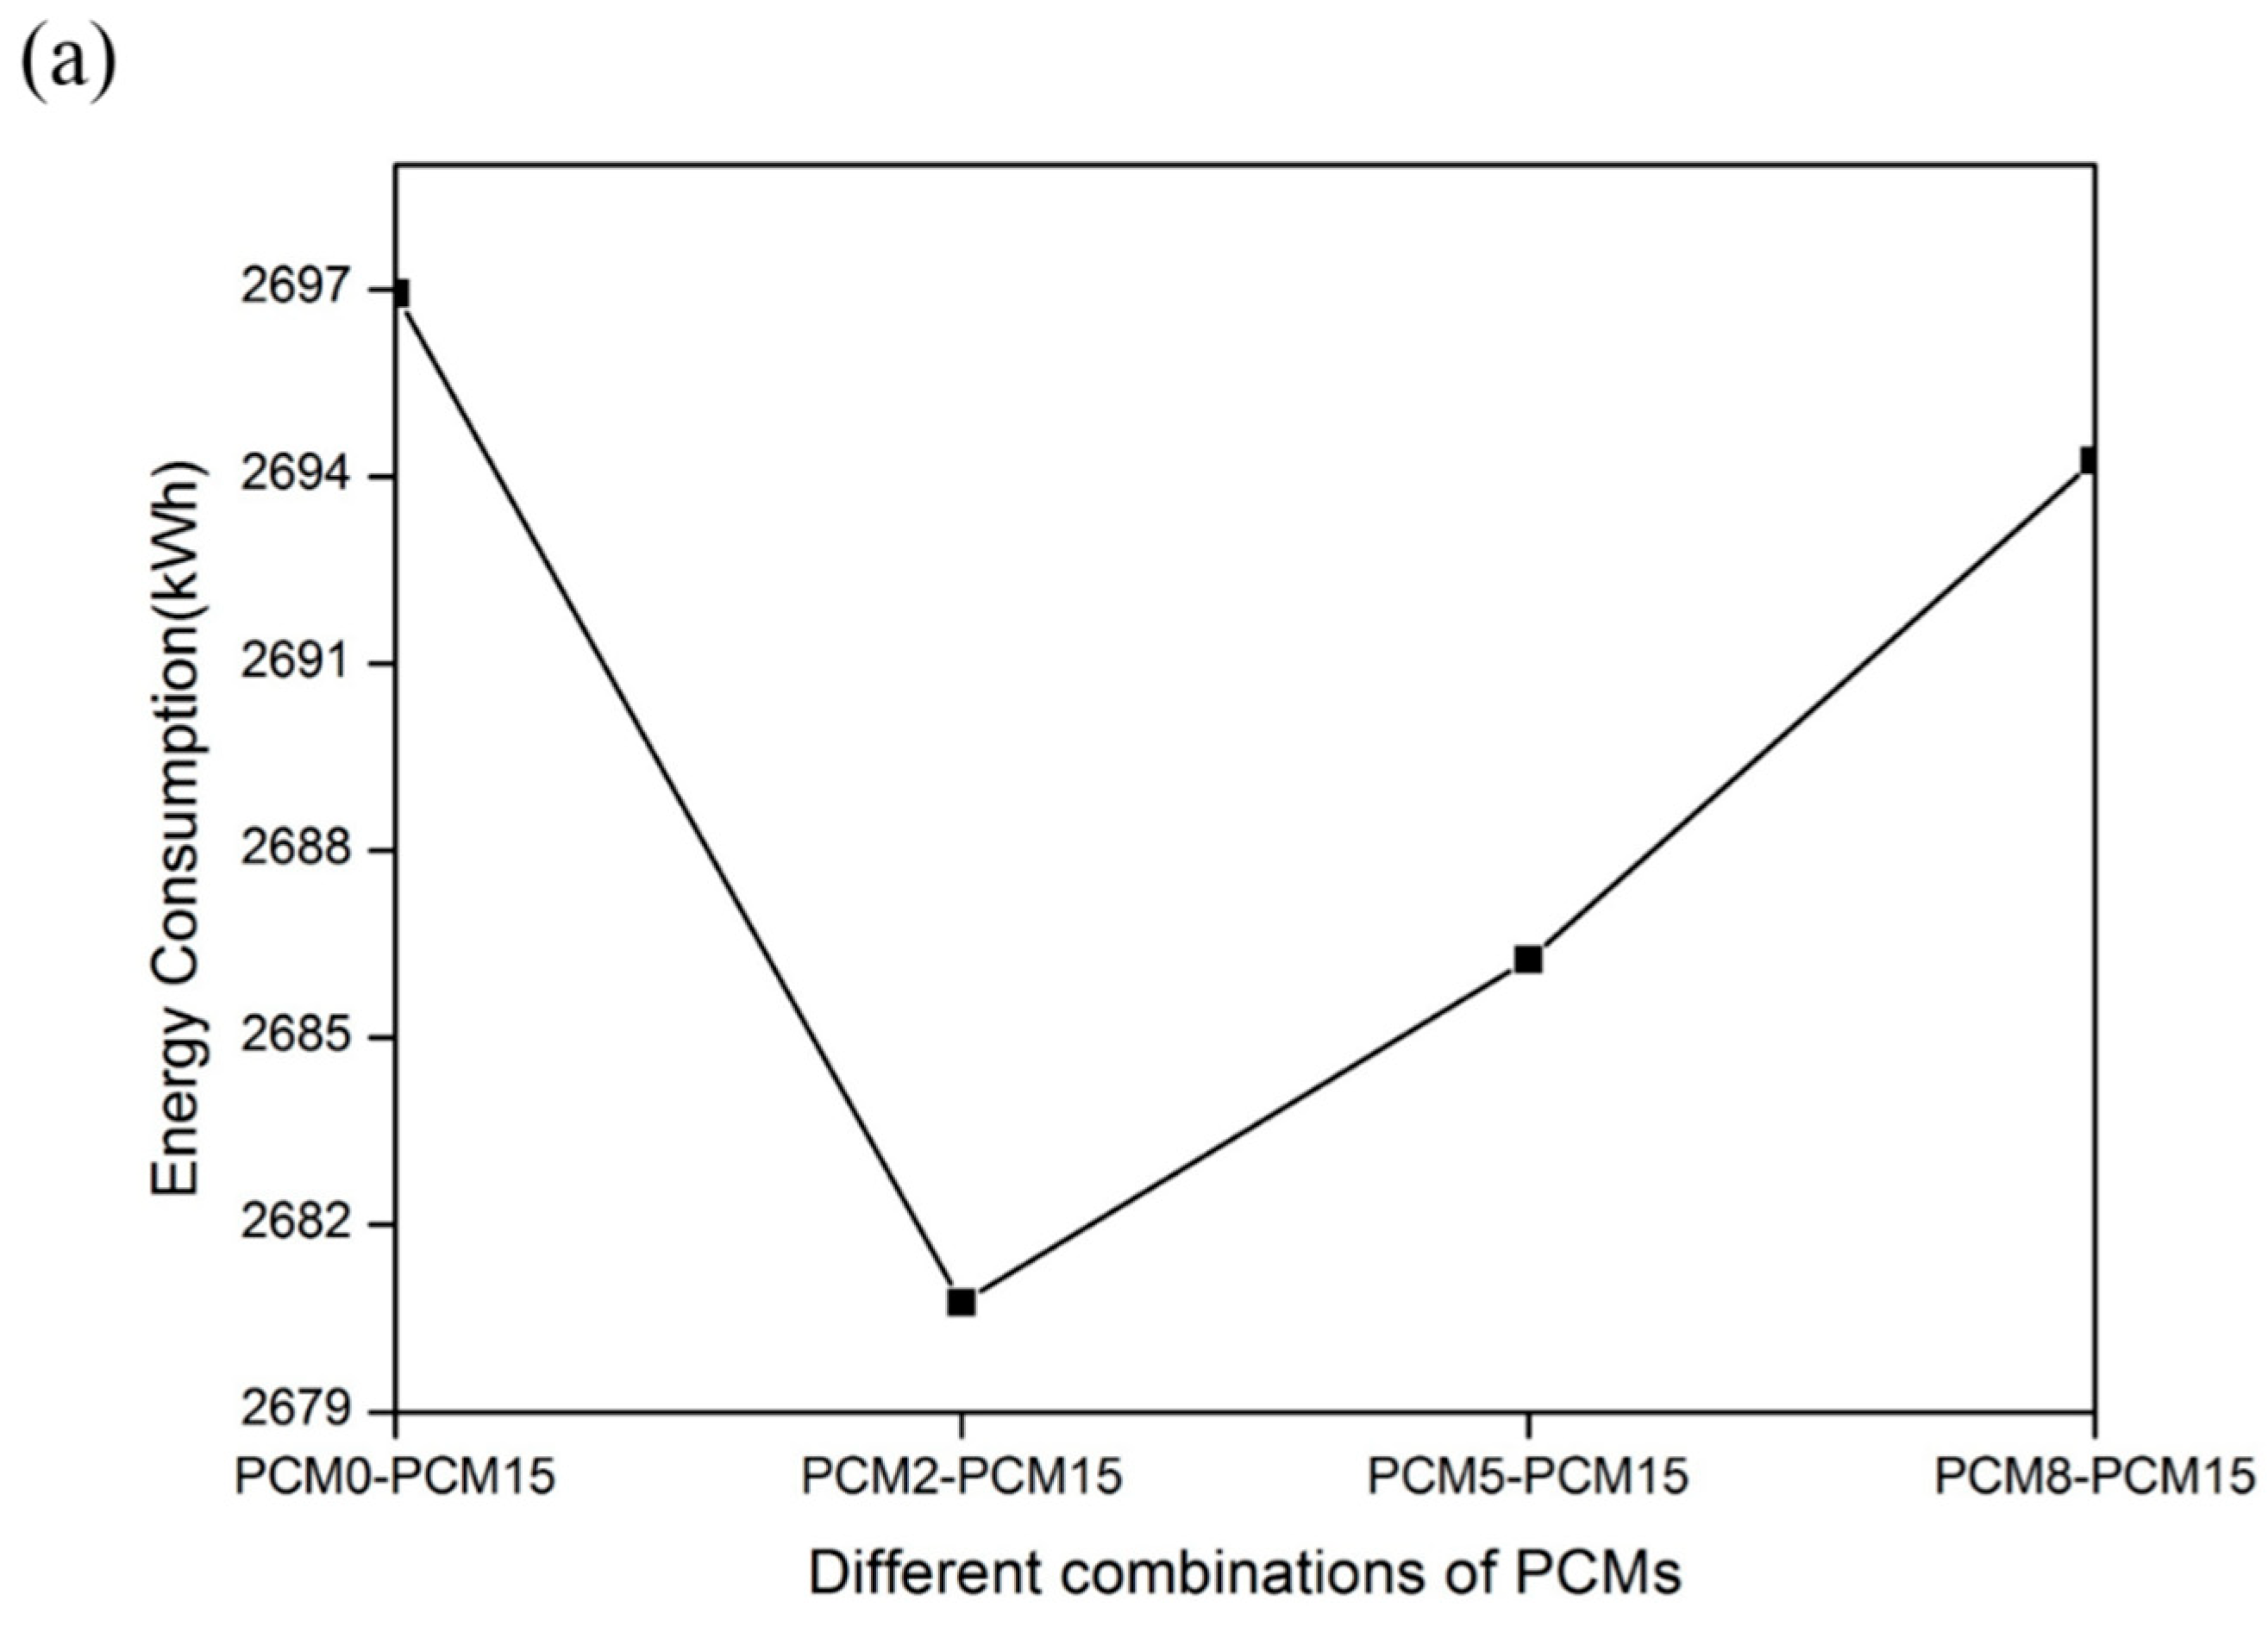
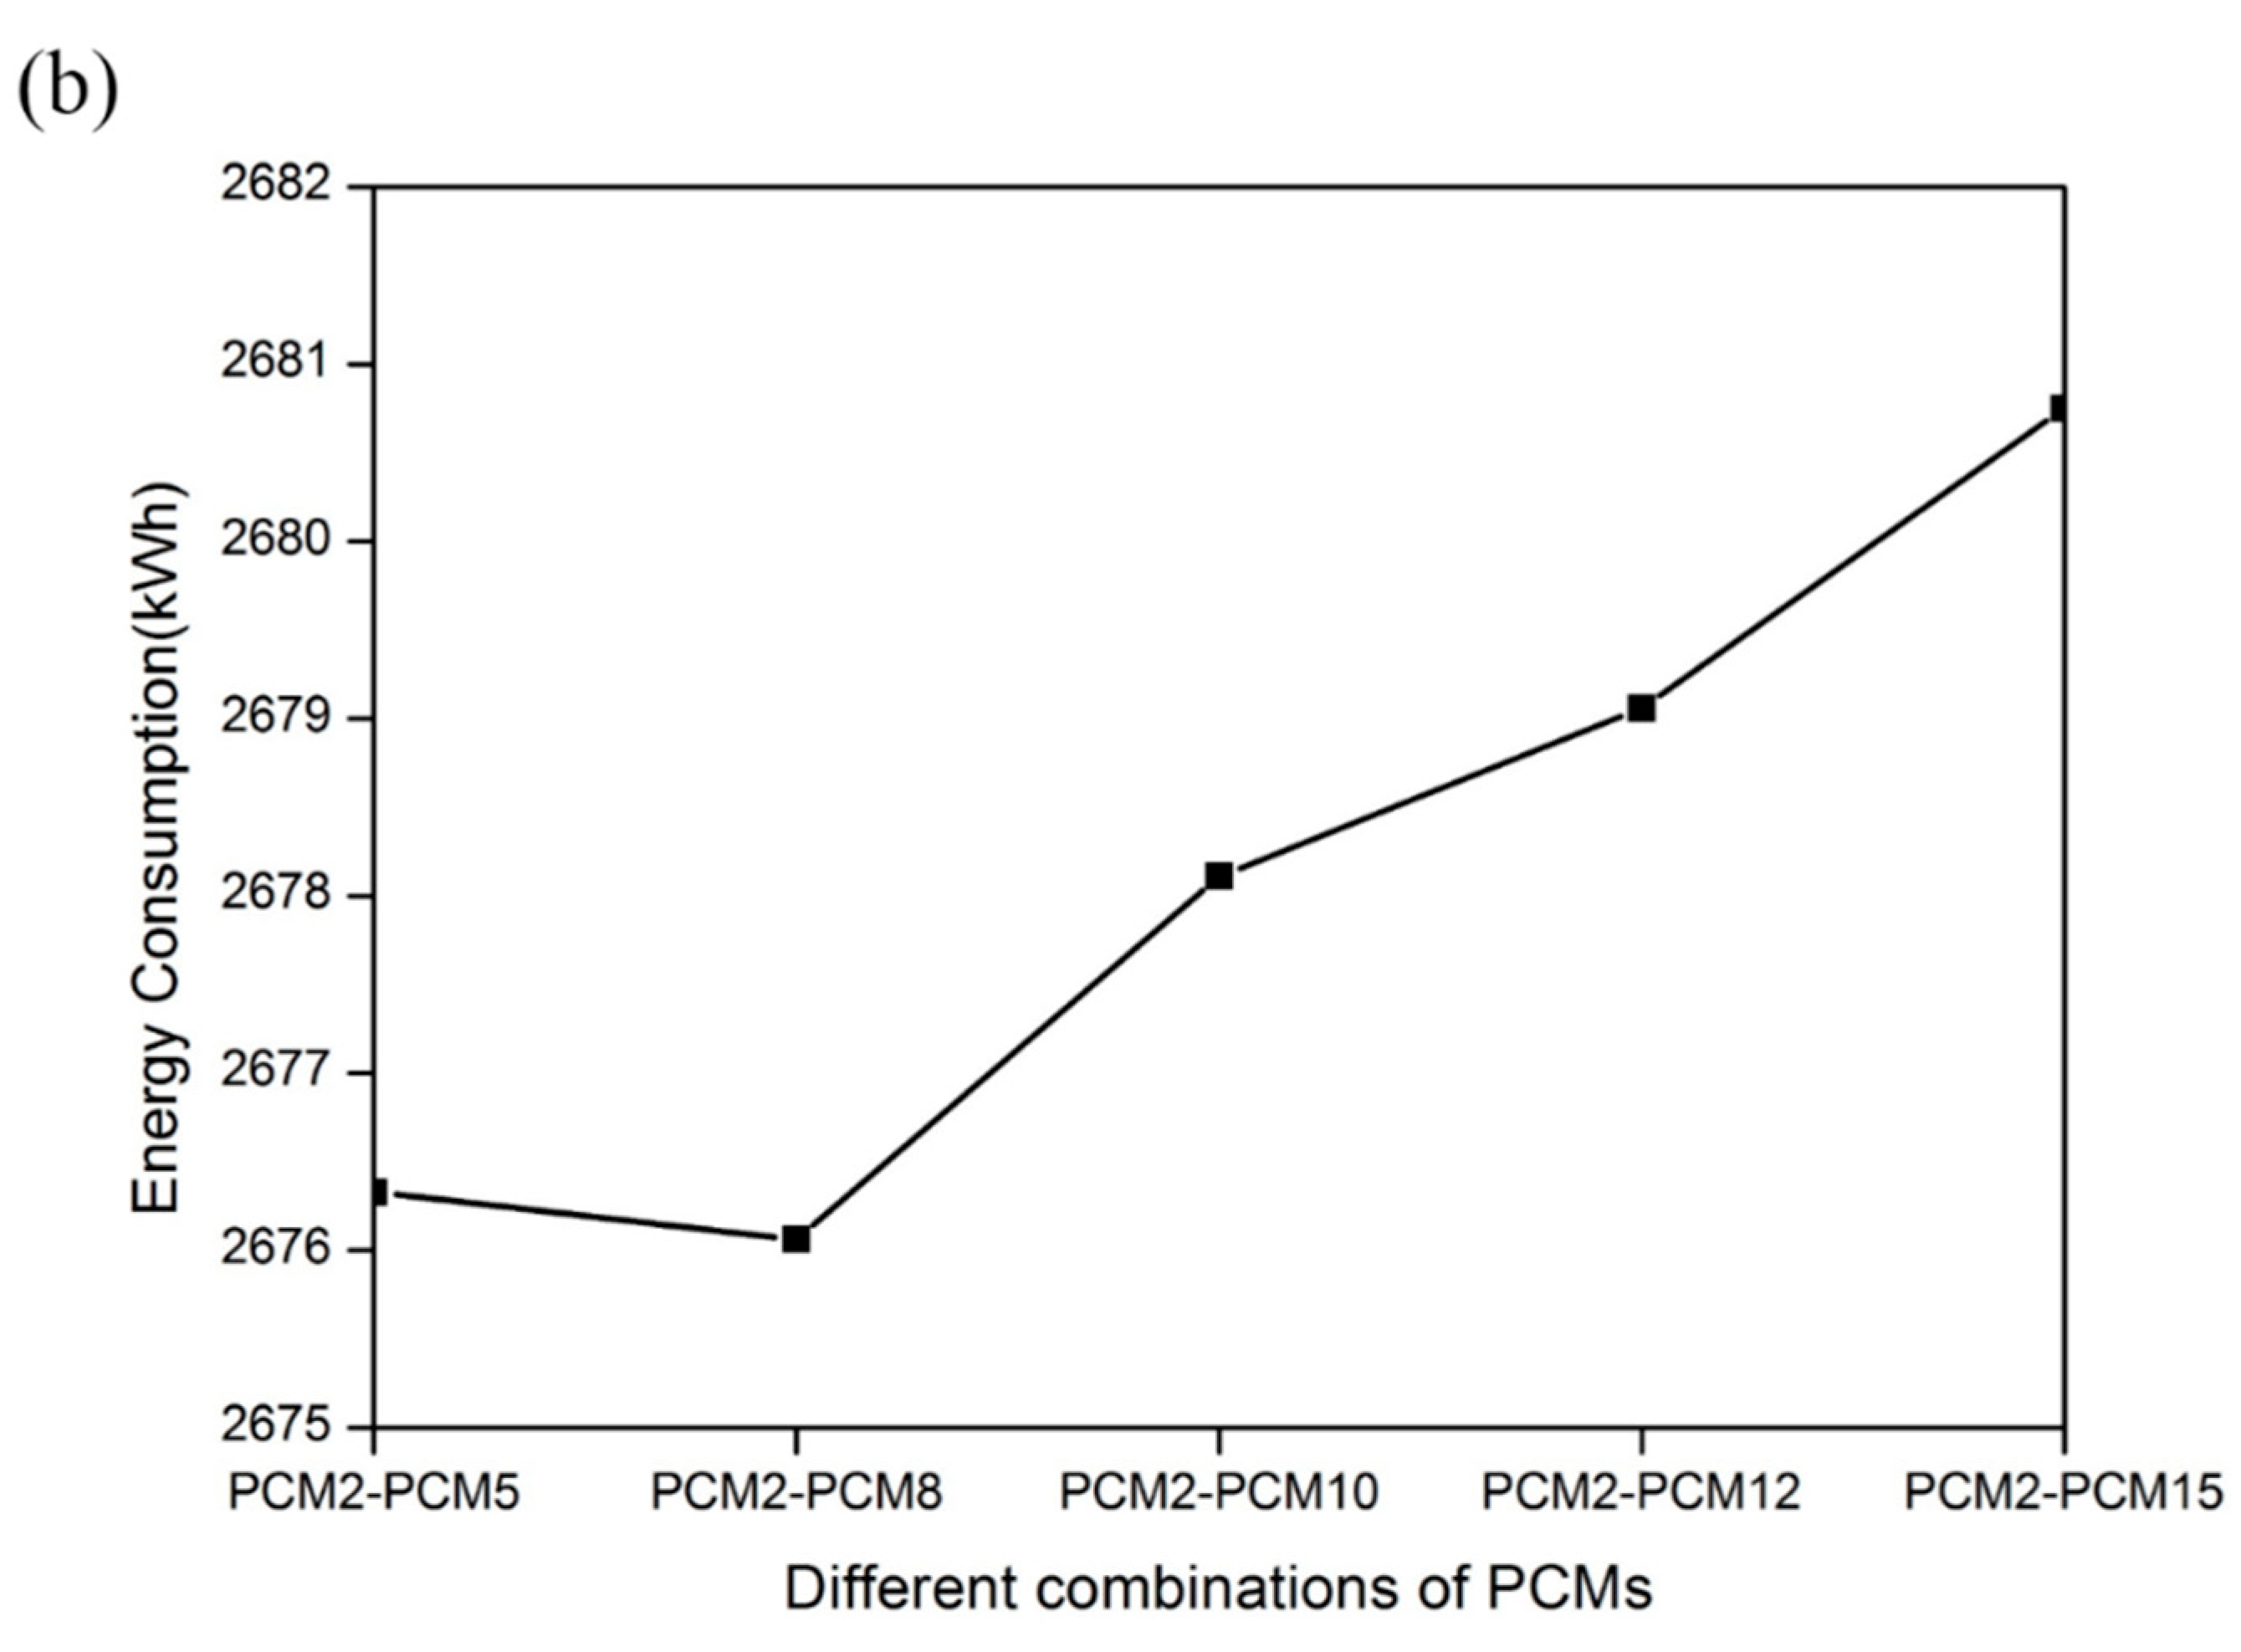
3.1. Effect of the Phase Change Temperature

In this section, the influence of the phase change temperature on room energy consumption was investigated. When the PCM of the south wall was kept as the PCM15, the energy consumption of the room with different PCMs integrated on the roof and the other three walls are shown in Figure 3a. It can be observed that the room had the lowest energy consumption when the PCM2 was installed on the roof and the other three walls. At this time, compared with other PCMs, the PCM2 with suitable phase change temperature and latent heat can be utilized more effectively. Similarly, Figure 3b shows the energy consumption of the room with different PCMs integrated into the south wall when the PCM of the roof and the other three walls was the PCM2. The energy consumption of the room could be minimized by integrating the PCM8 in the south wall. Therefore, in the subsequent study, the PCM8 was integrated into the south wall, while the PCM2 was installed on the roof and the other three walls.

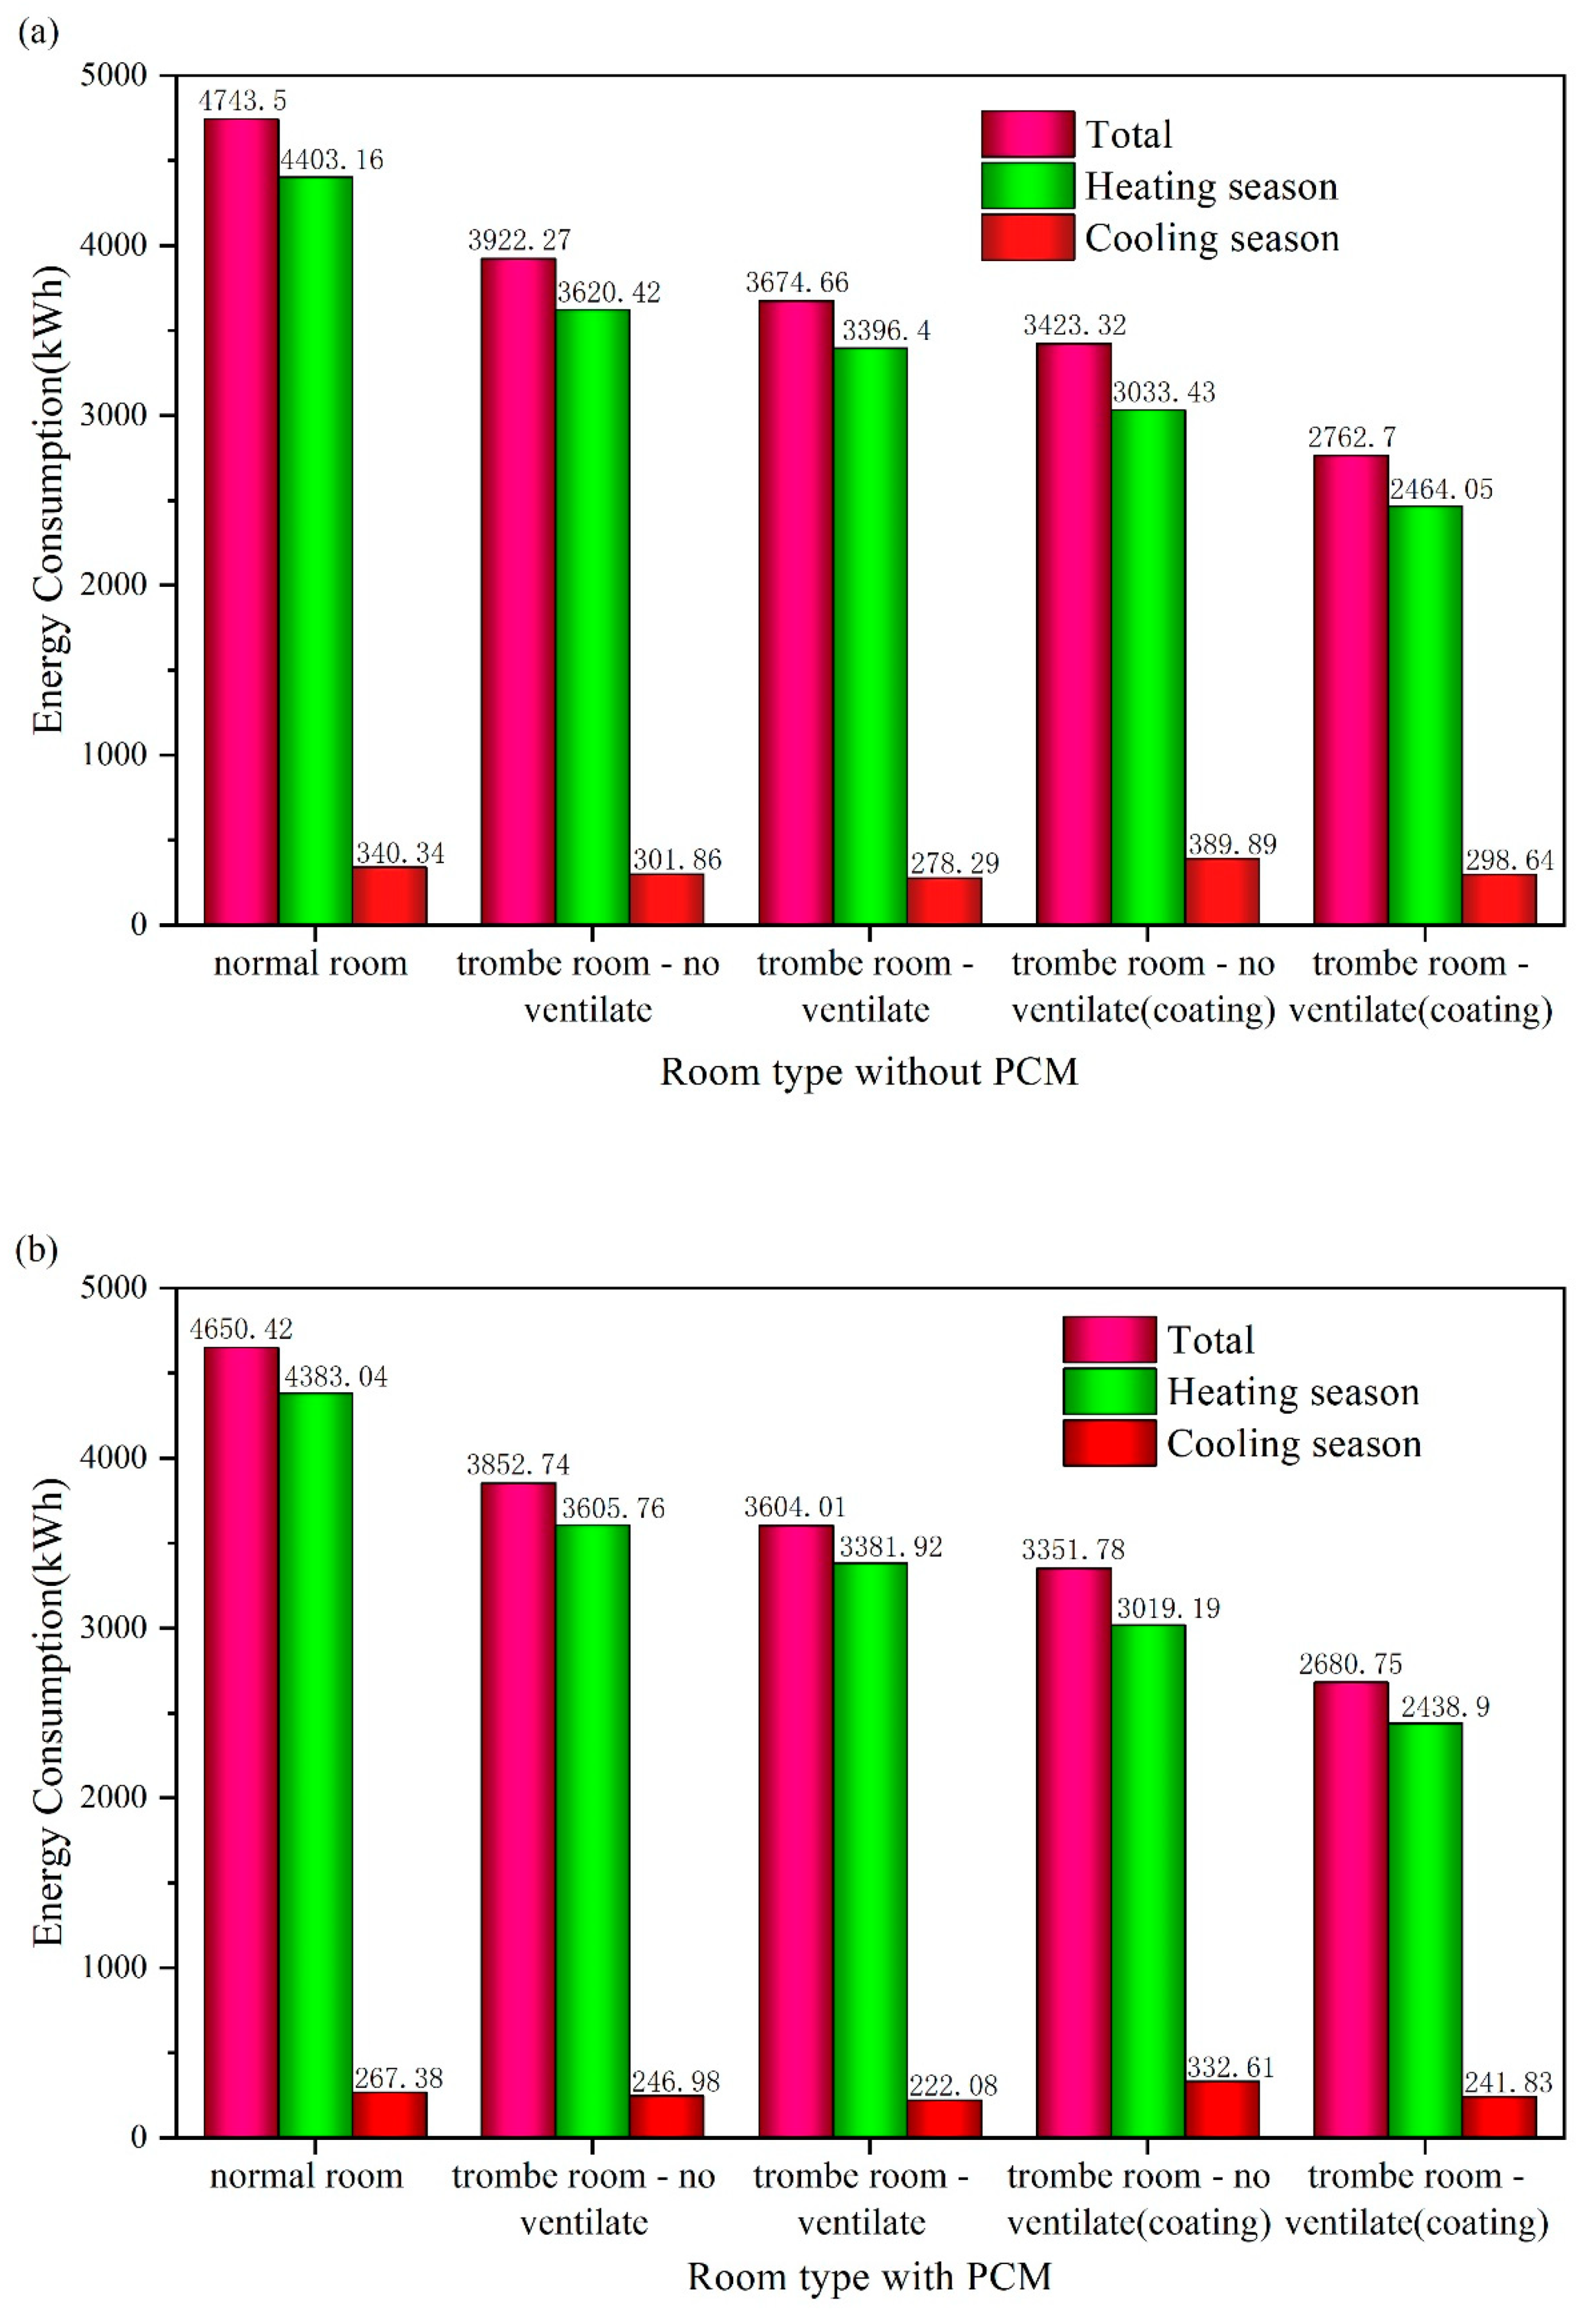
3.2. Effect of the Room Type

In this section, the effects of the ventilated air layer, solar absorbing coating, and PCM on room energy consumption were evaluated. The energy consumption of different room types (a) without PCM and (b) with PCM is shown in Figure 4. The normal room refers to the absence of the air layer in the building structure, while the trombe room means that there is an air layer in the building structure. As can be seen from Figure 4a,b, the energy consumption of the trombe room was much smaller than that of the normal room, and the room integrated with the PCM could further reduce the energy consumption. Compared with the room without the solar absorbing coating, the room with the solar absorbing coating on the south wall could save about 25% and 13% of energy consumption under ventilated and unventilated conditions, respectively. Moreover, compared with the room where the air layer was not ventilated, the room where the air layer was ventilated with and without the solar absorbing coating could save about 20% and 6% of energy consumption, respectively. It is worth mentioning that the energy-saving effect of solar absorbing coating (13%) is better than that of ventilated air layer (6%). In general, when the air layer in the trombe room was ventilated, and the south wall was coated with the solar absorbing coating, the room had the best energy-saving effect, which could save about 30% of energy consumption. In this case, the energy consumption of the room with PCMs and without PCMs was 2676.06 and 2762.70 kWh, respectively, that is, the room integrated with the PCM could further save about 3% of energy consumption.

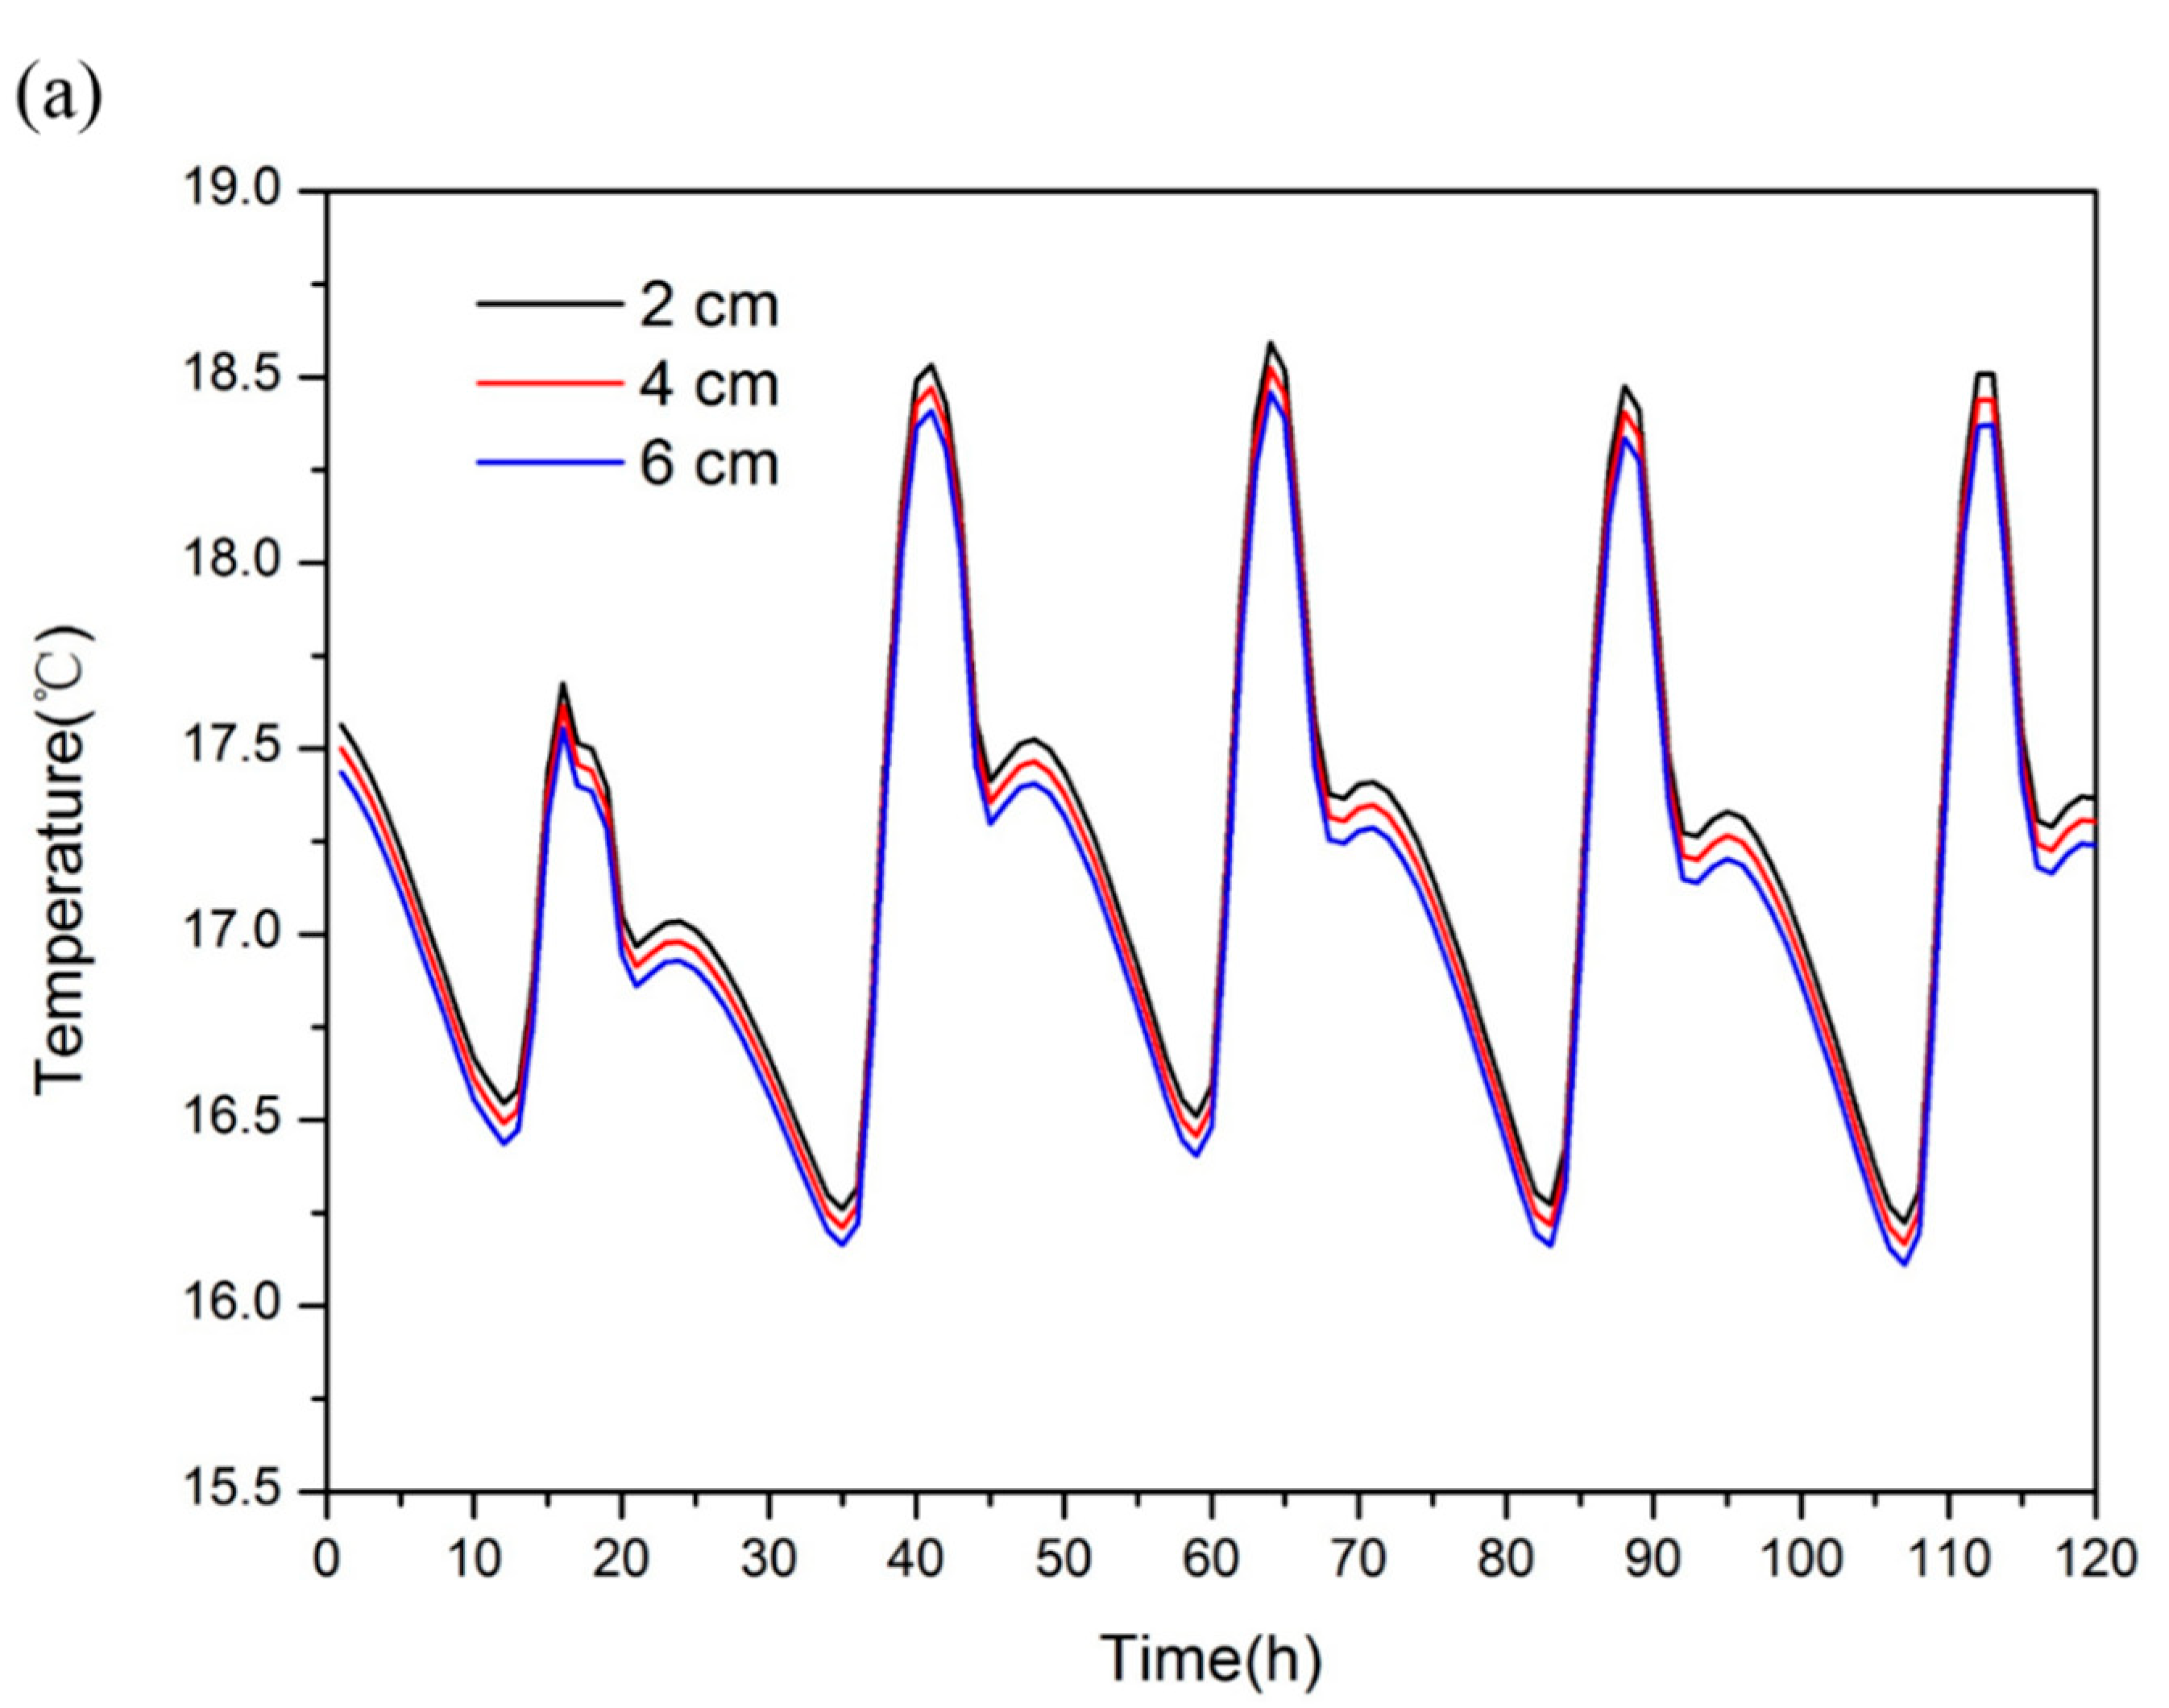
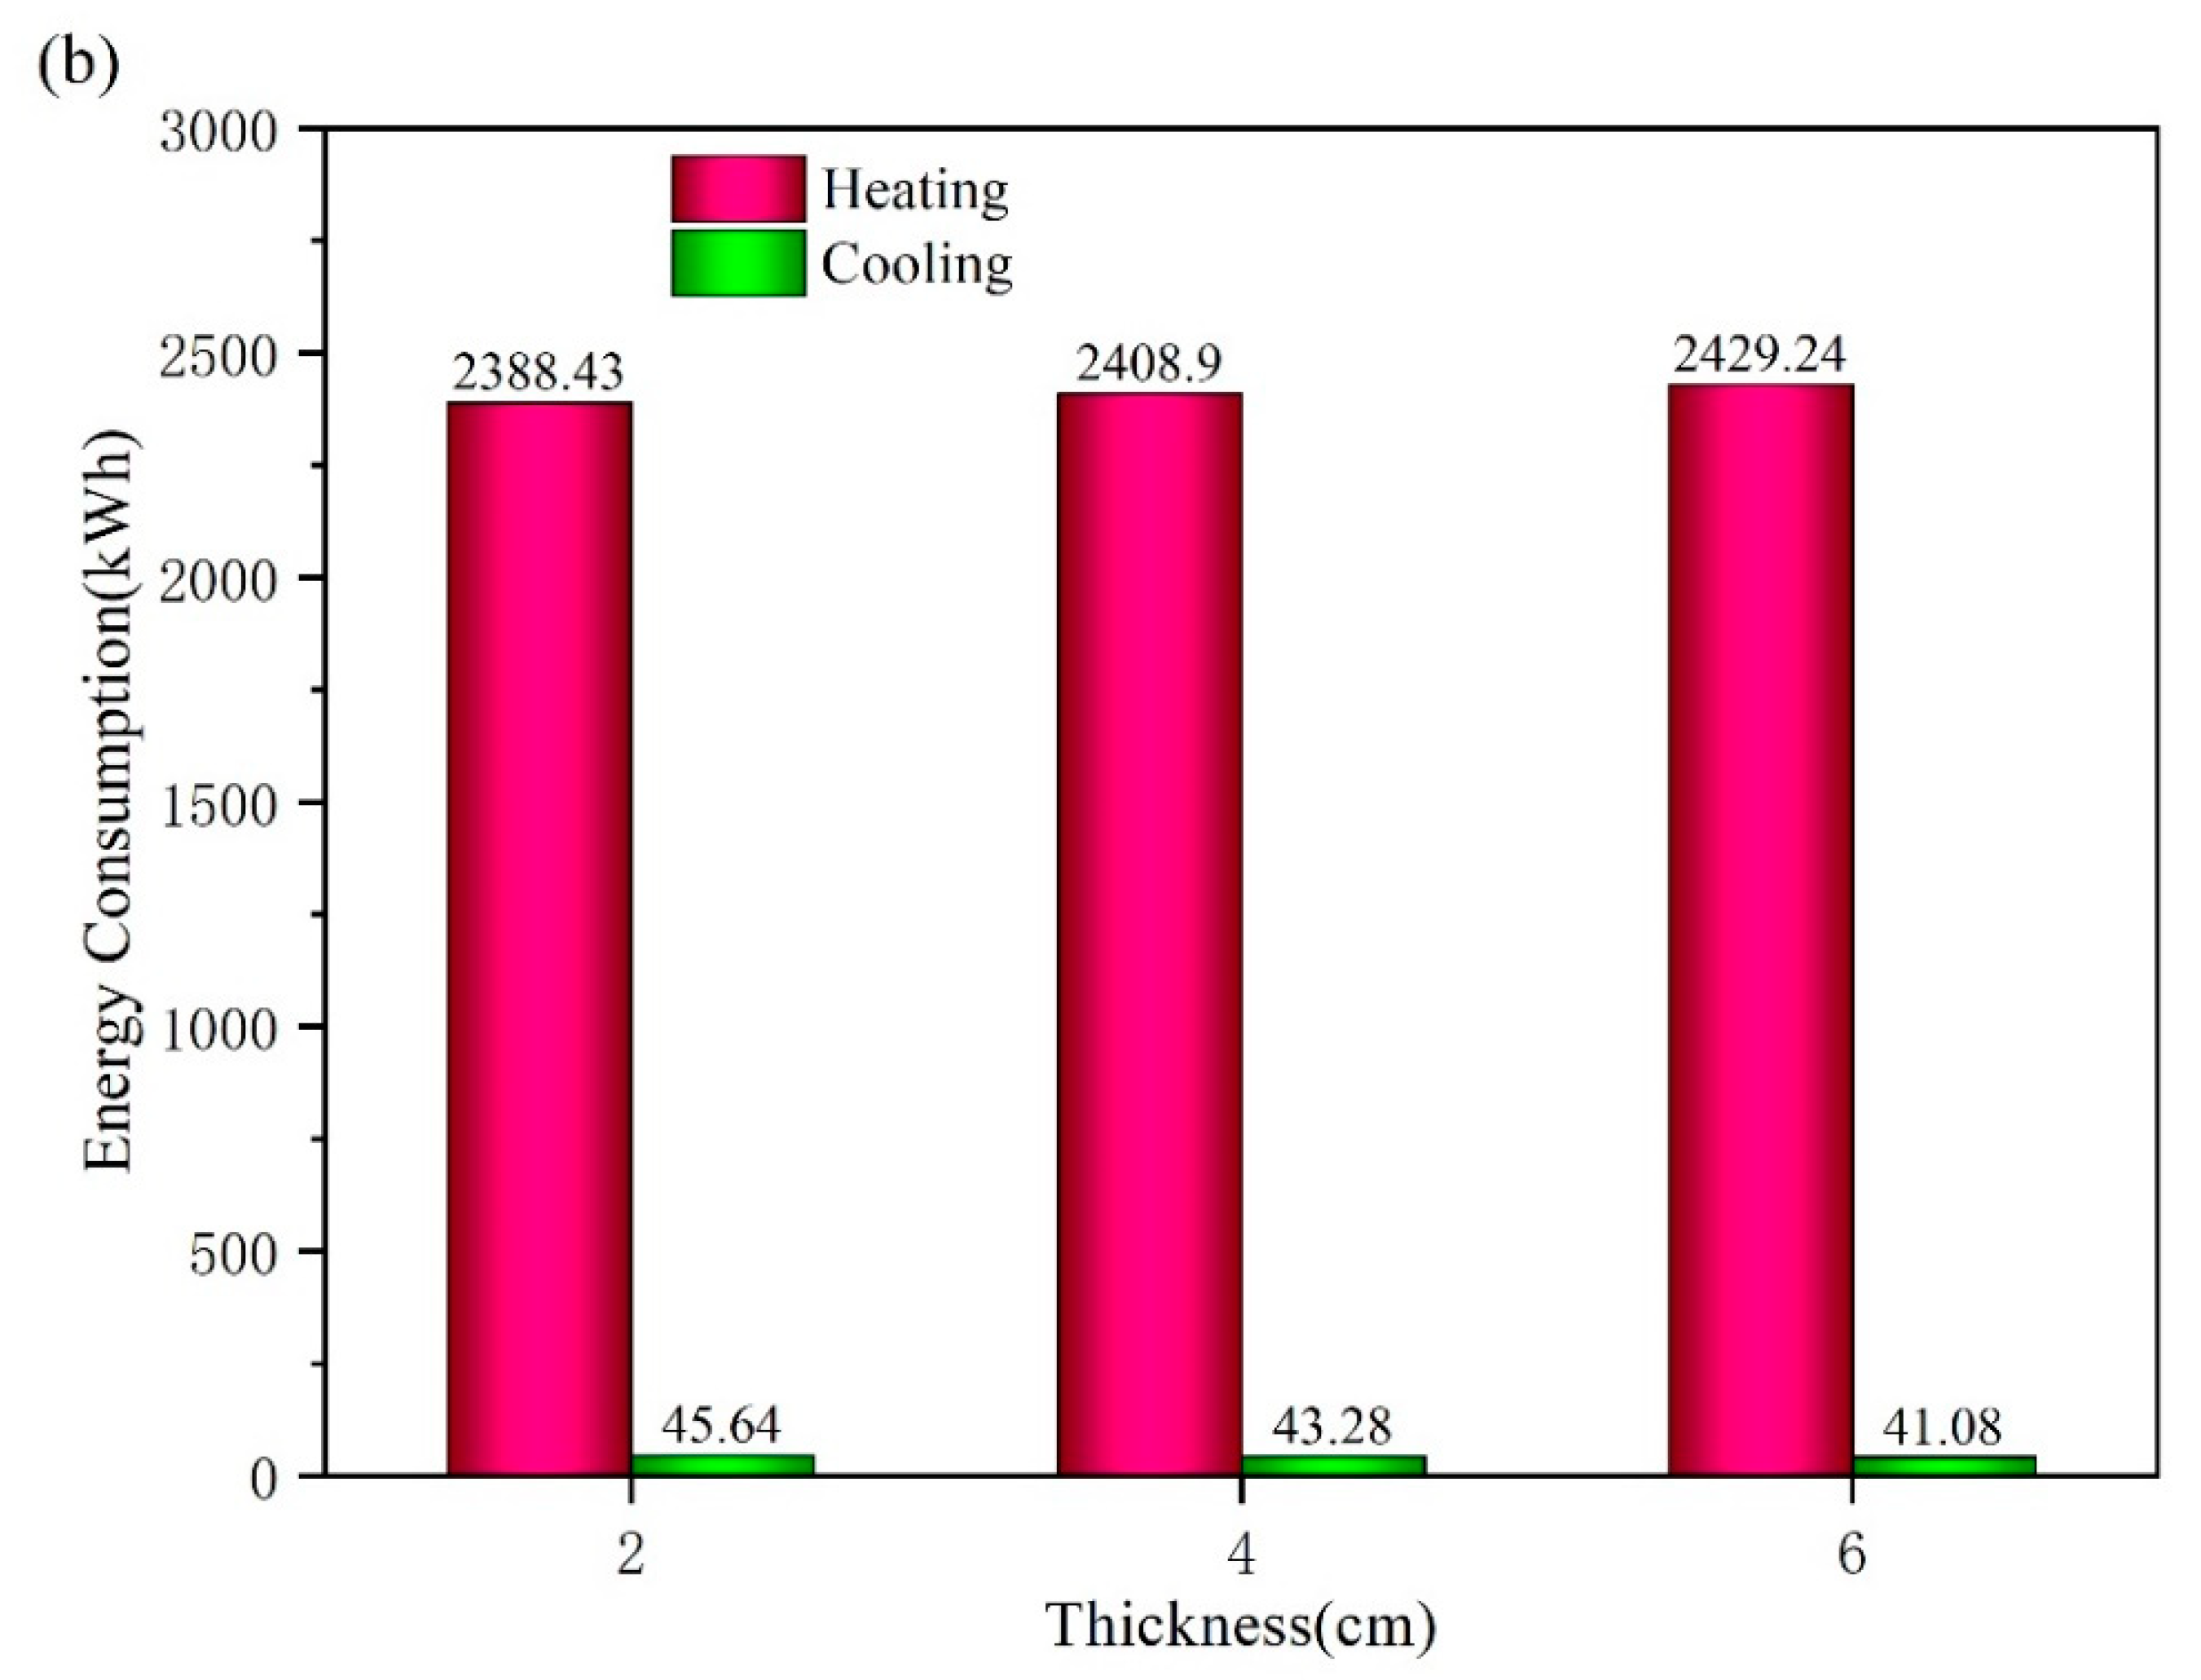
3.3. Effect of the Air Layer Thickness

Since Ningxia belongs to the severe cold region, the energy consumption in the heating season was much greater than in the cooling season. Therefore, only the influence of the thickness of air layer 2 and air layer 3 on the energy consumption of the room was evaluated in this part. Table 4 shows the energy consumption of the room under the different thicknesses of the air layer. It can be seen that the energy consumption of the room increased as the thickness of air layer 2 and air layer 3 became larger, and the change in the thickness of air layer 3 had a greater influence on the energy consumption of the room. For air layer 3, the inner surface temperature history of the south wall from 21 January to 25 January and the energy consumption of the room in the heating season are shown in Figure 5a,b. During the daytime, as the hot air from air layer 2 flowed through air layer 3, a portion of the heat was transferred to the low-temperature air in air layer 3. As the thickness of air layer 3 increased, the temperature of the air entering the room decreased. As a result, the cooling energy consumption of the room was reduced. However, at night, when the heat released by the PCMs flowed into the room, a portion of the heat was also transferred to the air in air layer 3. When the thickness of air layer 3 was larger, the amount of heat flowing into the room was smaller, which would increase the heating energy consumption of the room. As can be seen from Figure 5, as the thickness of air layer 3 increased, the increase in the room heating energy consumption was greater than the reduction in the cooling energy consumption; thus, the energy consumption of the room became larger.

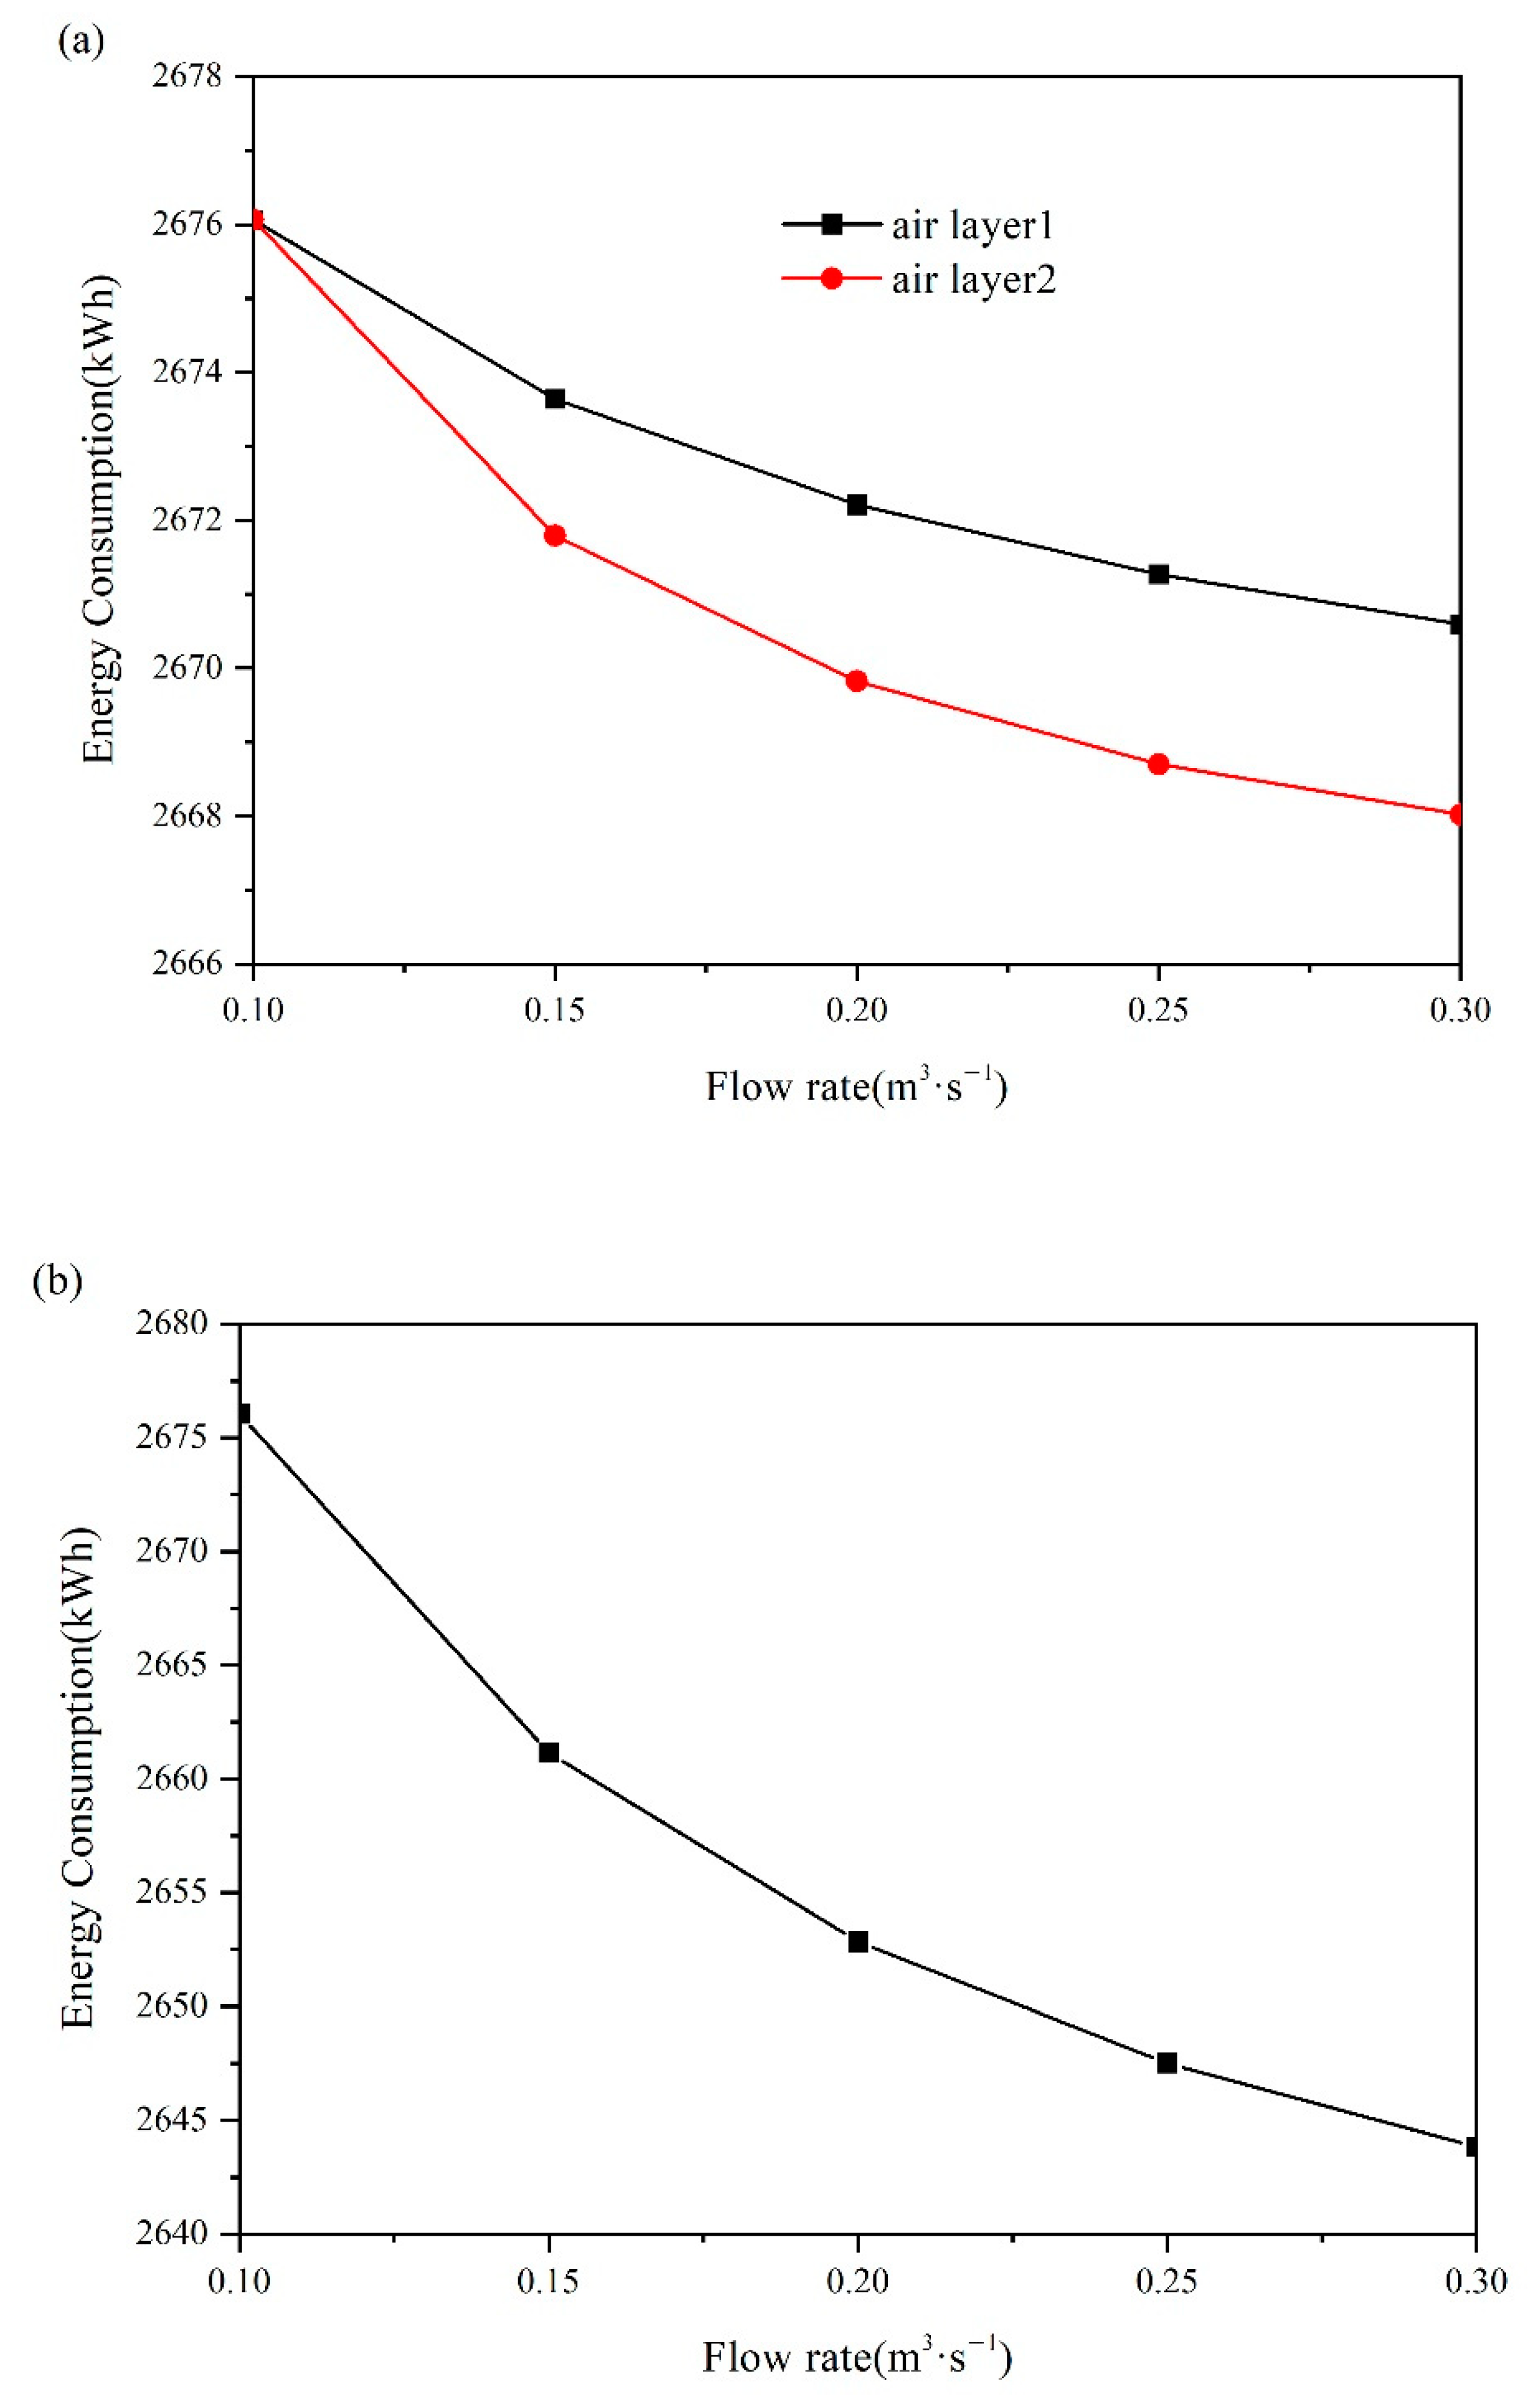
3.4. Effect of the Airflow Rate

Figure 6 shows the energy consumption of the room when the airflow rate was at different values. As can be seen from Figure 6a, as the ventilation rate of air layer 1 or air layer 2 increased, the room energy consumption decreased. For air layer 1, the increase in the ventilation rate allowed more PCMs to solidify, which was beneficial for recycling the next day. For air layer 2, increasing the ventilation rate prevented the room from overheating caused by the accumulation of heat. Moreover, due to the presence of the solar absorbing coating, increasing the ventilation rate of air layer 2 could bring more heat to the outdoor environment. Therefore, compared with air layer 1, increasing the ventilation rate of air layer 2 could save more energy consumption. Similarly, as the flow rate between air layer 3 and the room increased, the heat released by the PCM at night could be transferred to the room more quickly, thereby reducing the energy consumption of the room (Figure 6b). However, there is an optimum value for the flow rate between air layer 2, air layer 3, and the room to minimize the energy consumption of the room, which was 0.09 m3·s−1 (Figure 6c). When the flow rate increased, the amount of heat that was introduced into the room would increase, which could reduce the heating energy consumption but could also increase the cooling energy consumption. During the ventilated month of the south wall, the energy consumption of the room when the flow rate between air layer 2, air layer 3, and the room was at different values is shown in Figure 7. It can be seen that when the flow rate was less than 0.09 m3·s−1, with the increase of the flow rate, the increase in the room cooling energy consumption was less than the reduction in the heating energy consumption. When the flow rate was greater than 0.09 m3·s−1, the increased cooling energy consumption of the room was gradually greater than the reduced heating energy consumption. Therefore, the optimal flow rate between air layer 2, air layer 3, and the room was 0.09 m3·s−1.

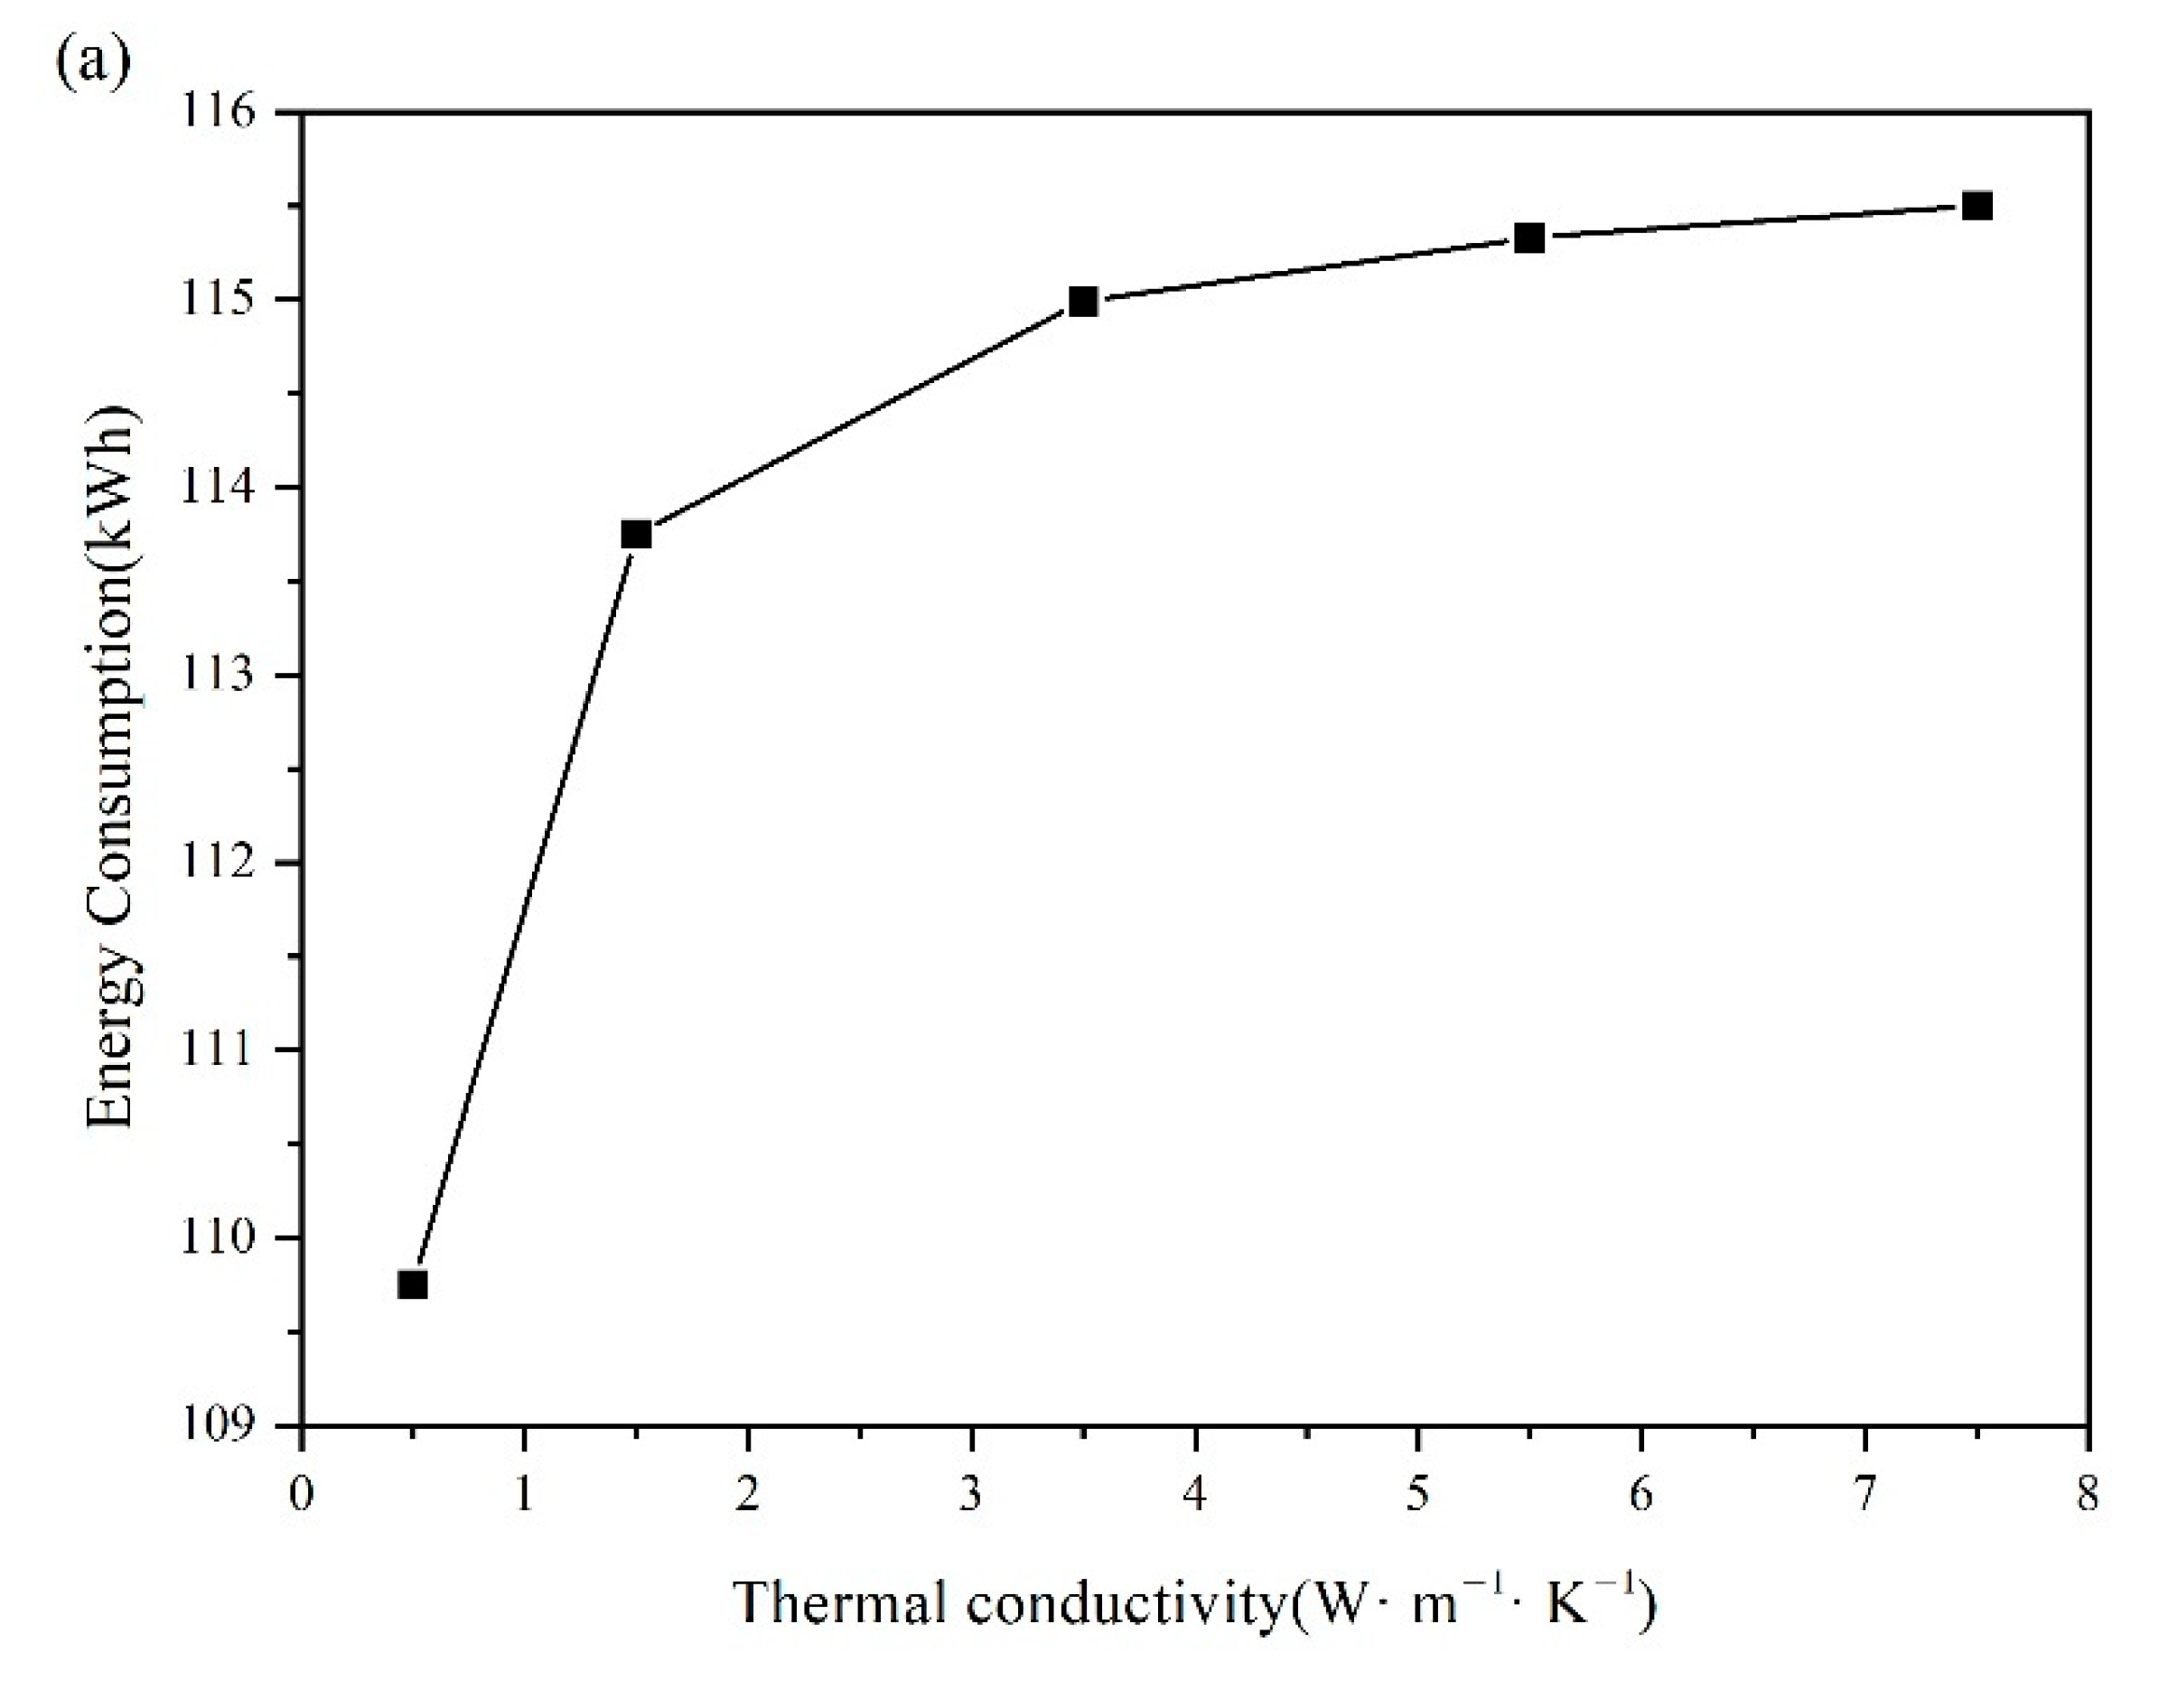
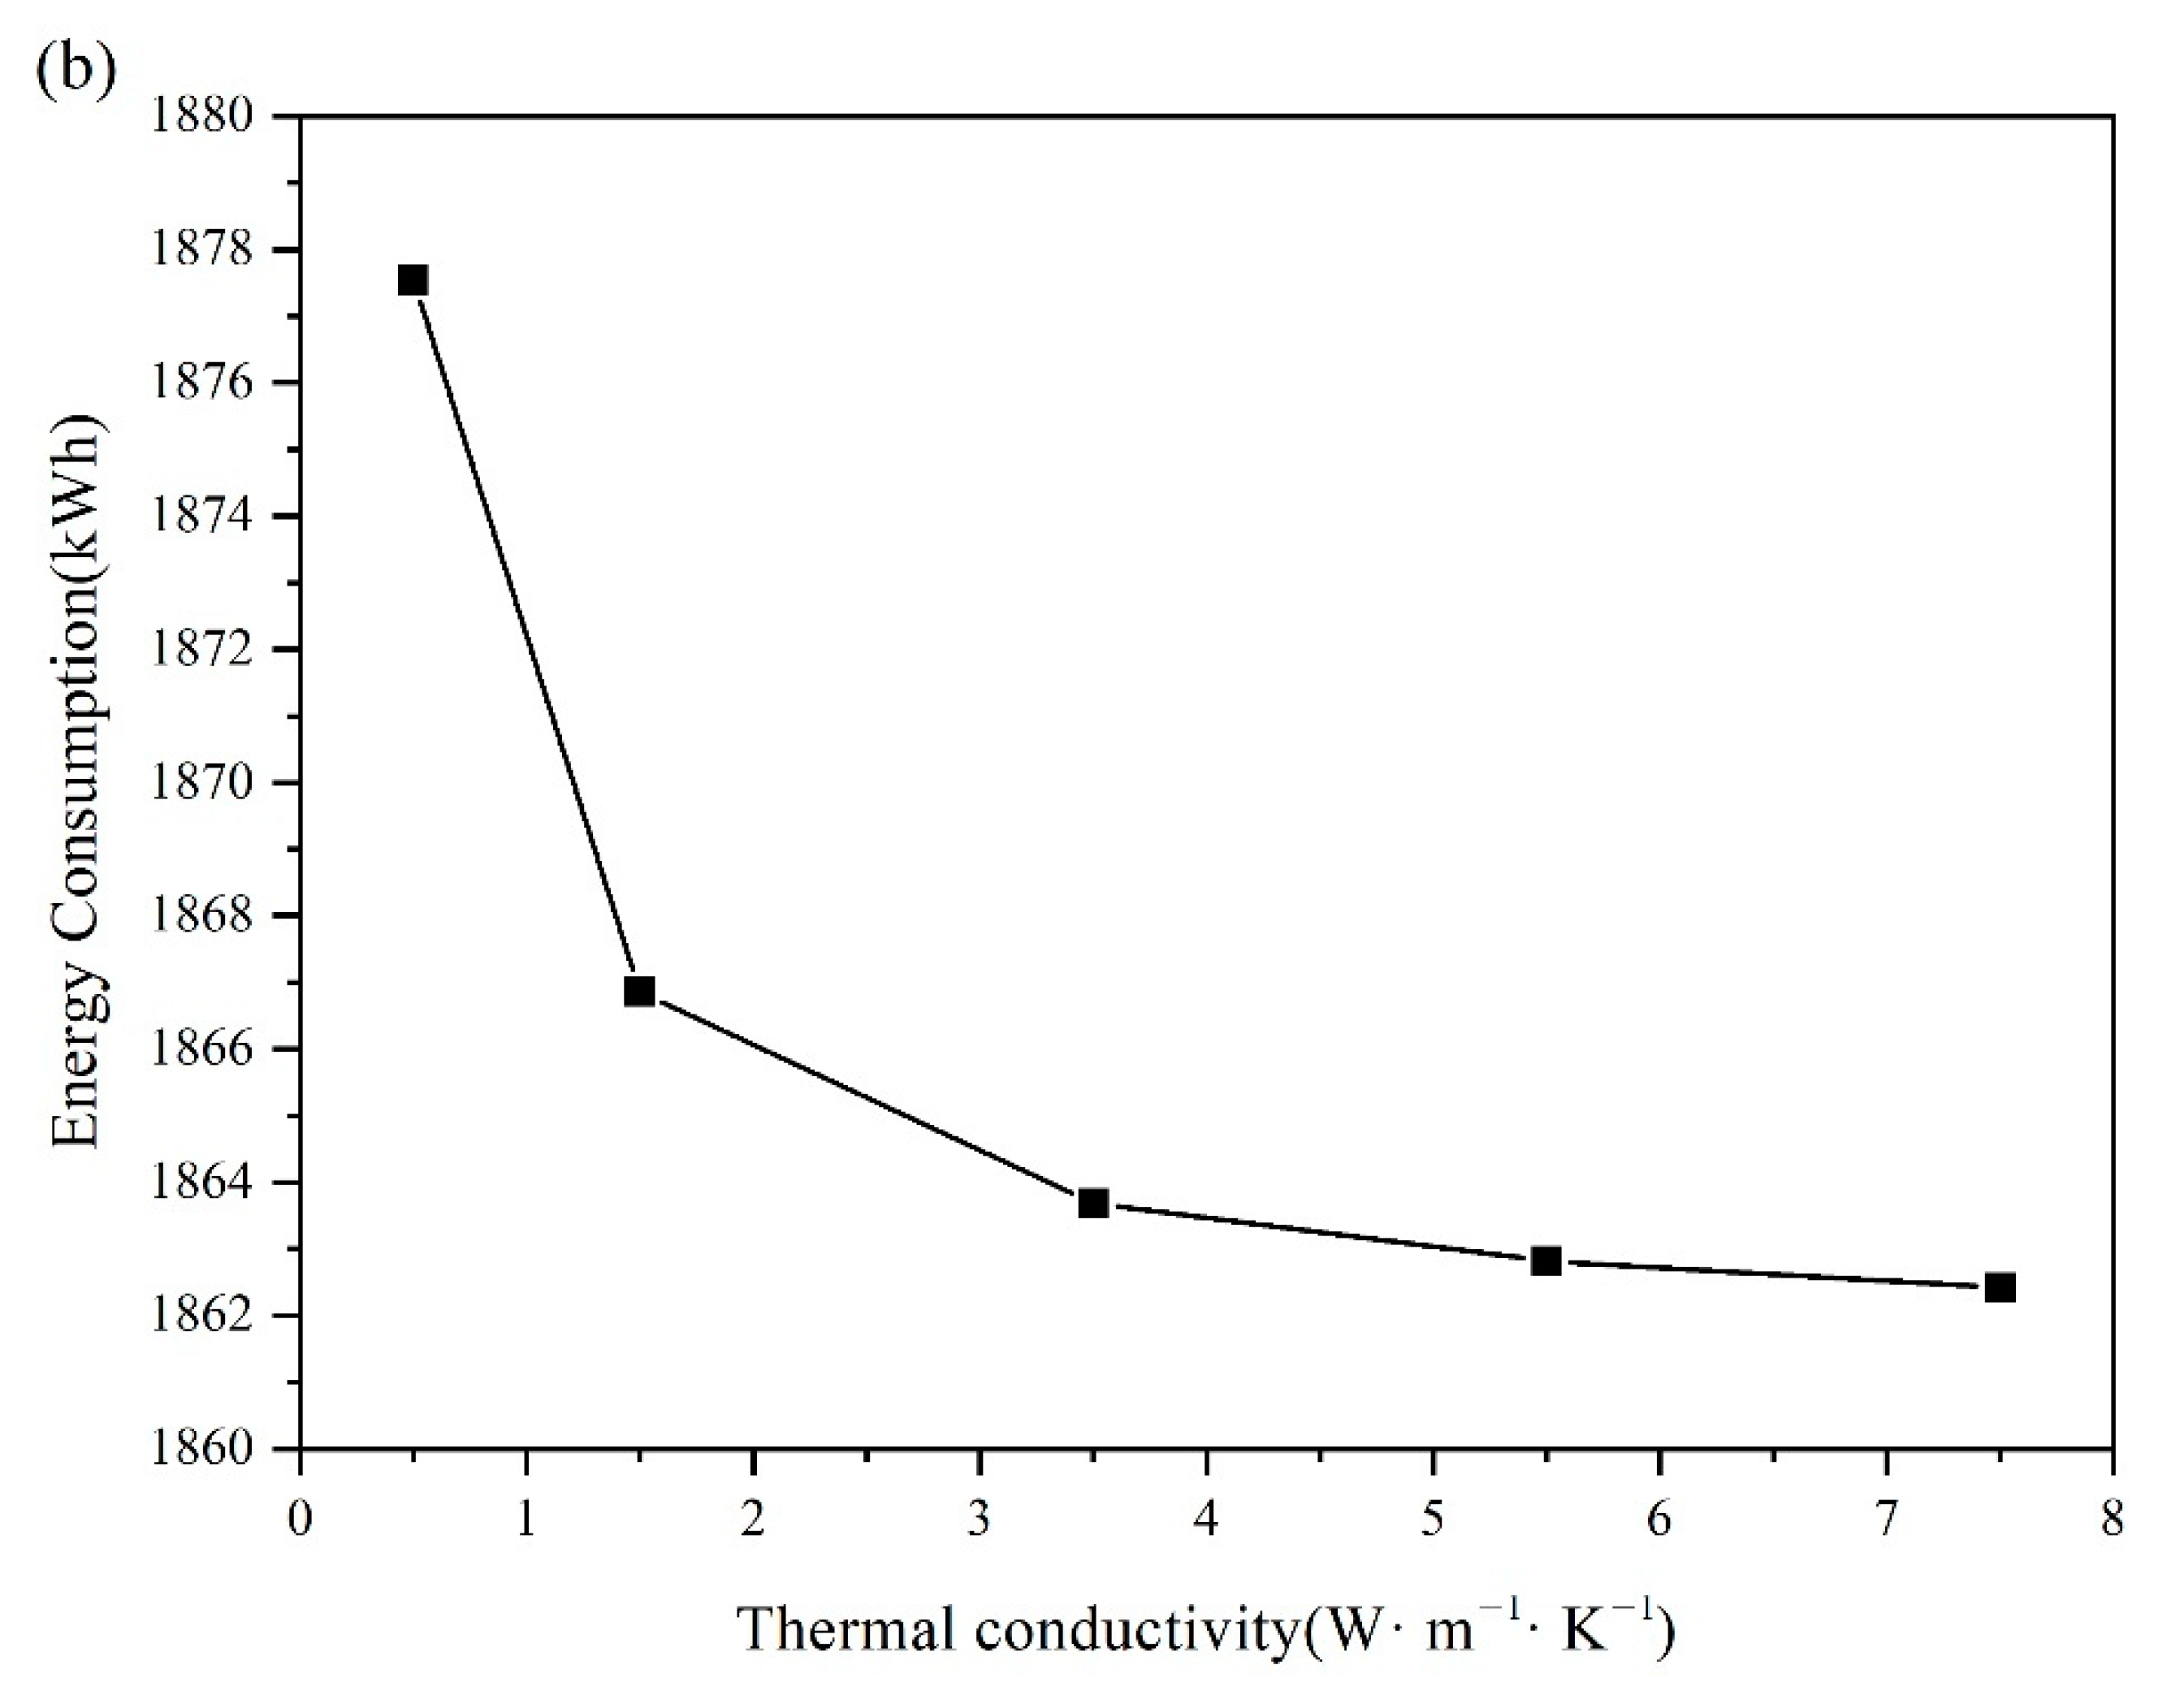
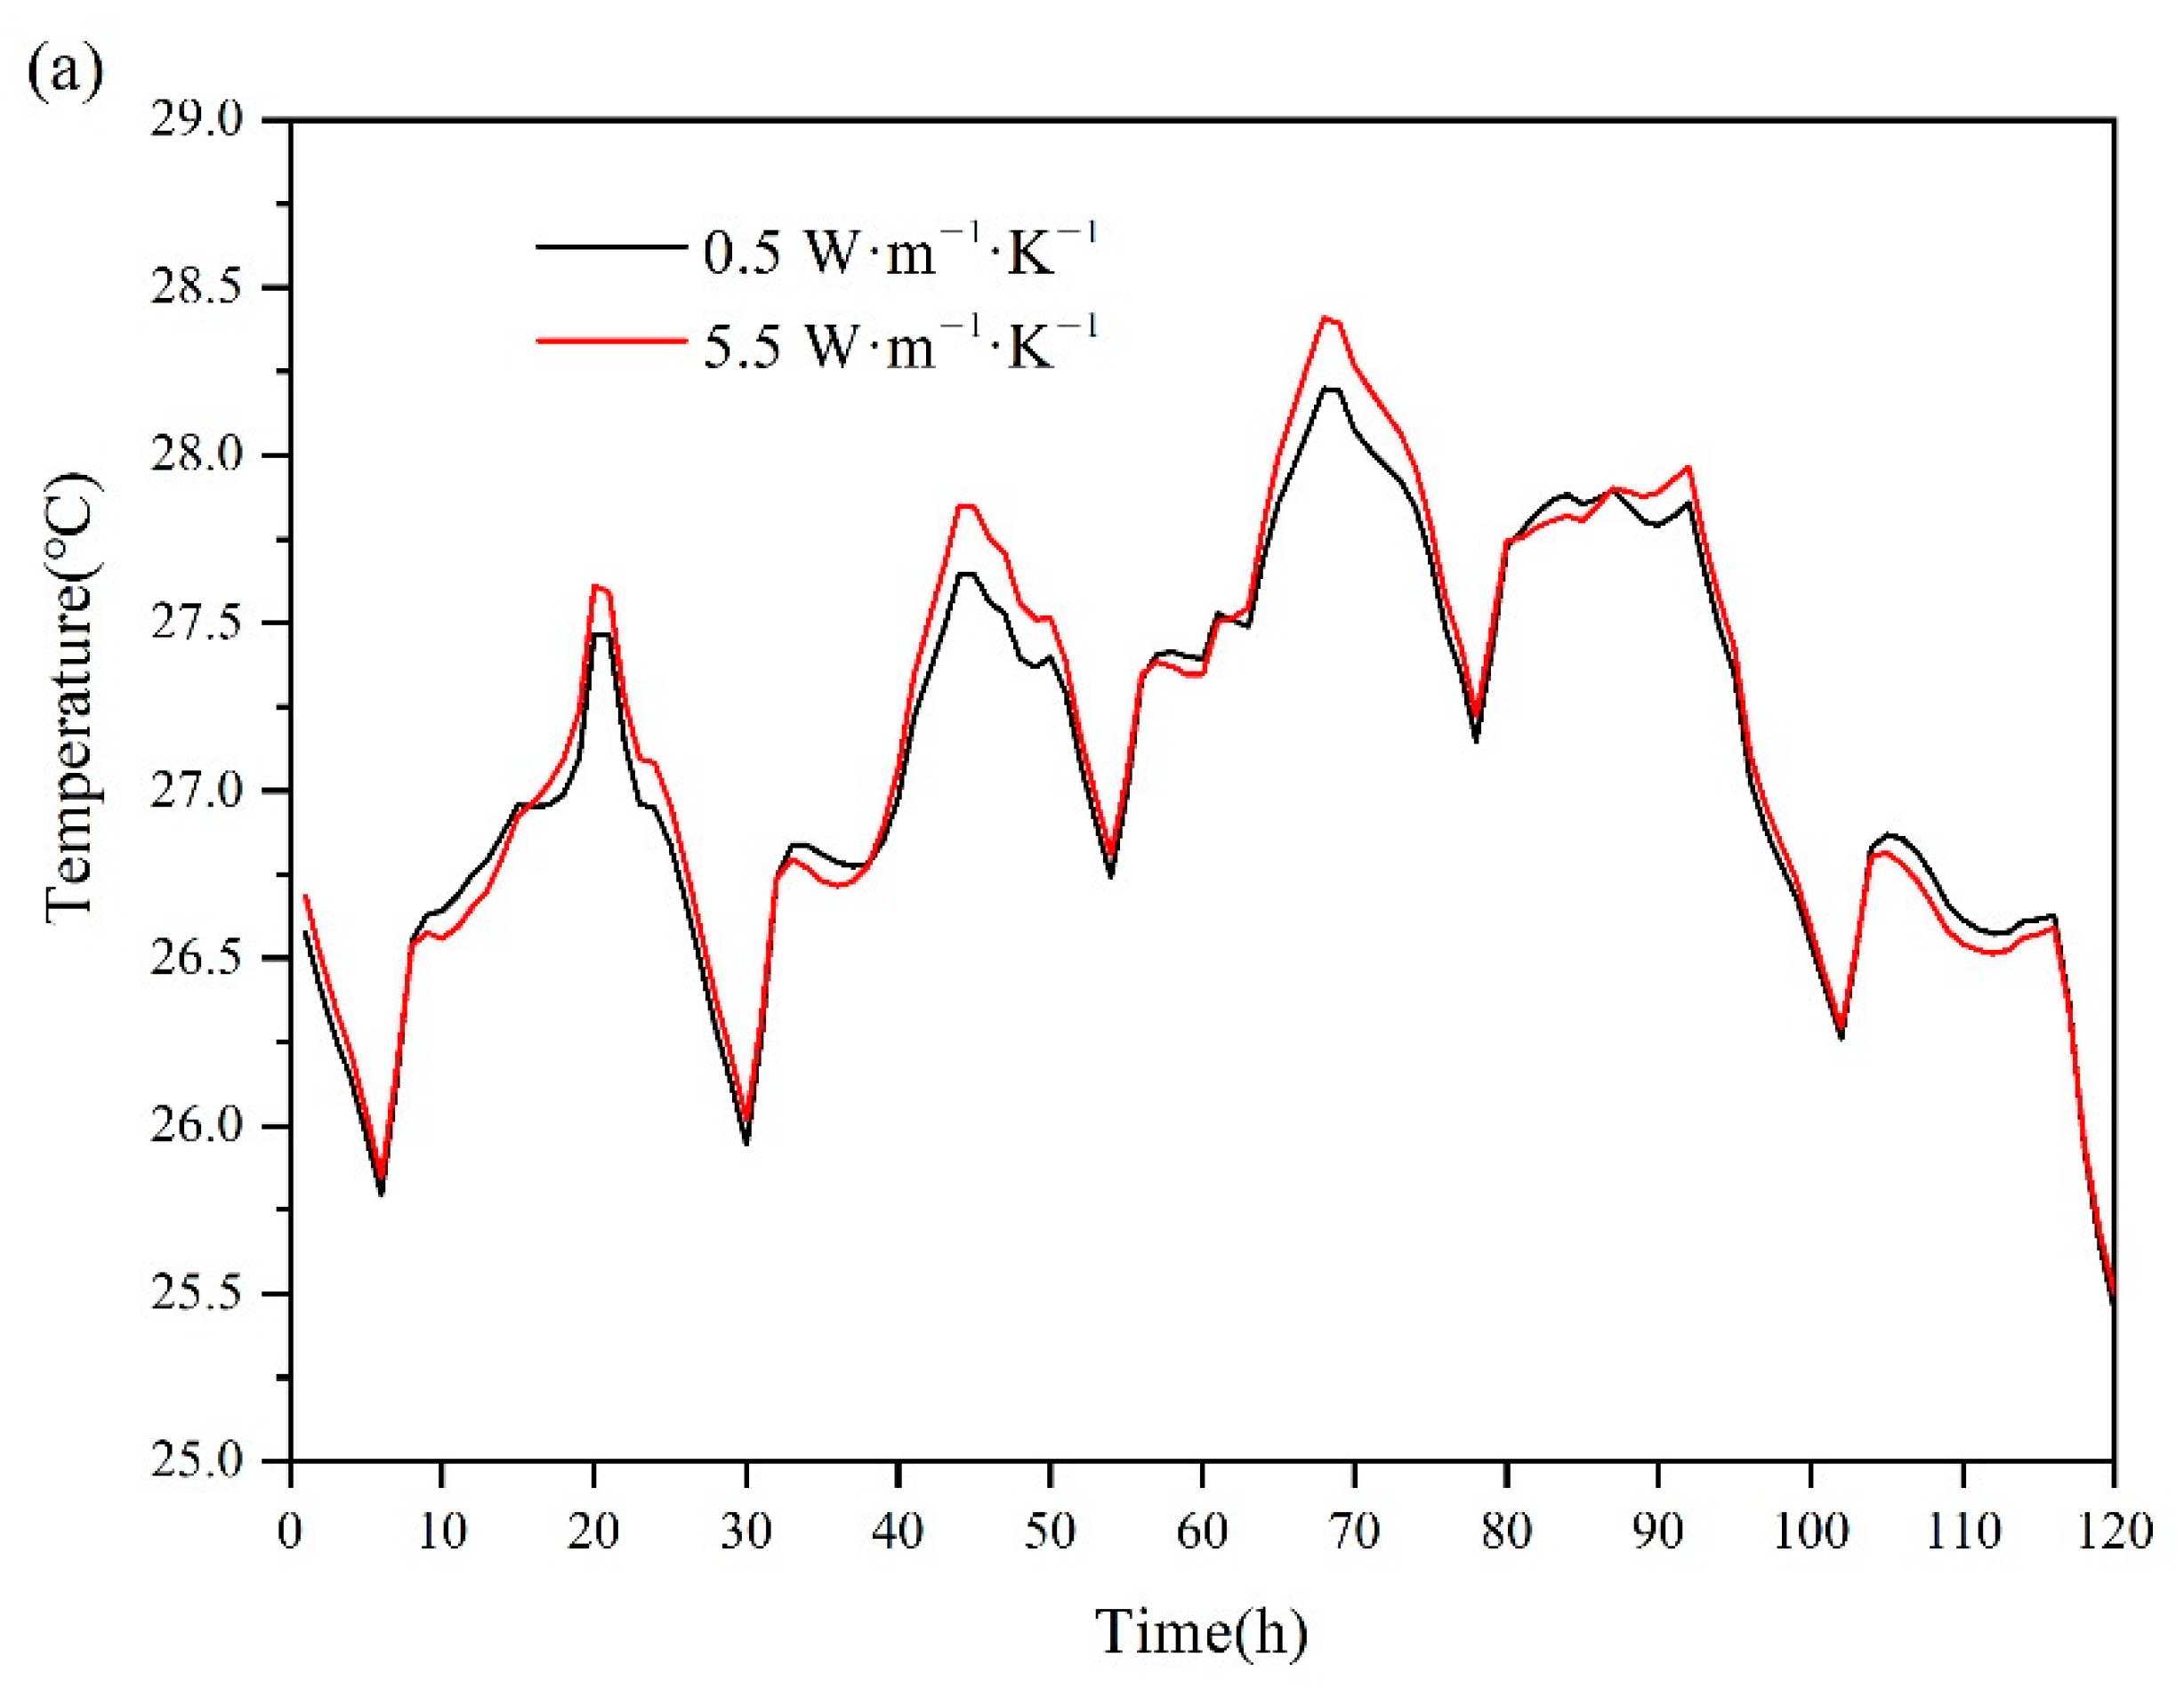
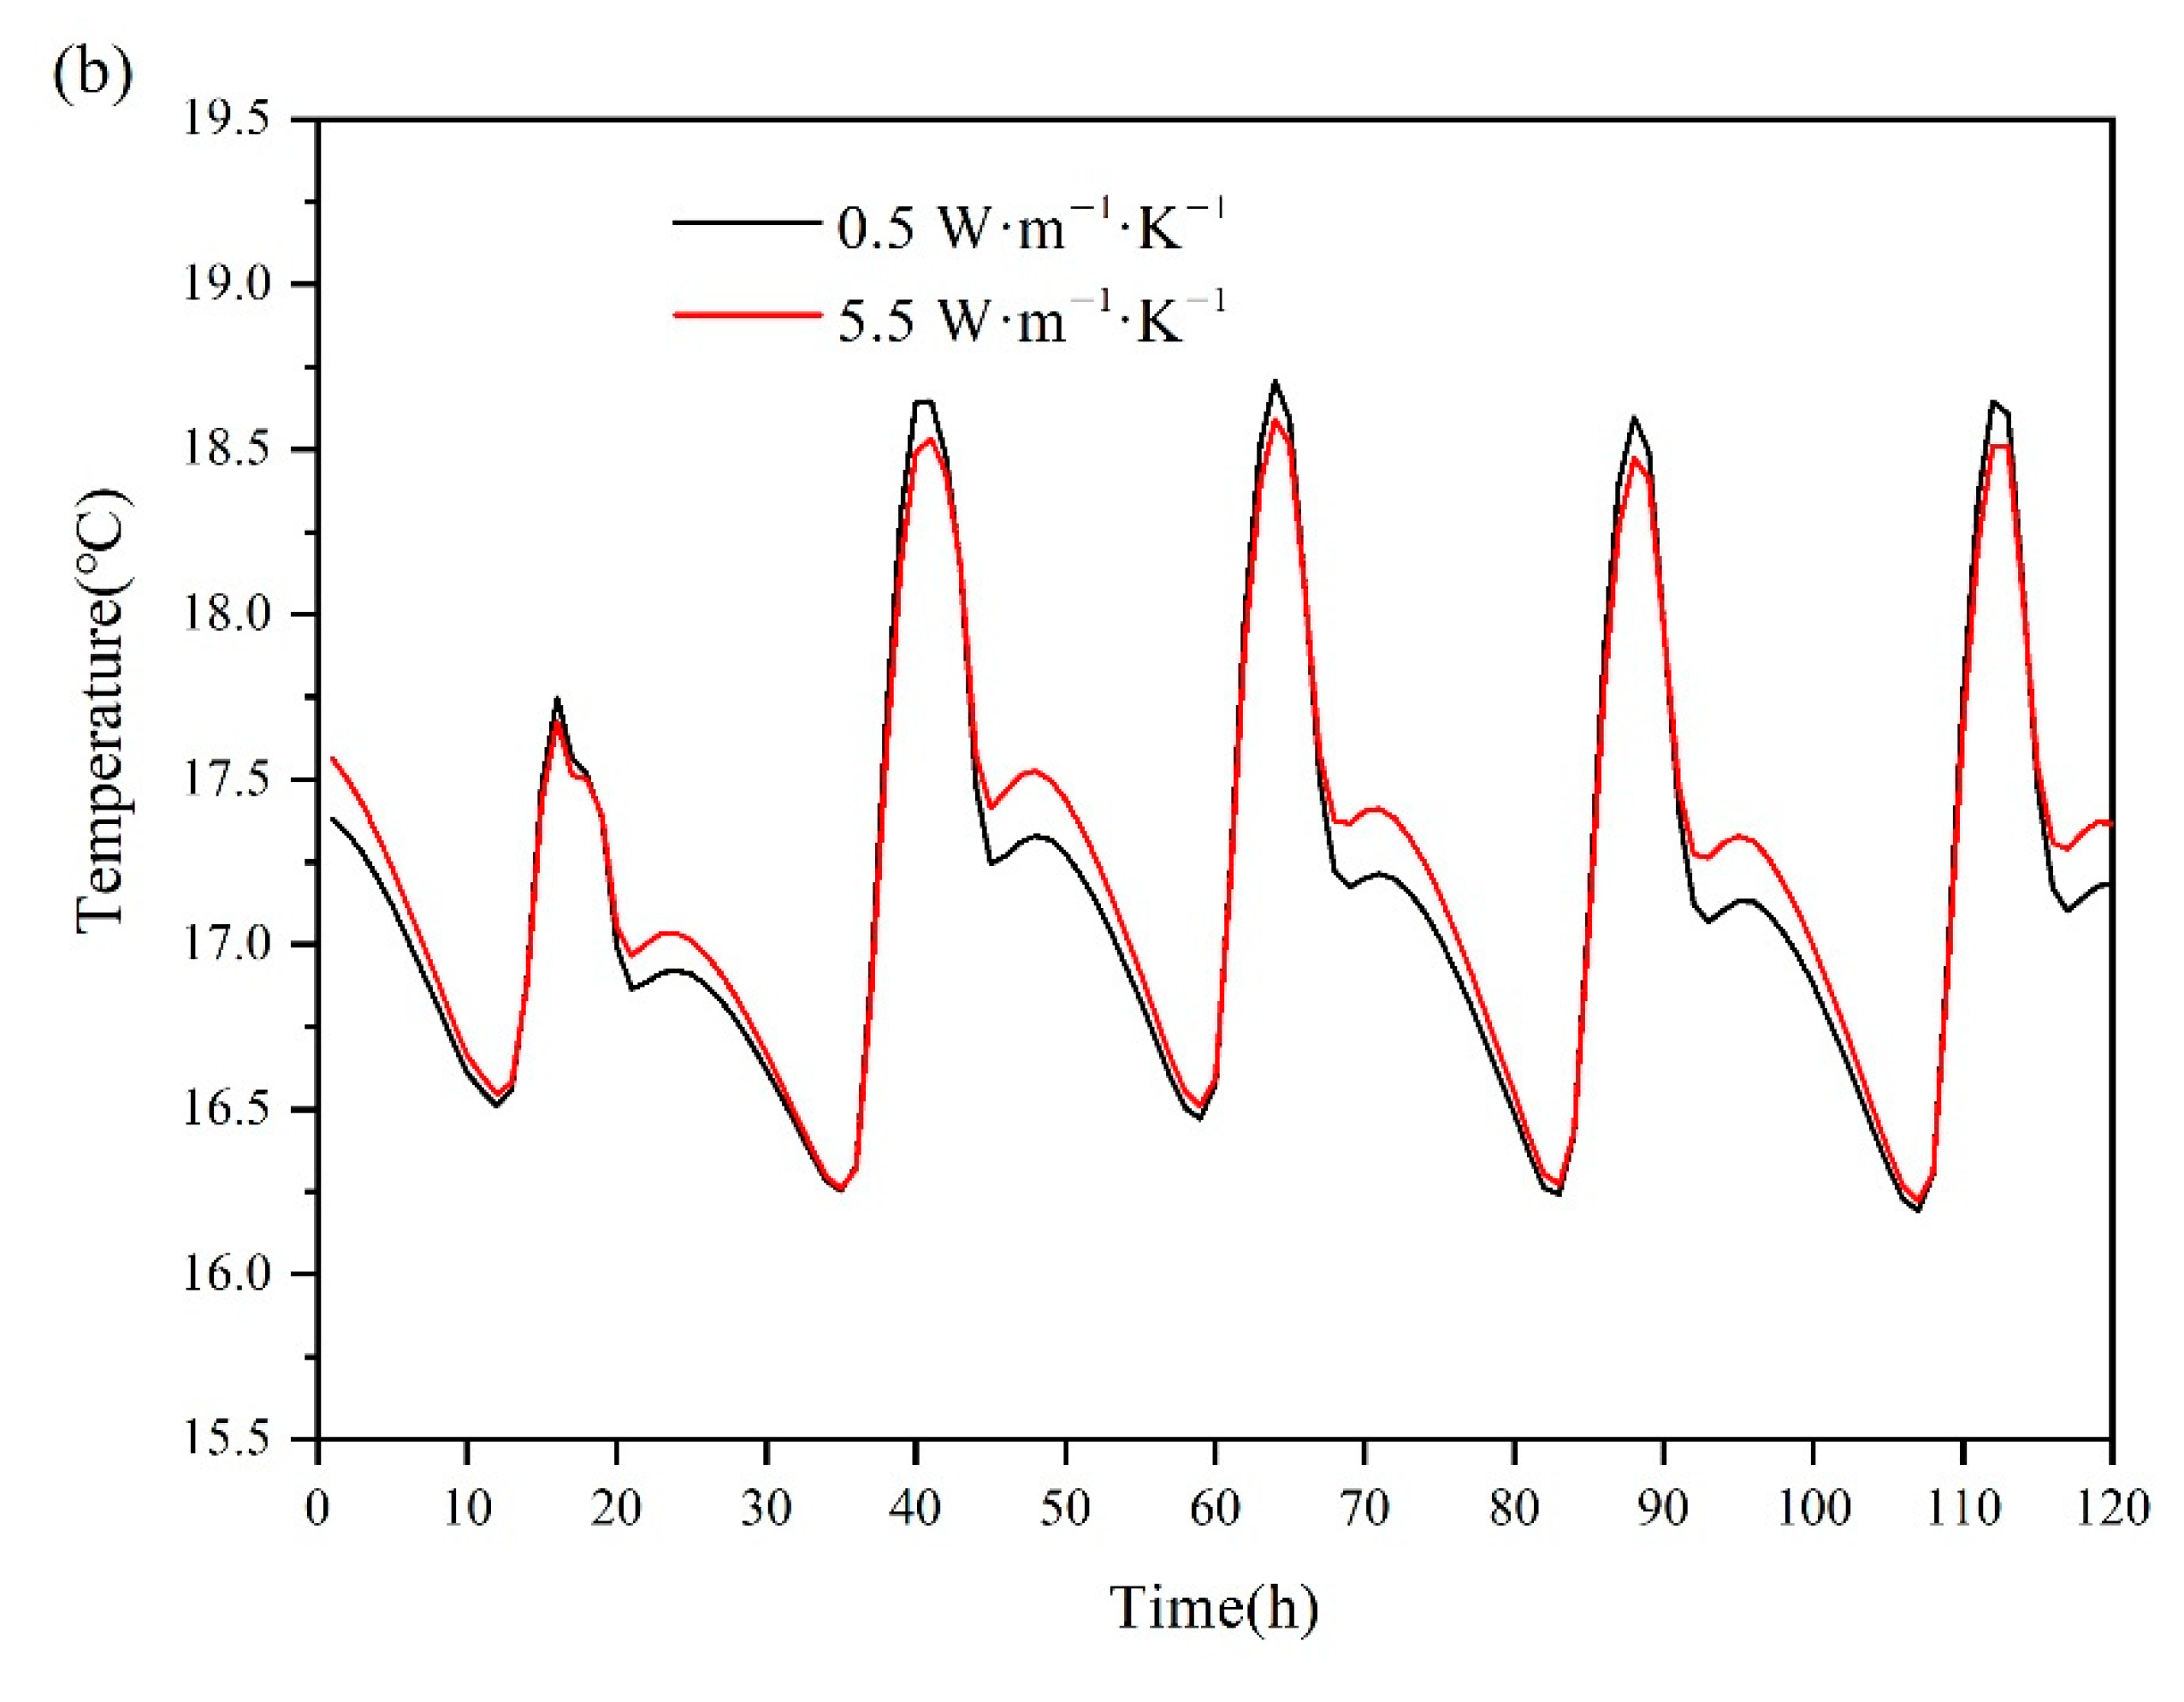
3.5. Effect of the Thermal Conductivity of PCMs

In this part, the effect of the thermal conductivity of PCMs on room energy consumption was investigated. During the ventilated month of the roof, the energy consumption of the room is shown in Figure 8a when the PCMs with different thermal conductivity were placed on the roof. Moreover, the internal surface temperature history of the roof from 6 July to 10 July is shown in Figure 9a. It can be seen that as the thermal conductivity decreased, the energy consumption of the room also decreased. When the thermal conductivity was less than 1.5 W·m−1·K−1, the reduction in energy consumption became larger. In July, nighttime ventilation facilitated the solidification of the PCMs to release heat, and a portion of the heat was transferred to the room. When ventilation was stopped, the cold energy stored in the building materials at night was gradually transferred to the room. Subsequently, as the solar radiation gradually increased, the heat absorbed by the building materials was also gradually transferred to the room. In these processes, thermal conductivity played an important role in heat transfer, and the greater the thermal conductivity was, the faster the energy transfer was. Therefore, the room energy consumption increased as the thermal conductivity of the PCMs increased. However, as shown in Figure 8b, during the ventilated month of the south wall, the more the thermal conductivity of the PCMs integrated into the south wall, the lower the energy consumption of the room was. The internal surface temperature history of the south wall from 21 January to 25 January is shown in Figure 9b. During the ventilation period of the south wall, when the hot air flowed to air layer 3 at a certain flow rate during the daytime, the PCMs with a larger thermal conductivity could absorb more heat and reduce the cooling energy consumption. Moreover, at night, the PCMs with a larger thermal conductivity could release more heat into the room and reduce the heating energy consumption. Therefore, the room energy consumption decreased as the thermal conductivity of the PCMs increased.

4. Conclusions

A phase change energy storage building envelope with the ventilated cavity for thermal management throughout the year was proposed. CM/EG with different phase change temperatures was selected, in which the PCM with lower phase change temperature was installed on the south wall, and the PCM with higher phase change temperature was integrated on the roof and the other three walls. Detailed numerical research was carried out to obtain the room energy consumption under different influencing factors, including the phase change temperature, room type, air layer thickness, airflow rate, and thermal conductivity of the PCMs. It was found the phase change energy storage building envelope with the ventilated cavity could reduce the energy consumption during both heating and cooling seasons. Based on the results of numerical simulation, the following conclusions are drawn:
(1) The phase change temperature of the PCMs directly affected the energy consumption of the room. The optimal PCMs for the roof and south wall were PCM2 and PCM8, respectively.
(2) When the air layer was ventilated or the solar absorbing coating was applied to the south wall, the energy consumption of the room would reduce. The energy-saving effect of the solar absorbing coating was better than that of the ventilated air layer. However, when both of them were applied to the trombe room, the best energy-saving effect was achieved, which could save about 30% of energy consumption, compared with the ventilation-free and uncoated trombe room. At this time, the room integrated with the PCM could further save about 3% of energy consumption, compared with the reference room.
(3) As the thickness of the air layer increased, the increase in the room heating energy consumption was greater than the reduction in the room cooling energy consumption. Therefore, in this case, the thicker the air layer was, the higher the energy consumption of the room was.
(4) As the ventilation rate of air layer 1 or air layer 2 increased, the room energy consumption decreased. Similarly, the higher the flow rate between air layer 2 and the room was, the lower the energy consumption of the room was. However, there is an optimum value for the flow rate between air layer 2, air layer 3, and the room to minimize the energy consumption of the room, which was 0.09 m3·s−1.
(5) During the ventilated month of the roof, as the thermal conductivity of the PCM integrated on the roof was reduced, the energy consumption of the room was reduced. However, during the ventilated month of the south wall, the more the thermal conductivity of the PCMs integrated into the south wall, the lower the energy consumption of the room was.

Author Contributions

Conceptualization, R.Y.; methodology, R.Y.; validation, R.Y., X.F. and Z.Z.; formal analysis, R.Y.; investigation, R.Y.; resources, X.F. and Z.Z.; data curation, R.Y.; writing—original draft preparation, R.Y.; writing—review and editing, X.F.; supervision, Z.Z.; project administration, X.F.; funding acquisition, R.Y. All authors have read and agreed to the published version of the manuscript.

Funding

This research and APC was funded by the National Natural Science Foundation of China, grant number 52006250.

Conflicts of Interest

The authors declare no conflict of interest.

Nomenclature

Cpspecific heat (J·kg−1·K−1)
Δxfinite difference layer thickness (m)
Δtcalculation time step
Tnode temperature (°C)
kWthermal conductivity of interface between i node and i + 1 node (W·m−1·K−1)
kEthermal conductivity of interface between i node and i − 1 node (W·m−1·K−1)
hinode enthalpy (J·kg−1)
HTFenthalpy–temperature function
Cspace discretization constant
FoFourier Number
Greek letters
ρdensity (kg·m−3)
αthermal diffusivity of the material (m2·s−1)
Superscript
jprevious time step
j + 1new time step
Subscripts
ppressure
inode being modeled
i + 1adjacent node to interior of building structure
i − 1adjacent node to exterior of building structure

References

  1. Zeng, C.; Liu, S.; Shukla, A. Adaptability research on phase change materials based technologies in China. Renew. Sustain. Energy Rev. 2017, 73, 145–158. [Google Scholar] [CrossRef]
  2. Zhang, T.; Tan, Y.; Yang, H.; Zhang, X. The application of air layers in building envelopes: A review. Appl. Energy 2016, 165, 707–734. [Google Scholar] [CrossRef]
  3. Zeinelabdein, R.; Omer, S.; Gan, G. Critical review of latent heat storage systems for free cooling in buildings. Renew. Sustain. Energy Rev. 2018, 82, 2843–2868. [Google Scholar] [CrossRef]
  4. Sozer, H. Improving energy efficiency through the design of the building envelope. Build. Environ. 2010, 45, 2581–2593. [Google Scholar] [CrossRef]
  5. Fang, Z.; Li, N.; Li, B.; Luo, G.; Huang, Y. The effect of building envelope insulation on cooling energy consumption in summer. Energy Build. 2014, 77, 197–205. [Google Scholar] [CrossRef]
  6. Ye, R.; Lin, W.; Yuan, K.; Fang, X.; Zhang, Z. Experimental and numerical investigations on the thermal performance of building plane containing CaCl2·6H2O/expanded graphite composite phase change material. Appl. Energy 2017, 193, 325–335. [Google Scholar] [CrossRef]
  7. Zhu, L.; Yang, Y.; Chen, S.; Sun, Y. Numerical study on the thermal performance of lightweight temporary building integrated with phase change materials. Appl. Therm. Eng. 2018, 138, 35–47. [Google Scholar] [CrossRef]
  8. Asgharian, H.; Baniasadi, E. A review on modeling and simulation of solar energy storage systems based on phase change materials. J. Energy Storage 2019, 21, 186–201. [Google Scholar] [CrossRef]
  9. Leong, K.Y.; Rahman, M.R.A.; Gurunathan, B.A. Nano-enhanced phase change materials: A review of thermo-physical properties, applications and challenges. J. Energy Storage 2019, 21, 18–31. [Google Scholar] [CrossRef]
  10. Liu, Y.; Yu, K.; Gao, X.; Ren, M.; Jia, M.; Yang, Y. Enhanced thermal properties of hydrate salt/poly (acrylate sodium) copolymer hydrogel as form-stable phase change material via incorporation of hydroxyl carbon nanotubes. Sol. Energy Mater. Sol. Cells 2020, 208, 110387. [Google Scholar] [CrossRef]
  11. Oropeza-Perez, I.; Østergaard, P.A. Active and passive cooling methods for dwellings: A review. Renew. Sustain. Energy Rev. 2018, 82, 531–544. [Google Scholar] [CrossRef]
  12. Kong, X.; Jie, P.; Yao, C.; Liu, Y. Experimental study on thermal performance of phase change material passive and active combined using for building application in winter. Appl. Energy 2017, 206, 293–302. [Google Scholar] [CrossRef]
  13. Kara, Y.A. Diurnal performance analysis of phase change material walls. Appl. Therm. Eng. 2016, 102, 1–8. [Google Scholar] [CrossRef]
  14. Zhou, G.; He, J. Thermal performance of a radiant floor heating system with different heat storage materials and heating pipes. Appl. Energy 2015, 138, 648–660. [Google Scholar] [CrossRef]
  15. Zhou, D.; Tian, Y.; Qu, Y.; Chen, Y. Thermal analysis of phase change material board (PCMB) under weather conditions in the summer. Appl. Therm. Eng. 2016, 99, 690–702. [Google Scholar] [CrossRef] [Green Version]
  16. Navarro, L.; de Gracia, A.; Niall, D.; Castell, A.; Browne, M.; McCormack, S.; Griffiths, P.; Cabeza, L.F. Thermal energy storage in building integrated thermal systems: A review. Part 2. Integration as passive system. Renew. Energy 2016, 85, 1334–1356. [Google Scholar] [CrossRef] [Green Version]
  17. Alam, M.; Sanjayan, J.; Zou, P.X.; Ramakrishnan, S.; Wilson, J. Evaluating the passive and free cooling application methods of phase change materials in residential buildings: A comparative study. Energy Build. 2017, 148, 238–256. [Google Scholar] [CrossRef]
  18. Ye, R.; Lin, W.; Fang, X.; Zhang, Z. A numerical study of building integrated with CaCl2·6H2O/expanded graphite composite phase change material. Appl. Therm. Eng. 2017, 126, 480–488. [Google Scholar] [CrossRef]
  19. Zhou, D.; Shire, G.; Tian, Y. Parametric analysis of influencing factors in Phase Change Material Wallboard (PCMW). Appl. Energy 2014, 119, 33–42. [Google Scholar] [CrossRef] [Green Version]
  20. Jin, X.; Medina, M.A.; Zhang, X. Numerical analysis for the optimal location of a thin PCM layer in frame walls. Appl. Therm. Eng. 2016, 103, 1057–1063. [Google Scholar] [CrossRef] [Green Version]
  21. Kong, X.; Yao, C.; Jie, P.; Liu, Y.; Qi, C.; Rong, X. Development and thermal performance of an expanded perlite-based phase change material wallboard for passive cooling in building. Energy Build. 2017, 152, 547–557. [Google Scholar] [CrossRef]
  22. Ramakrishnan, S.; Wang, X.; Sanjayan, J.; Wilson, J. Thermal performance assessment of phase change material integrated cementitious composites in buildings: Experimental and numerical approach. Appl. Energy 2017, 207, 654–664. [Google Scholar] [CrossRef]
  23. Wang, Z.; Liu, S.; Ma, G.; Xie, S.; Du, G.; Sun, J.; Jia, Y. Preparation and properties of caprylic-nonanoic acid mixture/expanded graphite composite as phase change material for thermal energy storage. Int. J. Energy Res. 2017, 41, 2555–2564. [Google Scholar] [CrossRef]
  24. Jaworski, M. Thermal performance of building element containing phase change material (PCM) integrated with ventilation system–An experimental study. Appl. Therm. Eng. 2014, 70, 665–674. [Google Scholar] [CrossRef]
  25. Solgi, E.; Kari, B.M.; Fayaz, R.; Taheri, H. The impact of phase change materials assisted night purge ventilation on the indoor thermal conditions of office buildings in hot-arid climates. Energy Build. 2017, 150, 488–497. [Google Scholar] [CrossRef] [Green Version]
  26. Zhang, Y.; Cui, H.; Tang, W.; Sang, G.; Wu, H. Effect of Summer Ventilation on the Thermal Performance and Energy Efficiency of Buildings Utilizing Phase Change Materials. Energies 2017, 10, 1214. [Google Scholar] [CrossRef] [Green Version]
  27. Liu, J.; Liu, Y.; Yang, L.; Liu, T.; Zhang, C.; Dong, H. Climatic and seasonal suitability of phase change materials coupled with night ventilation for office buildings in Western China. Renew. Energy 2020, 147, 356–373. [Google Scholar] [CrossRef]
  28. Adilkhanova, I.; Memon, S.A.; Kim, J.; Sheriyev, A. A novel approach to investigate the thermal comfort of the lightweight relocatable building integrated with PCM in different climates of Kazakhstan during summertime. Energy 2021, 217, 119390. [Google Scholar] [CrossRef]
  29. Evola, G.; Marletta, L.; Sicurella, F. Simulation of a ventilated cavity to enhance the effectiveness of PCM wallboards for summer thermal comfort in buildings. Energy Build. 2014, 70, 480–489. [Google Scholar] [CrossRef]
  30. Luo, C.; Xu, L.; Ji, J.; Liao, M.; Sun, D. Experimental study of a modified solar phase change material storage wall system. Energy 2017, 128, 224–231. [Google Scholar] [CrossRef] [Green Version]
  31. Ye, R.; Zhang, C.; Sun, W.; Fang, X.; Zhang, Z. Novel wall panels containing CaCl2·6H2O-Mg(NO3)2·6H2O/expanded graphite composites with different phase change temperatures for building energy savings. Energy Build. 2018, 176, 407–417. [Google Scholar] [CrossRef]
  32. Ye, R.; Huang, R.; Fang, X.; Zhang, Z. Simulative optimization on energy saving performance of phase change panels with different phase transition temperatures. Sustain. Cities Soc. 2020, 52, 101833. [Google Scholar] [CrossRef]
  33. Tabares-Velasco, P.C.; Christensen, C.; Bianchi, M. Validation Methodology to Allow Simulated Peak Reduction and Energy Performance Analysis of Residential Building Envelope with Phase Change Materials: Preprint; National Renewable Energy Laboratory: Golden, CO, USA, 2012. [Google Scholar]
  34. Guarino, F.; Athienitis, A.; Cellura, M.; Bastien, D. PCM thermal storage design in buildings: Experimental studies and applications to solaria in cold climates. Appl. Energy 2017, 185, 95–106. [Google Scholar] [CrossRef]
  35. Ramakrishnan, S.; Wang, X.; Alam, M.; Sanjayan, J.; Wilson, J.L. Parametric analysis for performance enhancement of phase change materials in naturally ventilated buildings. Energy Build. 2016, 124, 35–45. [Google Scholar] [CrossRef]
  36. Jamil, H.; Alam, M.; Sanjayan, J.; Wilson, J.L. Investigation of PCM as retrofitting option to enhance occupant thermal comfort in a modern residential building. Energy Build. 2016, 133, 217–229. [Google Scholar] [CrossRef]
  37. Tabares-Velasco, P.C.; Christensen, C.; Bianchi, M. Verification and validation of Energy Plus phase change material model for opaque wall assemblies. Build. Environ. 2012, 54, 186–196. [Google Scholar] [CrossRef]
  38. Auzeby, M.; Wei, S.; Underwood, C.; Tindall, J.; Chen, C.; Ling, H.; Buswell, R. Effectiveness of Using Phase Change Materials on Reducing Summer Overheating Issues in UK Residential Buildings with Identification of Influential Factors. Energies 2016, 9, 605. [Google Scholar] [CrossRef] [Green Version]
  39. Sage-Lauck, J.; Sailor, D. Evaluation of phase change materials for improving thermal comfort in a super-insulated residential building. Energy Build. 2014, 79, 32–40. [Google Scholar] [CrossRef]
  40. Nghana, B.; Tariku, F. Phase change material’s (PCM) impacts on the energy performance and thermal comfort of buildings in a mild climate. Build. Environ. 2016, 99, 221–238. [Google Scholar] [CrossRef]
Figure 1. (a) Schematic of the model room; (b) schematic of the roof; (c) schematic of the south wall: (1) plasterboard; (2) PCM panel; (3) construction material; (4) solar absorbing coating.
Energies 14 03874 g001
Figure 2. Enthalpy temperature curves of CaCl2·6H2O-Mg(NO3)2·6H2O/EG with different mass fractions of Mg(NO3)2·6H2O.
Energies 14 03874 g002
Figure 3. The energy consumption of the room with different PCMs installed on (a) the roof and (b) the south wall.
Energies 14 03874 g003aEnergies 14 03874 g003b
Figure 4. The energy consumption of different room types: (a) without PCM and (b) with PCM.
Energies 14 03874 g004
Figure 5. The inner surface temperature history of the south wall (a) from 21 January to 25 January and (b) the energy consumption of the room in the heating season under the different thicknesses of air layer 3.
Energies 14 03874 g005aEnergies 14 03874 g005b
Figure 6. The energy consumption of the room when the flow rate is at different values: (a) air layer 1 and air layer 2; (b) between air layer 3 and the room; (c) between air layer 2, air layer 3, and the room.
Energies 14 03874 g006aEnergies 14 03874 g006b
Figure 7. During the ventilated month of the south wall, the energy consumption of the room when the flow rate among air layer 2, air layer 3, and room is at different values.
Energies 14 03874 g007
Figure 8. During the ventilated month of (a) the roof and (b) the south wall, the energy consumption of the room when installing the PCMs with different thermal conductivity on (a) the roof and (b) the south wall.
Energies 14 03874 g008aEnergies 14 03874 g008b
Figure 9. (a) The inner surface temperature history of the roof from 6 July to 10 July; (b) the south wall from 21 January to 25 January.
Energies 14 03874 g009aEnergies 14 03874 g009b
Table 1. Details of the rooms.
EnvelopeConstruction (from Outside to Inside)
RoofNo PCM20 mm mortar, 10 mm EPS, 30 mm ceramsite concrete, 20 mm mortar, 120 mm reinforcement concrete, 20 mm air layer, and 20 mm plasterboard
With PCM20 mm mortar, 10 mm EPS, 30 mm ceramsite concrete, 20 mm mortar, 120 mm reinforcement concrete, 20 mm PCM, 20 mm air layer, and 20 mm plasterboard
External wallNo PCM20 mm mortar, 10 mm EPS, 180 mm reinforcement concrete, and 20 mm mortar
With PCM20 mm mortar, 10 mm EPS, 180 mm reinforcement concrete, 20 mm mortar, and 20 mm PCM
South wallNo PCM6 mm glass, 20 mm air layer, 20 mm mortar, 10 mm EPS, 180 mm reinforcement concrete, 20 mm mortar, 20 mm air layer, and 20 mm plasterboard
With PCM6 mm glass, 20 mm air layer, 20 mm mortar, 10 mm EPS, 180 mm reinforcement concrete, 20 mm mortar, 20 mm PCM, 20 mm air layer, and 20 mm plasterboard
Floor120 mm reinforcement concreter
Window6 mm low-E glass, 12 mm air layer, and 6 mm glass
Door50 mm wood
Table 2. Thermophysical properties of the building materials.
MaterialDensity
(kg·m−3)
Thermal Conductivity
(W·m−1·K−1)
Specific Heat Capacity
(J·kg−1·K−1)
EPS350.0451380
Mortar18000.931050
Ceramsite concrete16000.841050
Reinforcement concrete25001.74920
Wood5000.142510
Plasterboard10500.331050
PCM (0, 2, 5, 8)8505.52907
PCM (10, 12, 15)8505.63131
Table 3. Ventilation schedule.
Ventilation PathBetween Air Layer 1 and the External EnvironmentBetween Air Layer 2 and the External EnvironmentAmong Air Layer 2, Air Layer 3, and the RoomBetween Air Layer 3 and the Room
Ventilation time01/07–31/07
from 20:00 to 6:00
01/04–31/10
all day
01/12–28/02
from 11:00 to 19:00
01/03–31/03 and 01/11–30/11
all day
01/12–28/02
from 19:00 to 11:00
Table 4. The energy consumption of the room under different thicknesses of air layer.
Thickness (cm)Energy Consumption (kWh)
Air Layer 2Air Layer 3
22676.062676.06
42685.362693.27
62694.672710.51
Publisher’s Note: MDPI stays neutral with regard to jurisdictional claims in published maps and institutional affiliations.

