Article

Thermal and Surface Radiosity Analysis of an Underfloor Heating System in a Bioclimatic Habitat

1
LSTM Laboratory, Department of Renewable Energy, Faculty of Technology, University of Blida 1, Soumâa Street No. 270, 09130 Blida, Algeria
2
Department of Mechanical Engineering, Universitat Rovira i Virgili, Av. Països Catalans No. 26, 43007 Tarragona, Spain
*
Author to whom correspondence should be addressed.
Energies 2021, 14(13), 3880; https://doi.org/10.3390/en14133880
Submission received: 31 May 2021 / Revised: 21 June 2021 / Accepted: 24 June 2021 / Published: 28 June 2021
(This article belongs to the Section B: Energy and Environment)

Abstract

:
This paper addresses the modeling of convective and radiative heat transfer to achieve an acceptable level of indoor temperature. The results presented were obtained in a pilot project in which an energy-efficient house was built on a site located west of Algiers. The main objective was to perform a numerical simulation to investigate how the temperature of the heat-transfer fluid circulating in the floor heating system affected the temperature of the indoor air and also how surface radiosity affected the temperature profile of the indoor air. The study employed the finite element method integrated into the Comsol Multiphysics software. The model was validated using experimental data reported in the literature for the pilothouse at the same meteorological conditions. An error of about 2.32% was apparent between the experimental and theoretical results. Results showed that the increase of the heating transfer fluid temperature from 30 to 50 °C produced the same temperature of about 15.1 °C taken at a 50 cm height inside the room. The air temperature remained stable, with an insignificant variation after 72 h of heating. Surface radiosity increased as a function of time and reached an almost constant value of 380 W·m−2 after 72 h because of the stability of the air temperature by convection.

1. Introduction

Extensive studies have been carried out to reduce energy consumption in heating and cooling systems. This reduction can be obtained through ventilation, heat sinks, insulation improvement, the use of solar panels, and the use of energy-efficient appliances.
Energy efficiency and the integration of renewable energy to reduce energy consumption in buildings have produced a new generation of buildings called zero energy balance (ZEB). Ferrante and Cascella [1] reported that high-performing and zero-energy-balance buildings cannot be achieved by technology alone but are possible using integrated designs that combine passive tools, such as high-thermal mass brick-wall structures, high-reflective materials, solar shading devices, and ventilation strategies, with solar and wind energy microgeneration.
Investigations reported in the literature showed that zero energy balance and zero local CO2 emission residences are highly feasible if built in areas benefiting from the Mediterranean climate [1]. They can be achieved by applying energy-efficient solutions that, at the same time, use local materials and traditional construction processes. The result is high-quality performance buildings, located within recognizably urban environments.
Renewable energy is widely used to provide comfortable and healthy environments. Experimental investigations are useful for standardized methodologies [2,3]. Floor radiation, in particular, is used for heating and cooling applications. In recent years, several researchers have investigated radiant floor heating/cooling systems. These studies have demonstrated that a lower temperature of the floor surface is sufficient to ensure thermal comfort and that the temperature limit would be the dew point in the area in question. Spaces such as atriums and lobbies often have glass facades; thus, a huge amount of sunlight is directed at the floor [4]. Zhai et al. [2] investigated the green building at the Shanghai Science Research Institute, in which 150 m2 of tubular evacuated solar collectors had been installed to generate heat for the floor heating system. The authors reported that the ratio of greenhouse gas emissions from the heating area was about 1/3 in cold weather. Temperature control feedback was then used to measure the internal load changes. The effectiveness of the proposed system, in which the indoor thermal environment was set and controlled at acceptable conditions for comfort, was demonstrated by a laboratory test and Transient Systems Simulation Program (TRNSYS) simulation [5,6].
Applying a radiant floor cooling system would help prevent condensation from occurring on the floor surface in hot and humid weather. It is necessary to assess whether a floor influences the thermal comfort of the occupants. Lim et al. [7] reported that the effect of condensation on the floor surface depends on the control or the composed control system used in the absence of a drying system. This may affect the cost of construction in the area subject to environmental assessment. In order to choose the appropriate floor surface temperature range and material, several investigations were carried out focusing on human body physiological responses, including the instance of the buttocks in contact with the flooring materials used in the ONDOL floor heating system [8].
Other researchers have investigated the radiant floor heat transfer process using analytical solutions. Yu et al. [9] presented an analytical solution using a hydronic radiant modification to enhance the thermal performance of thermally activated building systems (TABS), and it is highly recommended. Monte [10] studied the transient response of one-dimensional multilayered composite conducting slabs to a sudden temperature variation in the surrounding fluid. The author applied the method of variable separation using the partial differential equation of heat conduction to describe the thermal field of layers and set the heat exchange between the composite slab and the surrounding fluid.
Lu and Tervola [11] proposed a new analytical approach of heat conduction in a composite slab subject to periodic temperature changes. Explicit solutions provided insights into the interaction between amplitude decay, time shifts, and signal amplitude. Beck et al. [12] carried out a research study that focused on solutions for the partial heating of rectangular solids using the time partitioning method, and it provided verification and precision features that were more than satisfactory.
Tests were carried out to establish the impact of direct solar radiation and the change in the air that was brought about by the fan and rug. The cooling capacity of the test was then assessed. The findings showed that the floor cooling potential is at direct solar radiation between 32 and 110 W·m−2. The maximum surface temperature was 26 °C on the part of the floor that was not exposed to solar radiation. The analysis was limited because the amount of solar radiation that affected the floor was low in that season of the year [13].
To achieve more practical findings valid for an underfloor heating system for winter conditions, Acikgoz et al. [14] employed the sidewalls of an experimental chamber. As a matter of fact, radiant floor cooling systems remove heat from the system via convection and long or shortwave radiations. In doing so, these systems control the environment. Shortwave radiation heat transfer is brought about by direct sunlight-based radiation, whereas longwave radiation heat transfer is brought about by inside heat sources in buildings, particularly walls. Even though the impact of direct solar radiation on radiant floor cooling loads has been studied mathematically and experimentally, the impact of internal wall surface temperatures on cooling loads in different wall configurations has not been thoroughly covered [15]. Zhao et al. [16] reported that the interior wall surface temperatures of various nontransparent constructions would surpass 28–35 °C because of the solar radiation on the walls. This demonstrates how radiant floor cooling loads are affected by the impact of wall surface temperatures.
Laouadi [17] developed a two-dimensional model for radiant system prediction to precisely estimate the circuit tubing–concrete contact surface temperature needed to compute the thermal capacity and the ceiling/floor temperatures for moisture condensation, thermal comfort, and controls. Weber and Johannesson [18] used a simplified star network and a triangular network to describe heat transfer in thermally activated building constructions. Heat transfer within the radiant medium was solved using one-dimensional numerical modeling already integrated into the energy simulation Comsol Multiphysics® software, and a two-dimensional analytical solution was developed and integrated into the software.
Other numerical and experimental investigations were focused on analyzing the characteristics of the floor temperature gradient. Holopainen et al. [19] simulated floor heating simulation using an uneven nodal network with the finite-difference heat balance method. The authors showed the benefits of placing the densest grids on the steepest curves of the temperature gradient.
As far as energy consumption is concerned, thermal comfort can be obtained through radiant cooling systems rather than the traditional AC system. Top-hung windows are widely used in metropolitan structures in Australia and Indonesia. In Australia, it has been recorded that a small top-hung window can be valuable for accomplishing warm solace by diminishing the effect of outside air [20].
Sattari and Farhanieh [21] carried out a sensitivity analysis to clarify the influence of the design parameters on a floor heating system. For this purpose, a finite element model was built for a typical room equipped with the aforementioned heating system. Transient conduction, convection, and radiation mechanisms of heat transfer were taken into account in the analysis. It was observed that the design parameters had different effects on the performance of the radiant heating system. It is worth noting that the floor cover composition and thickness were the most significant parameters affecting the heating system.
Zhai et al. [2] reported that the floor surface temperature is the parameter that most affects the heating/cooling capacity of radiant systems in a subtropical humid climate in Shanghai. In addition, considering comfort and air condensation, the floor surface temperature of a radiant floor system should be kept within certain temperature ranges during heating or cooling. The floor surface temperature should not be lower than 19 °C in summer, while it should not exceed 29 °C in the winter season. Therefore, floor surface temperature is the most important parameter in the design and energy assessment of radiant floor systems.
Radiant heating systems provide a thermal atmosphere that is more beneficial than convective heating systems. There are several research speculations that have recognized the significance of producing better thermal comfort [22]. According to Li [23], ventilation by layers improved the quality of indoor air, thermal productivity, and thermal comfort. More importantly, Lin et al. [24] found no significant distinction in the general thermal sensation between convective and radiant heating systems, regardless of the fact that the air flow was higher in the space warmed by the convective heating system. Hu et al. [25] examined the temperature dispersion of a floor heating (FH) system, a radiator, and a fan coil unit operating continuously. The results revealed that even though the thermal environment of the FH system was the most satisfying, still, no significant variation in thermal comfort was observed between the different terminals.
A pilot project by the name of “Mediterranean Energy Efficiency in the Construction Sector (Med-Enec)” was carried out by a consortium formed by the National Center for Integrated Building Studies and Research (EPST/CNERIB) and the Renewable Energy Development Centre (EPST/CDER) of Algeria. This project was carried out within the framework of the energy efficiency application in industrial construction and energy saving in buildings [26]. Imessad et al. [27] conducted a study on a pilothouse, built for the Med-Enec project, to evaluate the impact of thermal masses of eave and night ventilation to cover the energy demand for cooling. The authors concluded that the energy demand for cooling was more affected by thermal transmittance values than by the envelope thermal mass. A guideline was proposed and recommended for the optimum overhang length for south-facing windows. It was found that the combination of both natural ventilation and horizontal shading devices improved thermal comfort for occupants and significantly reduced the energy demand for cooling.
This paper investigates the influence that surface radiosity in underfloor heating systems exerts on thermal comfort in buildings. An analysis is made of the individual and combined effects on thermal comfort of surface radiosity and the natural convection of air flow inside the rooms. The behavior of surface radiosity in buildings is analyzed as a function of time. Therefore, a theoretical study of a floor heating system in a pilothouse was carried out and validated with experimental data from a pilot project reported by Benouali et al. [28] and Derradji et al. [29].

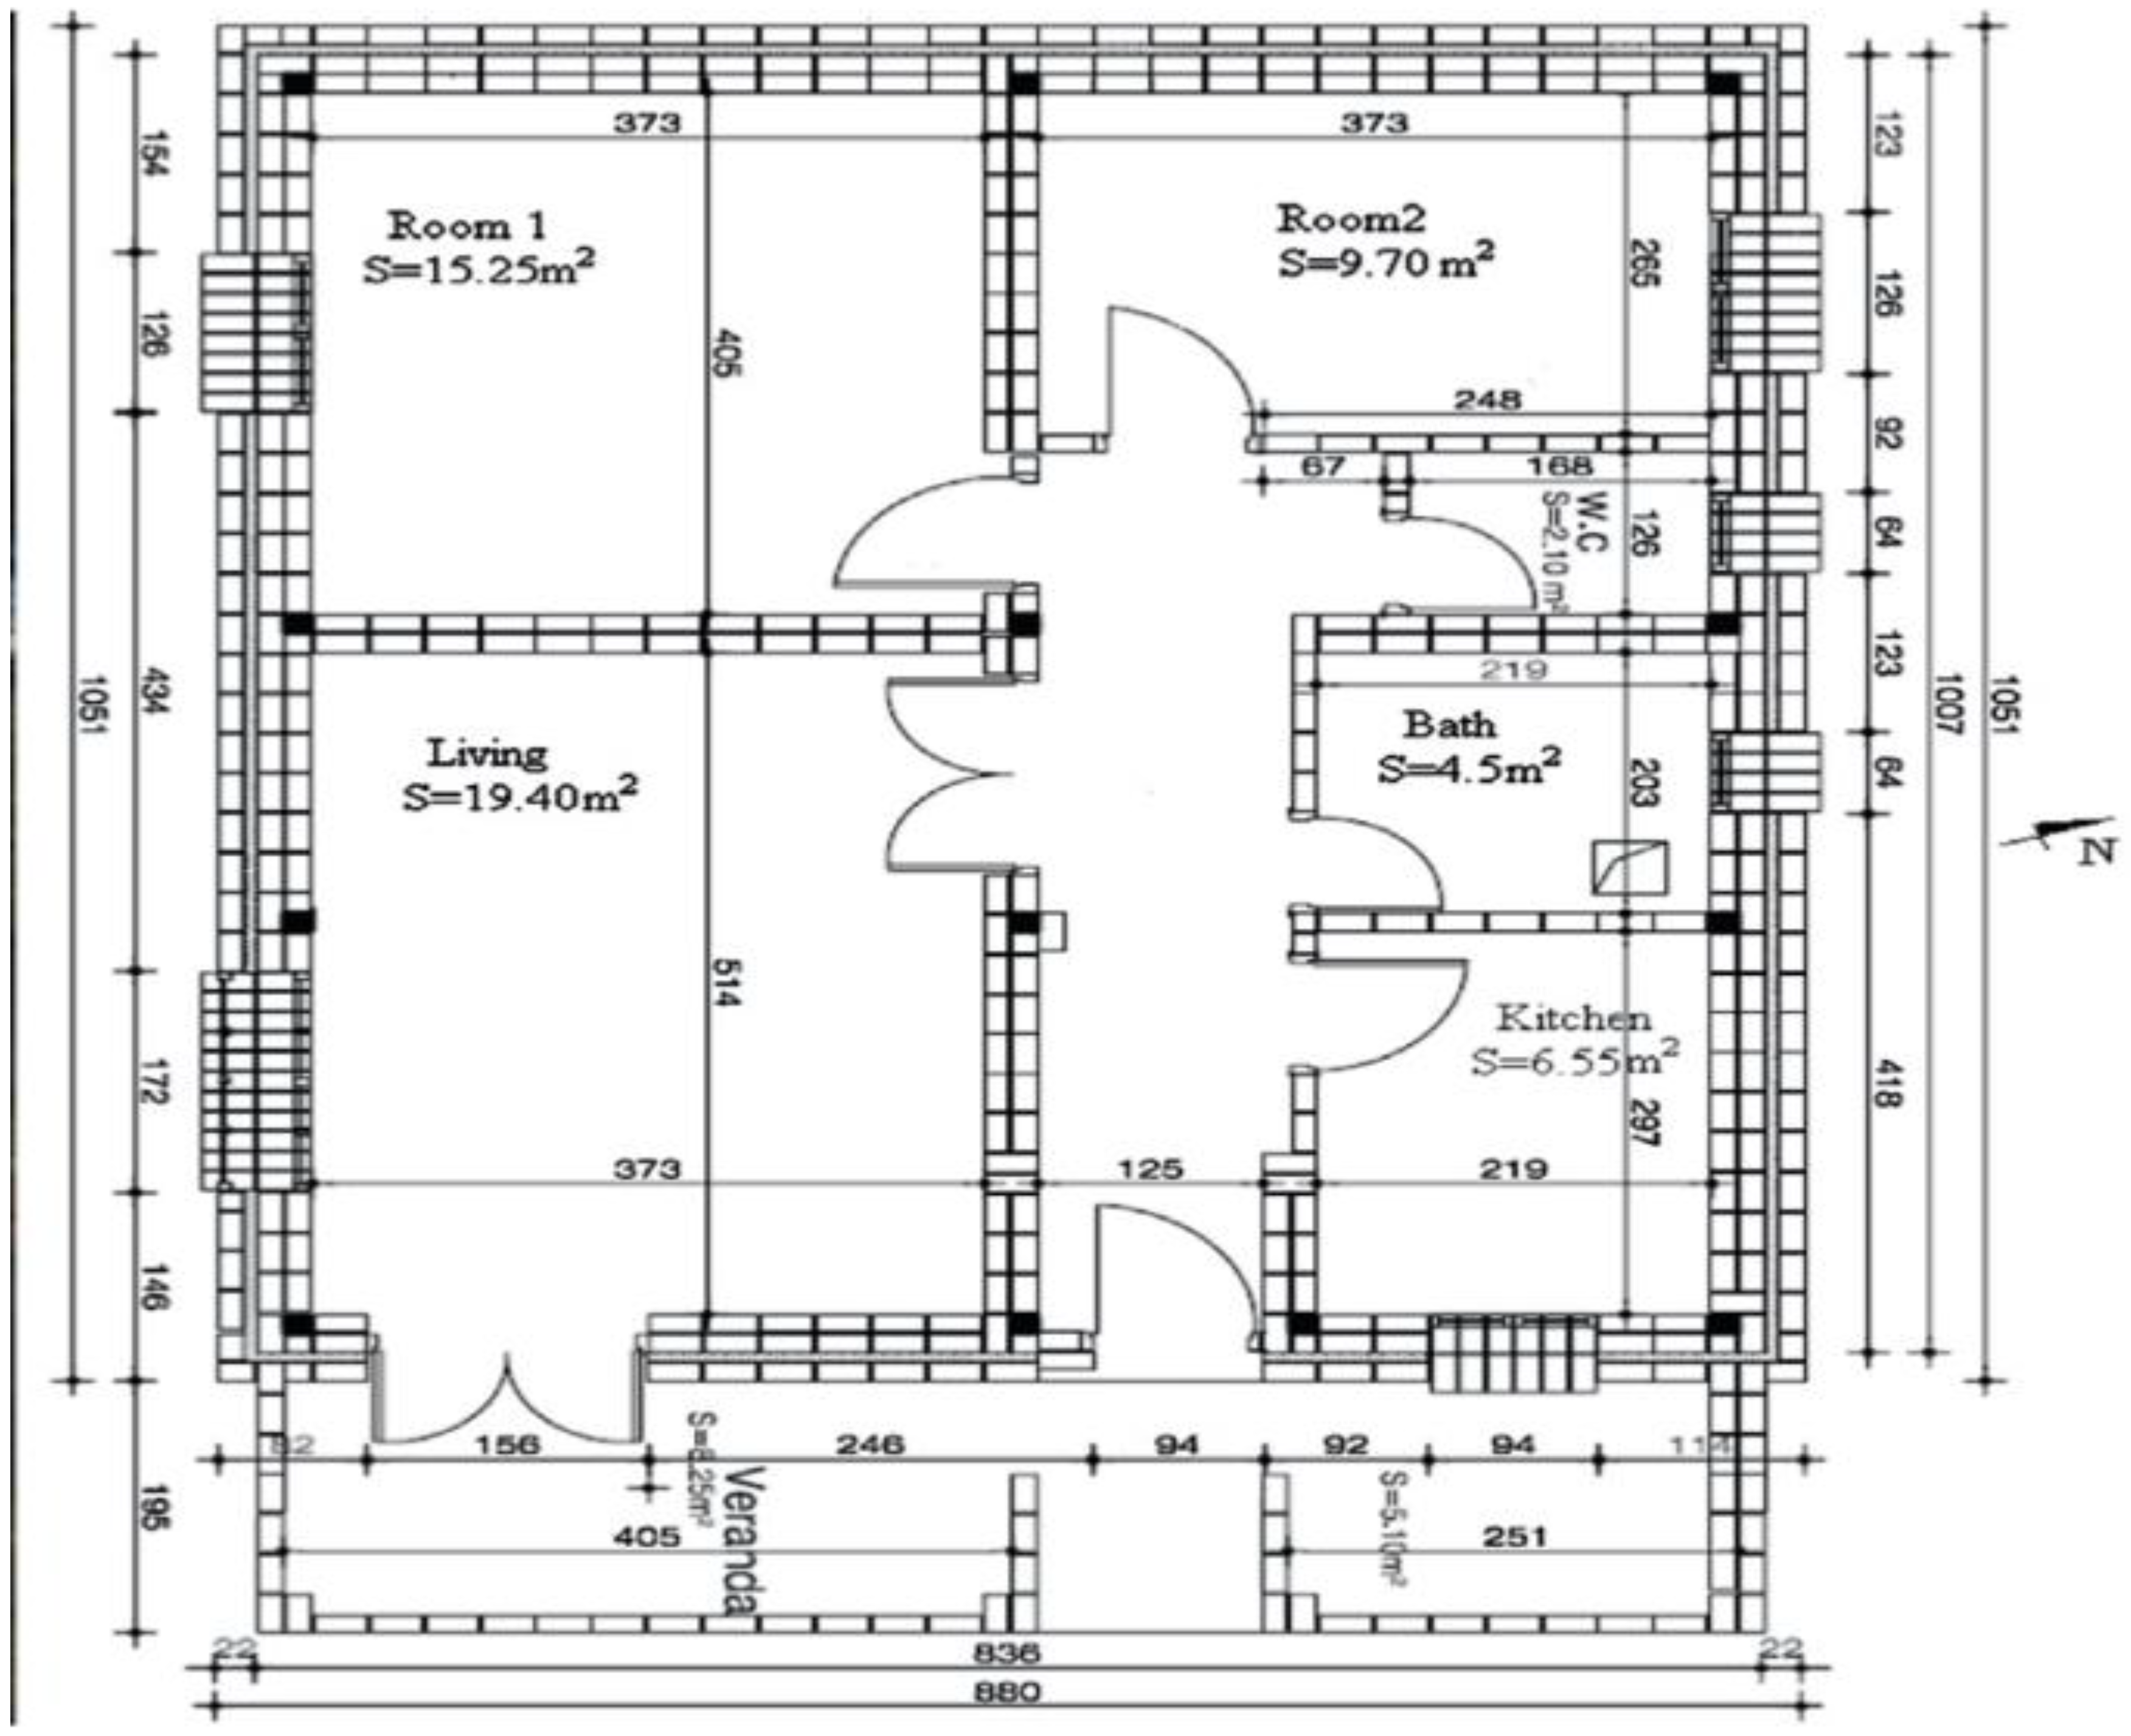
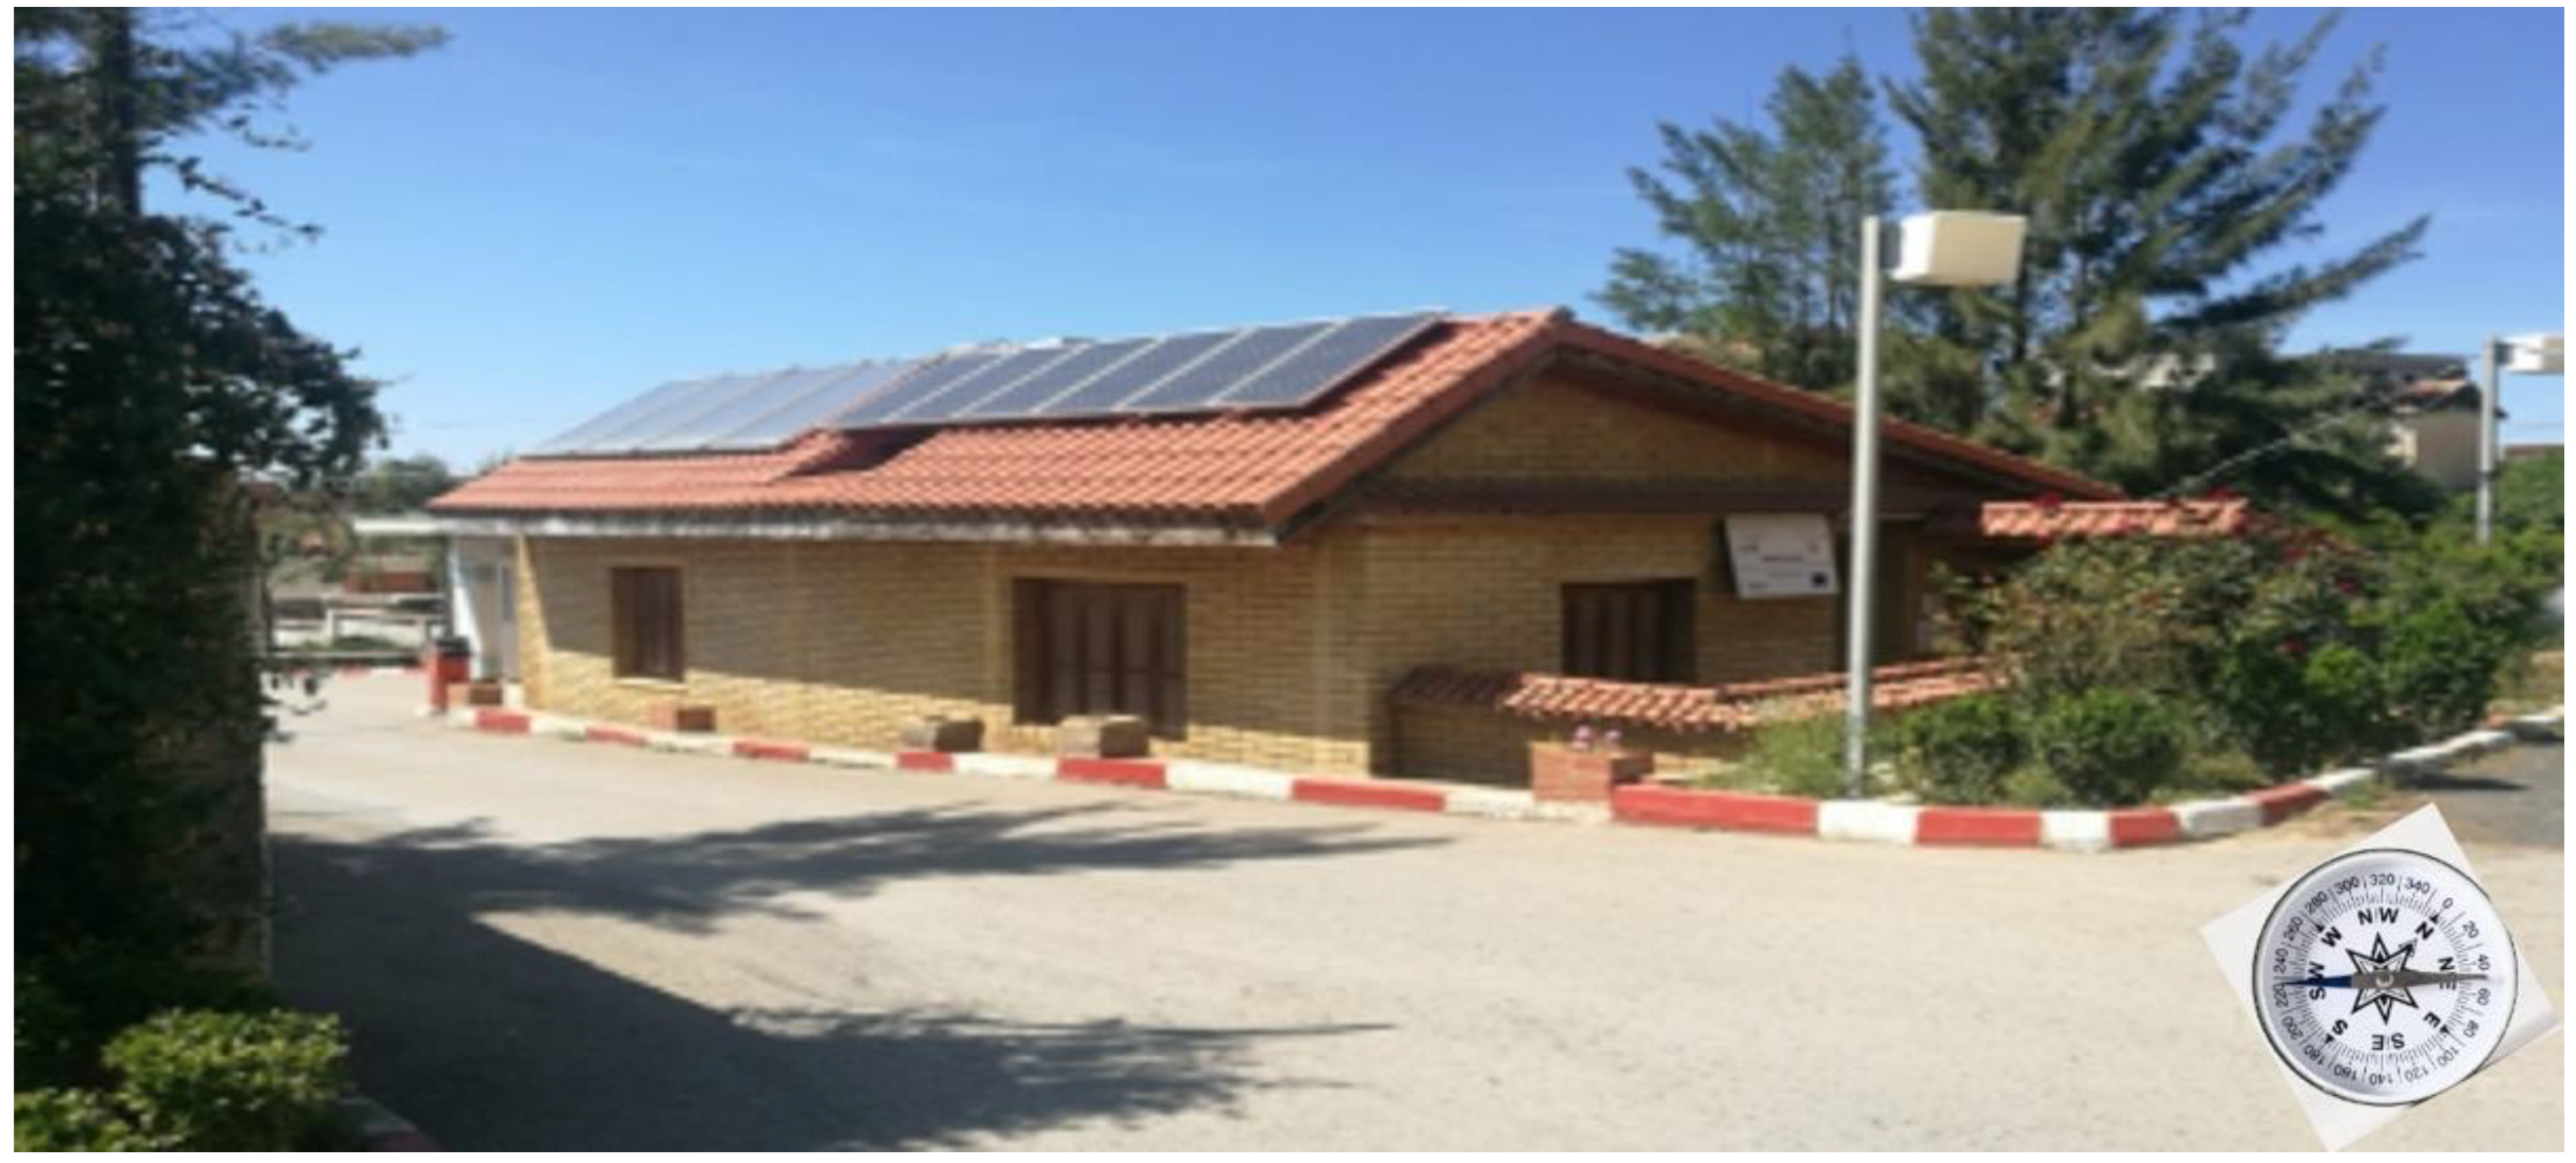
2. Description of the Pilothouse

The subject of this research, presented in Figure 1, is a rural prototype house, located west of Algiers in Souidania. The geographical coordinates are 36°707′ latitude, 2°914′ longitude, and 137 m altitude. The surface and volume of the pilothouse are about 80 m2 and 240 m3, respectively. The house was designed, taking into account certain bioclimatic architecture principles, discussed in Section 2.1, Section 2.2, Section 2.3, Section 2.4, Section 2.5 and Section 2.6 and was considered to be highly efficient [28]. Figure 2 below shows a picture of the built-up pilothouse.

2.1. Construction Materials

The house walls were constructed using stabilized earth concrete (BTS). BTS brick is an ecological building material with excellent moisture control, a long lifetime, good insulation characteristics, excellent acoustic qualities, and an interesting thermal storage capacity. To increase the useful life of the BTS bricks, a stabilizer (cement) was added with a quantity volume ranging from 3% to 6%. This is an environmentally sensible alternative to conventional materials.

2.2. Insulation

The BTS wall density is about 1700 kg·m−3. The heat transfer coefficient (Kwall) is 3.6 W·m−2·K−1 when the wall thickness is 14 cm and 2.54 W·m−2·K−1 in the case of 29 cm [30]. In the case of the present study, additional insulation was required in the walls. This was carried out as follows:
  • In the external walls, an intermediate layer of 9 cm expanded polystyrene was used, and a 1 mm thick layer of polyethylene film was added as a vapor barrier.
  • The ceiling was well insulated with 16 cm of expanded polystyrene, and a 1 mm layer of polyethylene film was added for protection against moisture diffusion.
  • The floor was insulated with 6 cm of extruded polystyrene (XPS).
  • The characteristics of the material used in each wall of the pilothouse are collected in Table 1.

2.3. Orientation

The orientation of the building was designed to take advantage of active and passive solar strategies. It also facilitated temperature moderation and the use of natural daylight. As shown in Figure 2 and Table 2, the house façade, which contains Zone 1 (Room 1) and Zone 2 (Room 2), was oriented to the south. The north is the coldest wall in the pilothouse; it confines a bathroom, a kitchen, and one wall in Zone 3 (living room). This configuration minimizes heat losses. West and east walls prevent overheating by the absence of openings on the west side and exploit the summer winds on the north-east side for cooling.

2.4. Windows

Windows and frames usually represent the “weakest point” in an energy-efficient building. Selecting appropriate windows can optimize the combination of natural lighting, ventilation, noise control, and security. Windows in the pilothouse were double-glazed with polyvinyl chloride (PVC) frames, as it has better insulating properties than aluminum.
The characteristics of the windows are:
  • Heat transfer coefficient of the glazing, Kg = 1 W·m−2·K−1;
  • Heat transfer coefficient of the frame, Kf = 1.2 W·m−2·K−1;
  • Heat transfer coefficient of all window elements, Kw = 1.2 W·m−2·K−1.
The frame occupied 20% of the total window area [31].

2.5. Thermal Bridges

Thermal bridges are discontinuities in any thermal barrier. They are more pronounced when the material creating the bridge is high thermal conductive. To minimize heat loss and limit the risk of condensation, Algerian DTR standards recommend choosing appropriate materials so as to guarantee that the thermal bridge is estimated lower than 20% of thermal transmittance losses [31].

2.6. Natural Cooling

Because the pilothouse is located on a site with a moderate climate, the use of natural ventilation, which is a passive cooling technique, can afford significant potential for energy savings. The natural ventilation system was ensured by openable windows to supply outdoor air at night. In addition, there are awnings on the windows, which help to block out the sun’s rays in summer.

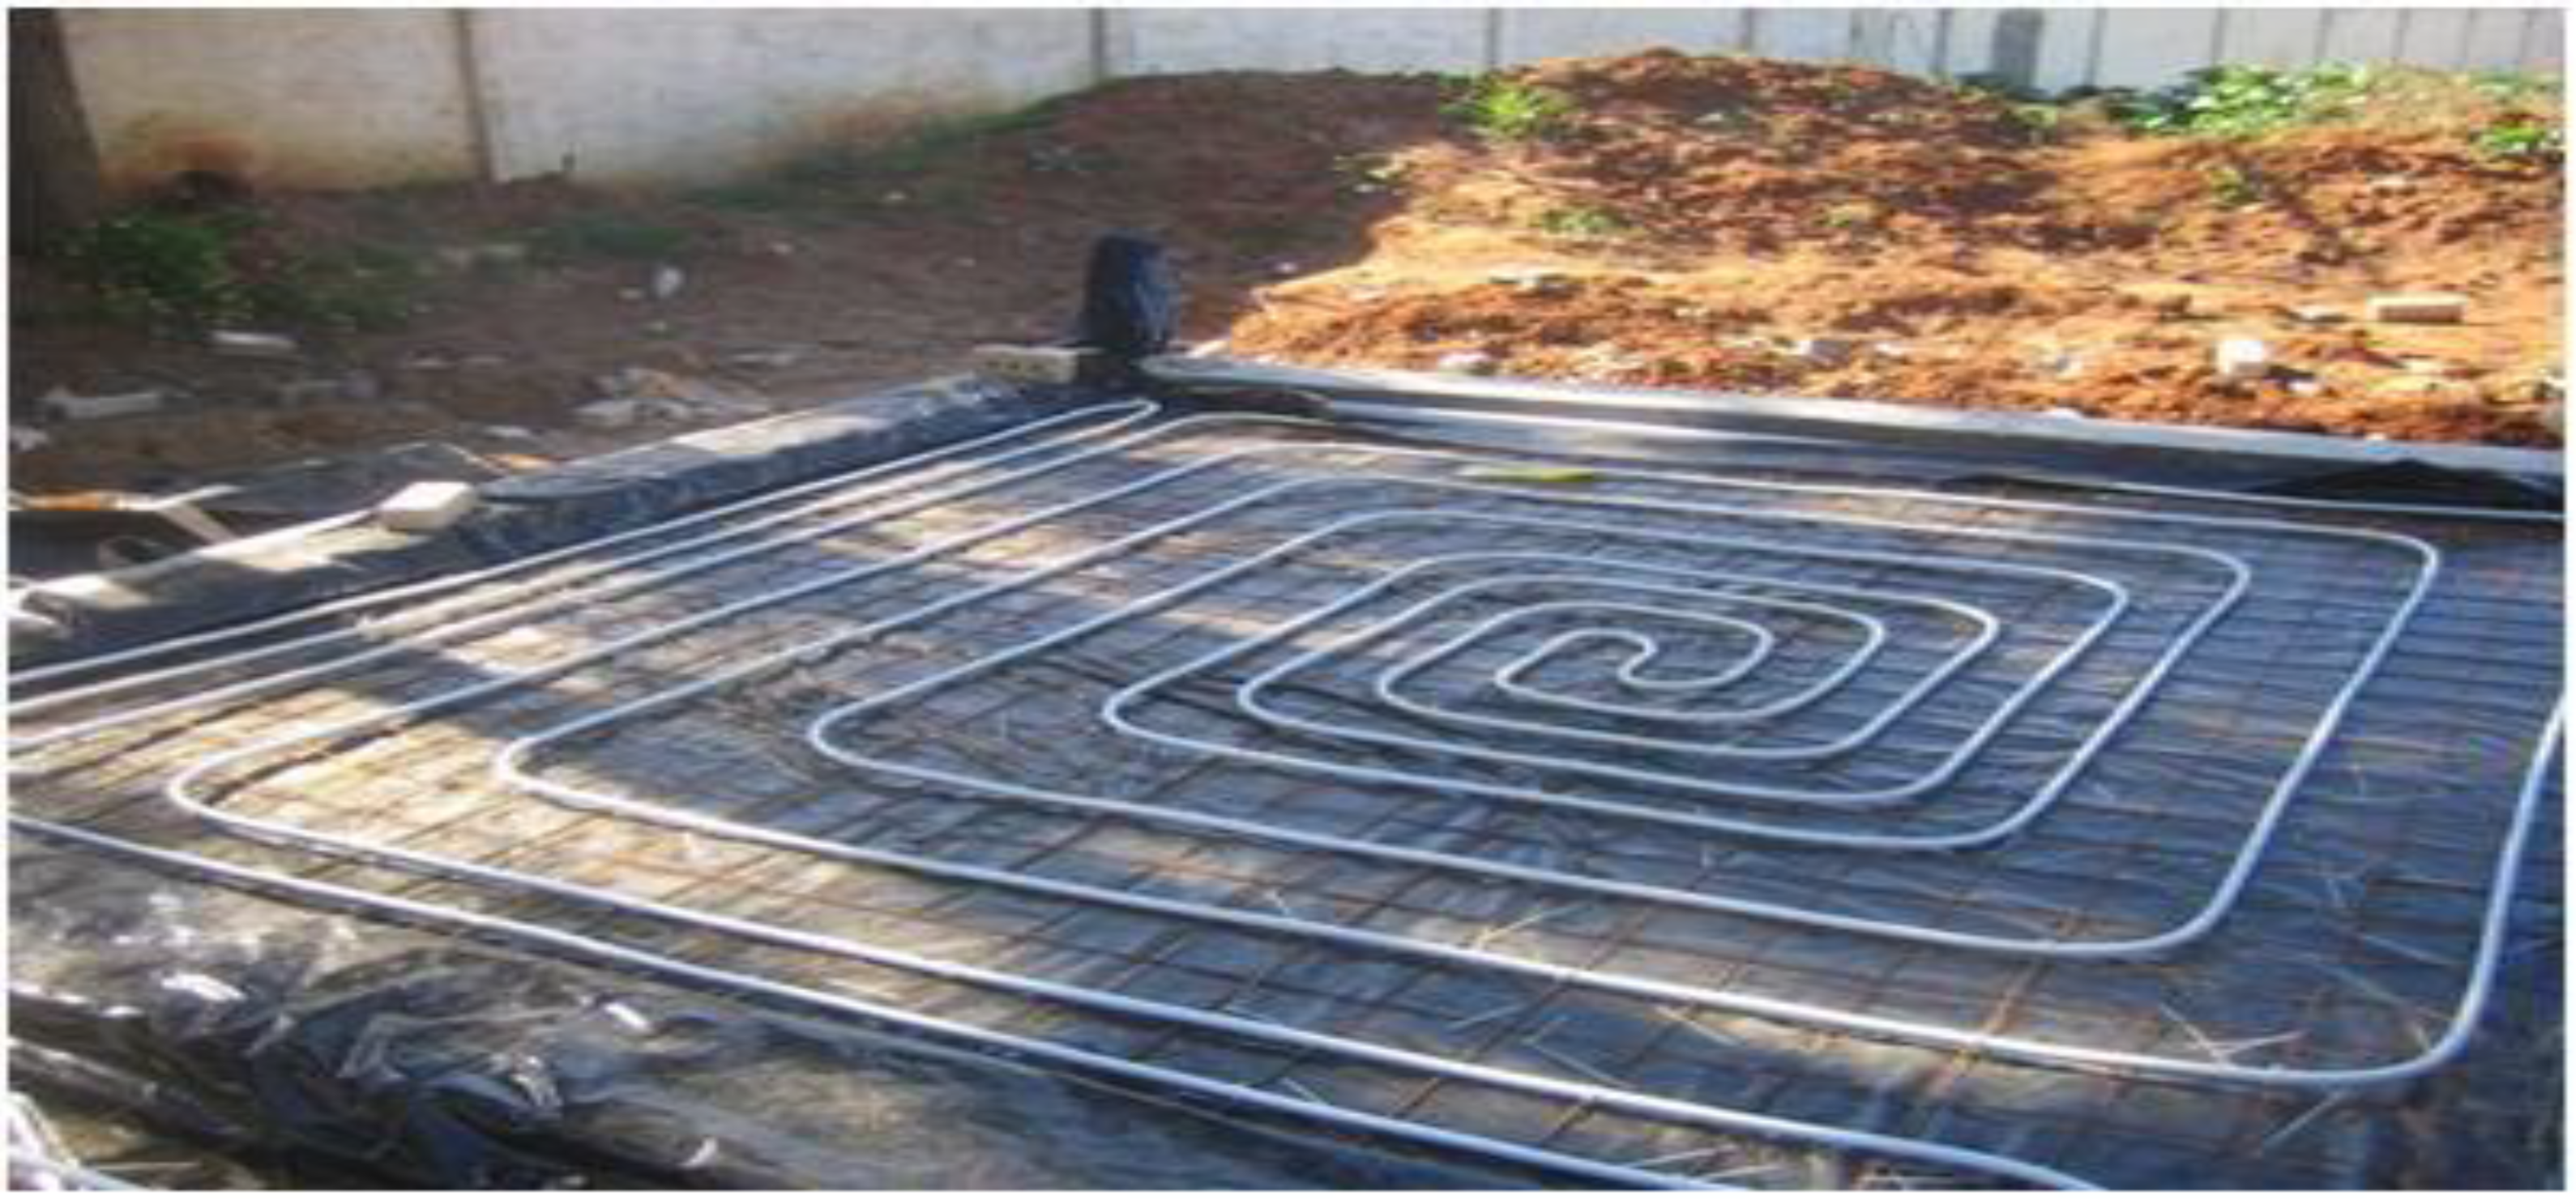
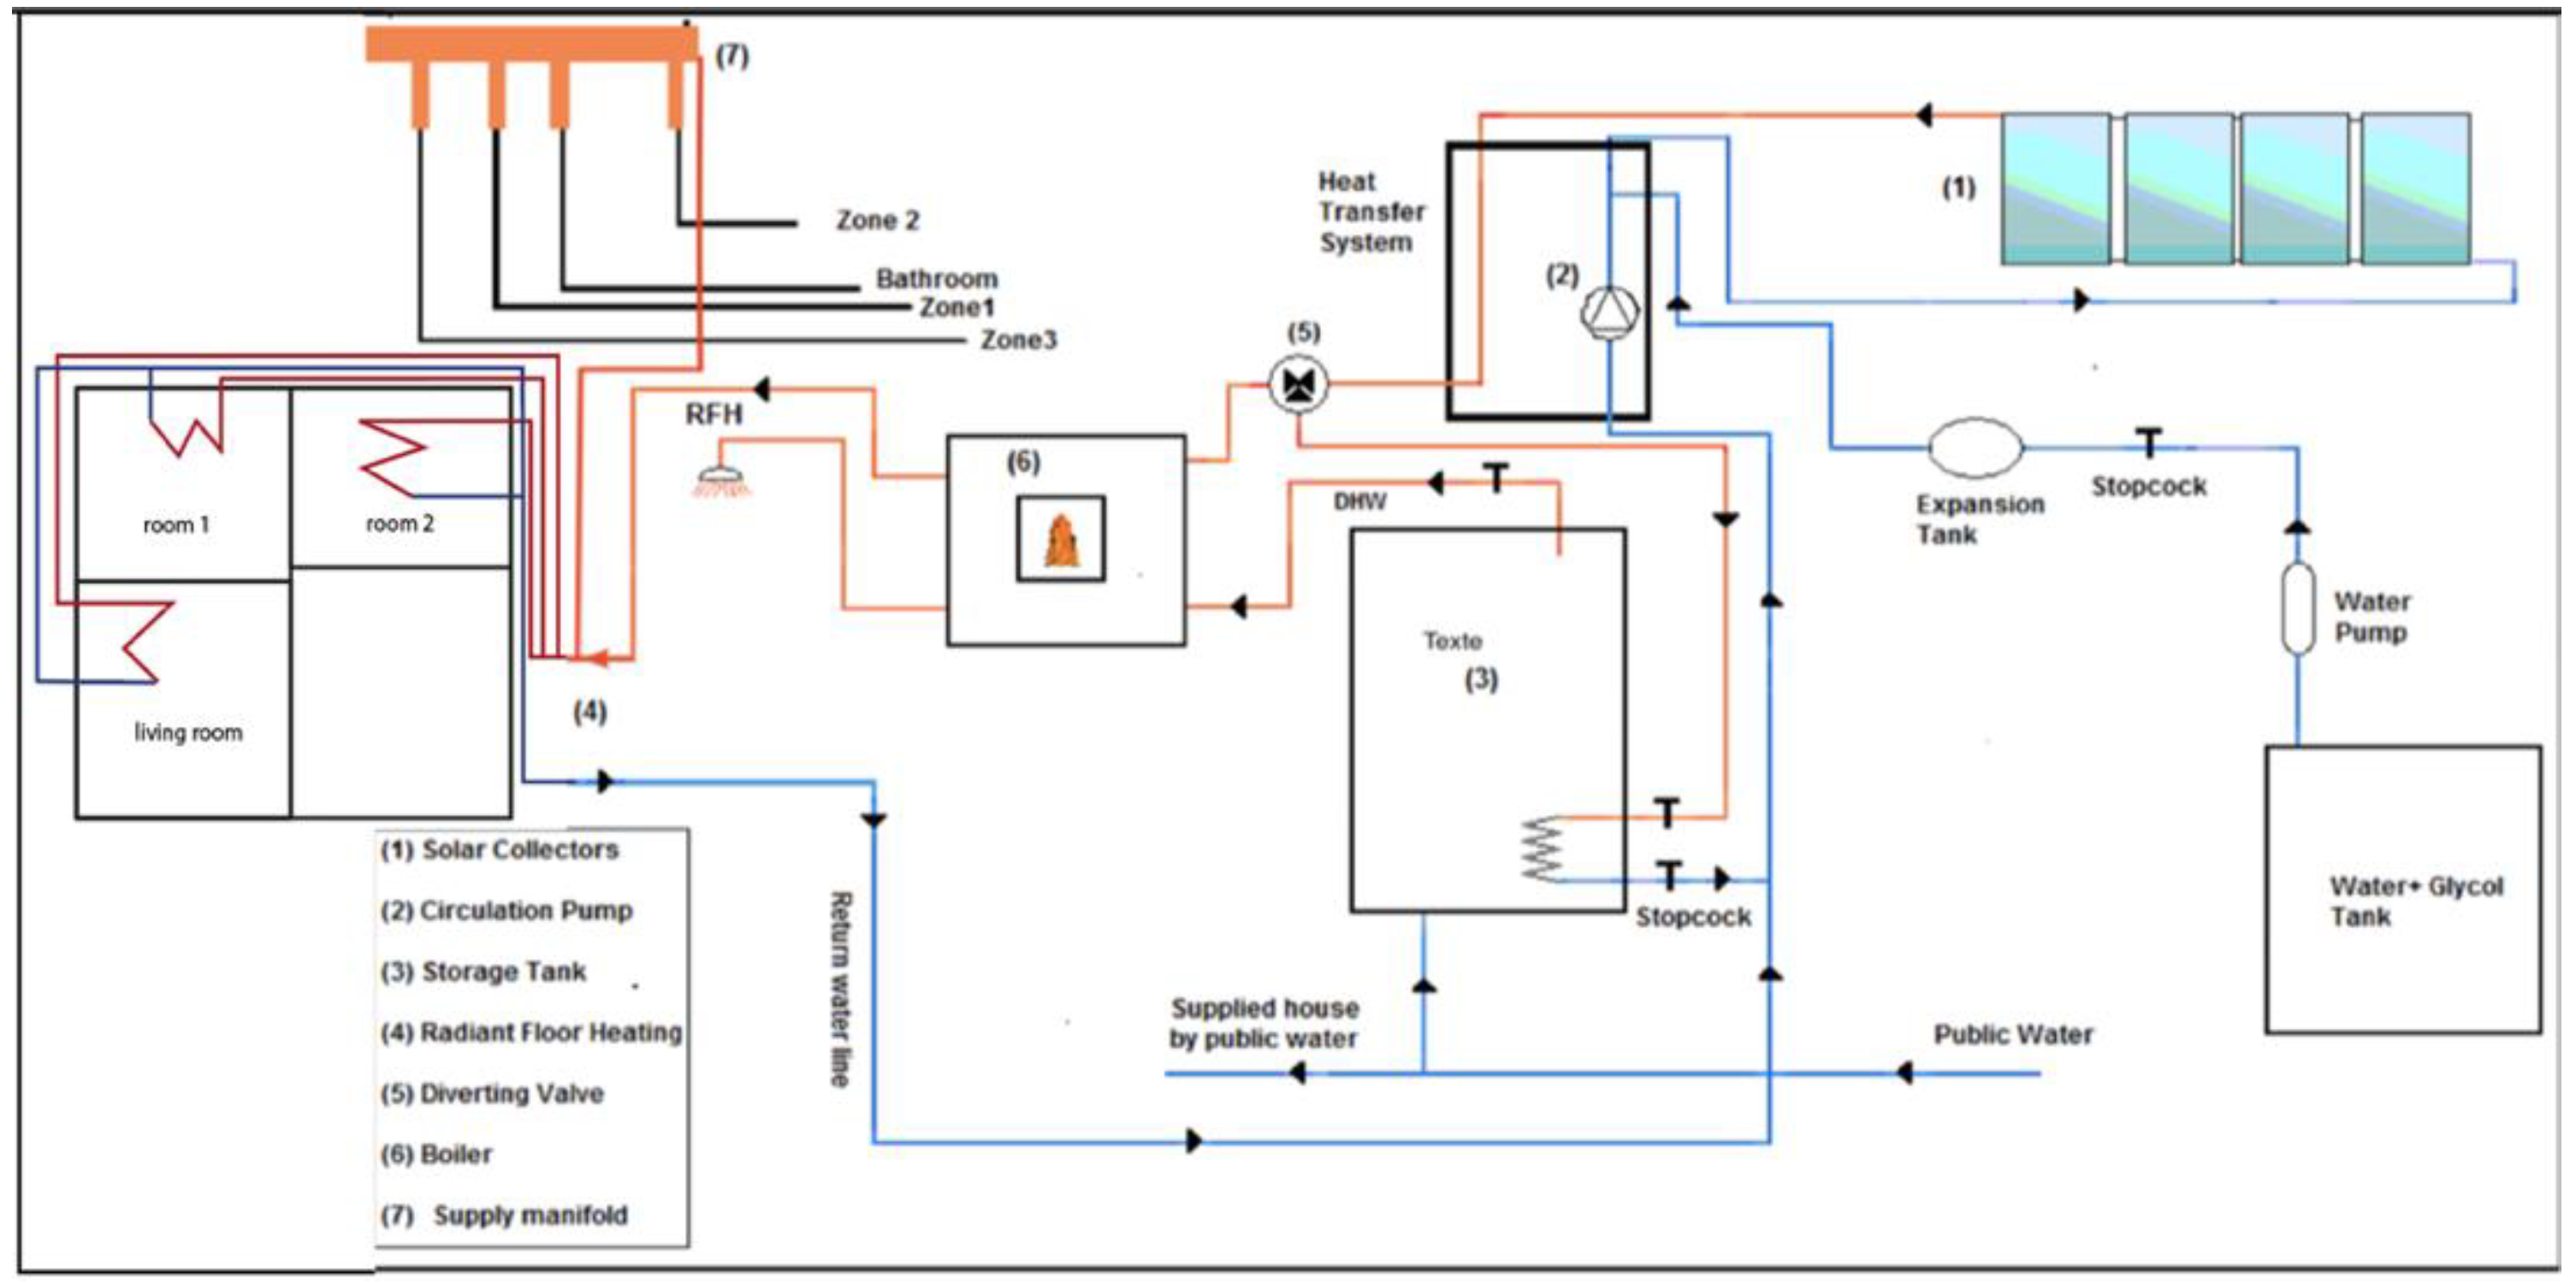
2.7. Solar Heating System (Combisystem)

Combisystems are solar heating systems that provide heat for both domestic hot water (DHW) and space heating (SH). The combisystem installed in the pilothouse was designed for a single family. The room heating was provided by radiant floor heating (RFH). This system is an efficient way to achieve thermal comfort in buildings and boasts low energy consumption. The heating system included 8 m2 of solar thermal collectors located on the house roof and oriented south at a slope of 45°. The collector tilt angle was oriented higher than the latitude of 36° 707′ at Souidania as the system is mainly intended for heating in winter. The storage capacity ensuring the distribution of hot water was 300 L. The proper functioning of the combisystem was supplied by a differential bypass valve connected to the radiant floor.
The radiant floor heating (RFH) consisted of a floor slab embedded with serpentine tubes supplied with hot water by a circulating pump and distribution piping. The floor heating coil pipes were made of high-quality cross-linked polyethylene (PEX) for:
  • Flexibility: they can bend into a wide radius turn if space permits.
  • Direct routing of pipes: lower material cost; easier installation.
  • Ability to merge new PEX with existing copper and PVC systems.
  • Environmental benefits: PEX is more environmentally friendly than copper.
  • Longevity and inflammability properties of the installation.
The PEX used in the pilothouse has a thermal conductivity of λ = 0.43 W·m−1·K−1 and a diameter of Φ = 16 mm. Distribution piping was assembled in a loop in each zone to achieve the desired thermal comfort. Figure 3 shows that the piping is attached to a welded steel mesh with an insulation thickness of 6 cm of extruded polystyrene.
Pipes were placed at a distance of 15 cm between each other near to the external walls and then increased up to 30 cm towards the floor center to prevent more thermal losses.
The piping system was embedded in approximately 26 cm of concrete slab to set the temperature gradient up of the room. The 26 cm depth ensures the RFH storage and phase functions essential for high solar productivity and thermal comfort.
The heated zones are: Zone 1, Zone 2, and Zone 3. As shown in Figure 4, there is a distribution of piping under the surface of all the floor zones. This arrangement was designed to ensure a uniform distribution of the temperature [30].

2.8. Operation Principle

The amount of energy provided by the sun varies according to the location, the time of day, and the climatic conditions. The solar potential of Souidania (Algiers region) covers the energy requirement for heating in the winter season [32]. According to the installation diagram, presented in Figure 4, solar collectors cover an area of 8 m2 oriented towards the south with a 45° inclination (optimum angle for heating) [33]. These solar collectors are connected in a parallel arrangement in order to increase the flow rate, as the system is required to cover the need for space and hot water heating simultaneously.
The operating principle is described as follows: Heat produced by solar collectors (1) is distributed to the tank (3) or to the serpentine tubes in the floor slab (4) through the thermal fluid. This operation is ensured by a circulating pump (2). The pump will be activated only if the solar collector hot temperature outlet reaches a certain temperature level (35 °C). Priority is given to DHW when the top tank temperature reaches the set point of 55 °C; the three-way valve (5) is switched on to supply the serpentine in the floor directly with solar-heated water. This hot water is then circulated through the tubes. The heat exchange to the room air takes place by radiation and by convection from the slab surface. Due to the high thermal capacity in the floor slab, the system response tends to be slow, but this is also an advantage for maintaining a more stable and comfortable indoor environment. Solar thermal hot water systems require an auxiliary heat source, i.e., a gas boiler (6), which provides auxiliary heat if one of the following basic conditions applies:
  • Insufficient solar energy to heat the water.
  • No solar energy to heat the water.

3. Modeling of the System

Numerical simulation was carried out to analyze how conduction, natural convection, and radiosity influenced the temperature profiles of the air inside the chambers. Equations, which describe the different processes in the system, are presented in the following subsections.

3.1. Mass Balance

The mass balance equation is expressed taking into consideration that ml is the mass fraction, and l and U are the system speed (m·s−1) [34]:
( ρ m l ) t + d i v ( ρ U   m l ) = R 1 + d i v ( τ g r a d ( m l ) )

3.2. Energy Conservation Equation

The energy conservation equation is defined considering S as the source term, and the conservation of the amount of motion following x is as follows [34]:
( ρ U x ) t + d i v ( ρ . U x U ) = d i v ( J )
Combining both Equations (1) and (2), Equation (3) becomes:
( ρ U x ) t + d i v ( ρ . U x U ) = d i v [ μ . g r a d ( ρ . U x ) ] + S
These three equations may be expressed by the following generic equation:
If Φ is any physical quantity, the conservation equation of Φ is written:
( ρ . ϕ ) t + d i v ( ρ . ϕ . U ) = d i v [ τ . g r a d ( ϕ ) ] + S

3.3. Heat Transfer Equation

The heat flux density q is the energy exchanged with the surroundings through the pipes of the heating system, the floor heating, and the house air by square meter (W·m−2).
The heat flux density equation q is defined by the following expression [30]:
q = K Δ T
where K is the overall heat transfer coefficient.

3.4. Surface Radiosity

Surface radiosity was used to describe the radiative flux of the surface. It is assumed that the walls are diffuse and gray. For a surface element at the boundary of a cavity, the nondimensional radiosity is given by the following equation [34]:
J = ε M 1 0 + ρ G i
Considering that M 1 0   =   σ   T 1 4 and according to Kirchhoff’s law ε + ρ = 1, Equation (6) becomes:
( 1 ε ) G i = J ε σ T 1 4
where σ = 5.675 × 10⁻⁸ W·m−2·K−4.
The radiosity, J, of the low floor surface is the total flux emitted by this surface. This total flux results from: (i) the reflection of part of the incident flux, G, which falls on this surface (illumination); and (ii) the flux emitted by the surface itself due to its temperature T.

3.5. Resolution Procedure

The experimental study reported by Benouali et al. [28,35] indicated that thermal loads were calculated by means of several inlet and outlet temperature measurements, which were taken at their pilothouse using thermocouples placed on the envelope as well as in certain elements of the heating system. All measurements were collected via a data logger.
The numerical simulation in the present study was carried out using the Comsol Multiphysics 5.3a software [36]. The numerical model was built using a physics-controlled 2D sequential mesh with an extra-fine element size [37]. Each domain was discretized using free tetrahedral elements [38,39], forming a nonstructural mesh that was linear in the boundaries between layers [38], as shown in Figure 5. The grid cell exhibits a mesh of 291,107 nodes and 24,089 internal boundaries, with different mesh sizing of the heating fluid areas, air flow, and walls, and a simulation time step of 30 min. Simulation time was about 2 h 4 min and 33 s. It was performed on a Macintosh-type computer equipped with an integrated i7 quad-core 4th-generation 2.0 GHz processor, boosted up to 3.2 GHz during the calculation with 8 GB of RAM. This was again boosted up to 64 GB during the calculation thanks to the hard disk type SSD and a 2 GHz Iris Pro graphics card.
Figure 6 shows the simulation results, obtained for this present work, of the air temperature variation inside the room for 132 h of floor heating. It also shows the experimental data results reported by Benouali et al. [28]. The input conditions in the simulation process were set as follows: heating system off, room temperature at 0 °C, water temperature in the heating circuit at 40 °C, and calculations taken at a 50 cm height. The volume flow rate was kept constant at 17 l·h−1·m−2. Remarkably, the temperature profile, for the simulation results, distinguishes two different periods of time. In the first period, from 0 to 72 h, there is a temperature increase from the heating starting point to the equilibrium point. This is a two-range increment of 0.58 °C·h−1 for the first 12 h of the day and 0.14 °C·h−1 for the next 60 h. This might be due to the air flow and the day–night temperature variation effect occurring at a 50 cm height inside the room. In the second period (Figure 7), from 72 h to 132 h, the room temperature stabilizes at an equilibrium level of 15 °C, as reported in the experimental work, and this is due to a decrease in the air flow velocity at the same height of 50 cm.
Simulation results were validated with experimental values from the 72nd hour for a duration of 60 h. The experimental and theoretical temperature profiles shown in Figure 7 confirm the agreement between both sets of data. The maximum and average deviations between experimental and numerical values were 0.75% and 0.35%, respectively.

4. Results and Discussion

The following subsections present the simulation results for a full week, between 9 and 13 January, 2011. The month of January was chosen because it is one of the coldest months of the year in Algeria. These days represent the coldest week of the year. The average outside temperature measured during this period is 10.5 °C, with a minimum value of 5.4 °C and a maximum value of 16.5 °C. A wide daily fluctuation can be observed outside, of up to 11 °C.

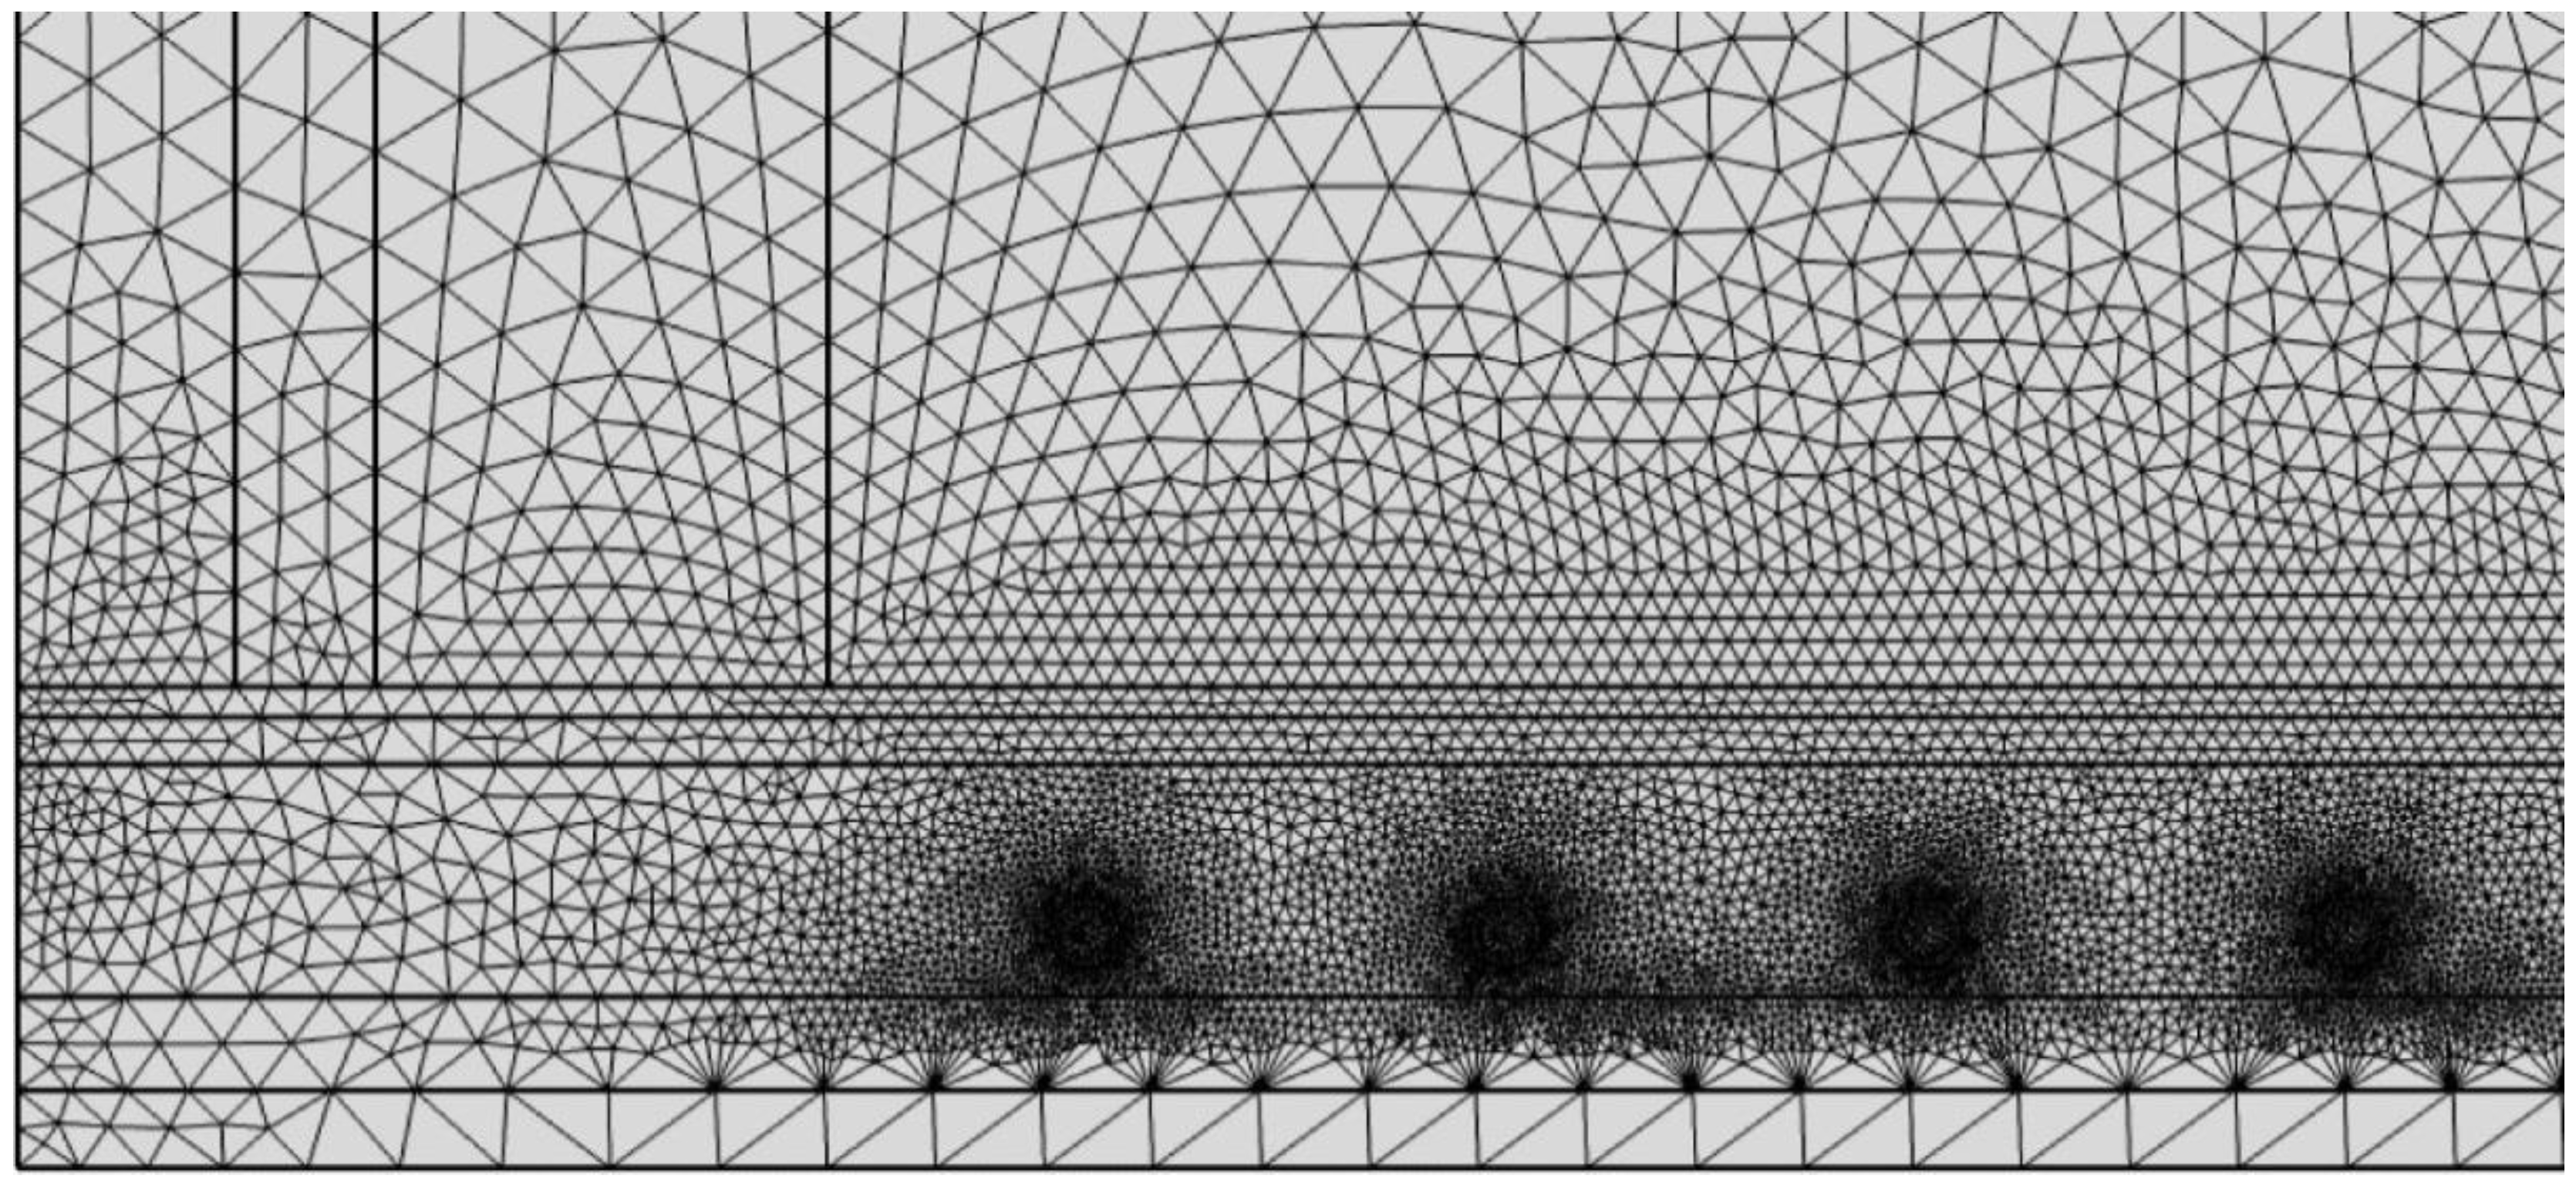
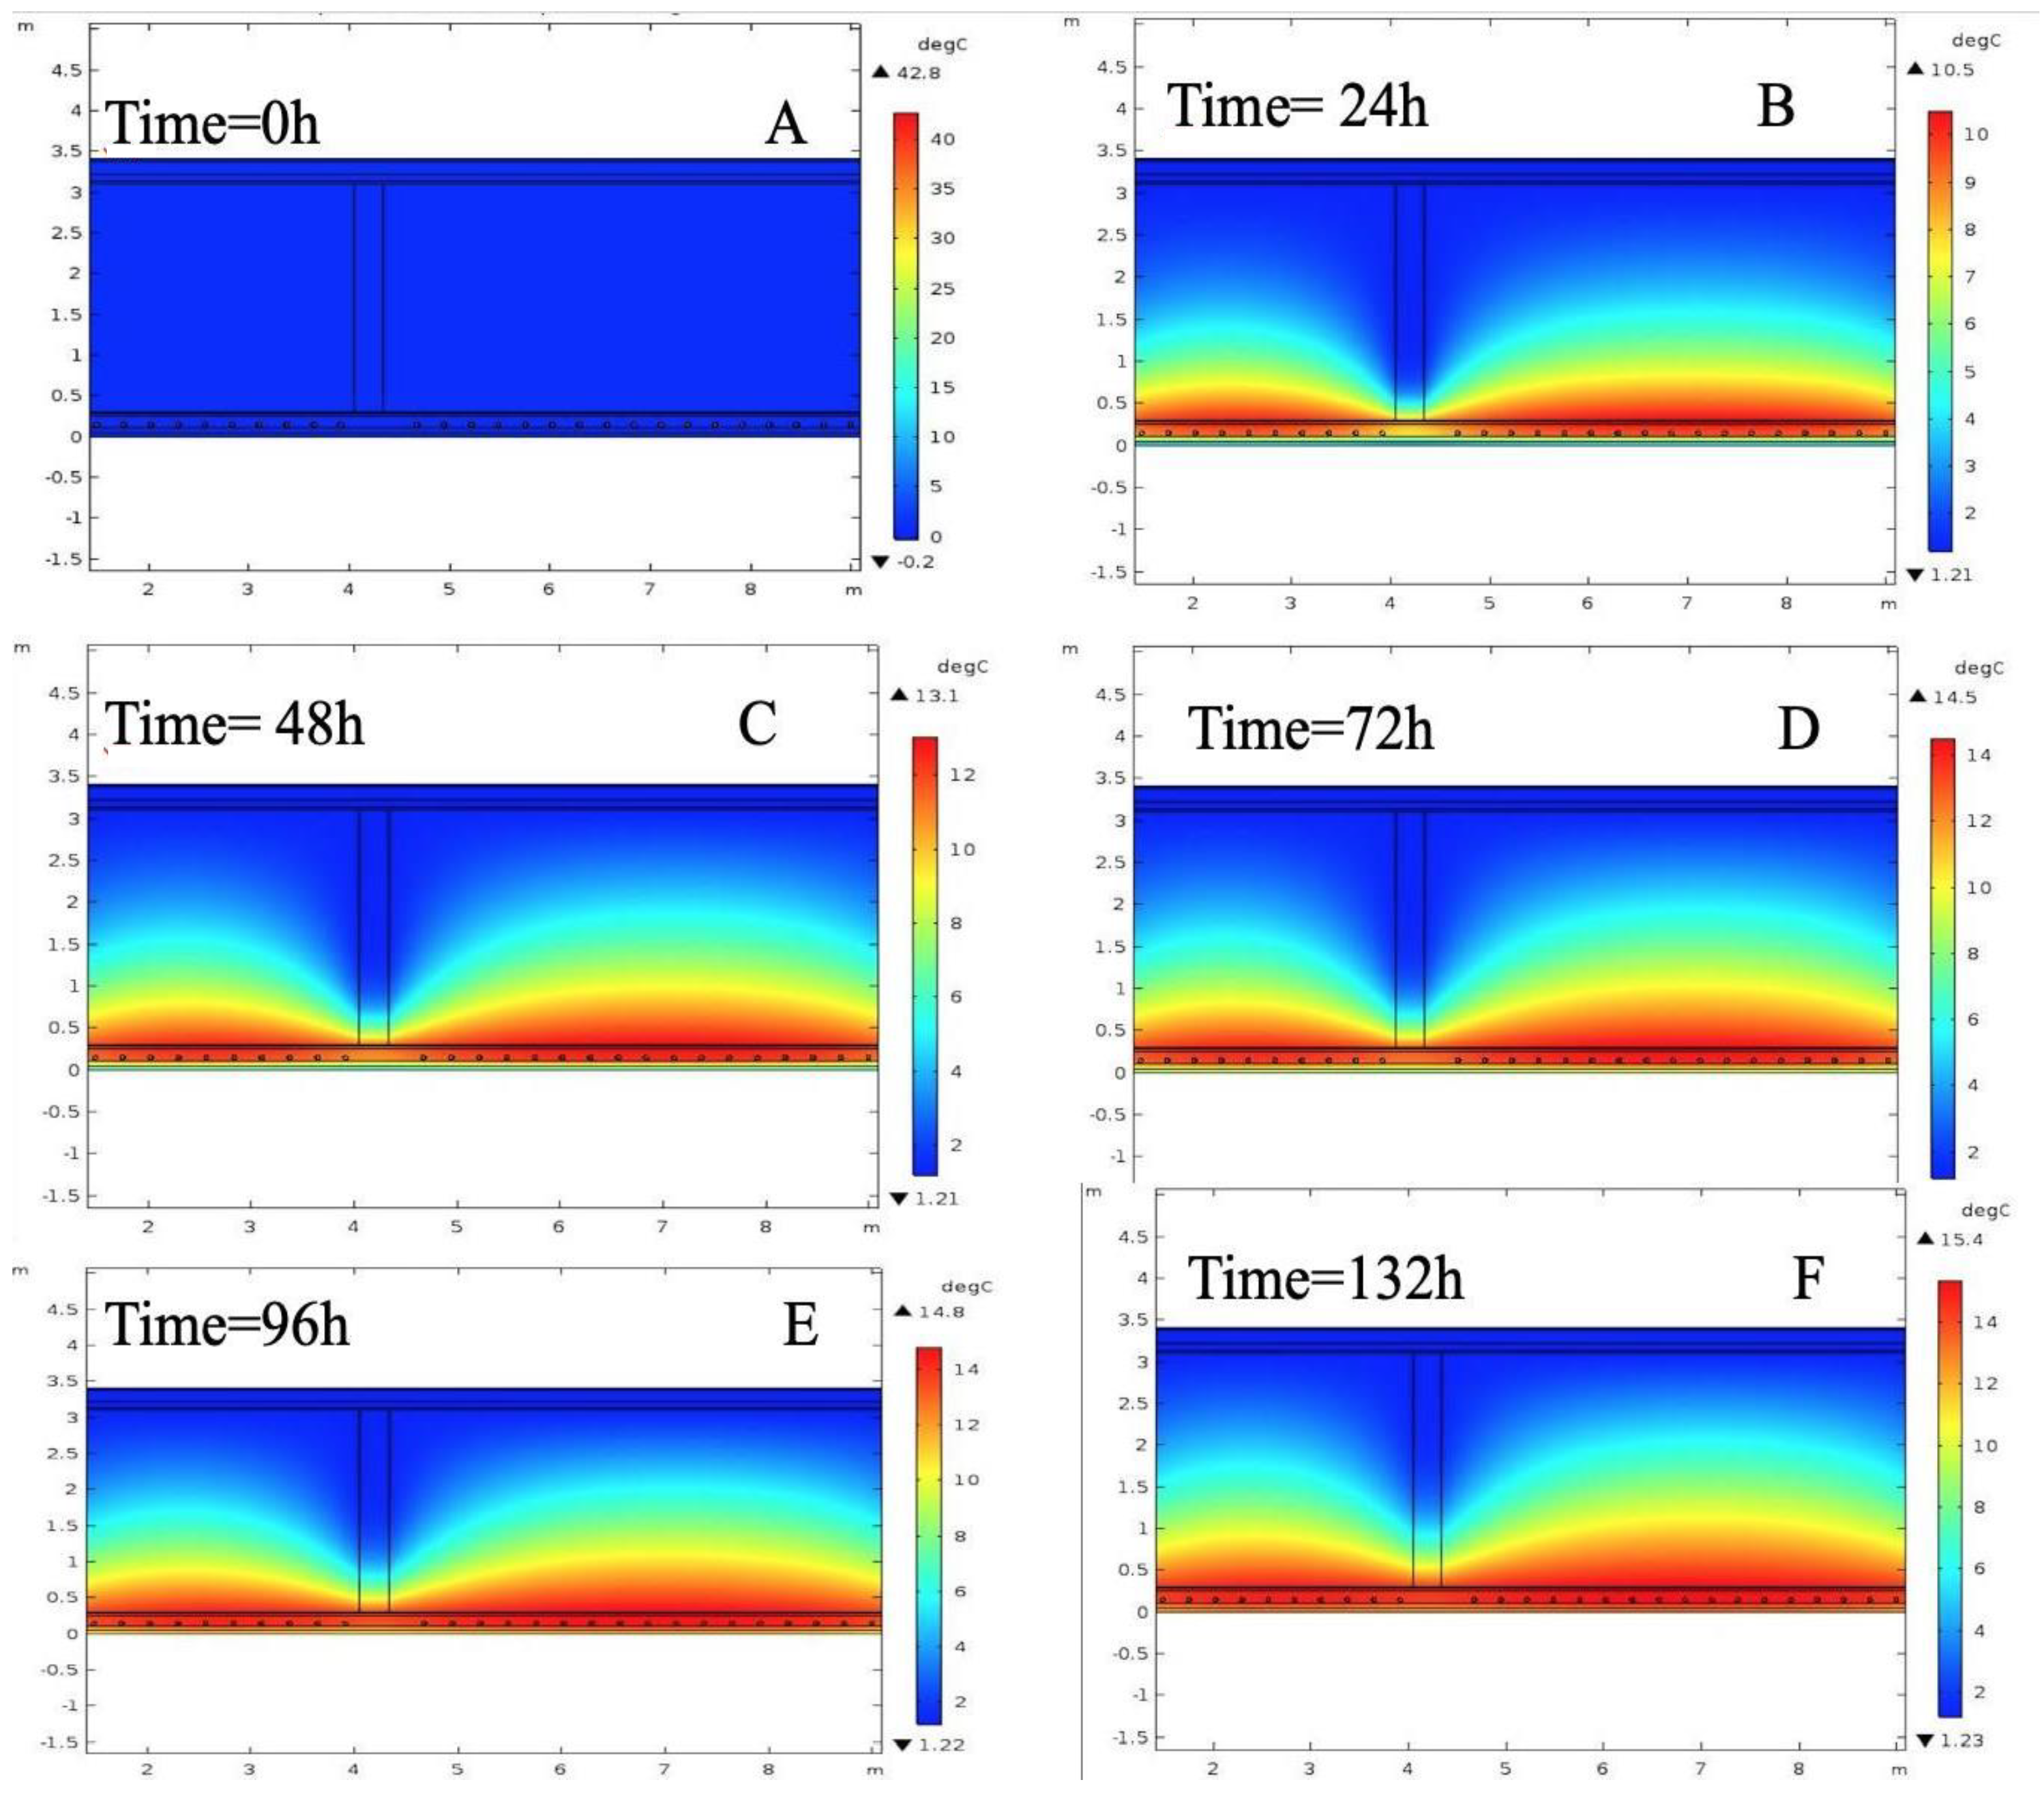
4.1. CFD Temperature Profiles during Floor Heating

Figure 8 shows the air temperature distribution for 132 h at a floor fluid temperature of 40 °C and taken at a 50 cm height. Figure 9 shows the distribution of the average air temperature inside the living room with the floor and the pipes for 132 h (5.5 days) of heating. As shown in these figures, the simulation started with a heat transfer fluid temperature of 40 °C. The air temperature inside the house was set at 0 °C taken at a 50 cm height [40]. After 24 h of heating, the air temperature in the living room increased up to 10.5 °C. This increase continued up to 13.0 °C after 48 h of heating. After 70, 96, and 132 h of heating, the temperature reached 14.5, 14.8, and 15.2 °C, respectively. The air temperature in the living room stabilized at an average of 15.1 ± 0.35 °C, taken at a 50 cm height, after 70 h of the heating cycle.
Figure 9A–F shows the distribution of the average air temperature inside the living room with the floor and the pipes for 132 h (5.5 days) of heating. The air temperature difference, from CFD simulations, between the ambient air in the living room and the hot water in the floor heating system at different time steps is, namely: 0 h, 24 h, 48 h, 70 h, 96 h, and 132 h. In the first period, there is a low heat transfer inside the room between the underfloor heating (hot source) and the interior space (air) and surfaces. This is because the cold walls and the low floor experience thermal inertia. The walls, especially the high wall, also suffer heat losses. Afterwards, during the second period, the temperature stabilizes due to the low-velocity air flow (break flow), which already brought about a temperature increase in the air inside the room. This temperature remains stable, but the temperature difference between the underfloor heating system and the air inside the room is high due to an increased heat loss occurring at the level of the high floor.

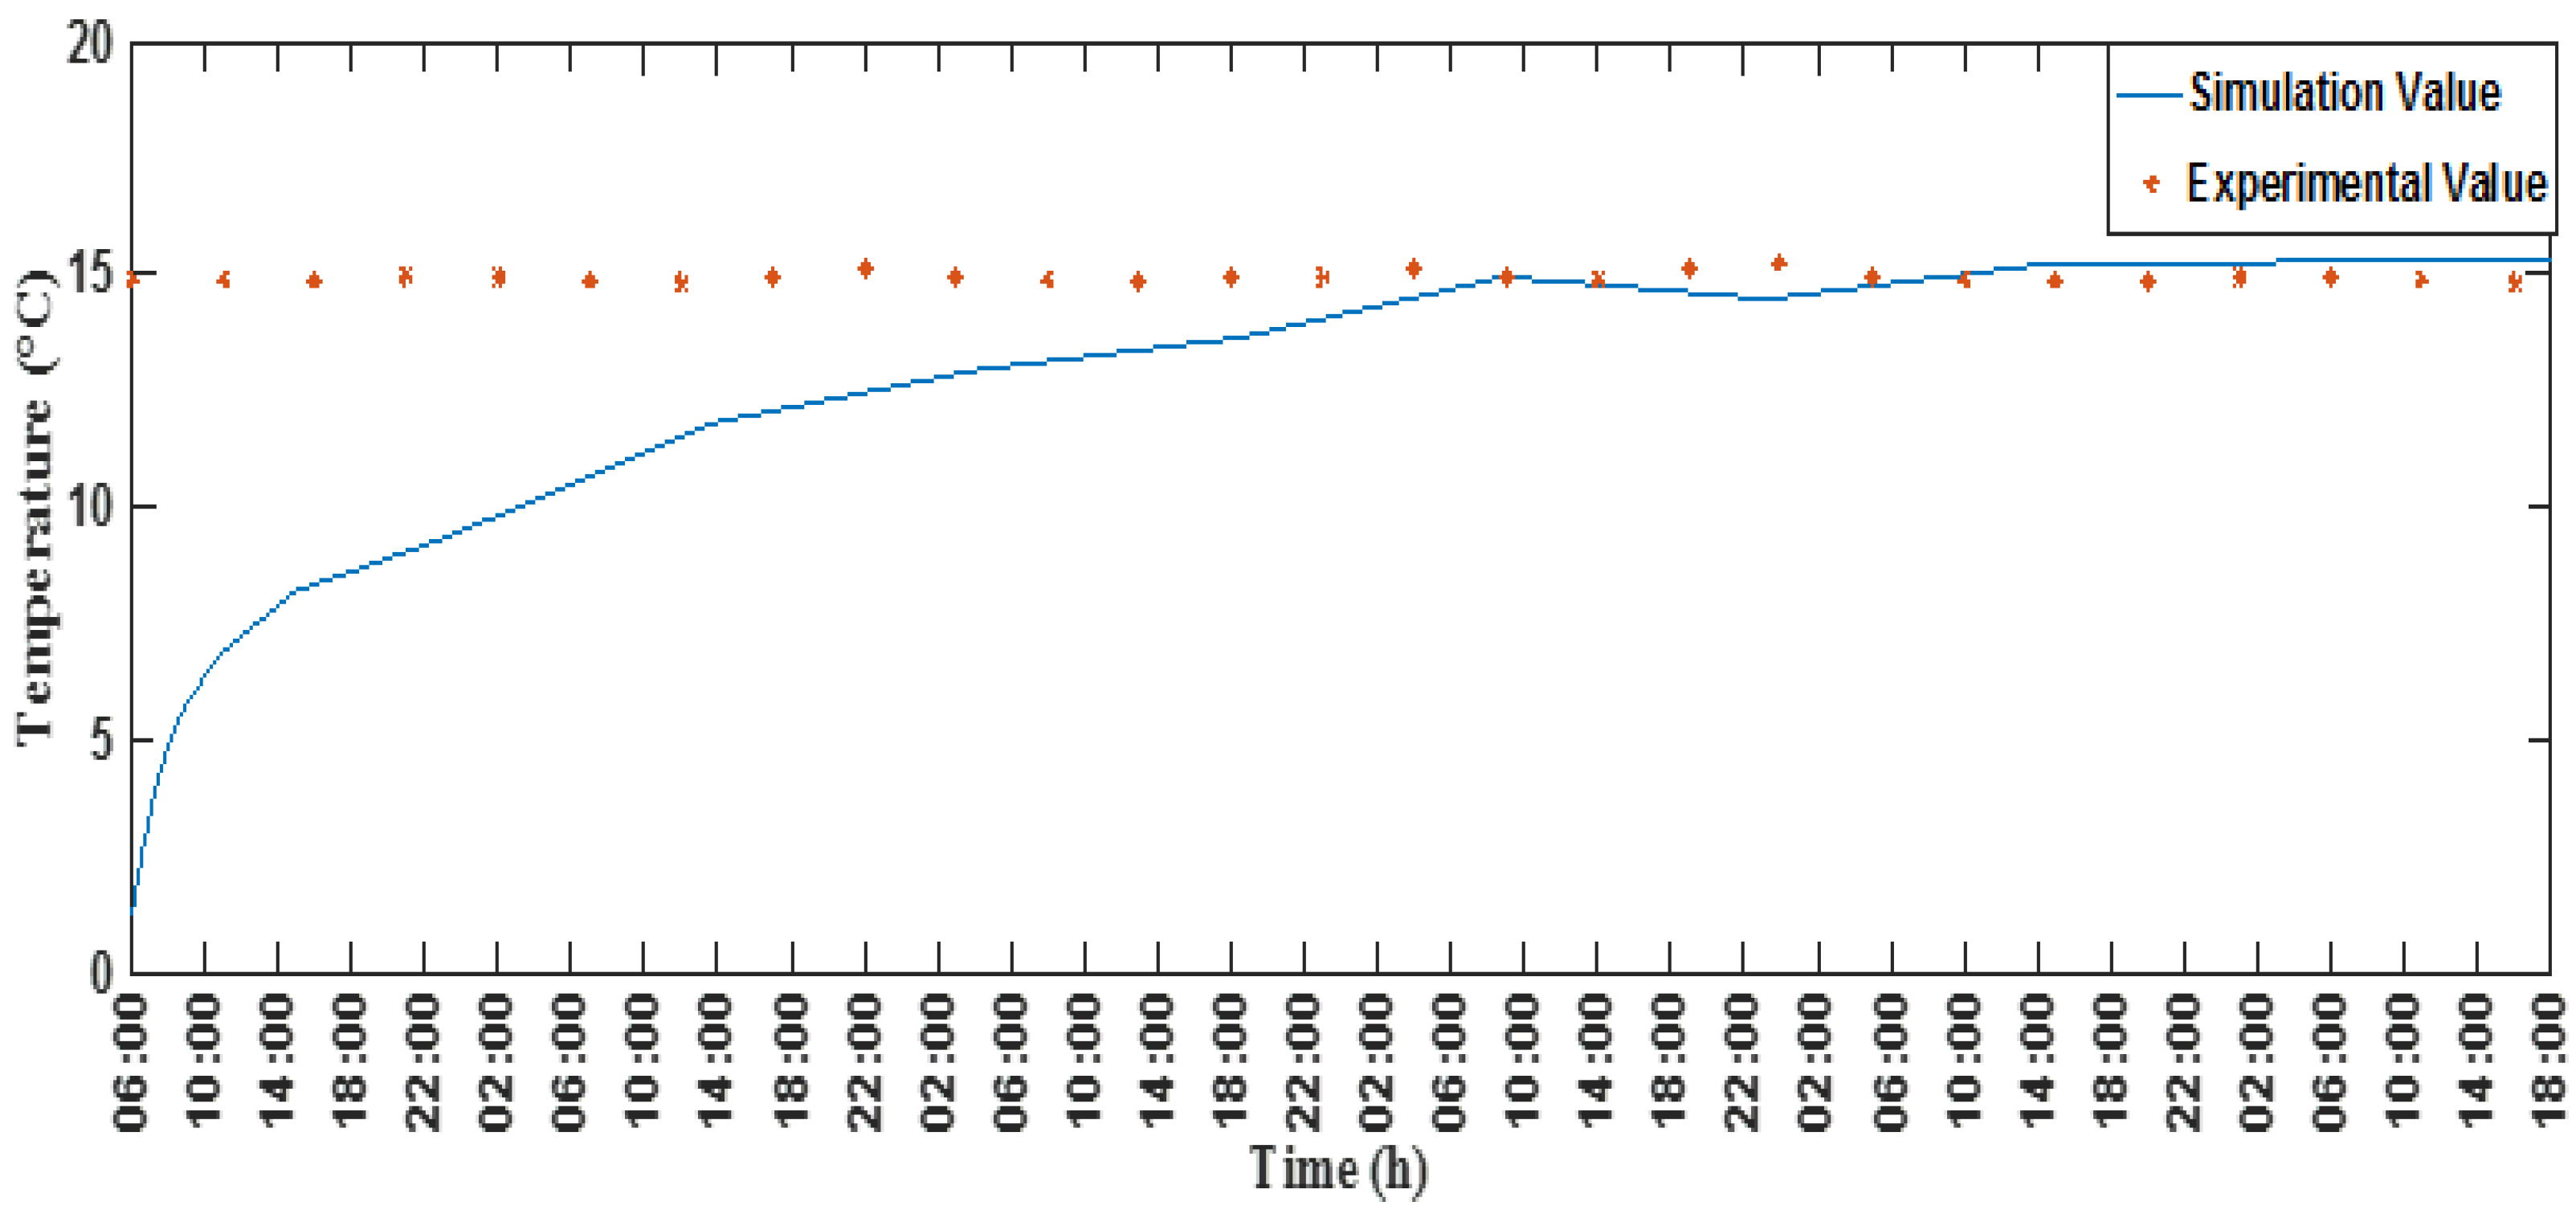
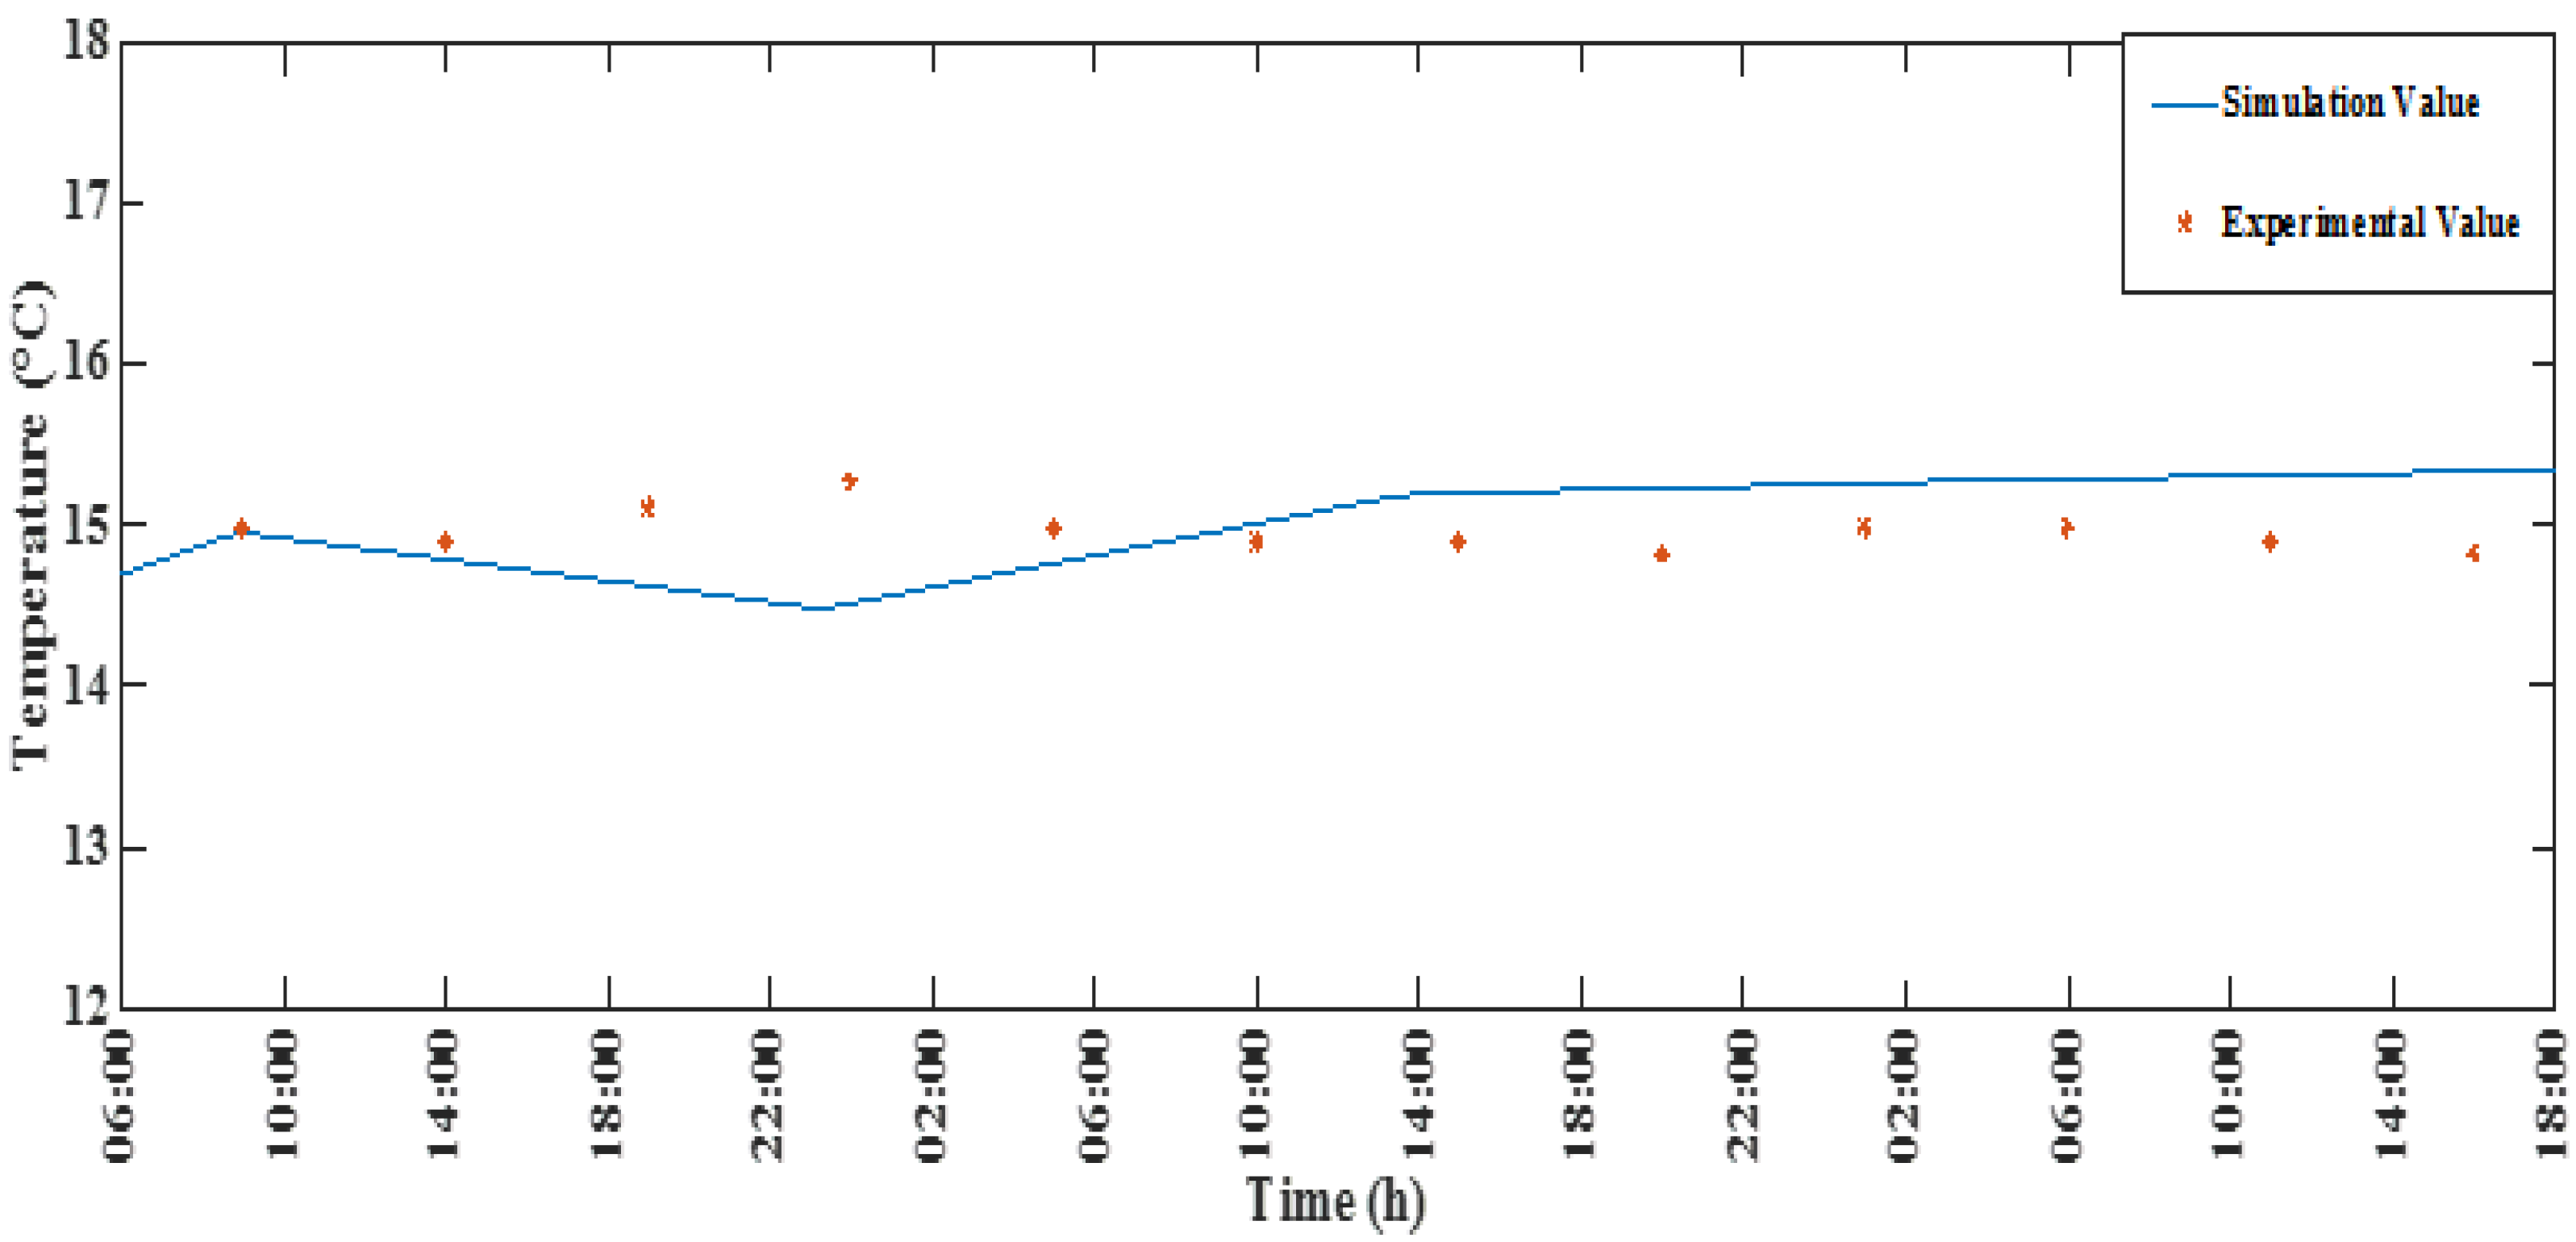
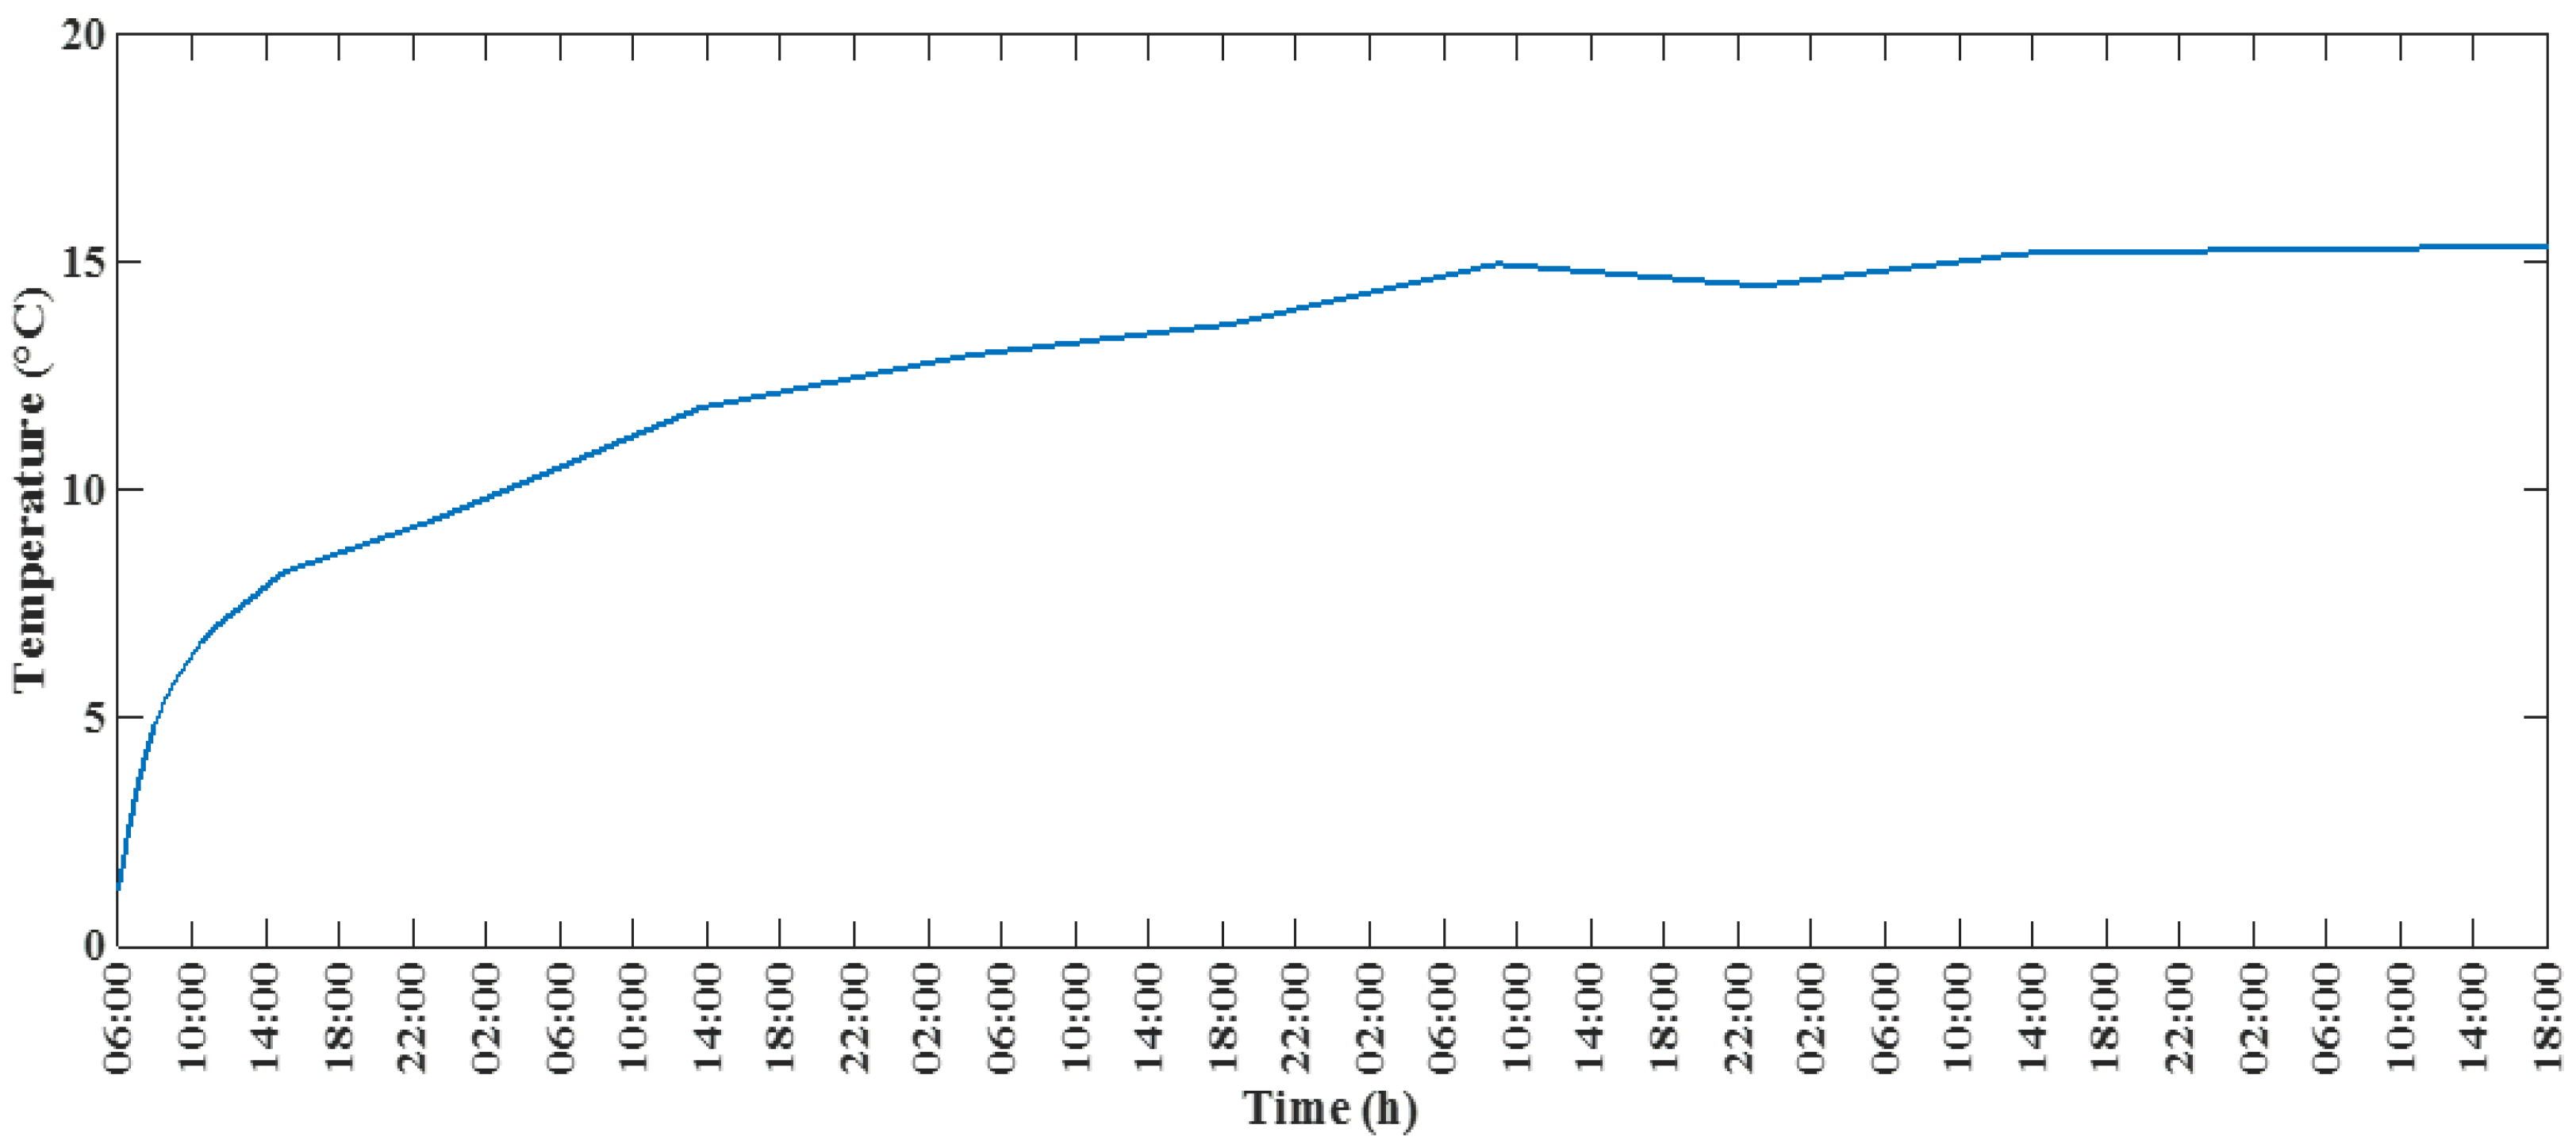
4.2. Effect of Heating Fluid Temperature on the Room Air Temperature

Figure 10 shows air temperature variation versus time in the room at heat transfer fluid temperatures ranging from 30 to 50 °C and at intervals of 5 °C. The temperature profiles show the same trend as the heat transfer fluid temperature increases from 30 to 50 °C. The effect of the heat transfer fluid temperature on the air temperature inside the room taken at a 50 cm height is not significant as long as the initial heating fluid temperature remains in the range of 30–50 °C, i.e., 10 °C below or over the nominal temperature set at 40 °C. Moreover, the air temperature increased and reached an almost constant value of 15.1 ± 0.35 °C after 72 h regardless of the initial heating fluid temperature, and the heating system remained stable because of the thermal inertia of the floor. The internal temperature showed an insignificant variation after stabilization, which demonstrates the reliability of this system for heating and domestic hot water production.
Based on other work carried out on conventional radiator systems [41], underfloor heating systems exhibit a uniform distribution of the temperature gradient in the house compared to the radiator system, which presents weak heating far from the unique source.

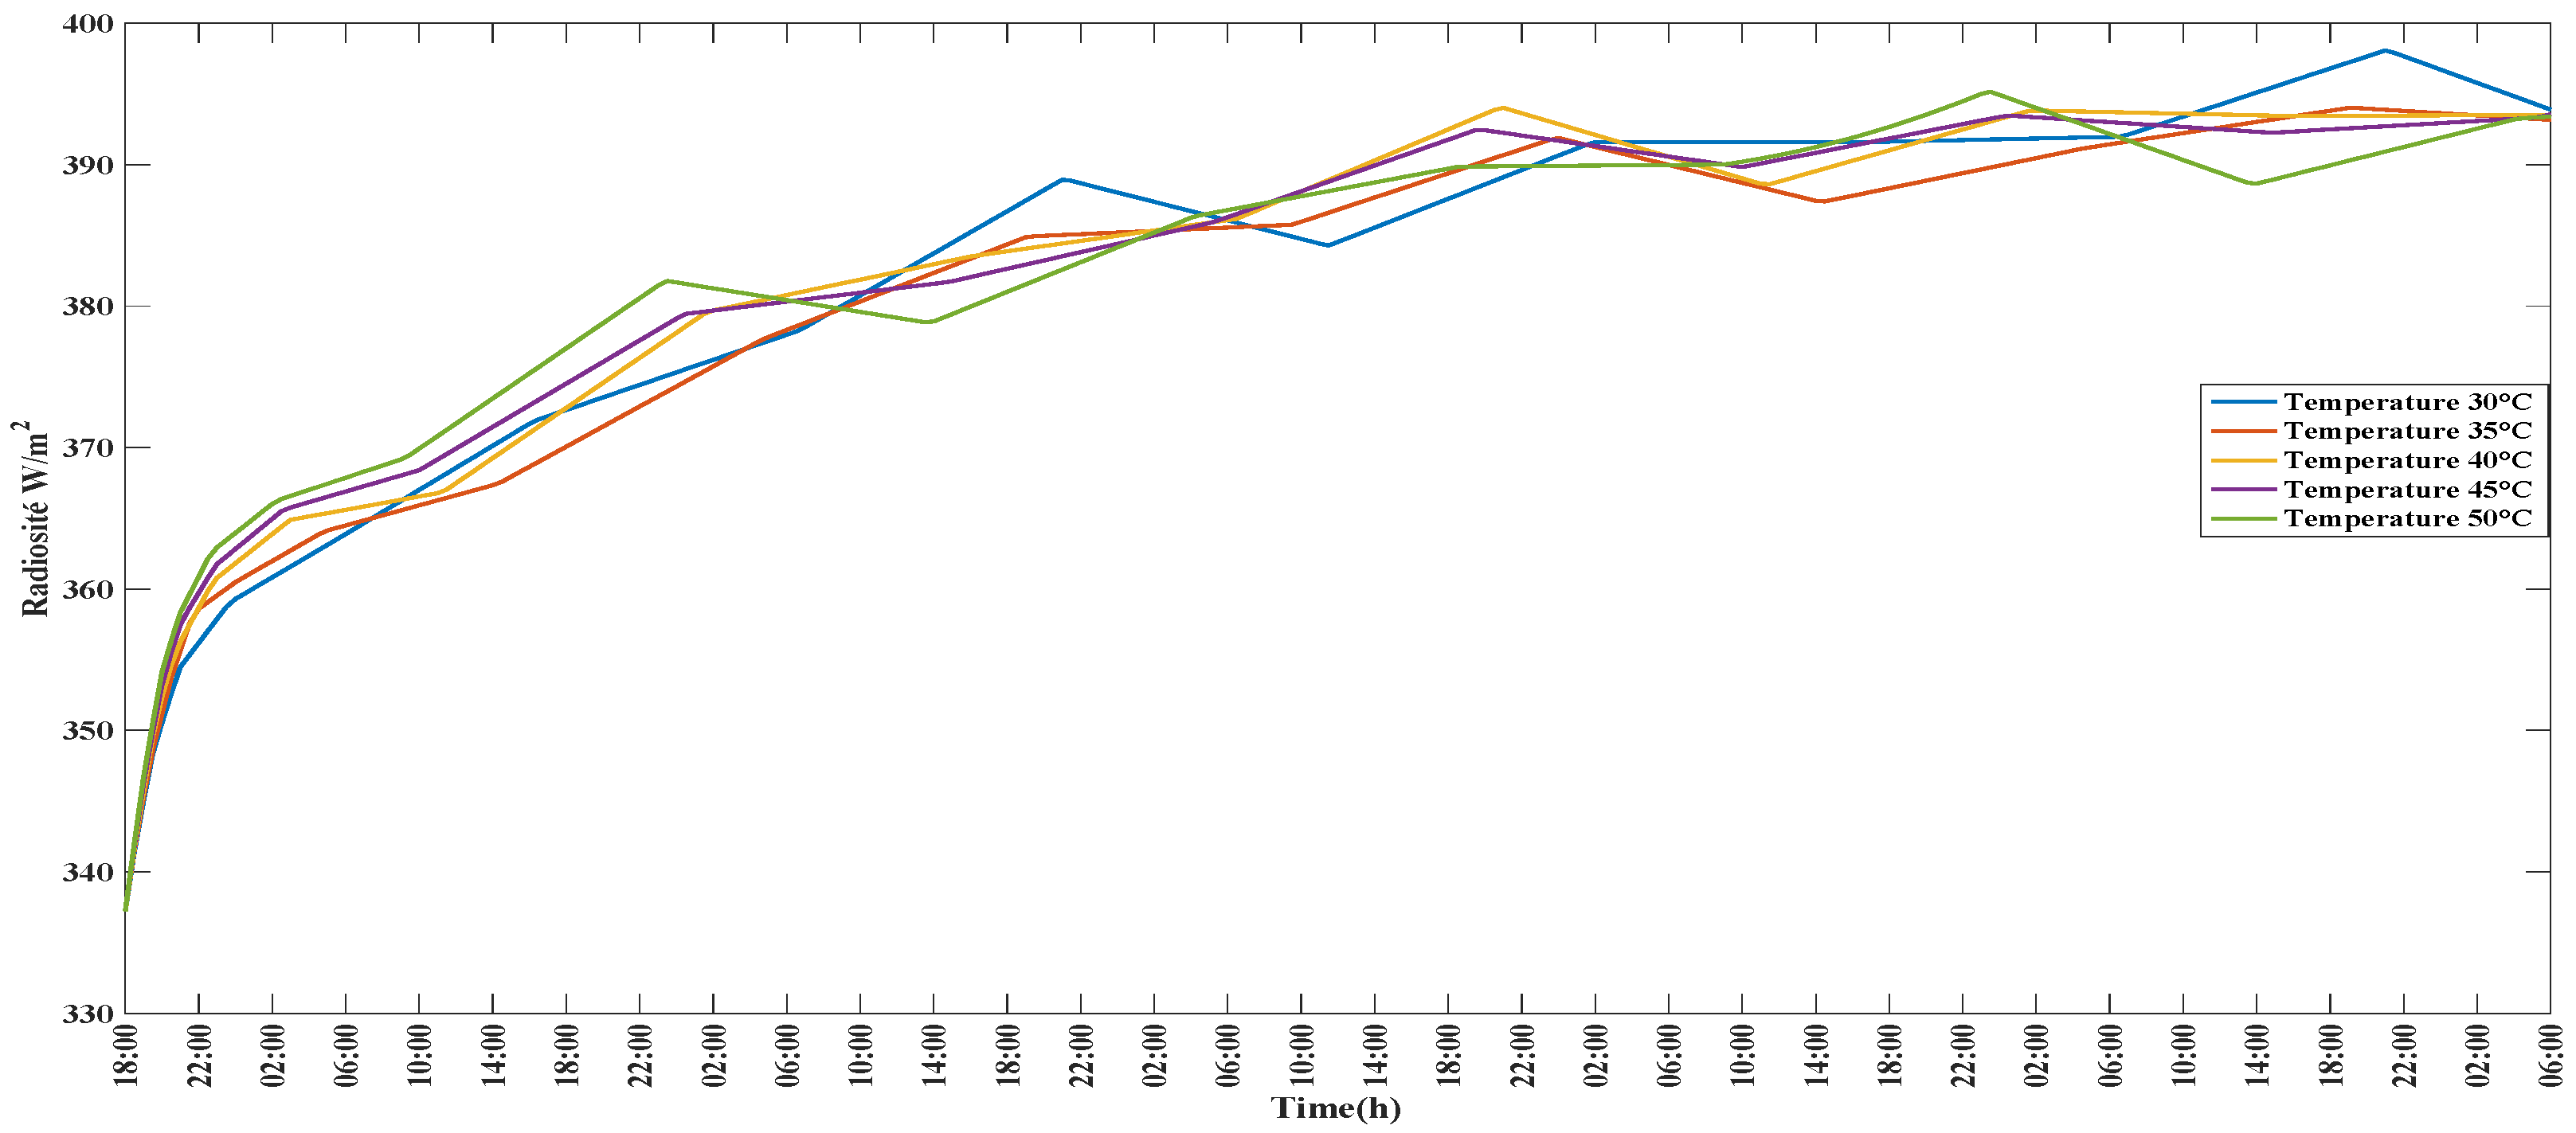
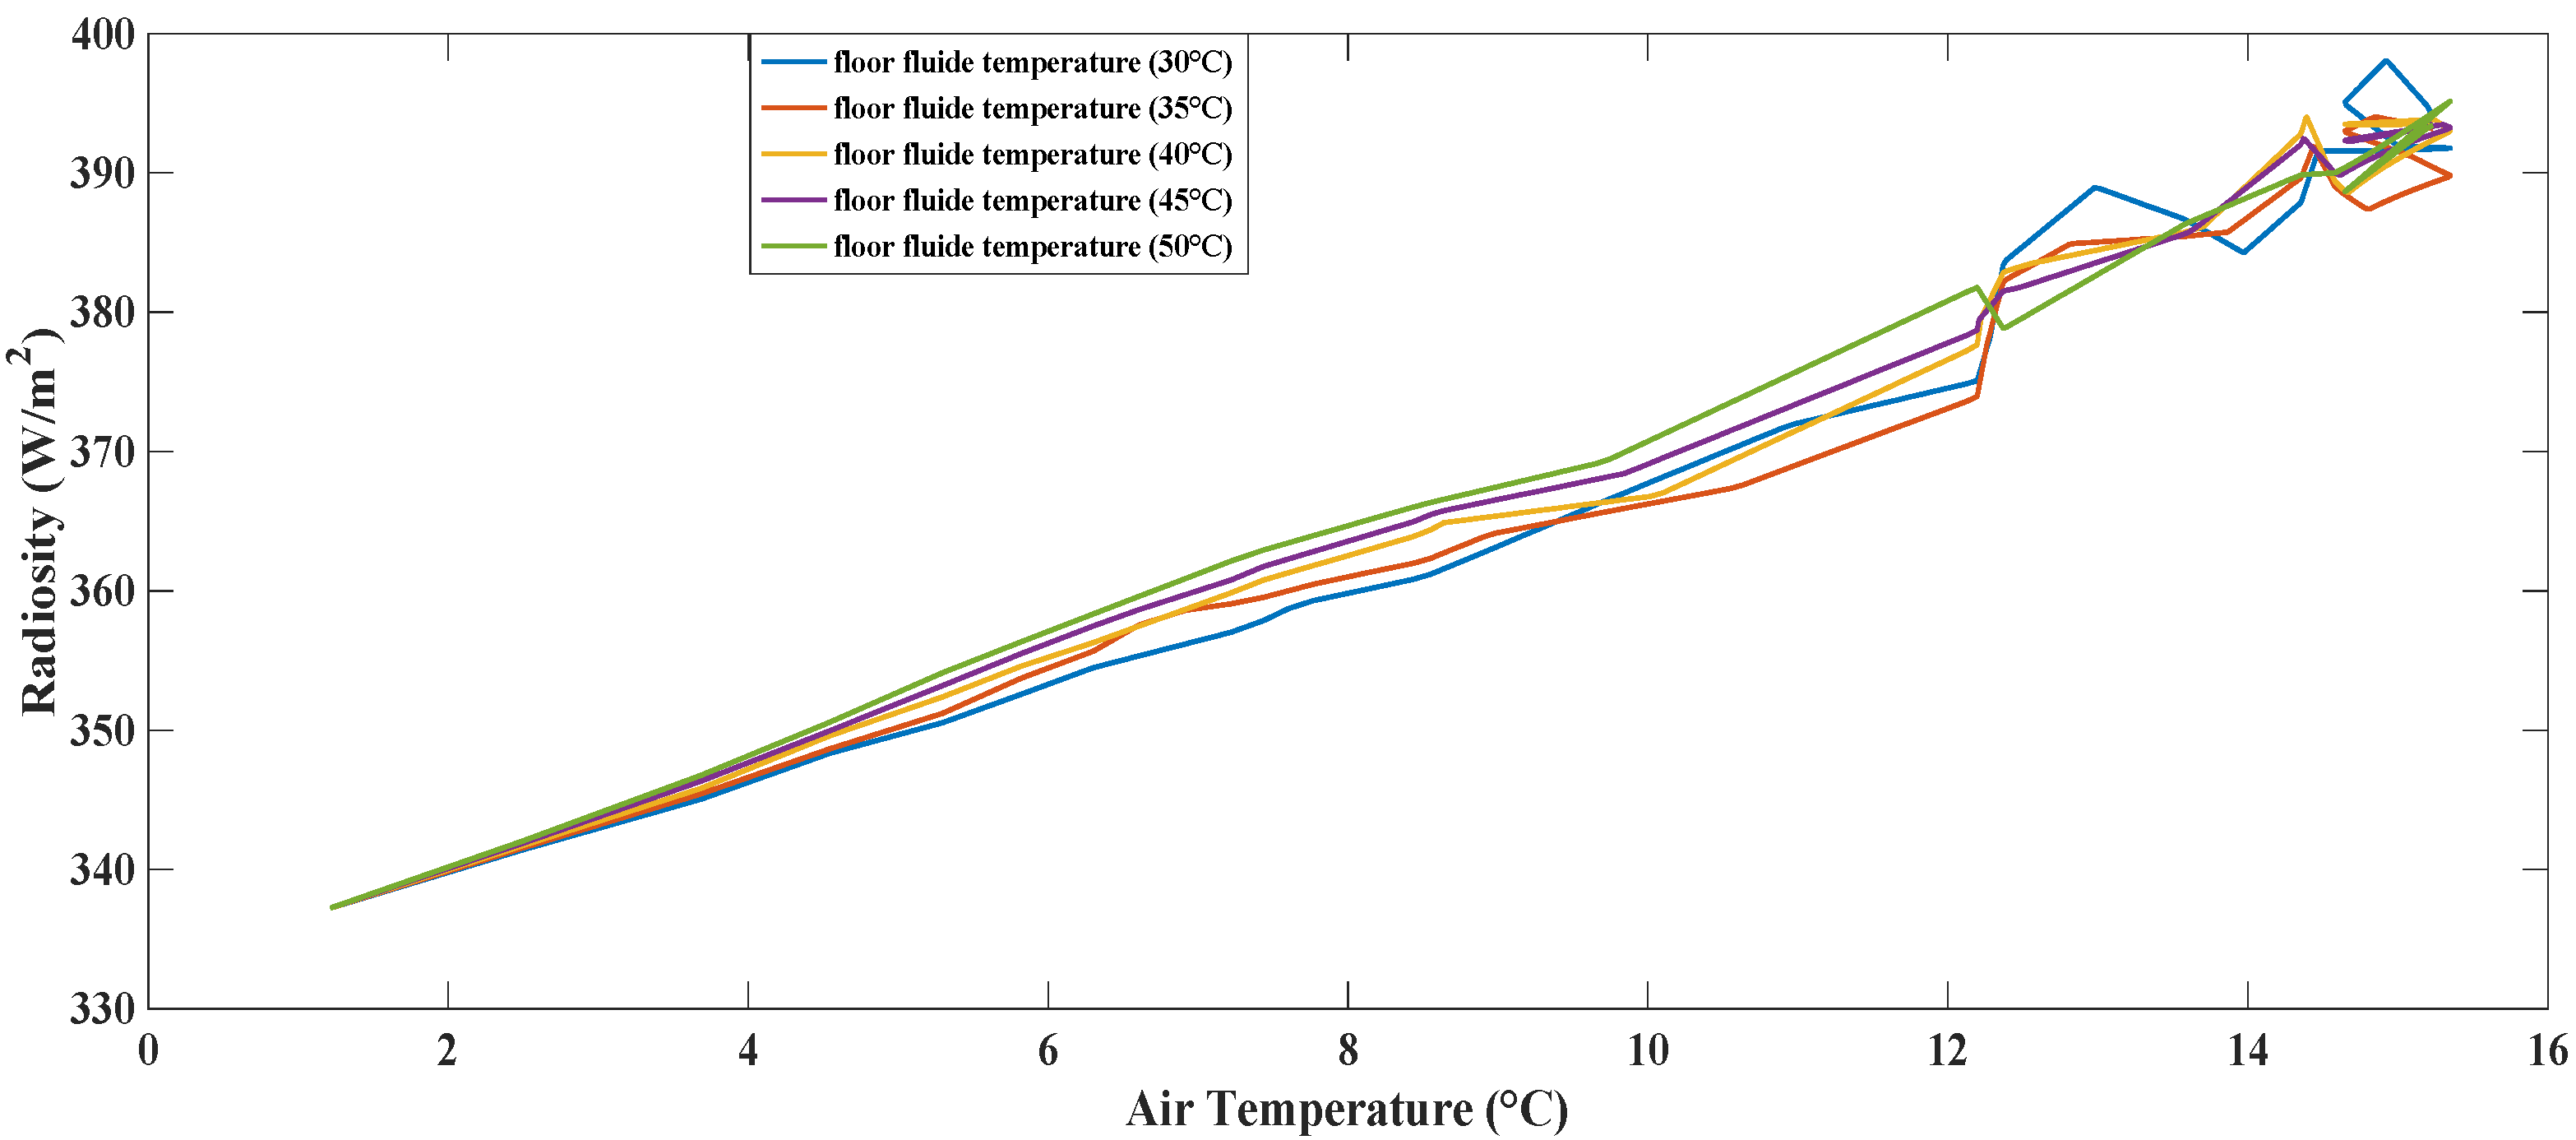
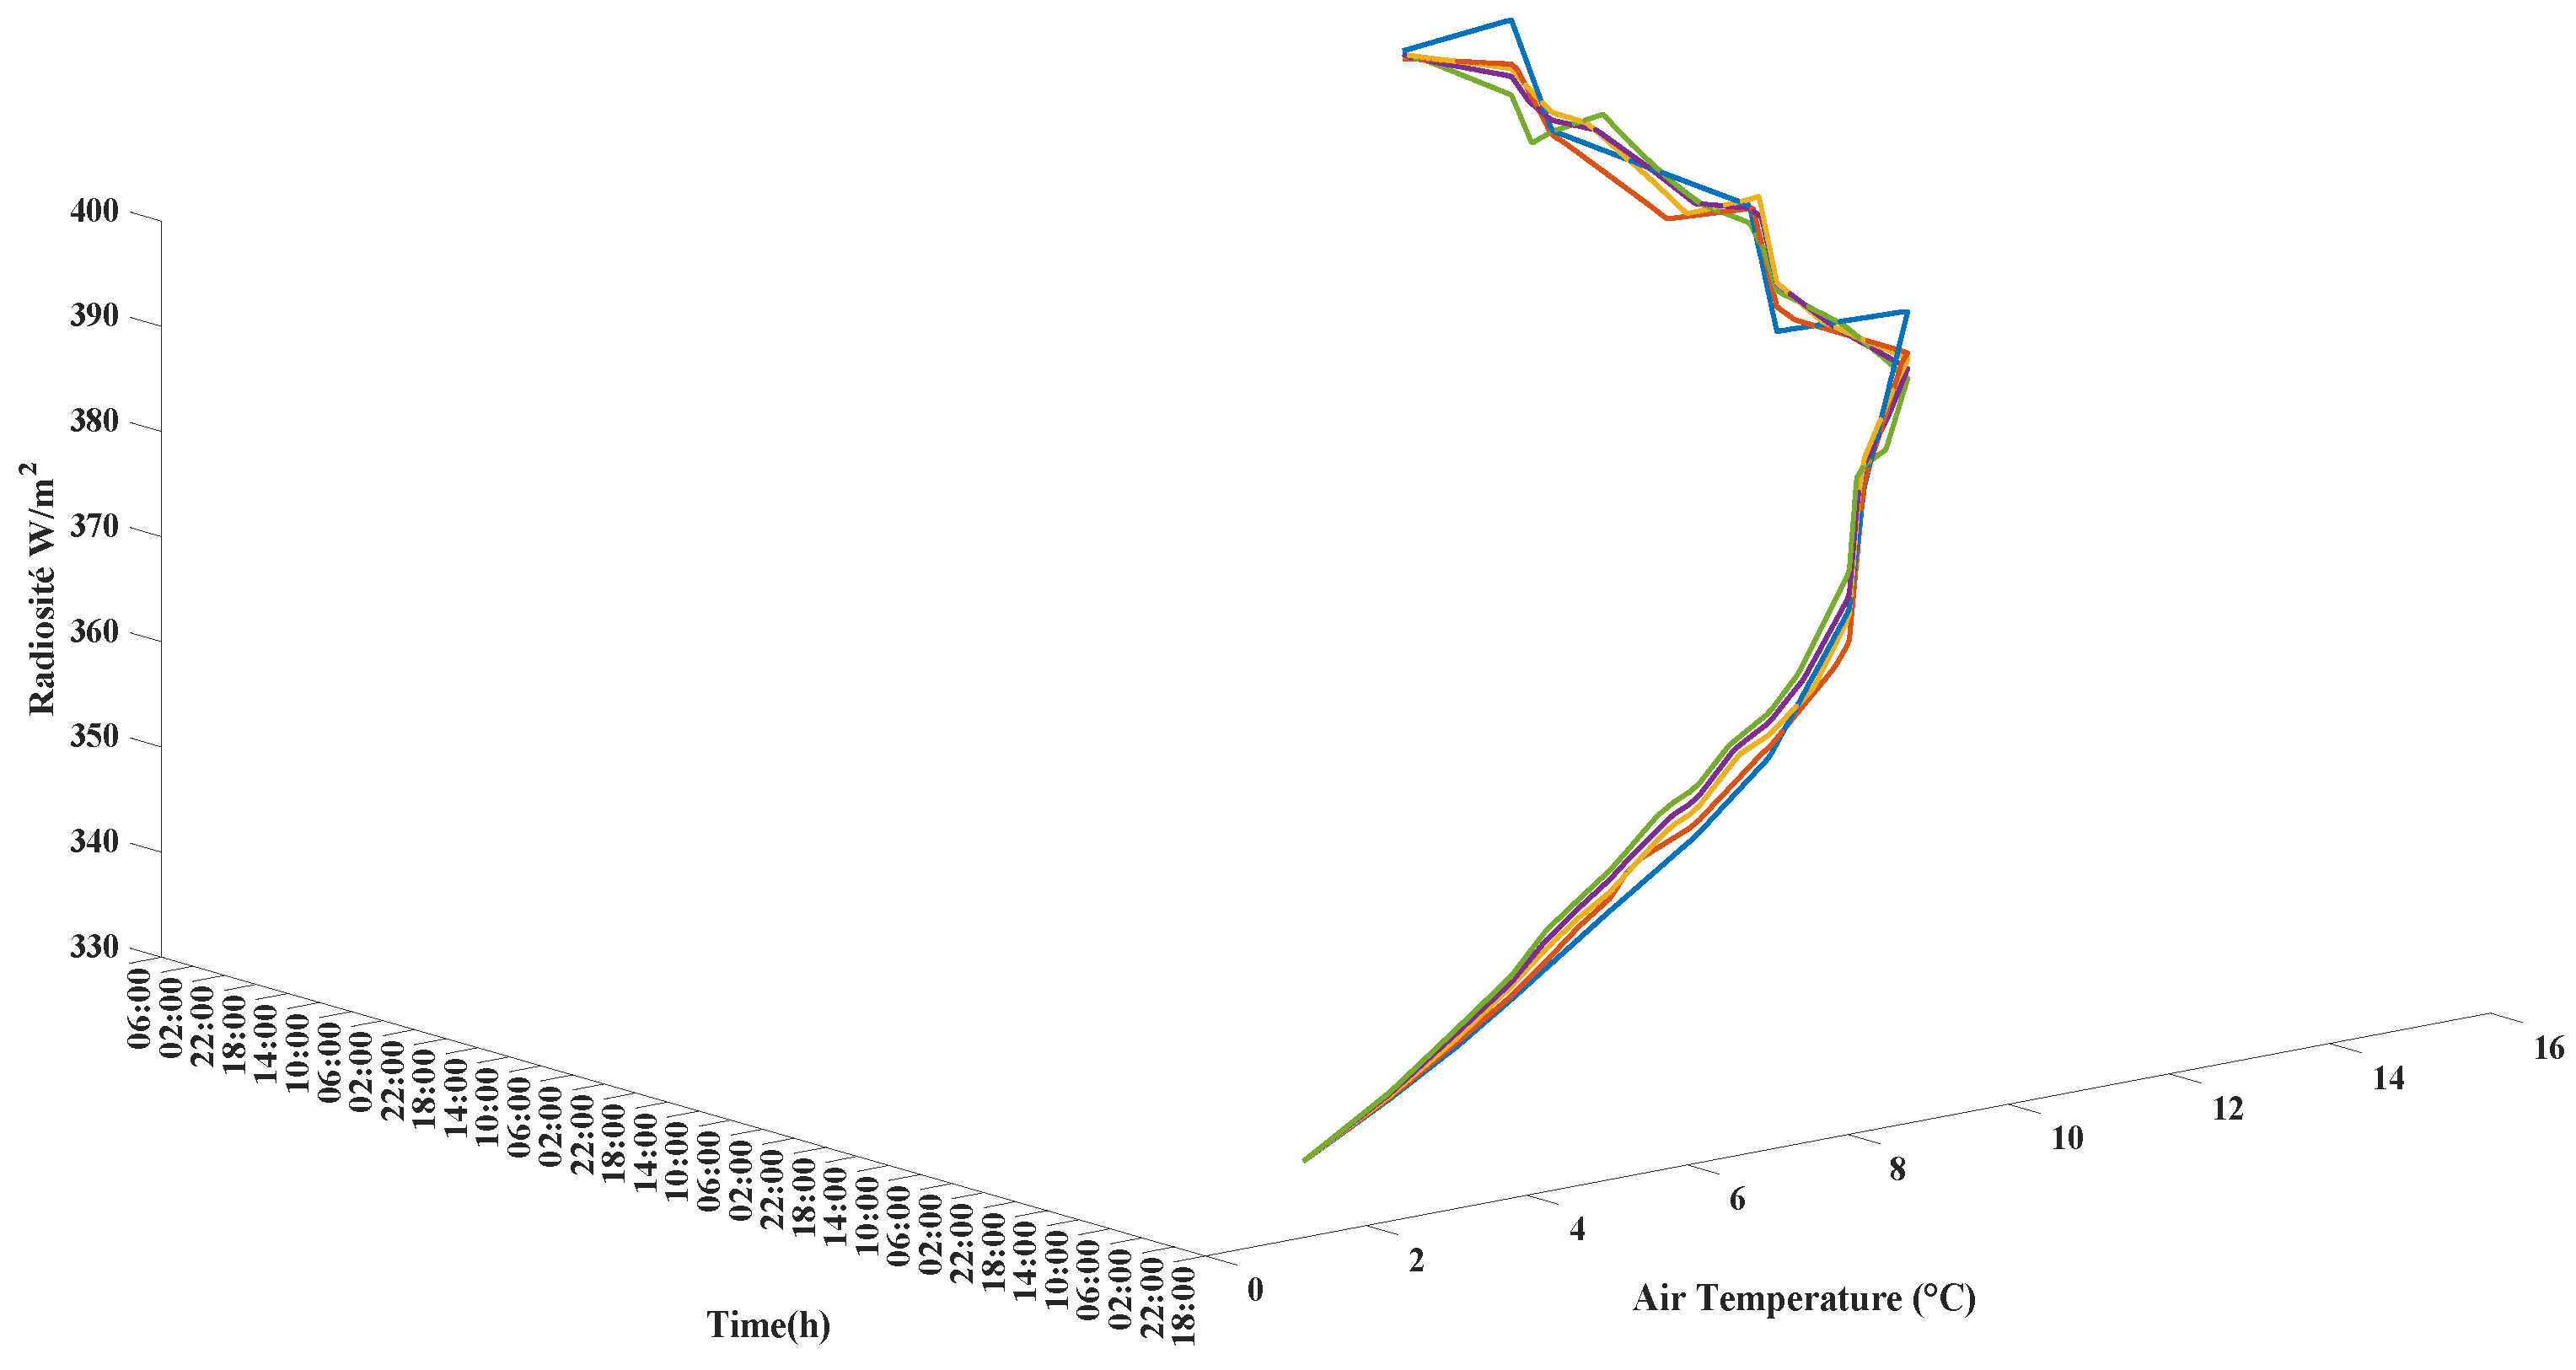
4.3. Effect of the Heating Fluid Temperature on the Surface Radiosity of the Floor

The variation of surface radiosity versus time and air temperature is presented in Figure 11 and Figure 12, respectively. The data were taken over a week at floor fluid temperatures ranging from 30 to 50 °C at 5 °C intervals. In the first period from 0 h to 72 h, the radiosity of the floor surface is subject to a variation of about 2.7% for each 5 °C increase in the heating fluid temperature. Radiosity increases as a function of time and is subject to day–night deviations. It reaches an almost constant value of 380 ± 5 W·m−2 after 72 h due to the thermal equilibrium prevailing in the room. Based on this result and the air temperature variations presented on the gradient in Figure 11, it is clear that the variation in radiosity exerts an insignificant influence on the air temperature during the first period and after stabilization at 72 h.
The variation of radiosity surface area as a function of time and air temperature is presented in Figure 13. The 3D graph shows the variation of radiosity per unit area, inside the rooms heated by the floor heating system, as a function of time and air temperature. Radiosity shows a linear trend with increases of up to the value of 15.1 °C as a function of air temperature, and up to 72 h as a function of time. As previously mentioned, after 72 h of heating, radiosity per unit area remains stable as air temperature by convection remains stable.
There are no explicit investigations in the literature that explain the influence of natural convection on surface radiosity as a function of time, especially in graphical data. The present study is, therefore, one of the first to develop this type of real practical research on a large scale (pilothouse), and even in room spaces. Although there is no representative equation for surface radiosity as a function of time, we can infer from the graphs in Figure 10 and Figure 11 that the evolution of radiosity follows the same trend as that of convection, i.e., that the value of the radiative flux increases in the same way as the air temperature increases as a function of time to equilibrium. Furthermore, by looking at how radiosity behaves as a function of room air temperature and time, it may be concluded that natural convection influences surface radiosity. In order to fully understand this coupling phenomenon between convection and surface radiosity, it is necessary to analyze the behavior of radiosity as a function of air temperature and time. The phenomenon is new and has not yet been developed elsewhere before.

5. Conclusions

The modeling and simulation of the thermal behavior of a solar underfloor heating system for residential buildings were investigated. Numerical simulation was carried out using the Comsol Multiphysics® software, which applied a finite element method to solve physical problems governed by partial differential equations. The simulation tool developed was validated using the experimental data available in the literature, which was obtained from a pilothouse study.
The two-dimensional study has facilitated the investigation of the different mechanisms of heat transfer in underfloor heating systems, namely: conduction, convection, and radiation. The most significant results are summarized below:
  • The simulation data were well in agreement with the experimental data, and the underfloor heating system maintained an average temperature of 15.1 ± 0.35 °C taken at a 50 cm height inside the room on stabilization after 72 h of heating.
  • When the heating transfer fluid temperature was increased from 30 to 50 °C, the result was the same temperature of 15.1 ± 0.35 °C taken at a 50 cm height inside the room. The air temperature remained stable with an insignificant variation after 72 h of heating. This was due to the thermal inertia exerted by the floor and confirms the reliability of this floor heating system to supply heating and domestic hot water.
  • During the heating process, surface radiosity increased as a function of time and reached an almost constant value of 380 ± 5 W·m−2 after 72 h because of the stability of the air temperature by convection. Radiosity variation did not significantly influence the trend in air temperature inside the room, despite the increase in heating transfer fluid temperature from 30 to 50 °C or that of the day–night effect.

Author Contributions

Conceptualization, D.S. and M.B.; methodology, A.L. and M.B.; software, A.L.; validation, A.L., D.S. and M.B.; formal analysis, A.L. and M.B.; investigation, A.L.; writing—original draft preparation, A.L.; writing—review and editing, M.B.; supervision, D.S., A.H. and M.B.; funding acquisition, D.S. and A.H. All authors have read and agreed to the published version of the manuscript.

Funding

This research received no external funding.

Institutional Review Board Statement

Not applicable.

Acknowledgments

Abdelkader Laafer gratefully acknowledges the Algerian Ministry of Higher Education and Scientific Research for funding his internship at the University Rovira i Virgili of Tarragona (Spain) under the National Exceptional Program PNE 2019-2020. The authors appreciate the suggestions put forth during the stages of writing this paper by Abir Hmida from the National Engineering School of Gabes (Tunisia), Mohamed El Amine Slimani from the University of Science and Technology Houari Boumediene (Algeria), and Nacer Eddine Settar from the University of Blida 1 (Algeria).

Conflicts of Interest

The authors declare no conflict of interest.

Nomenclature

Acronyms
BTS (SEB)Stabilized earth bricks
CFDComputational fluid dynamics
DivDivergence
GradGraduim
ONDOLConventional floor heating system in the Korean language
Symbols
mMass fraction (kg)
TTemperature (°C)
qHeat flux density (W)
SCollector area (m2)
RThermal resistance (m2·K·W−1)
KOverall heat transfer coefficient (W·m−2·K−1)
tTime (s)
UVelocity (m·s−1)
Greek symbols
λThermal conductivity (W·m−1·K−1)
ρ Density (kg·m−3)
ε Emissivity

References

  1. Ferrante, A.; Cascella, M.T. Zero energy balance and zero on-site CO2 emission housing development in the Mediterranean climate. Energy Build. 2011, 43, 2002–2010. [Google Scholar] [CrossRef]
  2. Zhai, X.Q.; Yang, J.R.; Wang, R.Z. Design and performance of the solar-powered floor heating system in a green building. Renew. Energy 2009, 34, 1700–1708. [Google Scholar] [CrossRef]
  3. Dall’O’, G.; Bruni, E.; Sarto, L. An Italian pilot project for zero energy buildings: Towards a quality-driven approach. Renew. Energy 2013, 50, 840–846. [Google Scholar] [CrossRef]
  4. Olesen, B.W. Possibilities and Limitations of Radiant Floor Cooling (No. CONF-9702141); American Society of Heating, Refrigerating and Air-Conditioning Engineers, Inc.: Atlanta, GA, USA, 1997. [Google Scholar]
  5. Simmonds, P. Control strategies for combined heating and cooling radiant systems. Ashrae Trans. 1994, 100, 1031–1039. [Google Scholar]
  6. Song, D.; Kim, T.; Song, S.; Hwang, S.; Leigh, S.B. Performance evaluation of a radiant floor cooling system integrated with dehumidified ventilation. Appl. Therm. Eng. 2008, 28, 1299–1311. [Google Scholar] [CrossRef]
  7. Lim, J.H.; Jo, J.H.; Kim, Y.Y.; Yeo, M.S.; Kim, K.W. Application of the control methods for radiant floor cooling system in residential buildings. Build. Environ. 2006, 41, 60–73. [Google Scholar] [CrossRef]
  8. Song, G.S. Buttock responses to contact with finishing materials over the ONDOL floor heating system in Korea. Energy Build. 2005, 37, 65–75. [Google Scholar] [CrossRef]
  9. Yu, T.; Heiselberg, P.; Lei, B.; Pomianowski, M. Validation and modification of modeling thermally activated building systems (TABS) using EnergyPlus. Build. Simul. 2014, 7, 615–627. [Google Scholar] [CrossRef]
  10. De Monte, F. Transient heat conduction in one-dimensional composite slab. A natural’analytic approach. Int. J. Heat Mass Transf. 2000, 43, 3607–3619. [Google Scholar] [CrossRef]
  11. Lu, X.; Tervola, P. Transient heat conduction in the composite slab-analytical method. J. Phys. A Math. Gen. 2004, 38, 81. [Google Scholar] [CrossRef]
  12. Beck, J.V.; Haji-Sheikh, A.; Amos, D.E.; Yen, D. Verification solution for partial heating of rectangular solids. Int. J. Heat Mass Transf. 2004, 47, 4243–4255. [Google Scholar] [CrossRef]
  13. Pantelic, J.; Schiavon, S.; Ning, B.; Burdakis, E.; Raftery, P.; Bauman, F. Full scale laboratory experiment on the cooling capacity of a radiant floor system. Energy Build. 2018, 170, 134–144. [Google Scholar] [CrossRef] [Green Version]
  14. Acikgoz, O.; Karakoyun, Y.; Yumurtacı, Z.; Dukhan, N.; Dalkılıç, A.S. Realistic experimental heat transfer characteristics of radiant floor heating using sidewalls as heat sinks. Energy Build. 2019, 183, 515–526. [Google Scholar] [CrossRef]
  15. Feng, J.; Schiavon, S.; Bauman, F. New method for the design of radiant floor cooling systems with solar radiation. Energy Build. 2016, 125, 9–18. [Google Scholar] [CrossRef] [Green Version]
  16. Zhao, K.; Liu, X.H.; Jiang, Y. Application of radiant floor cooling in large space buildings—A review. Renew. Sustain. Energy Rev. 2016, 55, 1083–1096. [Google Scholar] [CrossRef]
  17. Laouadi, A. Development of a radiant heating and cooling model for building energy simulation software. Build. Environ. 2004, 39, 421–431. [Google Scholar] [CrossRef] [Green Version]
  18. Weber, T.; Jóhannesson, G. An optimized RC-network for thermally activated building components. Build. Environ. 2005, 40, 1–14. [Google Scholar] [CrossRef]
  19. Holopainen, R.; Tuomaala, P.; Piippo, J. Uneven gridding of thermal nodal networks in floor heating simulations. Energy Build. 2007, 39, 1107–1114. [Google Scholar] [CrossRef]
  20. Kitagawa, H.; Asawa, T.; Kubota, T.; Trihamdani, A.R.; Sakurada, K.; Mori, H. Optimization of window design for ventilative cooling with radiant floor cooling systems in the hot and humid climate of Indonesia. Build. Environ. 2021, 188, 107483. [Google Scholar] [CrossRef]
  21. Sattari, S.; Farhanieh, B. A parametric study on radiant floor heating system performance. Renew. Energy 2006, 31, 1617–1626. [Google Scholar] [CrossRef]
  22. Wang, Y.; Zhang, X.; Ji, J.; Tian, Z.; Li, Y. Numerical simulation of thermal performance of indoor airflow in heating room. Energy Procedia 2019, 158, 3277–3283. [Google Scholar] [CrossRef]
  23. Li, H.; Xi, C.; Kong, X.; Lin, Z.; Wang, L. A comparative experimental investigation on radiant floor heating system and stratum ventilation. Sustain. Cities Soc. 2020, 52, 101823. [Google Scholar] [CrossRef]
  24. Lin, B.; Wang, Z.; Sun, H.; Zhu, Y.; Ouyang, Q. Evaluation and comparison of thermal comfort of convective and radiant heating terminals in office buildings. Build. Environ. 2016, 106, 91–102. [Google Scholar] [CrossRef]
  25. Hu, B.; Wang, R.Z.; Xiao, B.; He, L.; Zhang, W.; Zhang, S. Performance evaluation of different heating terminals used in air source heat pump system. Int. J. Refrig. 2019, 98, 274–282. [Google Scholar] [CrossRef]
  26. Report of the Cooperation Project CDER/CNERIB with Med-Enec. Energy Efficiency in the Construction Sector in the Mediterranean. June 2007. Available online: https://www.africapresse.paris/L-Algerie-experimente-l-habitat (accessed on 13 March 2020).
  27. Imessad, K.; Derradji, L.; Messaoudene, N.A.; Mokhtari, F.; Chenak, A.; Kharchi, R. Impact of passive cooling techniques on energy demand for residential buildings in a Mediterranean climate. Renew. Energy 2014, 71, 589–597. [Google Scholar] [CrossRef]
  28. Benouali, H.; Brara, A.; Mahdad, M.; Mokhtari, F. Caractérisation Thermophysique et Suivi Thermique de Deux Bâtisses Réalisées en Blocs de Terre Comprimée; XXIXe Rencontres Universitaires de Génie Civil: Tlemcen, Algeria, 2011; pp. 254–264. [Google Scholar]
  29. Derradji, L.; Imessad, K.; Amara, M.; Boudali Errebai, F. A study on residential energy requirement and the effect of the glazing on the optimum insulation thickness. Appl. Therm. Eng. 2017, 112, 975–985. [Google Scholar] [CrossRef]
  30. DTR C3-2. Thermal Regulation of Residential Buildings e Calculating Methods for Determining Building Heat Losses; CRIB: Algiers, Algeria, 2019; Available online: https://www.academia.edu/11791860/DTR_C3_2_Reglement_thermique_des_batiments_dhabitation_regle_de_calcul_des_peperdition_calorifique_FACICULE1 (accessed on 28 February 2020).
  31. Semache, A.; Hamidat, A.; Benchatti, A. Impact study of the solar energy on the energy performances of the rural housing in Algeria. Int. J. Heat Technol. 2015, 33, 229–236. [Google Scholar] [CrossRef]
  32. Yaiche, M.R.; Bouhanik, A.; Bekkouche, S.M.A.; Malek, A.; Benouaz, T. Revised solar maps of Algeria based on sunshine duration. Energy Convers. Manag. 2014, 82, 114–123. [Google Scholar] [CrossRef]
  33. Martinez, P.J.; Velázquez, A.; Viedma, A. Performance analysis of a solar energy driven heating system. Energy Build. 2005, 37, 1028–1034. [Google Scholar] [CrossRef]
  34. Sacadura, J.F. Initiation Aux Transferts Thermiques. 1978. Available online: https://www.worldcat.org/title/initiation-aux-transferts-thermiques/oclc/957575746?referer=di&ht=edition (accessed on 28 February 2020).
  35. Mokhtari, F. Thermal Study and Dimensioning of the Solar Heating System of a Detached House Design of a Numerical Simulation Model; University of Sciences and Technology Mohamed Boudiaf: Oran, Algeria, 2017. [Google Scholar]
  36. Wang, H.; Yu, Y.; Yu, J.; Wang, Z.; Li, H. Development of erosion equation and numerical simulation methods with the consideration of applied stress. Tribol. Int. 2019, 137, 387–404. [Google Scholar] [CrossRef]
  37. Helaly, H.O.; Awad, M.M.; El-Sharkawy, I.I.; Hamed, A.M. Theoretical and experimental investigation of the performance of adsorption heat storage system. Appl. Therm. Eng. 2019, 147, 10–28. [Google Scholar] [CrossRef]
  38. Gothäll, H. How to Inspect Your Mesh in COMSOL Multiphysics. COMSOL Multiphysics 2017. Available online: https://www.comsol.com/blogs/how-to-inspect-your-mesh-in-comsol-multiphysics (accessed on 12 May 2017).
  39. Calbureanu, M.; Talu, M.; Travieso-González, C.M.; Talu, S.; Lungu, M.; Malciu, R. The finite element analysis of water vapor diffusion in a brick with vertical holes. In Proceedings of the International Conference on Mathematical Models for Engineering Science-Proceedings, Puerto De La Cruz, Esp, Spain, 30 November–2 December 2010; Available online: http://hdl.handle.net/10553/48823 (accessed on 2 March 2020).
  40. Hernández, F.F.; López, J.M.C.; Gutiérrez, A.F.; Muñoz, F.D. A new terminal unit combining a radiant floor with an underfloor air system: Experimentation and numerical model. Energy Build. 2016, 133, 70–78. [Google Scholar] [CrossRef]
  41. Errebai, F.B.; Derradji, L.; Amara, M. Thermal Behaviour of a Dwelling Heated by Different Heating Systems. Energy Procedia 2017, 107, 144–149. [Google Scholar] [CrossRef]
Figure 1. Architectural plan of the pilothouse.
Energies 14 03880 g001
Figure 2. Orientation of the pilothouse.
Energies 14 03880 g002
Figure 3. Floor piping presentation in Zone 1 (living room).
Energies 14 03880 g003
Figure 4. Schematic diagram of the solar system.
Energies 14 03880 g004
Figure 5. Details of the nonstructured mesh.
Energies 14 03880 g005
Figure 6. Comparison between the simulation and experimental temperature profiles of ambient air during the heating process.
Energies 14 03880 g006
Figure 7. Comparison between the theoretical and experimental temperature profiles of ambient air between 72 h and 132 h periods.
Energies 14 03880 g007
Figure 8. Air temperature distribution over 132 h at a floor fluid temperature of 40 °C.
Energies 14 03880 g008
Figure 9. CFD local air temperature gradient in the living room: (A) before heating; (B) after 24 h of heating; (C) after 48 h of heating; (D) after 70 h of heating; (E) after 96 h of heating; (F) after 132 h of heating.
Energies 14 03880 g009
Figure 10. Variation of air temperature as a function of time with temperature variation in the heat transfer fluid.
Energies 14 03880 g010
Figure 11. Radiosity versus time at different temperatures of the heating fluid.
Energies 14 03880 g011
Figure 12. Surface radiosity as a function of air temperature at different floor fluid temperatures.
Energies 14 03880 g012
Figure 13. Radiosity in 3D versus time and air temperature.
Energies 14 03880 g013
Table 1. Constitution and thermal properties of the different walls in the pilothouse [31].
CompositionThickness (m)λ (W·m−1·K1)Kwall (W·m−2·K−1)
External wallSEB (BTS) EPS0.141.30.36
XPS0.090.04
SEB0.291.3
FloorConcrete0.051.750.54
XPS0.060.04
Concrete0.151.75
Mortar + sand0.031.15
Tiling0.021.7
CeilingMortar0.031.60.23
EPS0.160.04
Concrete0.081.75
Plaster0.040.35
Table 2. Composition of the different façades.
FaçadeCompositionDimension
Room 1Window126 × 140 mm
Room 2Window170 × 140 mm
Living RoomPatio Door141 × 220 mm
Publisher’s Note: MDPI stays neutral with regard to jurisdictional claims in published maps and institutional affiliations.

