Article

Carbon Footprint of Residents’ Housing Consumption and Its Driving Forces in China

1
China-UK Low Carbon College, Shanghai Jiao Tong University, Shanghai 200240, China
2
School of International and Public Affairs, Shanghai Jiao Tong University, Shanghai 200030, China
3
China Institute for Urban Governance, Shanghai Jiao Tong University, No. 1954, Huashan Road, Shanghai 200030, China
4
School of Environmental Science and Engineering, Shanghai Jiao Tong University, Shanghai 200240, China
*
Author to whom correspondence should be addressed.
Energies 2021, 14(13), 3890; https://doi.org/10.3390/en14133890
Submission received: 17 May 2021 / Revised: 22 June 2021 / Accepted: 25 June 2021 / Published: 28 June 2021

Abstract

:
A large population size and rapid economic growth have resulted in a huge amount of housing consumption in China. Therefore, it is critical to identify the determinants of housing carbon footprint (CF) and prepare appropriate carbon mitigation measures. By employing the IPCC accounting method, input-output analysis and the stochastic impacts by regression on population, affluence, and technology (STIRPAT) model, this study aims to study the spatio-temporal patterns and identify the driving factors of housing CF. The results show that regional disparities and urban-rural differences existed during the period 2012–2017. The results of the extended STIRPAT model show that population scale and energy consumption per unit building area are the two dominant contributors to the housing CF increments in all areas. While, family size only shows significant negative impact in eastern and western regions, the per capita disposable income only induces higher housing CF in rural areas, and energy structure had a remarkable positive impact in urban area of western region and all rural areas. Policy recommendations are proposed to mitigate the overall housing CF, including; controlling population growth and promoting urbanization benefits; encouraging green consumption; optimizing household energy consumption structure, and; enhancing residential building energy management.

1. Introduction

Climate change has become a global issue and has received considerable attention from various stakeholders [1]. As the largest emitter, China’s total CO2 emission reached 9825.8 Mt in 2019, accounting for 28.8% of the global CO2 emission [2]. In order to respond climate change, China promised to peak its carbon dioxide emission by 2030 and achieve carbon neutrality by 2060 [3].
As an important source of China’s CO2 emission, household sector has become a key sector for mitigation efforts [4,5]. Globally, around 72% of GHG emissions are driven by household consumption [6]. The carbon footprint (CF) refers to the total amount of CO2 emission that is directly and indirectly caused by an activity or is accumulated over the lifecycle of a product or service [7,8]. Household CF includes direct CF from energy consumption and indirect CF embodied in production and delivery of services related to final household consumption. According to China National Bureau of Statistic, household consumption can be classified into eight consumption categories, including; food; clothing; household facilities and services; medical and pharmaceutical products; transportation and communication; education and entertainment; housing; and others [7]. Previous studies estimated household CF at different levels using various methods. For instance, Qu et al. [9] estimated China’s household CF at national, regional and urban/rural levels based on a survey of 17,406 households and found significant disparities in China’s household CF between urban and rural areas. Bin and Dowlatabadibi [10] proposed the consumer lifestyle approach to estimate household CF in US, in which they found that more than 80% of GHG emissions in US were related with household consumption. Jesper et al. [11] used an input-output analysis (IOA) method to calculate the household CF in Denmark, showing that Danish household consumption increased by 58% over the period 1966–1992 while household CF only increased by 7%. Yang and Liu [12] used a social practice model to evaluate the impact of individual differences on urban household CF at the city level. They uncovered that nearly 20% of the general public were responsible for 60%–70% of the overall urban CF and increasing income and ownership of real estate contributed to increased household CF.
CF from housing consumption has become an important component of household CF [13,14]. Housing consumption refers to all the related residential expenses, including rent, water, electricity, fuel and property management [15]. Fossil fuel-based carbon emission from housing operations exceeded 900 Mt in 2018 (central heating is not included) [16]. Meanwhile, rapid economic growth and housing marketization exacerbate housing inequality between urban and rural residents and among different regions [17]. China is facing a great pressure to satisfy its huge housing needs from its 1.4 billion residents. However, housing consumption has received less attention. Previous studies focused only on direct or indirect CF from housing consumption or the whole building sector. For example, Wang [18] developed a national building energy accounting model by splitting the energy balance sheet. This model was later extended to the provincial level [19]. The Tsinghua University Building Energy Research Center [20] evaluated China’s building sector CF by developing the China Building Energy Model. Zhang et al. [21] used a process-based life cycle assessment (LCA) approach to evaluate the trends of China’s building sector CF from 2000 to 2016 and found that urban residential activities have become the main source of CF. While, the construction scale, building structure type, and material production efficiency are the three important driving factors.
Academically, the stochastic impacts by regression on population, affluence, and technology (STIRPAT) model is frequently used to identify the driving forces of CO2 emissions [22]. In this regard, Dietz and Rosa first proposed the STIRPAT model based on the impacts of population, affluence, and technology model [23,24]. This model could disaggregate the influential factors into many proxy variables [25,26,27]. By using one extended STIRPAT model, Wang et al. [28] found that the key factors influencing energy-related CO2 emission in Guangdong, including population, economic growth, technological progress, urbanization, industrialization, service level, energy consumption structure and foreign trade. Liddle and Lung [29] examined the impact of population age structure by dividing population into key age groups and found that elderly people had a negative influence on CO2 emission. Yang et al. [30] examined the influence of population-related factors on CO2 emission in Beijing and found that the shrinking household size and increasing mobile population were main driving forces that promoted the growth of CO2 emissions. In addition, some researchers applied this method to identify the factors affecting the CF of household consumption. Yao et al. [31] quantified the contribution of driving factors of the CF from Chinese household consumption during 1991–2010 and pointed that population growth, urbanization and improved consumption level were the main driving forces leading to a higher CF of household consumption. However, few studies focused on the factors affecting the CF of housing consumption.
In summary, three research gaps exist and should be filled. First, few researches target both direct and indirect housing CFs from a holistic point of view. Second, previous studies focused on household CF or house building CF, but ignored China’s CF caused by housing consumption. In particular, urban-rural CF differences and regional CF disparities should be uncovered. Finally, few studies focused on the factors influencing the CF of housing consumption.
To fill such research gaps, this study aims to investigate the spatio-temporal patterns and driving forces of China’s housing consumption CF for the period of 2012–2017, so that appropriate policy implications could be provided. Both the IPCC method and the IOA method are applied to account China’s total housing consumption CF. In addition, an extended STIRPAT model is employed to uncover the factors influencing the CF of housing consumption. This study is conducted at the provincial level so that both regional disparity and urban-rural heterogeneity can be uncovered.
This paper is organized as below. After this introduction section, Section 2 presents the research methods, as well as accounting boundary and data sources. The research results are presented in Section 3, and policy implications are discussed in Section 4. Finally, Section 5 draws research conclusions.

2. Methods and Data

2.1. Accounting Boundary

In order to calculate CF caused by housing consumption, a research boundary should be first established. In this study, the accounting boundary was set based on the definition of housing expenditure (including household energy expenditure, household water expenditure, housing rent expenditure, housing maintenance expenditure, property management expenditure, housing mortgage expenditure, etc.) addressed by National Bureau of Statistics of China [15], shown in Figure 1. In this study, direct CF is defined as the carbon emission from energy consumption of residential buildings and indirect CF is defined as the embodied carbon emission from non-energy consumption of housing products and services.

2.2. Direct CF of Housing Consumption

Direct CF of housing consumption includes consumption of electricity and heat. Although CF caused by heat and electricity consumption is usually recognized as indirect carbon emission from industrial carbon emission [32], it is normally regarded as direct CF from household energy consumption [10,33]. Direct CF of housing consumption can be calculated by Equation (1):
E d i r e c t y = C i y × C E F i y
where i represents energy source type i (including fossil fuel, electricity and heating), y represents the investigated province; Edirect represents direct CF of housing consumption, C represents the final consumption of energy type i, CEF represents the carbon emission factor.
According to GHG accounting method developed by Intergovernmental Panel on Climate Change (IPCC) [34], CEF of fossil fuels can be calculated by Equation (2),
C E F   fossil = L C V   × C C   × O   × E E F   × 44 12
where LCV represents the lower calorific value, CC represents the carbon content, O represents the oxidation rate, EEF represents the effective emission factor, 44 represents the molecular mass of carbon dioxide, 12 represents the atomic mass of carbon.
The values of CEF of electricity are obtained from the report of the average carbon dioxide emission factor of China’s regional power grid released by NDRC (National Development and Reform Commission) [35], listed in Table S1.
By obtaining the carbon emission factors based on the provincial energy balance sheets, CEF of heating can be calculated by Equation (3):
C E F   y =   C K y × E F   K y P y
where y represents the investigated province; CK represents the final consumption of energy type k consumed for heat production. EFK represents the carbon emission factor of energy type k, P represents the heat production.

2.3. Indirect CF of Housing Consumption

Input-output analysis [36] is a main method to calculate indirect carbon emission. This method is adopted for calculating the indirect emission of residential housing consumption. Equation (4) shows how to calculate such an emission:
C e = D × I A 1 × F
where Ce represents indirect household carbon emission. D represent the vector of direct emission intensity of industrial sectors. A represents direct intermediate input coefficient matrix. I represents an identity matrix with the same rank as A. F represents the matrix of residential final consumption.
Since the Input-Output Tables are only available for years 2012 and 2017, according to the research of Mi et al. [37], this study used Equation (5) to obtain indirect carbon emission data for consecutive years,
C E i n d i r e c t = D i I A i 1 F i                                                                                         i = 2012 , 2017 4 5 D i I A i 1 1 + 1 5 D i I A i + 4 1 F i     i = 2013 3 5 D i I A i 2 1 + 2 5 D i I A i + 3 1 F i       i = 2014 2 5 D i I A i 3 1 + 3 5 D i I A i + 2 1 F i       i = 2015 1 5 D i I A i 4 1 + 4 5 D i I A i + 1 1 F i       i = 2016  
where E i n d i r e c t represents indirect household carbon emission, Di represents represent the vector of direct emission intensity of industrial sectors in year i.  A i represents direct intermediate input coefficient matrix in year i, I represents an identity matrix with the same rank as A i . F i represents the matrix of residential final consumption in year i.
According to the China Statistical Yearbooks, the IO sectors could be matched with eight household expenditures categories. Therefore, indirect CF of housing consumption could be calculated by integrating the results from the indirect emissions of different industrial sectors, based on the matching relationships between the eight consumption categories and corresponding industrial sectors in the input-output tables [7,32] (listed in Table S2).

2.4. STIRPAT Model

Ehrlich and Holdren [23] developed the IPAT model to explore the effects of demographic, economic and technological activities on carbon emissions, which is shown in Equation (6):
I = P × A × T
where I denotes environmental impact, P is population, A is affluence, and T is technology. However, the linear hypothesis of this model limits its application. In order to solve this problem, Dietz and Rosa [24] developed the STIRPAT model, considering the stochastic impacts of population, affluence, and technology. The STIRPAT model is expressed in Equation (7):
I = α × P b × A c × T d
where α refers to the constant term; b, c and d represent coefficients of P, A and T, respectively. After taking logarithms, this model is transformed to Equation (8):
ln I = ln α + b ln P + c ln A + d ln T
In STIRPAT model, relevant variables could be added into the original model due to its flexibility [30]. P is replaced by population scale and family size; A is replaced by income level. T is replaced by residential housing energy intensity and energy structure. The extended STIRPAT model can be illustrated in Equation (9):
ln C i t = α 0 + α 1 ln P O P i t + α 2 ln F S i t + α 3 ln I N C i t + α 4 ln E C M 2 i t + α 5 ln E S i t + ε it
where i represents one province or municipality; t refers to the year; α 0 denotes the constant term; α 1 , α 2 , α 3   α 4 and α 5 are coefficients of P O P ,   F S ,   I N C ,   E C M 2   and E S ; ε i t is the residual error. C represents housing consumption CF; POP represents population scale; FS represents family size; INC represents per capita disposable income; E C M 2 represents energy consumption per unit building area; and E S represents energy structure.
Prior to the correlation test among the variables, each variable is undergone the logarithmic processing to eliminate the influence of dispersion of data [38]. Then, the diagnostic check is performed to test whether there is multicollinearity or not [39]. Tables S3 and S4 list the descriptive statistical results and correlations of all variables. VIF (variance inflation factor) values are listed in Table 1, which are all less than 10, indicating that there is no multicollinearity [39]. Further, in order to guarantee the validity and accuracy of the regression of panel data and improve the stability and reliability of the regression coefficients, static panel regression is used to estimate the regression model [40]. The whole process is carried out using STATA 14.0 statistical software.

2.5. Data Sources

Due to the availability of data, Hong Kong, Macao, Taiwan, and Tibet are not included in this study. Therefore, in total 30 Chinese provinces are included in this study. In order to further uncover regional disparity of housing CF, these thirty provinces are classified into three regions, namely, the eastern region, central region, and western region [41], as shown in Figure 2.
The direct housing energy consumption data are from energy balance sheets of 30 provinces. Since household consumption statistical data, include fuel consumption for transportation, all the gasoline and 95% diesel should be excluded as transportation energy consumption [18]. Considering China’s real energy quality, the carbon contents, oxidation rates and low calorimetric data of most fuels are obtained from China 2005 GHG Inventory [42], and others are supplemented by 2006 IPCC Guidelines for National Greenhouse Gas Inventories [34] and the Statistical System of Energy and Resource Consumption of Public Institutions [43], which are listed in Table S5. In particular, by considering different combustion efficiencies in different sectors [42], the emission factors of coal are calculated by using different oxidation rate values from relevant sectors (heating and household housing consumption), rather than the default values recommended by IPCC, which are listed in Table S6. Further, the emission factor of raw coal is calculated by considering different proportions of coal types (bituminous coal, anthracite coal, brown coal) in different sectors (see Table S7).
All the provincial sectoral emissions data are obtained from CEADS (China emission accounts and datasets) [44,45,46]. Residential housing expenditure data in different provinces are obtained from provincial statistical yearbooks [47]. In order to eliminate the impact of inflation, the original data related to current prices are transferred into 2012 constant prices. All the price indices are obtained from the China Bureau of Statistics.
Detailed variables in the STIRPAT model are listed in Table 2, including indicator explanations, units, and data sources.

3. Results

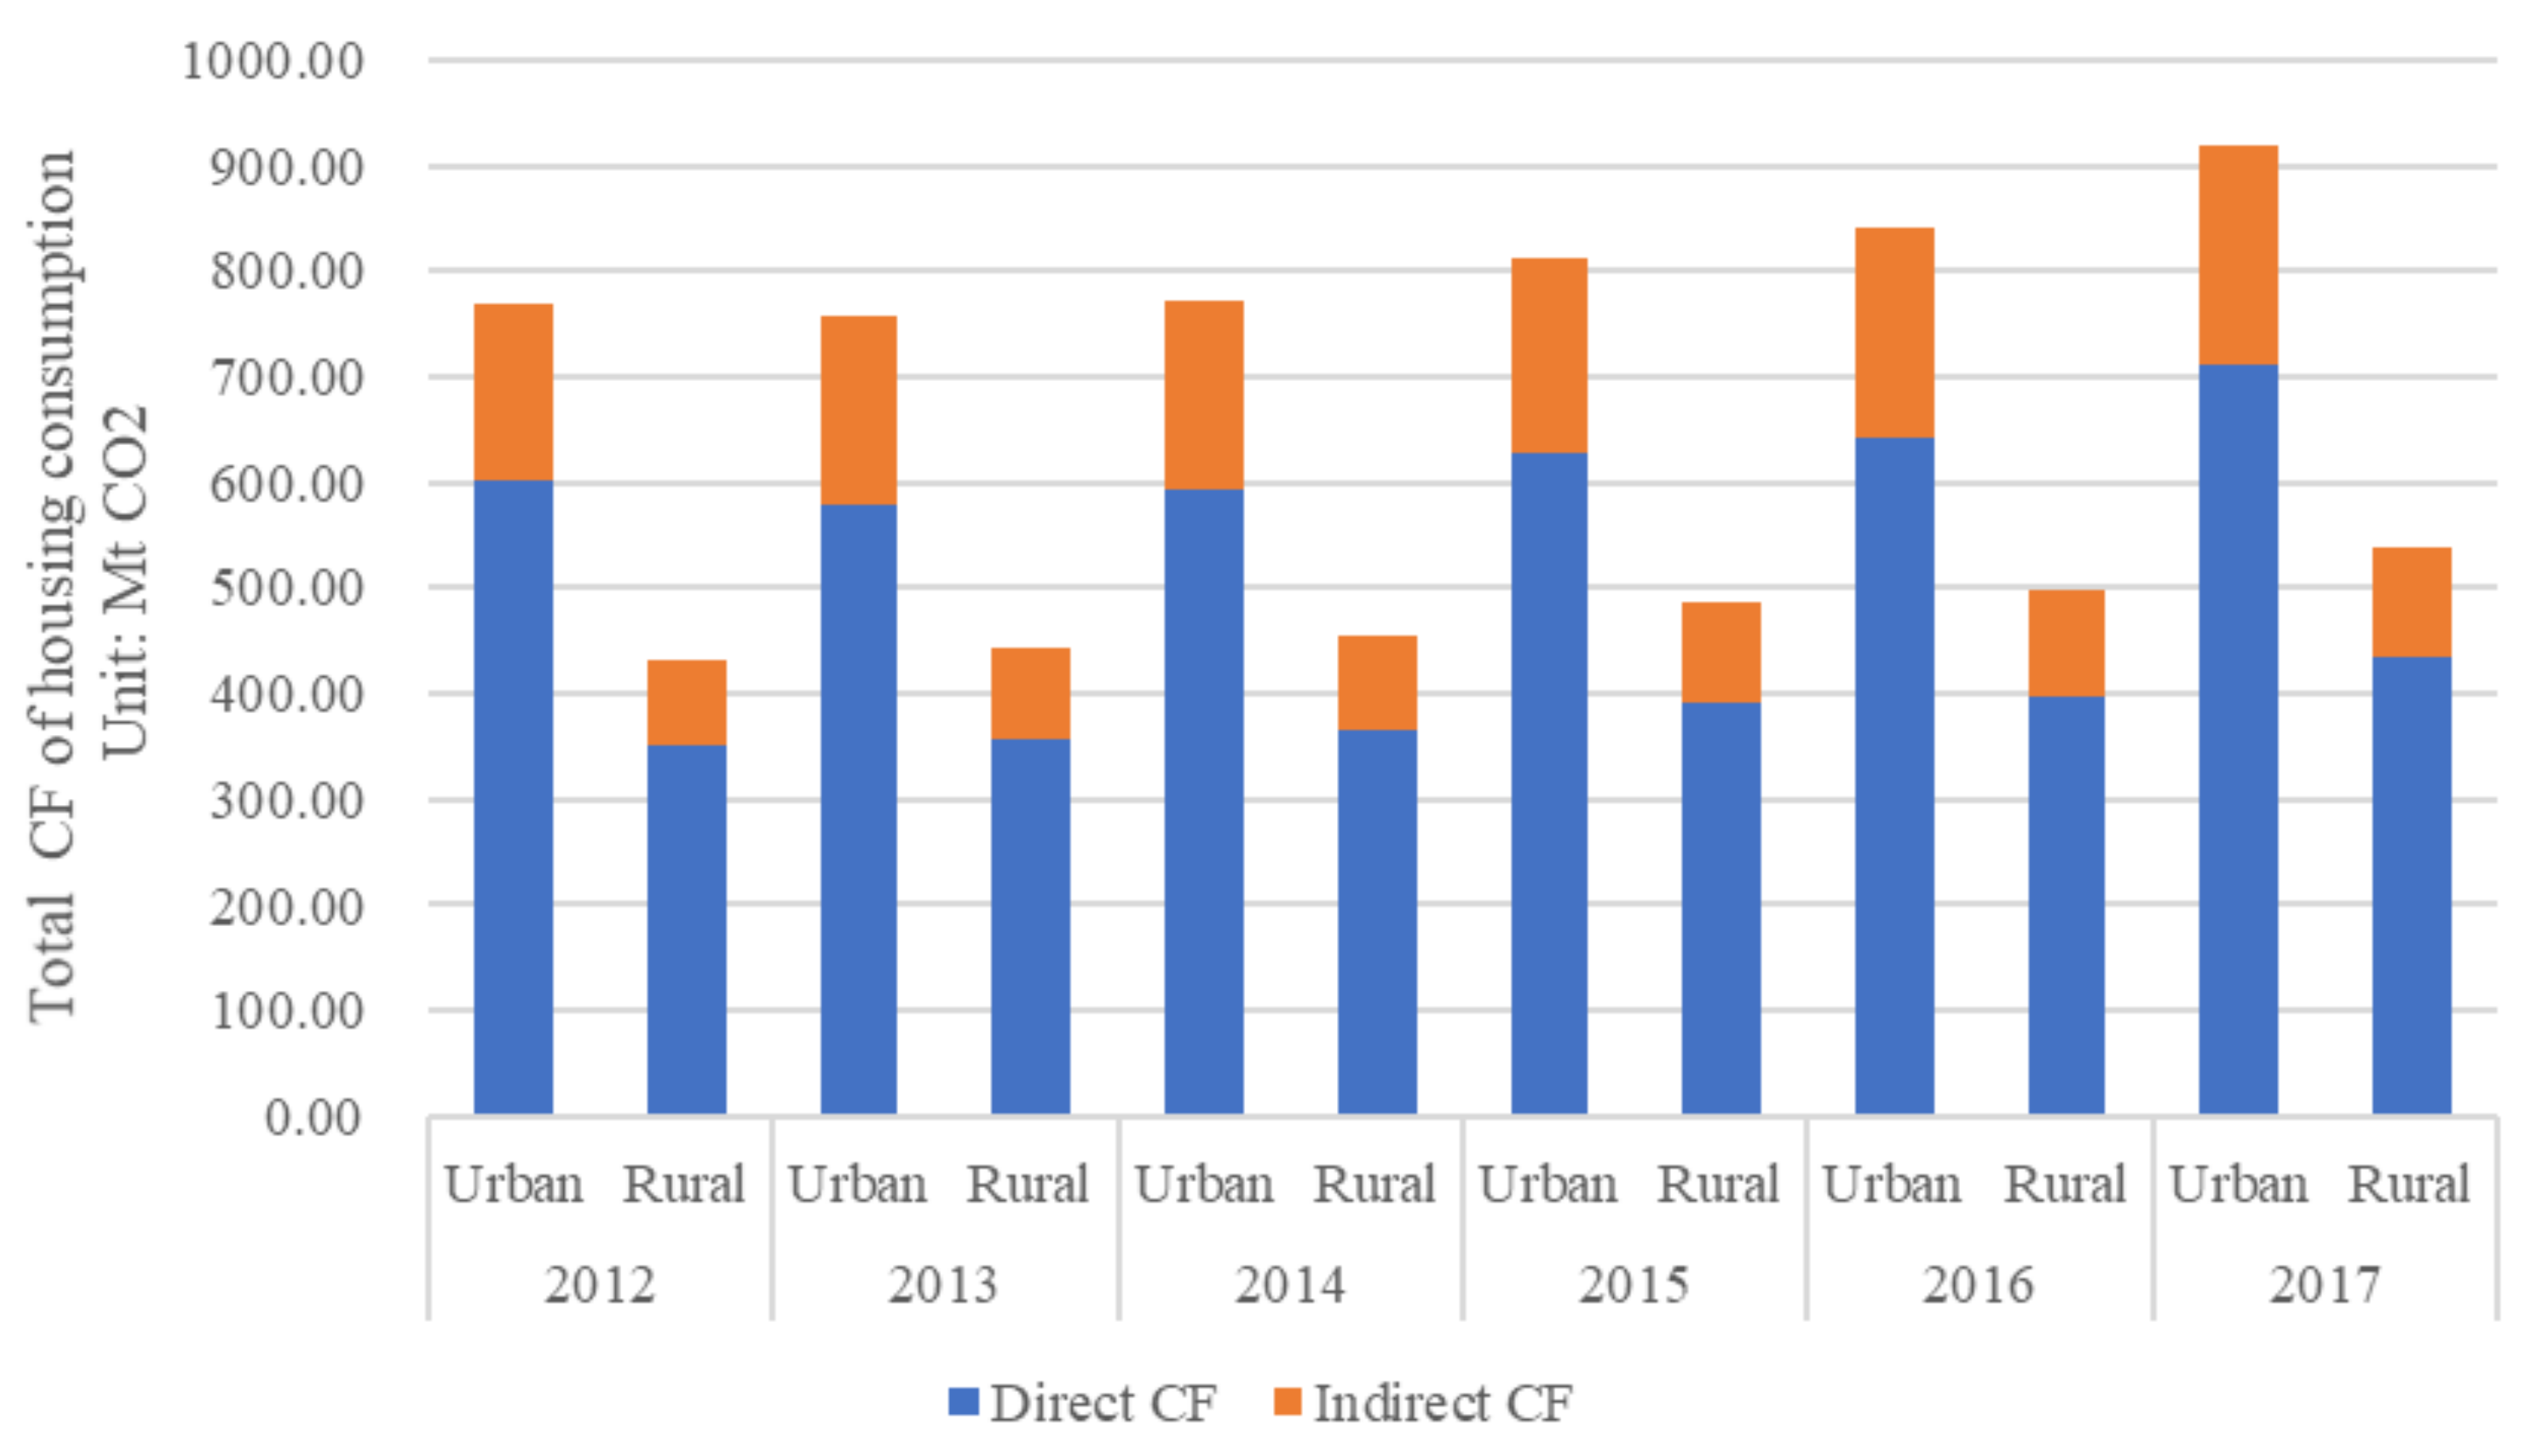
3.1. CF of Housing Consumption at National Level

Figure 3 shows China’s CFs of housing consumption at national level during 2012–2017. CF of housing consumption kept an increasing trend. Compared to indirect CF, direct CF of housing consumption is obviously large, which accounts for more than 75% in both urban and rural areas.
As for the differences between urban and rural areas, urban CF of housing consumption kept higher than rural CF for every study year and the gap between urban and rural areas became widening. However, as Figure 4 shows, from a per capita point of view, the gap between urban and rural areas became narrow, implying that rapid urbanization highlights the urban-rural difference in total CF of housing consumption in recent years.

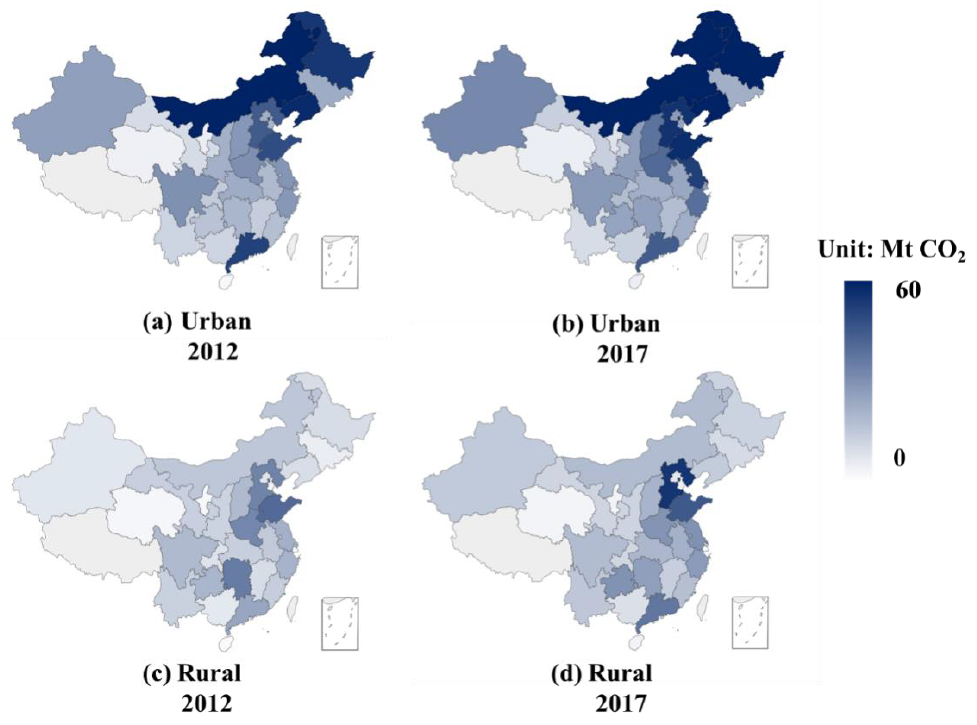
3.2. Total CFs of Housing Consumption at Provincial Level

Figure 5a shows the CFs of housing consumption of urban areas at provincial level in 2012. It is clear that regional disparities exist at provincial level. The top three provinces with the highest CFs driven by housing consumption include Inner Mongolia (64.7 Mt), Liaoning (57.9 Mt), and Heilongjiang (54.7 Mt), while the top three provinces with the lowest CFs driven by residential housing consumption include Ningxia (4.6 Mt), Qinghai (4.0 Mt), and Hainan (1.9 Mt). In particular, with the lowest provincial housing CF, Hainan’s housing CF was only 2.91 % of that of Inner Mongolia in 2012.
Figure 5b shows the CFs of housing consumption of urban areas at provincial level in 2017. The housing CFs in most provinces increased during 2012–2017, except in Yunnan, Guangdong, Sichuan, Hubei and Jilin where the housing CFs decreased by 17.78%, 14.18%, 7.47%, 4.37% and 3.47%. Compared with provincial housing CFs in 2012, the top three provinces with the highest housing CFs kept the same, as well as the lowest ones, indicating that regional disparities still existed during the study period.
Figure 5c shows the CFs of housing consumption in rural areas at provincial level in 2012. It is clear that the housing CFs in rural areas in eastern provinces were normally higher than their central and western counterparts. The top three provinces with the highest housing CFs include Shandong (40.6 Mt), Hunan (35.7 Mt), and Hebei (33.6 Mt), while the top three provinces with the lowest housing CFs include Shanghai (2.5 Mt), Ningxia (2.1 Mt), and Hainan (1.3 Mt).
Figure 5d shows the CFs of housing consumption in rural areas at provincial level in 2017. The rural housing CFs increased in most provinces, especially those in Eastern China. The CFs of housing consumption in Hebei increased from 33.6 Mt in 2012 to 55.1 Mt in 2017, which experienced the largest increase among all the provinces. However, housing CFs in several provinces decreased. In particular, such a value in Hunan decreased by 26.7% from 2012 to 2017, with the largest proportional decrease among all the provinces.
In terms of the differences between urban and rural areas, provincial housing CF in urban areas was higher than that of rural areas in most provinces, except for Yunnan, Hunan and Guizhou. Due to the need of winter heating in Liaoning, Inner Mongolia and Heilongjiang, the gaps between urban and rural housing CFs in these provinces are more than 45 Mt, leading to that these provinces had the largest urban-rural gaps among all the provinces. In addition, spatial distribution patterns of housing CFs in urban and rural areas were consistent, except for Heilongjiang, Liaoning, and Inner Mongolia.

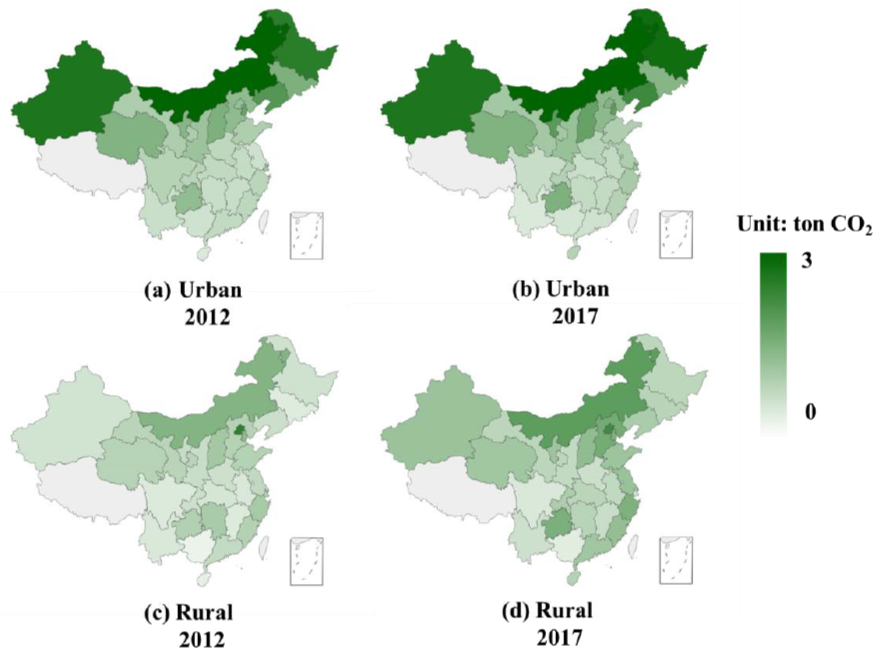
3.3. Per Capita CF of Housing Consumption at Provincial Level

Figure 6a shows per capita CF of housing consumption in urban areas at provincial level in 2012. Provinces with high per capita housing CF are mainly those with long-time winter heating. Such values in Heilongjiang, Jilin, Inner Mongolia and Xinjiang accounted for more than 50% of their provincial total housing CFs. The detailed results are shown in Table S8. Especially, CF from heating in Xinjiang accounts for 66.8% of its total housing CF, the highest among all the investigated provinces. In addition, Inner Mongolia has the highest per capita housing CF, which is 4.5 tones, almost 1.7 times of the following province.
Figure 6b shows per capita CF of housing consumption in urban areas at provincial level in 2017. Compared with 2012, most provinces experienced slight changes, expect for Hainan, Jiangsu and Ningxia, where the per capita CF of housing consumption increased significantly by 107.98%, 62.73%, and 37.82%, respectively. Notably, the per capita housing CF in Inner Mongolia was still the highest in 2017.
Figure 6c shows per capita CF of housing consumption in rural areas at provincial level in 2012. Provinces with high per capita housing CF are mostly in the eastern region. Especially, such a value achieved 2.45 t per capita in Beijing, the highest among all the investigated provinces.
Figure 6d shows per capita CF of housing consumption in rural areas at provincial level in 2017. Such values in most provinces increased, except for Beijing, Shanghai, Hunan and Gansu. For instance, significant increases occurred in Hainan, Jilin, and Xinjiang, with more than 100% increases.
In terms of such CF differences between urban and rural residents, per capita CF of housing consumption in urban areas was higher than that in rural areas in most provinces in 2012, except for Beijing, Fujian, Zhejiang, Jiangsu and Hunan, which are almost located in the eastern region. In addition, the per capita housing CF in rural areas in nine provinces (including Hebei, Shandong, Guangdong, Hainan, Anhui, Hubei, Chongqing, Guizhou and Yunnan) exceeded that of urban areas in 2017. The spatial pattern indicates that inequality between urban and rural areas still exists, as well as between different regions.
In particular, per capita CF gaps between urban and rural areas decreased in most provinces due to the huge increase of per capita CF of housing consumption in rural areas, indicating that it is of great importance to pay more attention to energy conservation and carbon emission reduction in the rural areas of these provinces.

3.4. Estimation Results from the STIRPAT Model

Table 3 lists the results from the application of this STIRPAT model.
The coefficients of POP are significantly positive at 1% level in all the regions. This means that the population increase can induce more residential need and result in more carbon emissions. Along with the rapid urbanization, a large number of residents are migrating from rural areas to urban areas, which may cause higher housing CFs in urban areas.
The coefficients of FS are significantly negative at 1% level in urban areas of eastern and western regions, indicating that the shrinking family size leads to growth of housing CFs. The China’s seventh census shows that China’s average family size continued to downsize, from 3.10 in 2010 to 2.62 in 2020. Housing consumption is a household-based consumption and the shrinking family size will increase total households under a stable population scale, which may promote the expansion of the scale of housing consumption and boost related carbon emissions [30]. Meanwhile, the downsizing of each household may lead to the reduction of scale effect in housing consumption.
The coefficients of INC are significantly positive at 1% or 10% level in all rural areas. This is because urban residents and rural residents are at different income levels, leading to different household consumption structure and habits. In rural areas, the increased income of rural residents would lead to increased expenditure on housing consumption (e.g., purchase more appliances and change energy-consuming behaviors), and greater demand for energy consumption, which eventually may cause higher housing CFs. Compared to rural residents, Chinese urban residents have higher income which is enough to cover their housing consumption. Along with the increasing income, urban residents may have more interests in other consumptions rather than housing consumption This indicates that it is crucial to promote low carbon products and green consumption, such as encouraging energy efficient home appliances and clean energy application, especially in rural areas.
The coefficients of ECM2 are significantly positive at 1% level in all regions, indicating that energy efficiency level of residential buildings significantly affects the housing CF and that technological improvement has a strong impact on housing CF. In practice, this means that innovative measures, such as encouraging green building design, setting up national green building standards and renovating existing residential buildings, are effective on carbon emission mitigation.
The coefficients of ES are significantly positive in rural areas of eastern and central regions and both rural and urban areas of western region at 1% and 5% level, implying that a high proportion of coal consumption leads to a high housing CF. This is consistent with the conclusion of Shao et al. [38], in which they found that China’s high carbon energy structure impeded the reduction of its total carbon emission. Meanwhile, the coefficients of ES are totally insignificant in other areas, indicating that regional disparity should not be neglected in carbon mitigation policy. For instance, rural areas and western region should be the key areas of energy structure optimization.

4. Policy Implications

China’s CFs caused by housing consumption increased from 1201.6 Mt in 2012 to 1457.0 Mt in 2017. With China’s large population size and rapid economic growth, it is critical to prepare appropriate mitigation polices so that effective emissions reduction from housing consumption can be achieved. Considering the Chinese realities, especially regional disparities and urban-rural differences, several policy recommendations are proposed below.

4.1. Controlling Population Growth and Promoting Urbanization Benefits

The result shows that rapid growth of population and urbanization are significant factors leading to the increase of housing CF, while family size plays an important role in reducing the housing CF in urban areas. In this regard, the government should control the total population, encourage large households in urban areas [33], and promote the construction of compact cities with higher population densities [49]. However, before implementing these approaches, it is important to consider broader socio-economic consequences, e.g., labor source for rural areas, physical and mental health risks for highly urbanized communities, etc. [50]. Additionally, considering regional disparity, urbanization strategies should be adopted carefully by considering the local conditions. The eastern region, with the highest level of urbanization, should strengthen regional coordination and achieve a mutually beneficial regional model based on carbon mitigation cooperation [51]. Moreover, considering the urban-rural difference, it is of the same significance to promote integrated urban and rural development and implement rural revitalization strategy.

4.2. Encouraging Green Consumption

The result shows that income growth will significantly increase carbon emissions of housing consumption in rural areas. Income indirectly affects the level or compositions of consumption. Therefore, it is necessary to accelerate the decoupling of CFs of housing consumption from income growth through guiding residents to change their behaviors toward green consumption. Green consumption is a new type of consumption, which will reduce damage to the environment through moderate consumption control [52]. China’s national government should set up appropriate economic instruments to guide residents to change their consumption behaviors. In this regard, carbon and resource taxes are effective to internalize environmental externalities. Carbon cap and trade can also stimulate residents to involve in green consumption. Additionally, capacity-building programs should be enhanced to raise the general public’s awareness on green consumption and change their housing consumption behaviors so that they can fully engage in relevant mitigation efforts. Useful activities, including regular workshops, pamphlets, TV and radio promotions, and outdoor billboards, should be initiated to help increase residents’ awareness. Moreover, it is important to enhance the supply of green products, which requires support of low-carbon emission R & D, and the release of related energy efficiency standards so that more innovative low carbon technologies and products can be incubated and applied with competitive advantages in the market.

4.3. Optimizing Energy Structure

Since energy intensity of household consumption plays an important role in the CO2 emission reduction of housing consumption, it is necessary to improve energy efficiency and reduce CO2 emission intensity. Thus, one effective measure is to promote the application of clean and renewable energy. In this regard, it was proved to be effective to support the “Coal-to-Gas” and “coal-to-electricity” campaign that had achieved both environmental benefits and carbon emission reduction [53]. Meanwhile, financial subsides should be provided so that low income residents can afford the relatively higher costs of clean energy sources [54] and the construction of household renewable energy infrastructure (e.g., household photovoltaic power station and biogas digester [55,56]). Additionally, more efforts should be made by energy supply and production enterprises. For instance, heat supply companies should consider possible energy cascading opportunities because heating is one main source of housing CF, such as making full utilization of industrial waste heat and ground source heat pump [57]. According to the cases of Germany [58], American [59] and Poland [60], energy saving performance contract was proven to be effective in optimizing residential housing energy consumption structure and be beneficial for all the stakeholders.

4.4. Enhancing Residential Building Energy Management

The result shows that energy efficiency level of residential buildings significantly affects the housing CF, implying that building energy conservation measures, such as applying composite wall with high efficiency insulation materials, adding insulation to the roof and replacing with double glazing windows, especially in rural areas of eastern and western regions and urban area of central region, are effective on mitigating carbon emission. Additionally, considering the lack of statistics focusing on residential housing energy consumption, it is necessary to establish a residential building energy metering system at the community level so that data on building energy conservation and management efforts can be collected and analyzed. This work could be promoted along with the construction of low-carbon communities [49]. Meanwhile, the improvement of energy efficiency of residential buildings requires those housing products and services suppliers to initiate more efforts in this area. In particular, building materials have various environmental impacts [61], including but not limited to, fossil fuels consumption and global warming. Thus, it is necessary for building materials producers to consider the whole life cycle of buildings and their materials (including the extraction, processing, and transport of raw materials to building construction, use, and eventual demolition and waste) so that the costs and benefits from different phases can be understood and options can be identified to holistically improve the sustainability of the building materials value chain [62].

5. Conclusions

Rapid economic development and population increases have resulted in many environmental issues, such as global climate change. In order to address this issue, it is critical to account housing carbon footprint (CF) so that the key drivers on inducing higher carbon emissions can be uncovered. This study combines the IPCC emission accounting method, input-output analysis and one STIRPAT model to investigate the spatio-temporal patterns of housing CF and identify the driving factors of housing CF from the perspectives of urban-rural differences and regional disparities.
At a national level, the total housing CF increased from 1201.6 Mt in 2012 to 1457.0 Mt in 2017, of which the direct CF from housing energy use accounts for the majority. At the provincial level, Inner Mongolia, Liaoning and Heilongjiang maintained to be the top three provinces with the highest urban housing CFs. While, Ningxia, Qinghai and Hainan remained to be the top three provinces with the lowest urban housing CFs during 2012–2017. Also, rural housing CF obviously decreased from eastern region to western region. Further analysis indicates that regional disparities and urban-rural differences still existed during the study period.
The results of the extended STIRPAT model show that POP and ECM2 are the two dominant contributors to the housing CF increments in all areas. While, FS only shows significant negative impact in eastern and western regions, INC only induces higher housing CF in rural areas, and ES had a remarkable positive impact in urban area of western region and all rural areas.
These findings are valuable for preparing policy recommendations to mitigate the overall CF from housing consumption. Such recommendations include controlling population growth and promoting urbanization benefits, encouraging green consumption, optimizing energy structure and enhancing residential building energy management. These policies should be carefully adopted by considering the local conditions since different regions are facing different challenges.
This study provides a valuable case to other developing countries with similar challenges. Also, our method can help quantify the carbon emissions of housing consumption from the perspective of carbon footprint by using energy statistics and input-output tables, and to study how CF of housing consumption responds to different factors such as about population, affluence, and technology.
This study has certain limitations. The main limitation is that non-commercial energy sources, such as fuelwood, straw and biogas, are used for cooking or heating in rural areas [63]. Unfortunately, due to data in-availability, non-commercial energy consumption in rural areas is not considered. This study focuses on the impacts of economic and demographic factors, neglecting the impacts of climate, temperature, and other factors. Although these limitations do not significantly influence our results, we expect that these limitations can be overcome in the future studies so that more feasible findings can be found for preparing mitigation policies.
In general, research findings from this study can provide valuable insights to those decision-makers so that they can prepare more appropriate mitigation policies to reduce the overall CO2 emission from household consumption by considering their realities.

Supplementary Materials

The following are available online at https://www.mdpi.com/article/10.3390/en14133890/s1, Table S1: The average carbon dioxide emission factor of China’s regional power grid in 2012; Table S2: Eight consumption categories and their related sectors; Table S3: Descriptive Statistics; Table S4: Matrix of correlations; Table S5: Lower calorific values, oxidation rates and carbon content for various solid and liquid fuels; Table S6. Lower calorific values, oxidation rates and carbon content for various coals in different sectors; Table S7: Different proportion of raw coal in different sectors; Table S8: Proportion of heating in housing consumption carbon footprint at provincial level in 2012.

Author Contributions

This research was conceptualized by L.X. and Y.G.; L.X. and D.W. formulated the methodology. Software, D.W. and L.X.; validation, Y.G., C.Z. and S.X.; formal analysis, L.X.; writing—original draft preparation, L.X. and D.W.; writing—review and editing, Y.G. All authors have read and agreed to the published version of the manuscript.

Funding

This research was funded by the National Natural Science Foundation of China (720881010, 71810107001, 7169024).

Institutional Review Board Statement

Not applicable.

Informed Consent Statement

Not applicable.

Data Availability Statement

Publicly available datasets were analyzed in this study. This data can be found here: [https://www.ceads.net/data/province/] (accessed on 23 November 2020).

Acknowledgments

We acknowledge the support from the National Natural Science Foundation of China (720881010, 71810107001, 7169024). We also acknowledge the precious advice of the referees.

Conflicts of Interest

The authors declare no conflict of interest.

References

  1. Intergovernmental Panel on Climate Change (IPCC). Global Warming of 1.5 °C.; Intergovernmental Panel on Climate Change (IPCC): Geneva, Switzerland, 2018. [Google Scholar]
  2. BP Statistical Review of World Energy. 2020. Available online: https://www.bp.com/en/global/corporate/news-and-insights/press-releases/bp-statistical-review-of-world-energy-2020-published.html (accessed on 23 November 2020).
  3. Xinhua News Agency. President Xi Delivered an Important Speech during the General Debate of the 75th Session of the United Nations General Assembly. Available online: http://www.gov.cn/xinwen/2020-09/22/content_5546168.htm?gov (accessed on 23 November 2020).
  4. Wiedenhofer, D.; Guan, D.; Liu, Z.; Meng, J.; Zhang, N.; Wei, Y.M. Unequal household carbon footprints in China. Nat. Clim. Chang. 2017, 7, 75–80. [Google Scholar] [CrossRef] [Green Version]
  5. Cao, Q.; Kang, W.; Xu, S.; Sajid, M.J.; Cao, M. Estimation and decomposition analysis of carbon emissions from the entire production cycle for Chinese household consumption. J. Environ. Manag. 2019, 247, 525–537. [Google Scholar] [CrossRef] [PubMed]
  6. Hertwich, E.G.; Peters, G.P. Carbon footprint of nations: A global, trade-linked analysis. Environ. Sci. Technol. 2009, 43, 6414–6420. [Google Scholar] [CrossRef] [PubMed] [Green Version]
  7. Tian, X.; Geng, Y.; Dong, H.; Dong, L.; Fujita, T.; Wang, Y.; Zhao, H.; Wu, R.; Liu, Z.; Sun, L. Regional household carbon footprint in China: A case of Liaoning province. J. Clean. Prod. 2016, 114, 401–411. [Google Scholar] [CrossRef]
  8. Shi, S.; Yin, J. Global research on carbon footprint: A scientometric review. Environ. Impact Assess. Rev. 2021, 89, 106571. [Google Scholar] [CrossRef]
  9. Qu, J.; Liu, L.; Zeng, J.; Zhang, Z.; Pei, H.; Dong, L.; Liao, Q. Household CO2 emissions: An assessment based a large sample survey in China. Kexue Tongbao Chin. Sci. Bull. 2018, 63, 547–557. [Google Scholar] [CrossRef]
  10. Bin, S.; Dowlatabadi, H. Consumer lifestyle approach to US energy use and the related CO2 emissions. Energy Policy 2005, 33, 197–208. [Google Scholar] [CrossRef]
  11. Jesper, M.; KlausAlsted, P.; Mette, W. Impact of household consumption on CO2 emissions. Energy Econ. 2000, 22, 423–440. [Google Scholar]
  12. Yang, T.; Liu, W. Inequality of household carbon emissions and its influencing factors: Case study of urban China. Habitat Int. 2017, 70, 61–71. [Google Scholar] [CrossRef]
  13. Liu, X.; Wang, X.; Song, J.; Duan, H.; Wang, S. Why are the carbon footprints of China’s urban households rising? An input-output analysis and structural decomposition analysis. Sustainability 2019, 11, 7157. [Google Scholar] [CrossRef] [Green Version]
  14. Ottelin, J.; Heinonen, J.; Nässén, J.; Junnila, S. Household carbon footprint patterns by the degree of urbanisation in Europe. Environ. Res. Lett. 2019, 14, 114016. [Google Scholar] [CrossRef] [Green Version]
  15. National Bureau of Statistics (NBS). Explanation of Residential Housing Consumption. Available online: http://www.stats.gov.cn/tjsj/zbjs/201912/t20191202_1713055.html (accessed on 2 December 2019).
  16. Tsinghua University Building Energy Research Centre. China Building Energy Use 2020; China Architecture & Building Press: Beijing, China, 2020. [Google Scholar]
  17. Zhou, Q.; Zhang, X.; Chen, J.; Zhang, Y. Do double-edged swords cut both ways? Housing inequality and haze pollution in Chinese cities. Sci. Total Environ. 2020, 719, 137404. [Google Scholar] [CrossRef] [PubMed]
  18. Wang, Q. Study on building energy consumption statistic and calculation in China. Energy Sav. Environ. Prot. 2007, 8, 9–10. (In Chinese) [Google Scholar]
  19. Huo, T.; Ren, H.; Zhang, X.; Cai, W.; Feng, W.; Zhou, N.; Wang, X. China’s energy consumption in the building sector: A Statistical Yearbook-Energy Balance Sheet based splitting method. J. Clean. Prod. 2018, 185, 665–679. [Google Scholar] [CrossRef]
  20. Tsinghua University Building Energy Research Centre. China Building Energy Use 2008; China Architecture & Building Press: Beijing, China, 2008. [Google Scholar]
  21. Zhang, Y.; Yan, D.; Hu, S.; Guo, S. Modelling of energy consumption and carbon emission from the building construction sector in China, a process-based LCA approach. Energy Policy 2019, 134, 110949. [Google Scholar] [CrossRef]
  22. Wang, Y.; Yang, G.; Dong, Y.; Cheng, Y.; Shang, P. The scale, structure and influencing factors of total carbon emissions from households in 30 provinces of China-based on the extended STIRPAT model. Energies 2018, 11, 1125. [Google Scholar] [CrossRef] [Green Version]
  23. Ehrlich, P.R.; Holdren, J.P. Impact of population growth. Science 1971, 171, 1212–1217. [Google Scholar] [CrossRef] [PubMed]
  24. Dietz, T.; Rosa, E.A. Effects of population and affluence on CO2 emissions. Proc. Natl. Acad. Sci. USA 1997, 94, 175–179. [Google Scholar] [CrossRef] [Green Version]
  25. York, R.; Rosa, E.A.; Dietz, T. STIRPAT, IPAT and ImPACT: Analytic tools for unpacking the driving forces of environmental impacts. Ecol. Econ. 2003, 46, 351–365. [Google Scholar] [CrossRef]
  26. Dong, F.; Yu, B.; Hua, Y.; Zhang, S.; Wang, Y. A comparative analysis of residential energy consumption in urban and rural China: Determinants and regional disparities. Int. J. Environ. Res. Public Health 2018, 15, 2507. [Google Scholar] [CrossRef] [Green Version]
  27. Fu, B.; Wu, M.; Che, Y.; Wang, M.; Huang, Y.; Bai, Y. The strategy of a low-carbon economy based on the STIRPAT and SD models. Acta Ecol. Sin. 2015, 35, 76–82. [Google Scholar] [CrossRef]
  28. Wang, P.; Wu, W.; Zhu, B.; Wei, Y. Examining the impact factors of energy-related CO2 emissions using the STIRPAT model in Guangdong Province, China. Appl. Energy 2013, 106, 65–71. [Google Scholar] [CrossRef]
  29. Liddle, B.; Lung, S. Age-structure, urbanization, and climate change in developed countries: Revisiting STIRPAT for disaggregated population and consumption-related environmental impacts. Popul. Environ. 2010, 31, 317–343. [Google Scholar] [CrossRef] [Green Version]
  30. Yang, Y.; Zhao, T.; Wang, Y.; Shi, Z. Research on impacts of population-related factors on carbon emissions in Beijing from 1984 to 2012. Environ. Impact Assess. Rev. 2015, 55, 45–53. [Google Scholar] [CrossRef]
  31. Yao, J.; Liu, L.; Yuan, Y. Growth of carbon footprint of Chinese household consumption during the recent two decades and its future trends. Acta Sci. Circumstantiae 2017, 37, 2403–2408. [Google Scholar]
  32. Dong, H.; Geng, Y. Study on Carbon Footprint of the Household Consumption in Beijing Based on Input-Output Analysis. Resour. Sci. 2013, 34, 494–501. (In Chinese) [Google Scholar]
  33. Wei, Y.M.; Liu, L.C.; Fan, Y.; Wu, G. The impact of lifestyle on energy use and CO2 emission: An empirical analysis of China’s residents. Energy Policy 2007, 35, 247–257. [Google Scholar] [CrossRef]
  34. Intergovernmental Panel on Climate Change (IPCC). Guidelines for National Greenhouse Gas Inventories; Intergovernmental Panel on Climate Change (IPCC): Geneva, Switzerland, 2006. [Google Scholar]
  35. National Development and Reform Commission (NDRC). The Average Carbon Dioxide Emission Factor of China’s Regional Power Grid in 2011 and 2012; NDRC: Beijing, China, 2014. Available online: http://www.tanpaifang.com/tanjiliang/2014/0928/38588.html (accessed on 23 November 2020).
  36. Cohen, C.; Lenzen, M.; Schaeffer, R. Energy requirements of households in Brazil. Energy Policy 2005, 33, 555–562. [Google Scholar] [CrossRef]
  37. Mi, Z.; Meng, J.; Green, F.; Coffman, D.M.; Guan, D. China’s “exported carbon” peak: Patterns, drivers, and implications. Geophys. Res. Lett. 2018, 45, 4309–4318. [Google Scholar] [CrossRef] [Green Version]
  38. Shao, S.; Zhang, K.; Dou, J. Effects of economic agglomeration on energy saving and emission reduction: Theory and empirical evidence from China. Manag. World 2019, 35, 36–60+233. [Google Scholar] [CrossRef]
  39. Zhao, C.; Chen, B.; Hayat, T.; Alsaedi, A.; Ahmad, B. Driving force analysis of water footprint change based on extended STIRPAT model. Ecol. Indic. 2014, 47, 43–49. [Google Scholar] [CrossRef]
  40. Zhang, S.; Zhao, T. Identifying major influencing factors of CO2 emissions in China: Regional disparities analysis based on STIRPAT model from 1996 to 2015. Atmos. Environ. 2019, 207, 136–147. [Google Scholar] [CrossRef]
  41. Liu, D.; Bowen, X. Can China achieve its carbon emission peaking? A scenario analysis based on STIRPAT and system dynamics model. Ecol. Indic. 2018, 93, 647–657. [Google Scholar] [CrossRef]
  42. National Development and Reform Commission (NDRC). The People’s Republic of China National Greenhouse Gas Inventory 2005; China Architecture & Building Press: Beijing, China, 2014.
  43. National Government Office Administrations. Statistical System of Energy and Resource Consumption of Public Institutions. Available online: http://www.ggj.gov.cn/2017stop/ggjgjn/ggjgjnzwgk/ggjgjntzgg/201207/t20120710_12055.htm (accessed on 23 November 2020).
  44. Shan, Y.; Guan, D.; Zheng, H.; Ou, J.; Li, Y.; Meng, J.; Mi, Z.; Liu, Z.; Zhang, Q. China CO2 emission accounts 1997-2015. Sci. Data 2018, 5, 170201. [Google Scholar] [CrossRef] [Green Version]
  45. Shan, Y.; Liu, J.; Liu, Z.; Xu, X.; Shao, S.; Wang, P.; Guan, D. New provincial CO2 emission inventories in China based on apparent energy consumption data and updated emission factors. Appl. Energy 2016, 184, 742–750. [Google Scholar] [CrossRef] [Green Version]
  46. Shan, Y.; Huang, Q.; Guan, D.; Hubacek, K. China CO2 emission accounts 2016–2017. Sci. Data 2020, 7, 54. [Google Scholar] [CrossRef] [Green Version]
  47. National Bureau of Statistics (NBS). China Statistical Yearbook, 2013–2018; China Statistics Press: Beijing, China, 2013–2018.
  48. Liu, J.; Zhao, D.; Liu, S. Research on The Acquisition Method of Actual Building Area Data of Civil Buildings. Build. Sci. 2020, 36, 352–359. (In Chinese) [Google Scholar]
  49. National Development and Reform Commission (NDRC). Notice on the Implementation of Low-Carbon Community Pilot Work. Available online: http://www.gov.cn/xinwen/2014-03/27/content_2648003.htm (accessed on 21 March 2021).
  50. Brock, P.M.; Tan, D.K.Y. A second-take on the role of science: The case for applying public administration theory to natural resource management. Sustain. Earth 2020, 3, 1–12. [Google Scholar] [CrossRef] [Green Version]
  51. Li, L.; Cai, Y.; Liu, L. Research on the Effect of Urbanization on China’s Carbon Emission Efficiency. Sustainability 2020, 12, 163. [Google Scholar] [CrossRef] [Green Version]
  52. Gilg, A.; Barr, S.; Ford, N. Green consumption or sustainable lifestyles? Identifying the sustainable consumer. Futures 2005, 37, 481–504. [Google Scholar] [CrossRef]
  53. Chen, H.; Chen, W. Potential impact of shifting coal to gas and electricity for building sectors in 28 major northern cities of China. Appl. Energy 2019, 236, 1049–1061. [Google Scholar] [CrossRef]
  54. Lin, B.; Wang, Y. Does energy poverty really exist in China? From the perspective of residential electricity consumption. Energy Policy 2020, 143, 111557. [Google Scholar] [CrossRef]
  55. Ministry of Housing and Urban-Rural. Development of the People’s Republic of China the 13th Five-Year Plan for Building Energy Conservation and Green Building Development. Available online: http://www.mohurd.gov.cn/wjfb/201703/t20170314_230978.html (accessed on 19 June 2021).
  56. DGRV Energy Cooperatives in Germany: State of the Sector 2020 Report. Available online: https://www.dgrv.de/wp-content/uploads/2020/07/20200708_State-of-the-sector-2020.pdf (accessed on 19 June 2021).
  57. Geng, Y.; Sarkis, J.; Wang, X.; Zhao, H.; Zhong, Y. Regional application of ground source heat pump in China: A case of Shenyang. Renew. Sustain. Energy Rev. 2013, 18, 95–102. [Google Scholar] [CrossRef]
  58. Weber, I.; Wolff, A. Energy efficiency retrofits in the residential sector―Analysing tenants’ cost burden in a German field study. Energy Policy 2018, 122, 680–688. [Google Scholar] [CrossRef]
  59. Barron, M. Going Green in DENVER. J. Hous. Community Dev. 2007, 64, 31–33. [Google Scholar]
  60. Lv, S.; Wu, Y.; Sun, J. Pattern analysis and suggestion of energy efficiency retrofit for existing residential buildings in China’s northern heating region. Energy Policy 2009, 37, 2102–2105. [Google Scholar] [CrossRef]
  61. Green Building Council of Australia. Materials Life Cyclxe Impacts. Available online: https://www.gbca.org.au/uploads/78/34894/Materials_Life_Cycle%20Impacts_FINAL_JUNE2014.pdf?_ga=2.241576834.1644031882.1624265622-1696645875.1624162153 (accessed on 21 June 2021).
  62. Huang, B.; Gao, X.; Xu, X.; Song, J.; Geng, Y.; Sarkis, J.; Fishman, T.; Kua, H.; Nakatani, J. A life cycle thinking framework to mitigate the environmental impact of building materials. One Earth 2020, 3, 564–573. [Google Scholar] [CrossRef]
  63. Tao, S.; Ru, M.Y.; Du, W.; Zhu, X.; Zhong, Q.R.; Li, B.G.; Shen, G.F.; Pan, X.L.; Meng, W.J.; Chen, Y.L.; et al. Quantifying the rural residential energy transition in China from 1992 to 2012 through a representative national survey. Nat. Energy 2018, 3, 567–573. [Google Scholar] [CrossRef]
Figure 1. Accounting boundary of carbon footprint of housing consumption in this research.
Energies 14 03890 g001
Figure 2. Regional divisions of 30 Chinese provinces.
Energies 14 03890 g002
Figure 3. China’s total CFs of housing consumption in urban and rural areas for 2012–2017.
Energies 14 03890 g003
Figure 4. China’s per capita CFs of housing consumption in urban and rural areas for 2012–2017.
Energies 14 03890 g004
Figure 5. China’s provincial total CFs of housing consumption for years 2012 and 2017 Note: Provinces with more than 60 million tones total CFs of housing consumption have the same color.
Energies 14 03890 g005
Figure 6. China’s provincial per capita CFs of housing consumption in 2012 and 2017 Note: Provinces with per capita CF of housing consumption of more than 3 tones CO2 have the same color.
Energies 14 03890 g006
Table 1. Variance inflation factors.
VariablesVIF
ln INC2.219
ln ES1.742
ln ECM21.507
ln FS1.440
ln POP1.239
Mean VIF1.629
Table 2. Description of variables used in this study.
VariablesVariables ExplanationUnitData Sources
Population
(POP)
Provincial resident population Scale104 personsChina Statistical Yearbook
Family size
(FS)
Population divided by total number of households.Persons of per householdChina Population and Employment Statistics Yearbook
Income
(INC)
Per capita disposable incomeYuanChina Statistical Yearbook
Energy consumption per unit building area
(ECM2) 1
Energy consumption for operation of residential building divided by residential building floor areastce/m2China Energy Statistical Yearbook,
China Rural Statistical Yearbook,
China Urban-Rural Construction Statistical Yearbook
Energy Structure
(ES)
The share of coal in total household energy consumption%China Energy Statistical Yearbook
1 The accounting method of residential building areas refers to the research of Liu et al. [48].
Table 3. Modelling results in urban and rural areas at regional level.
Eastern RegionCentral RegionWestern Region
UrbanRuralUrbanRuralUrbanRural
VARIABLESln CFln CFln CFln CFln CFln CF
ln POP0.940 ***1.065 ***0.920 ***1.075 ***0.832 ***0.971 ***
(0.043)(0.030)(0.064)(0.068)(0.082)(0.031)
ln FS−1.235 ***0.129−0.0530.243−4.361 ***−0.298
(0.414)(0.222)(0.219)(0.416)(0.767)(0.184)
ln INC−0.0480.705 ***−0.0610.160 *0.9670.282 ***
(0.151)(0.103)(0.109)(0.152)(0.338)(0.072)
ln ECM20.528 ***0.654 ***0.949 ***0.507 ***0.377 ***0.936 ***
(0.079)(0.099)(0.048)(0.089)(0.120)(0.055)
ln ES0.0250.072 ***−0.0250.195 **0.088 **0.097 ***
(0.020)(0.025)(0.027)(0.079)(0.040)(0.018)
Constant−3.547 *−13.293 ***−5.679 ***−8.126 ***−9.101 ***−8.810 ***
(1.969)(1.182)(1.086)(1.498)(2.935)(0.758)
Observations666648486666
R-squared0.9110.9630.9400.8610.7810.971
Figures in parentheses are progressive t statistics. *, **, *** denote statistical significance levels at 10%, 5% and 1%, respectively.
Publisher’s Note: MDPI stays neutral with regard to jurisdictional claims in published maps and institutional affiliations.

