Article

Demonstration of a Top-Lit Updraft Based Pyrolytic Burner with Low Emission Operation and Automatic Process Control

by
Dennis Krüger
* and
Özge Çepelioğullar Mutlu
Department of Thermo-Chemical Conversion, DBFZ Deutsches Biomasseforschungszentrum Gemeinnützige GmbH, Torgauer Straße 116, 04347 Leipzig, Germany
*
Author to whom correspondence should be addressed.
Energies 2021, 14(13), 3913; https://doi.org/10.3390/en14133913
Submission received: 4 May 2021 / Revised: 10 June 2021 / Accepted: 22 June 2021 / Published: 30 June 2021
(This article belongs to the Section A4: Bio-Energy)

Abstract

:
In this study, a small-scale (4.7 kWfuel) biomass burner based on “top-lit updraft” (TLUD) technology with automatic process control was developed for process heat generation. The combustion experiments were performed using wood pellets to gain more insights on the process, its repeatability and the behaviors of the emitted gaseous and particulate emissions under different combustion phases. The emission values were compared with similar small-scale combustion technologies as well as the emission limits defined in official regulations. The results showed that the average emissions (based on standardized 13 vol. % O2 content in the dry flue gas (STP)) over the entire process from start-up to switch-off were 29.4 mg/m3 for CO, 80 mg/m3 for NOx, and 3.6 mg/m3 for total particle matter (TPM) measured within the hot gas. These results were below the official limits for wood-fueled small-scale systems. The developed process control approach resulted in very low residual O2 content in the flue gas (approx. 2 vol. %), high flue gas temperatures and repetition accuracy. Thus, the process offers potential for further development in terms of process control, scale-up, and application in different areas.

1. Introduction

Thermo-chemical conversion is the most common and developed technology in which biomass can be utilized as fuel to produce useful energy (i.e., heat or electricity) or energy carriers (i.e., charcoal, bio-oil, gas) from small-medium to large scale industrial activities as well as space heating or cooking [1]. However, traditional combustion systems are known as the source of particulate matter (PM) and gaseous emissions including CO, NOx, SOx polycyclic aromatic hydrocarbons (PAH), and volatile organic compounds (VOC). PM emitted from biomass combustion systems account for 20% of global urban PM emissions [2]. They can be relatively higher compared to liquid and gaseous fueled systems and depend on the type of selected fuel, the design, and the capacity of the combustion unit [3,4]. Due to their chemical/physical properties, PM suspensions can accumulate in the air [5]. Exposure to these resulting emissions has a negative impact on human health in the long-term [6]. Moreover, in small-scale appliances which are mostly based on natural draft and operated as batch or semi-continuous, the emissions as a result of incomplete combustion of biomass is one of the disadvantages compared to fossil fuel-based combustion [7]. Thus, the development of biomass combustion systems with lower emissions to meet social and economic development and improve human welfare and health become even more critical in addition to the environmental issues [6,8,9].
In the selection and design of any biomass combustion system, many aspects have to be considered such as characteristics of the selected fuel, the required capacity, economic aspects in addition to environmental regulations [7]. Over time, due to continuous progress in the biomass heating technology market, small and medium-scale combustion technologies have started competing with existing oil/gas heating systems, especially after the introduction of modern appliances in countries like Germany, Sweden, Austria, Switzerland, and Italy [10]. Still, the countries have to take serious actions to limit the emissions resulting from biomass combustion by bringing standards to ensure more reliable and healthier operations. To lower the emitted emissions under the steady-state full-load operational mode, not only operational parameters but also the combustion technique play an important role [11]. Therefore, it is important to test the effects of start-up and burn-out phases, partial or lower loads of combustion to get an insight into the real-life emissions which are higher than the test emissions under laboratory conditions [12]. There are several studies in which different operational loads (i.e., nominal, partial, low, half, etc.) or modes (i.e., continuous, intermittent, batch, etc.) were also considered. For instance, behaviors and characteristics of emitted PM and gaseous emissions from automatically and manually fed combustion appliances at start-up, full load, partial load conditions [11], small-scale staged batch biomass combustor [13], continuous and intermittent operational modes of residential pellet stoves [12], nominal and partial loaded pellet burner [14], residential wood combustion devices under optimum, excess and lack of O2 as well as a partial load, first load (cold start, flaming, burn-out) re-loads (warm start, flaming, burn-out) [15], a modern small-scale pellet boiler under different air-staging settings and load operations [16], small-scale pellet and wood chip furnaces as well as a logwood furnace under full and partial loads [17] within the capacity range of 6–150 kW were discussed in the literature.
This paper demonstrates the combustion process in a newly developed automatic mode pyrolytic biomass burner. This burner can be classified as “top-lit updraft (TLUD)” based on the combustion type [18,19,20]. Further details of TLUD gasifiers can be found somewhere else [21,22,23]. Briefly, in this technology, the fuel is ignited from the top using a fire starter and begins to burn by releasing gases. Primary air flows upwards within the combustion chamber, while black char starts to accumulate at the top and hot pyrolytic front moves downward through the solid mass of raw biomass by converting it into char. Once the combustion of the pyrolytic gases is completed, the yellow flame turns to blue indicating that the so-called “char burn” phase starts. At the end of the process, remaining char with higher calorific value can be utilized in different applications such as fuel in cookstoves to reduce indoor air pollution and deforestation or as soil enhancers in soil applications to improve soil pH, nutrient availability, moisture, and organic matter [24]. TLUD gasifier is mostly used for cooking purposes in many parts of the world and is known for its ability to release lower emissions and PMs as well as being fuel-flexible [8]. The TLUD process is usually ending after the pyrolysis of the fuel for char production. In contrast to this, in this work the char produced within the process is gasified and burned directly for additional heat generation. The motivation of this study underlies the demonstration of automatic mode biomass burner with improved combustion characteristics by lowering the emissions not only for the steady-state phase but also for start-up, pyrolysis, transition, and char-burn phases in comparison to similar existing technologies and environmental regulations. The results are important not only to show the repeatability of such technology but also to gain more insights about the process and its further application areas.

2. Objectives

In this study, the combustion process was carried out using a TLUD-based pyrolytic biomass burner. The focus was given to the demonstration of stable system behavior, repeatability of the combustion process along with the characterization of the emitted pollutants under different combustion phases including start-up, pyrolysis phase, and char-burn phase by adjusting an implemented auto-switch-off function. The auto-switch-off function ends the process automatically based on sensor data. The results were compared with similar existing technologies as well as official emission regulations.

3. Materials and Methods

3.1. Fuel

In the combustion tests, 6 mm wood pellets with a quality of ENplus A1 based on ISO 17225-2:2014 [25] were used as fuel while ethanol gel was used to start the ignition. Considering that ethanol gel does not soot-like lighters with wax, it did not interfere with the measurements, especially during PM measurements. For each run, approximately 900 g (±0.1 g) of fuel was used together with 9.2–11.8 g of igniter gel. The properties of the wood pellets were summarized in Table 1. The same fuel which was homogenously mixed was used in all experiments and analysis.

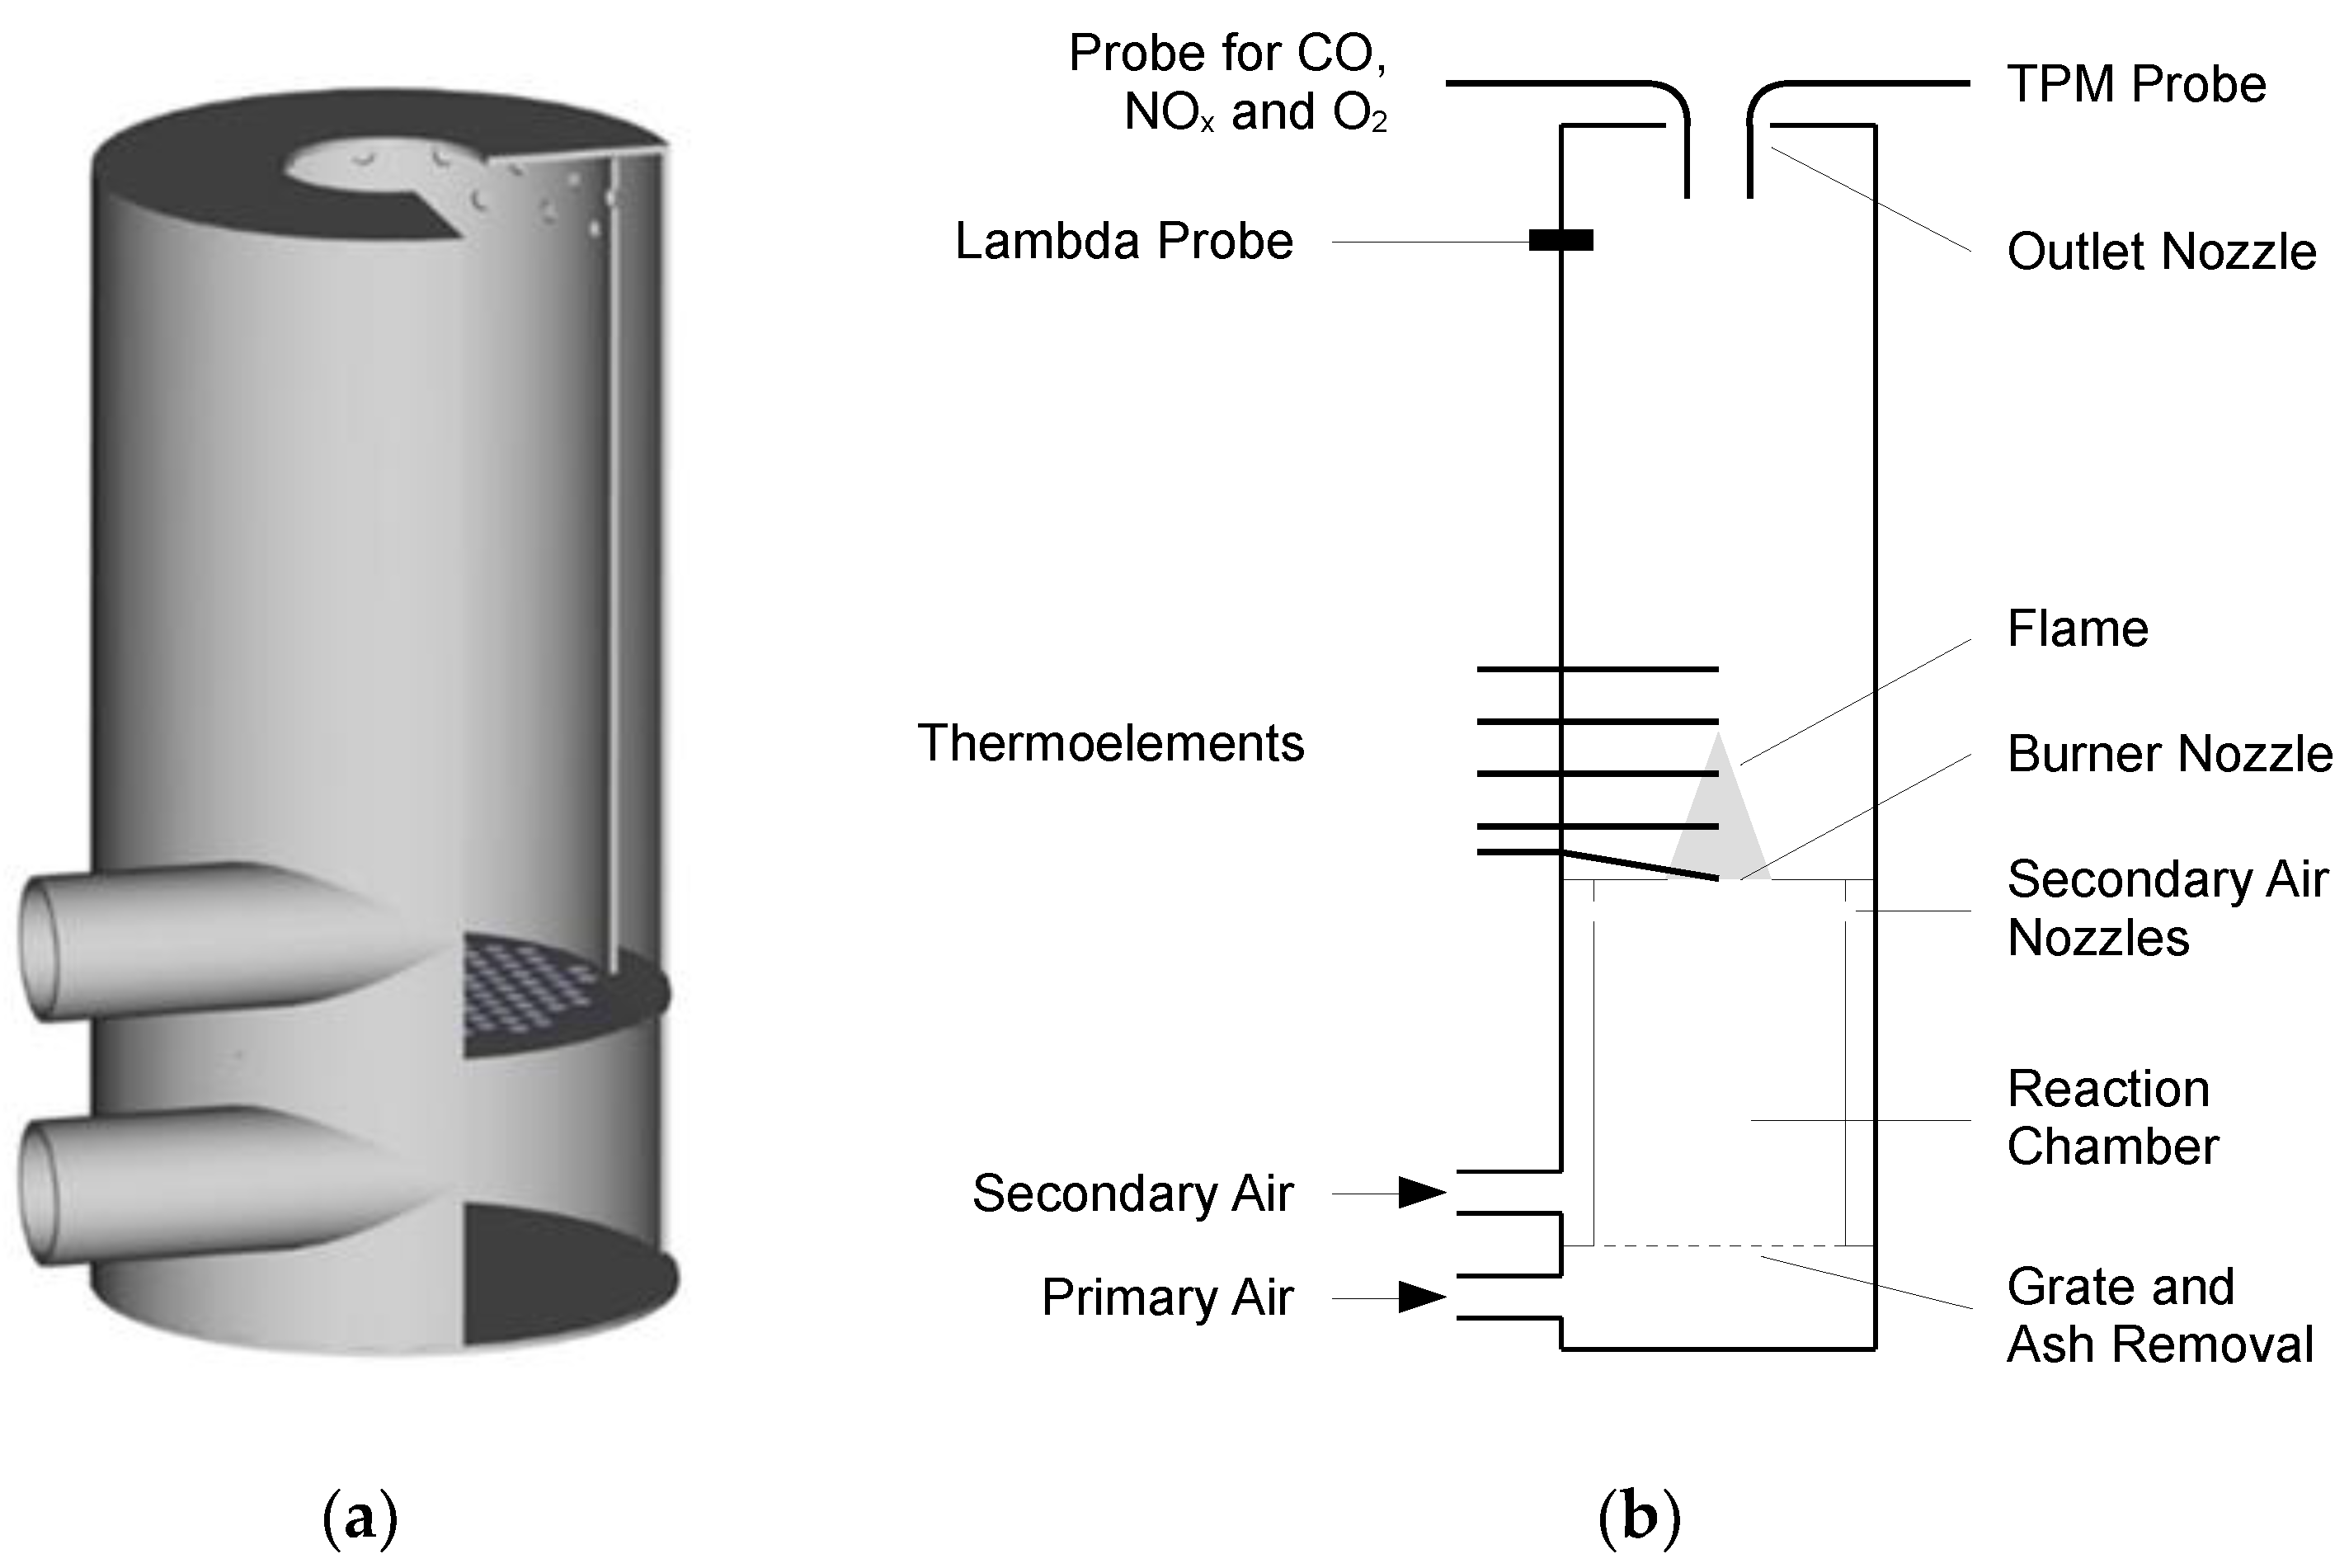
3.2. Experimental Set-Up

The experimental set-up, displayed schematically in Figure 1, consists of five separable components; the ash container with primary air supply, the grate with ash slide, the reaction chamber with secondary air supply, the burner nozzle, and the flue gas system with outlet nozzle. All parts of the testbed are uninsulated. The reaction chamber has an inside diameter of 11 cm. The height between the grate and the secondary air openings is 18 cm, which corresponds to the maximum fill height.
The biomass fuel is placed on a fixed-bed grate with an ash slide in the reaction chamber in which the primary air flows causing pyrolysis and partially gasification of the fuel. The produced pyrolysis gas leaves the bed from the top. The secondary air is preheated by the flow around the reaction chamber and enters the reaction chamber above the fixed-bed. The combustion of the pyrolysis gases begins directly once the secondary air is introduced and forms a flame above the burner nozzle. The flue gas produced during the combustion passes through a flue gas measuring section containing a wideband lambda probe for controlling the combustion process. The outlet nozzle enables to prevent air from entering the flue gas line caused by backflows since both the flue gas composition and the particle measurement are carried out directly by probes via the upper outlet opening. Both the primary and the secondary air flows are controlled by a 40 mm fan with a calibrated downstream air mass sensor to regulate the air mass flows. The flue gas is extracted after exiting the flue gas measuring section.
Within the experimental set-up, sensors for the acquisition as well as actuators, listed in Table 2, are used to manipulate the system status along with the measuring devices to record the emissions. The temperature measurement is carried out with five thermocouples. The first one is located at the level of the burner nozzle whereas the other thermocouples are located every 10 cm upwards within the measurement section of the set-up. CO and NOx emissions, as well as the O2 content in the flue gas, are measured according to EN 15267-1:2009 [26], EN 15267-2:2009 [27], and EN 15267-4:2017 [28].
In addition to the calibration of the gas analyzer with calibration gas, due to the very low levels of CO and O2 in the flue gas, the calibration is also carried out with N2 5.0 with a purity of min. 99.999 according to ISO 14175:2008 [29] as zero-point gas. The particle measurement in the flue gas is performed based on EN 13284-1:2017 [30]. Due to the design of the experimental set-up, the particle measurement is carried out with a fixed volume flow instead of an isokinetic sampling method. For the start-up (Ph. 1), pyrolysis (Ph. 2), and char-burn (Ph. 4), the sampling duration is less than 30 min due to the filter change and the short duration of the phase. For the particle measurement, micro quartz fiber filters of the MK 360 type from Munktell Ahlstrom (Helsinki, Finland) are used in connection with the ITES from Paul Gothe GmbH (Bochum, Germany) with a separation rate of 99.998% at a particle size of 0.3 µm [31]. In addition to the particle mass on the filter, the particle measuring probe is also rinsed with distilled water and acetone according to EN 13284-1:2017 [30], and the particle mass dissolved in the solvent is weighed. The total particulate matter (TPM) value given in this paper relates to the sum of two proportions; the particle mass collected on the filter and the mass of residual particles obtained from the rinsing of the dust measuring probe for the overall process (Ph. 7). For the particle measurements of Ph. 1, Ph. 2, and Ph. 4, the measurement probe is rinsed once at the end of each experiment. The particle mass obtained from the rinsing is divided according to the proportion of the particle mass on the respective filters.

3.3. Combustion Test Procedure

After deashing using the ash slide, the fuel was filled into the reaction chamber by removing the burner nozzle and the measurement section of flue gas. The system was controlled automatically during the overall process via the measurement and control technology of the system. To start the process, the ethanol gel was added as a lighter, and the batch-operated burner was ignited manually. The burner nozzle and the flue gas measuring section were then attached, and the probes for flue gas and particle measurement were inserted into the outlet nozzle. The measurements started with a delay of ~10 s due to the manually controlled burner design. The combustion was controlled depending on the O2 content in the moist flue gas which was measured by the lambda probe, as well as the ratio of secondary to primary air. The O2 value was kept constant during the process with the regulation of the secondary air. At the beginning of the combustion process, the ratio of secondary to primary air was 0.9 and the air mass flow related to the cross-sectional area of the reactor chamber was 2.5 kg/(m2 min). In case the O2 content in the moist flue gas fell down below 15 vol. %, it was reduced linearly to the target content of 2 vol. % within 780 s. Since the O2 content in the flue gas would drop significantly faster, only the secondary air had to be increased carefully to set the desired O2 concentration. Once the target O2 content of 2 vol. % was achieved, it was kept constant by regulating the secondary air until the end of the process. At the end of pyrolysis, the need for secondary air dropped significantly. In case the ratio of secondary to primary air fell down below 2.7, the primary air mass flow was increased linearly to double within 60 s to enable a transition from pyrolysis to char-burn phase. At the beginning of the char-burn phase, the secondary air requirement increased above the value of the primary air requirement under the set parameters. The auto-switch-off criterion at the test-bed was achieved when the ratio of secondary air to primary air exceeded the value 1 for at least 120 s and then fell below this value again. Following that the fans for the primary and secondary air were switched off and the air inlet openings and flue gas outlet were closed manually after removing the measurement probes of flue gas and particle measurement.
The overall combustion process consists of five phases; start-up (Ph. 1), pyrolysis (Ph. 2), a transition from pyrolysis to char-burn (Ph. 3), char-burn (Ph. 4), and burn-out (Ph. 5). Ph. 6 was defined for the measurement values during the overall process without the start-up. The measurement values for the overall process from ignition to auto-switch-off were defined as Ph. 7. A total of six experiments were carried out to demonstrate the combustion behaviors of the developed system in terms of emitted emissions and the repeatability of the experimental tests. These were carried out one after the other. In the first two experiments, the system’s auto-switch-off function was deactivated. In case the reaction came to an end, it was manually switched off based on the CO values in the flue gas. During these tests, the particulate matter measurement was carried out over the start-up (Ph. 1), the pyrolysis phase (Ph. 2) and the char-burn phase (Ph. 4). In the last four experiments, the auto-switch-off function was activated and the particle measurement was carried out over the entire process. For the first two experiments with deactivated auto-switch-off function, the switch-off point could be identified in the sensor data, so that emission values could be calculated also for these experiments that are marked with (*) in the results. All specified emissions in the paper are given in mg/m3 (STP) standardized on 13 vol. % O2 content in the dry flue gas.

4. Results

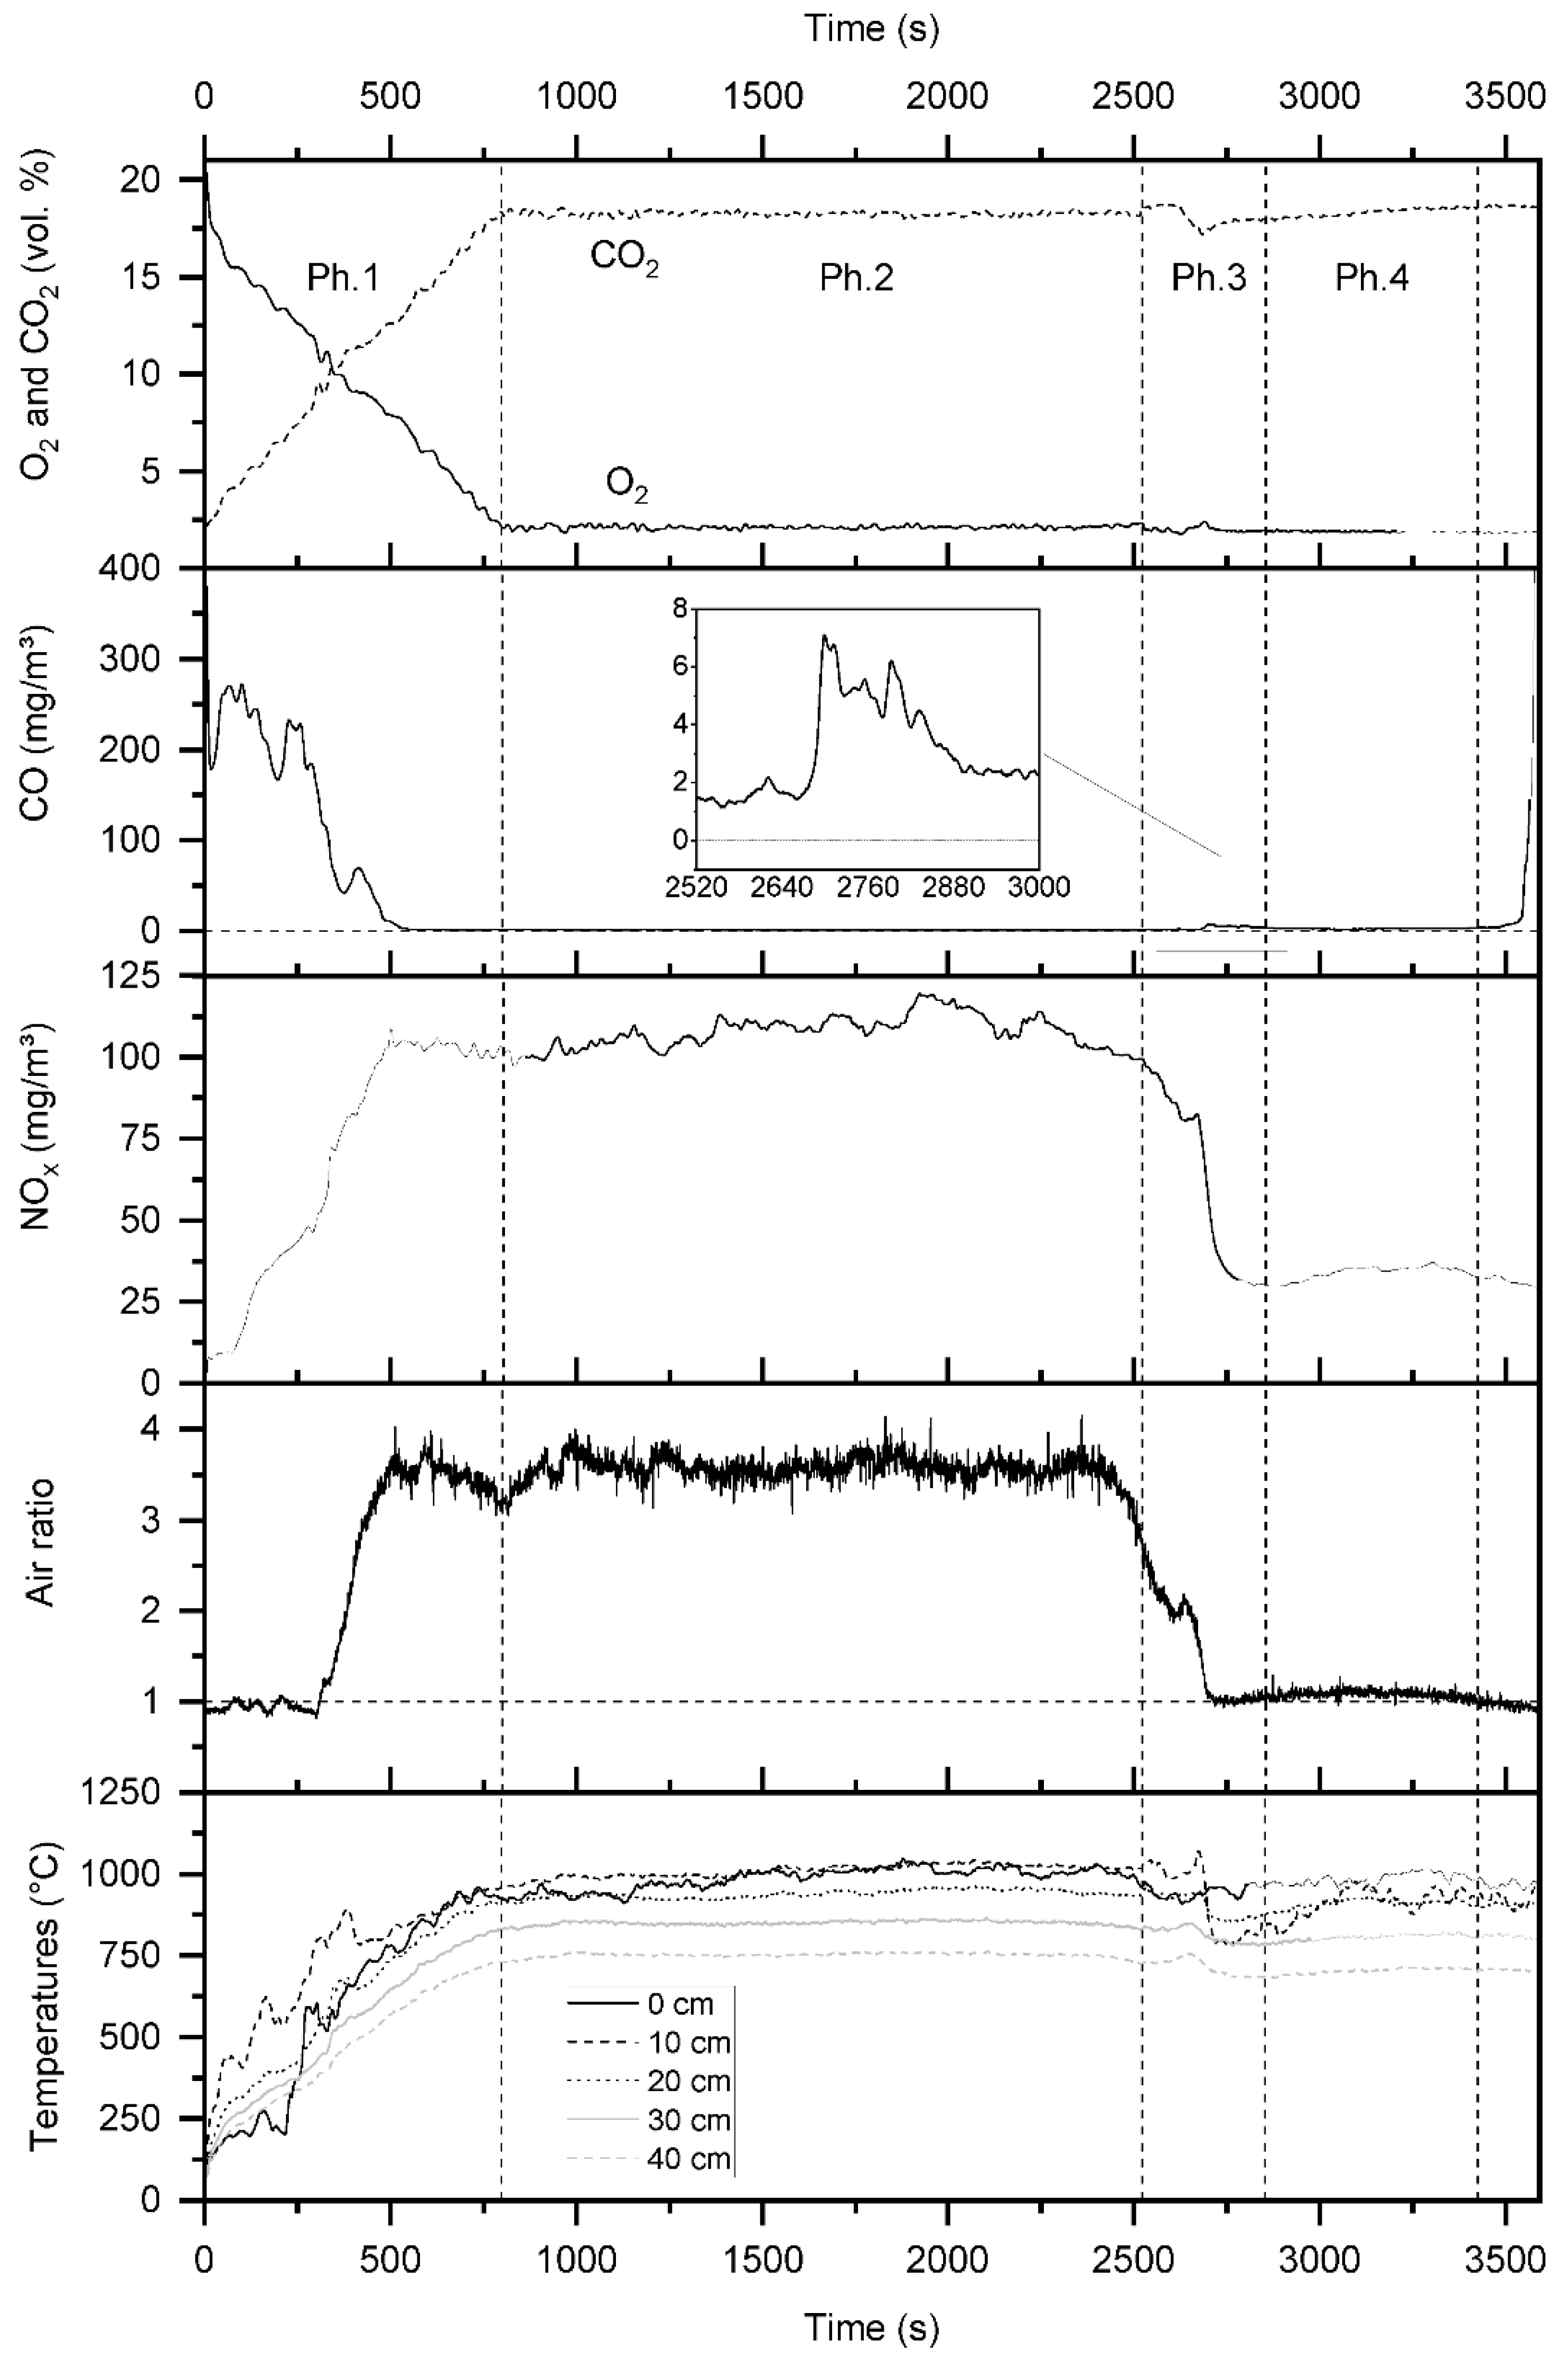
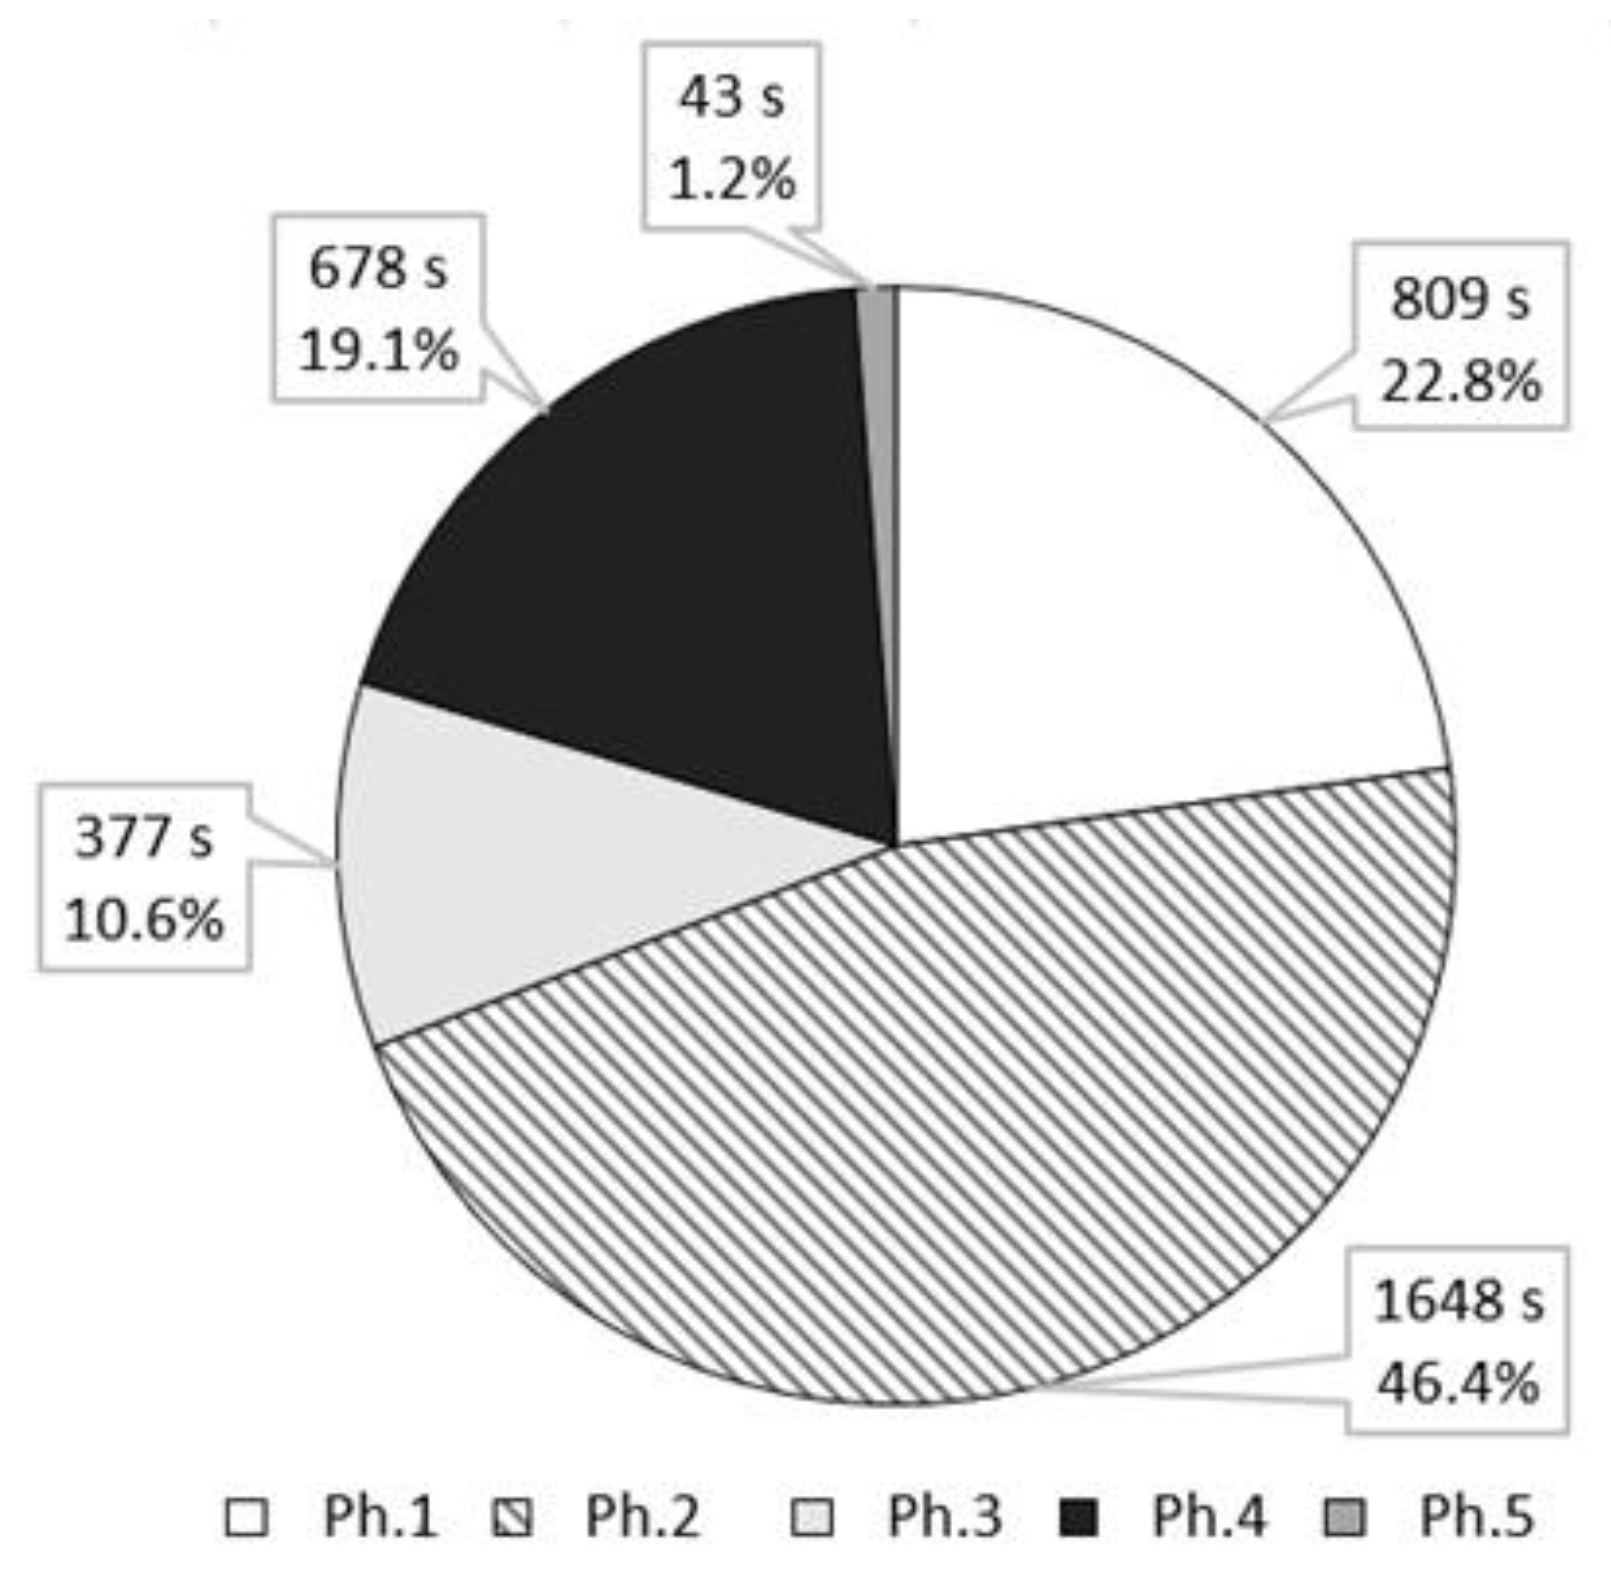
4.1. The Characteristics of the Overall Combustion Process

Figure 2 displays a complete cycle of a combustion process depending on the important process parameters including emitted flue gases (O2, CO2, CO, and NOx), the air ratio, and the gas temperatures above the burner nozzle. In order to illustrate the system behavior in case of a breakdown of the reaction in the char bed, data from the second experiment (Exp. 2) with a deactivated auto-switch-off function was presented. Accordingly, Figure 2 shows the measurement results from the beginning of Ph. 1 to the end of Ph. 4 which approximately corresponds to Ph. 7. Ph. 5 is not shown here due to its short duration. On the other hand, the measurement results from the beginning of Ph. 2 to the end of Ph. 4 approximately corresponds to Ph. 6.
As displayed in Figure 2, during the start-up phase, the O2 content in the flue gas was decreased in a controlled manner to the target value of 2 vol. %. This value was kept constant over the entire experiment with minor deviations. In contrast to the O2 content, the CO2 content in the flue gas increased linearly until it remained nearly constant between 18 and 19 vol. % over the entire process. There are no limit values for CO2 within the official regulations. For this reason, the CO2 values are not examined in more detail. The CO emissions increased significantly at the beginning of the process and then fell down steadily to a very low value as can be seen in Figure 2. On the other hand, the NOx emissions increased continuously during the start-up phase until reaching a constant level. Both emission values reached their stationary ranges before the start-up phase ended. Similar behavior can be observed for the air ratio as well. The combustion temperatures were stabilized in parallel to the O2 content in the flue gas once the start-up phase was complete.
In the pyrolysis phase, the emission parameters, as well as the air ratio and combustion temperatures were stabilized. The end of this phase was observed not only by the change in the air ratio but also in the NOx emissions continually. During the transition phase, a CO peak (see Figure 2, displayed in the box) smaller than the start-up peak was formed within a limited time. The NOx emissions as well as the air ratio decreased significantly continually during the transition from pyrolysis to char-burn. Moreover, the temperature 10 cm above the burner nozzle also dropped significantly. During the char-burn phase, both the NOx emissions and the air ratio formed a symmetrical, hill-like course as can be seen in Figure 2. The temperatures were stable, except for the temperature 10 cm above the burner nozzle, which showed strong fluctuations.
The burn-out phase was not specially marked in the diagram, because the auto-switch-off function was deactivated during the experiment and due to the short time span for a display when this phase was subsequently determined using the sensor data (see Table 3). However, it can be seen that despite the constant O2 content in the flue gas, the CO emissions suddenly increased drastically, while the NOx emissions and the air ratio steadily decreased when the reaction in the char bed collapsed.
Table 3 shows the average values of the individual parameters of each combustion phase for all experiments carried out while Figure 3 displays the average CO and NOx emissions including calculated values for auto switch-off. The values of O2, NOx, and TPM were relatively constant within the phases. In terms of CO emissions, there were major fluctuations in the transient phases (Ph. 1, Ph. 3, and Ph. 5), which also had a minor effect on the overall process. The major deviations in duration time were observed in char-burn phase. Since the char produced during pyrolysis was not always burned in the same amount, the time for this phase varies the most. As can be seen in Table 3 and Figure 3a, the highest CO emission values with a large fluctuation range between 94.6–195.8 mg/m3 were formed in the start-up phase. During the pyrolysis and the char-burn phases, there were significantly lower amounts of CO emissions varying between 0.9–1.9 and 2.2–2.7 mg/m3 in the given order, compared to the overall process. The emissions of the transition and burn-out phases were slightly higher but mainly less than the emissions of the overall process. The comparison between the overall process without start-up (Ph. 6) and the overall process (Ph. 7) showed that the start-up phase had a big impact on the CO emissions for the overall process.
As can be seen in Table 3 and Figure 3b, the highest NOx emissions were formed during the pyrolysis phase (Ph. 2), which was followed by the start-up (Ph. 1) and transition phase (Ph. 3), with average values of 105.7, 77.4 and 61.5 mg/m3, respectively, while the emissions during char-burn and burn-out phase were relatively low. The comparison between the overall process without start-up (Ph. 6) and the overall process (Ph. 7) showed that the start-up phase was not influential on the NOx emissions for the overall process.
Figure 4a displays the measured TPM, while Figure 4b displays the filter images of these measurements. It can be seen that the particle emissions during the pyrolysis phase (Ph. 2) were lower than the start-up or char-burn phases. The emissions of the overall process (Ph. 7) were between these two phases. The fluctuation range was higher in the start-up phase than the other measured three phases. The filter images in Figure 4b indicate fine soot formation, especially in the start-up phase. During pyrolysis and char-burn phases, both fine ash and char particles fled into the flue gas. A superposition of the phases in the overall process resulted in a filter with a bluish or violet color. The composition of the particles was not analyzed in this study.
In Figure 5, the average durations for the respective combustion phases and their share in the total process are shown. Under the boundary conditions (geometry, air flows, etc.), the steady phases of pyrolysis and char-burn together required 65.5% of the total burn-up time. From the transient phases of the process, the start-up (Ph. 1) had the largest share with 22.8% of the total duration which was followed by the transition phase (Ph. 3) with 10.6%. The burn-out phase (Ph. 5), on the other hand, was very short 1.2% of the overall duration due to the sensor-based auto-switch-off of the process.

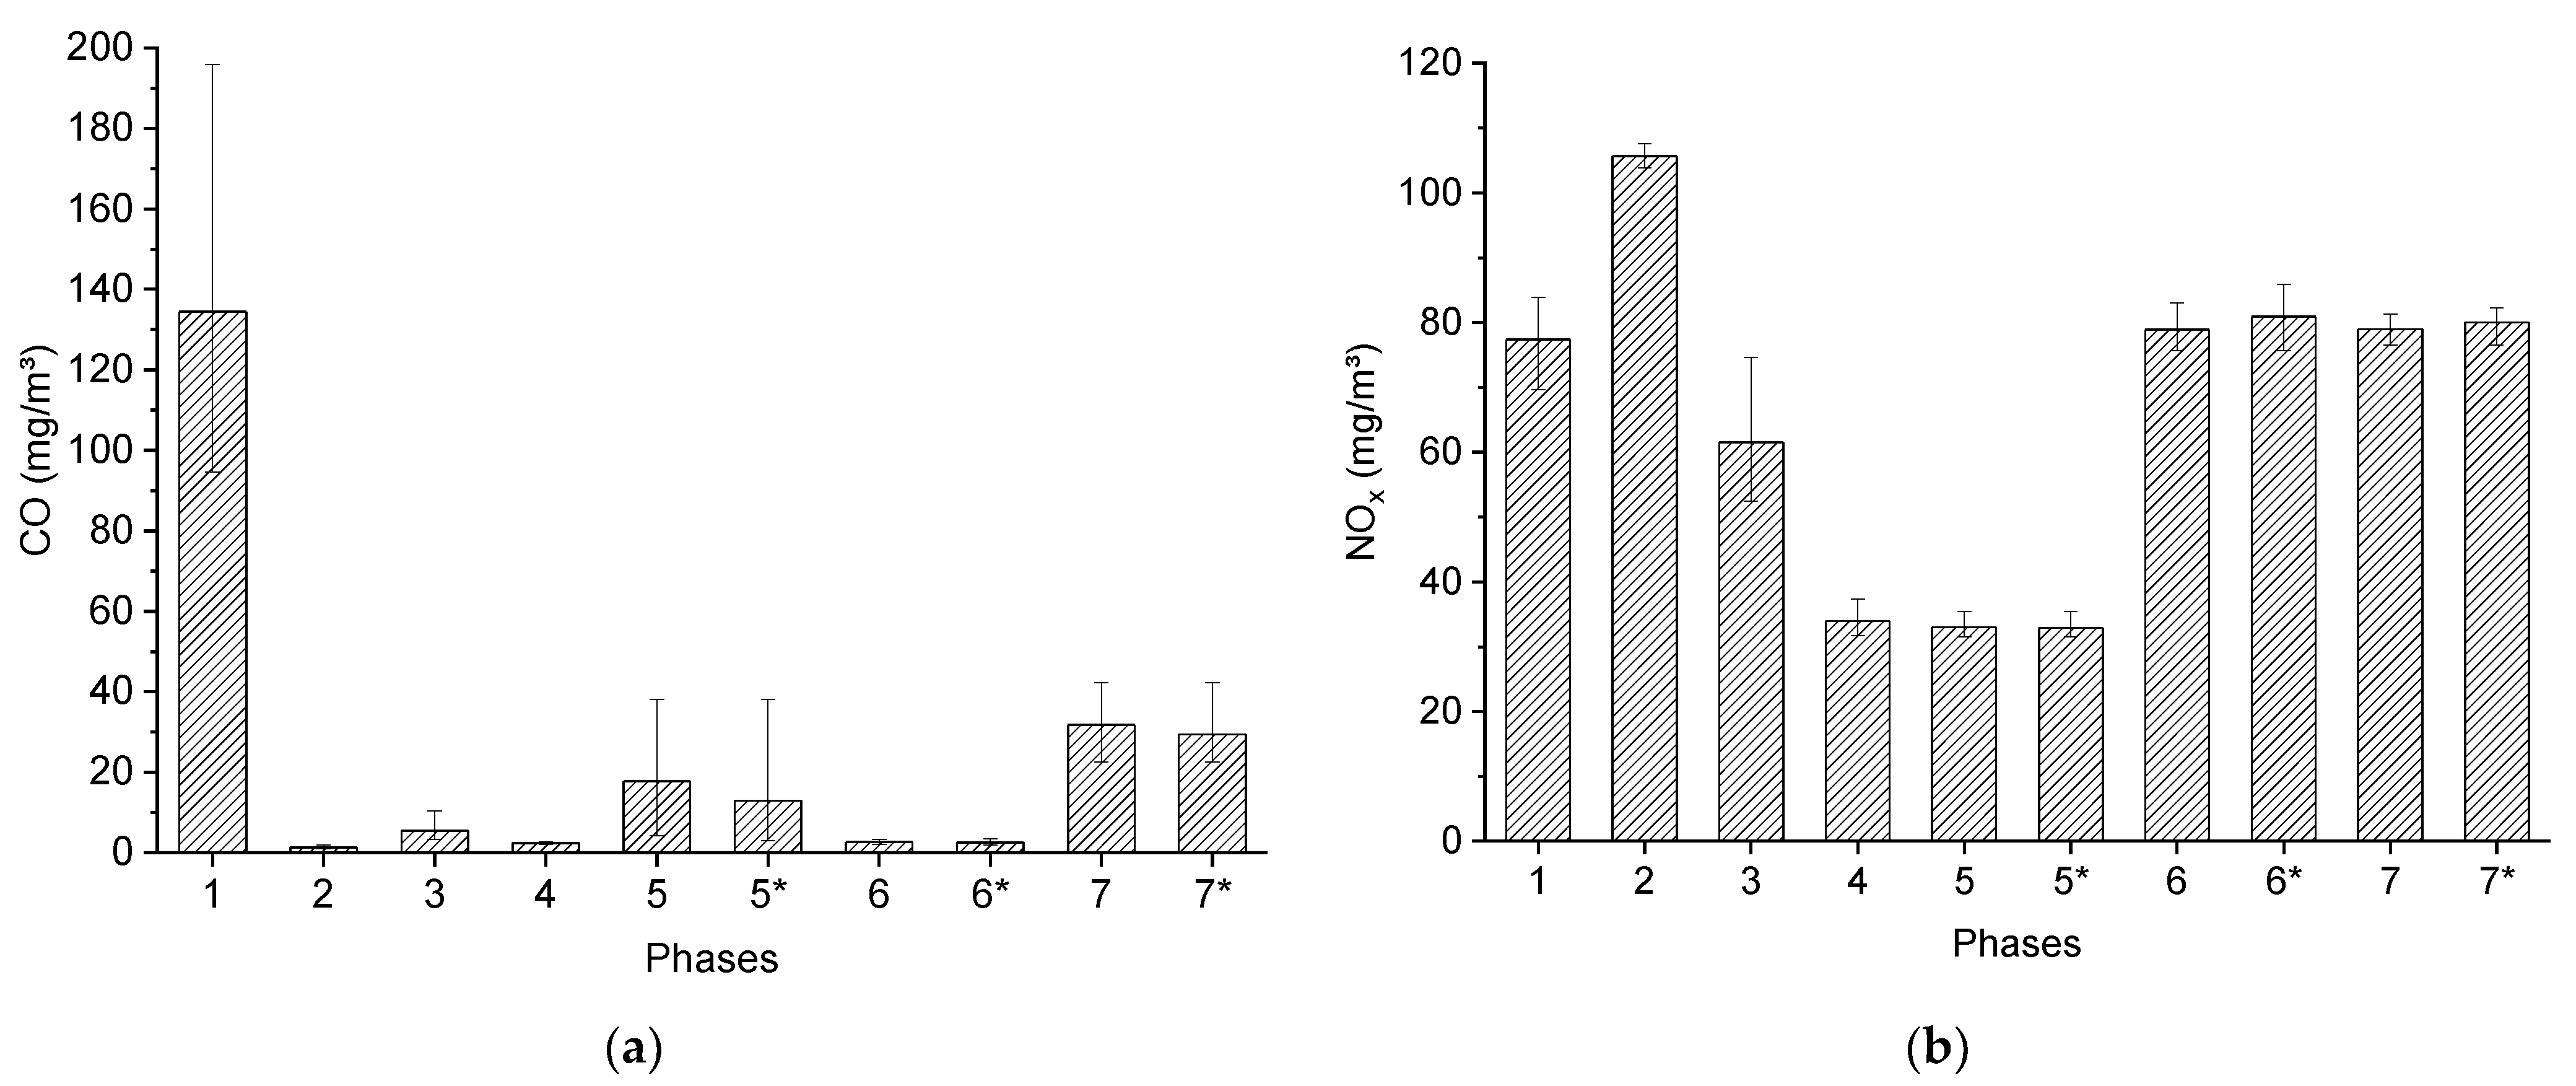
4.2. The Characteristics of the Transient Combustion Phases

4.2.1. Start-Up

In the start-up phase (Ph. 1), the combustion was controlled carefully using the O2 content in the flue gas as a reference value until the steady-state pyrolysis phase began. Figure 6 displays the O2 content in the flue gas for all experiments. After showing a linear trend, the target O2 value was achieved approximately 840 s later.
Figure 7a,b display the emitted CO and NOx emissions during the start-up phase (Ph. 1). The respective courses of the CO emissions differed from each other strongly in some cases, while the NOx emissions showed similar trends. A clear peak was formed right after the start for the CO emissions due to the normalization of the value to the high O2 content in the flue gas at the beginning. Then, significant fluctuations were observed until the values fell finally to a very low level. Both emission values reached the values of the pyrolysis phase after approximately 500 s. Thus, significantly earlier than the time until the start-up phase was technically completed and the O2 target value in the flue gas was ensured.

4.2.2. Transition Phase

Figure 8a,b display the emitted CO and NOx emissions during the transition phase (Ph. 3). As in the start-up phase (Ph. 1), the CO emissions showed inconsistency with large differences. The time to shift from pyrolysis to the char-burn phase also differed significantly (see Table 3). As can be seen in Figure 8b, the NOx emissions showed fluctuations up to 270 s. Afterward, the course of NOx emissions showed a linear trend. In general, CO emission levels were significantly lower than the start-up phase, however, significantly higher than the pyrolysis (Ph. 2) or the char-burn phase (Ph. 4).

5. Discussion

Considering increasing environmental concerns, biomass plays a critical role in the energy production towards a more sustainable future with a shift from fossil fuels to biomass fuels, especially in small and medium scale heat production [32]. However, biomass combustion can be also challenging due to the emitted particulate matter and emissions (CO, NOx, PAH, VOC), thus it has been an active research area for many years [11,16,32,33]. There are many aspects such as the type of the selected fuel, the design of the combustion equipment (boiler, stove, burner, etc.), the nature of the technology (batch or automated), the variations in reporting the results based on different units (mg/sm3, mg/MJ, EF) or O2 content in the flue gas which make the comparison of the emission results challenging. Still, it is possible to find comparable studies. Table 4 shows the relevant standardized average and maximum values of CO, NOx, and TPM emissions for the two steady-state phases of the process; the pyrolysis (Ph. 2) and the char-burn (Ph. 4) as well as the overall process without start-up (Ph. 6) and with start-up (Ph. 7) which are used for comparison with other studies.
Motly et al. [34] reported the emissions from 10 kW boiler fired with wood pellets. The authors introduced the circular flow of the flue gases around the combustion to lower the emissions values as an innovative aspect to ensure the requirements of ECODESIGN Directive in the European Union countries. From 2-h boiler operation, reported CO emissions were 91 mg/m3, while the average NOx emissions were 197 mg/m3 for a normalized oxygen content of 10 vol. % within the flue gas which correspond to 66.2 mg/m3 CO and 143.3 mg/m3 NOx emissions when normalized to an oxygen content of 13 vol. %. These values are higher compared to reported emissions in this study even in case of including start-up phase (Ph. 7). On the other hand, Baumgarten et al. [35] investigated the effects of novel metal mesh filter in small-scale commercial biomass boiler with 50 kW heat output. In the experiments, they used wood pellets and wood chips at 50% load. Their emission results from the combustion of wood pellets were 53 mg/m3 for CO, 68 mg/m3 for NOx and 7 mg/m3 for TPM emissions for the corrected 13 vol. % O2 in the flue gas. The CO and TPM emissions (except for TPM emissions for Ph. 4) are higher than the reported values in this study although in comparison to emissions from overall process including start-up (Ph. 7). The NOx emissions during the pyrolysis phase (Ph. 2) and the overall process including start-up (Ph. 7) reported in this study are higher than the NOx emissions reported by Baumgarten. Within the char-burn phase (Ph. 4), they were found to be lower in this study. Obernberger et al. [36] proposed a similar approach used in our study based on a pre-gasification of the fuel in an updraft gasifier boiler with 31.6 kWth for forest residues as fuel. The results showed that the mean emissions from the combustion were 6.9 and 2.9 mg/m3 (13 vol. % O2 in the flue gas) for CO and PM emissions. The CO emissions during the steady-state phases pyrolysis (Ph. 2) and char-burn (Ph. 4) are lower in the present study. However, considering the overall process (Ph. 7), the CO emissions are higher in this study. The particle emissions of pyrolysis phase (Ph. 2) found in this study are lower than the reported values of Obernberger et al. [36] whereas these are higher within the char-burn phase (Ph. 4) and for the overall process including start-up (Ph. 7).
In summary, CO and TPM emissions over the overall process reported in this work are lower than the emissions obtained from steady-state combustion systems as Motly et al. [34] and Baumgarten et al. [35] showed. The NOx emissions are comparable. A comparison with a similar pre-gasification technology did not result in a uniform direction. The reason for this situation is that in the technology presented by Obernberger et al. [36] pyrolysis and gasification take place in parallel in the updraft gasifier. In the TLUD technology, these processes take place one after the other, which results in two different steady-state process phases with regard to emissions.
One of the aims of this study is to compare the obtained emission results with 1. BlmSchV [37] which defines the permissible emissions to operate a combustion appliance for small-medium scale plants. In addition, the combustion systems can be also voluntarily certified according to the Blue Angel standard [38,39]. The emissions limits of these regulations were summarized in Table 5. In comparison with these limits, the emissions from the steady-state phases; pyrolysis (Ph. 2) and char-burn (Ph. 4) were below the permissible limits in terms of CO, NOx, and TPM as given in Table 4. The emissions for existing combustion systems are usually higher in start-up, partial load, and burn-out phases [11,15]. The measurements are carried out in steady-state mode during periodic emission tests. Therefore, the real-world emissions are higher than the measured emissions due to the lack of phases with higher emissions. Hence, it is important to show the emissions for the entire process including the start-up phase for a better estimation in terms of real-life emissions of the combustion. As can be seen from Table 4, the emissions of Ph. 7 were also below the limits even for the overall process. The comparison between Ph. 6 and Ph. 7 clearly showed that the start-up phase has the greatest influence on the CO emissions, while the NOx emissions showed almost no change.
The obtained results showed that the demonstration of batch process with a serial of combustion tests as well as automatic control of the combustion process was carried out successfully. Although the emitted CO emissions were relatively high at the start-up phase, it was possible to keep these emissions at lower levels during further phases of combustion and the overall process. With this design, the power output of the burner and the amount of energy per batch can be optimized independently by adjusting the diameter and the height of the reaction chamber. However, since the time required for the start-up is always the same with a constant reactor diameter, the use of a taller reaction chamber could decrease the effect for the overall emissions, in particular decreasing the average CO and TPM emissions. This also means that more fuel is required for each batch with increased burn-up duration.
The results presented here are specific to the proposed experimental design with fixed geometry, optimized air staging and the selected fuel type. The process has a potential for further improvements. For instance the manual work that has to be carried out at the start and end of the process could be done via further automation of the system in terms of deashing, filling and ignition at the start of the process and closing of the reaction chamber at the end of the process. Using a heat exchanger can also be useful for further application areas. Additionally, the literature shows that both VOC and PAH emissions can be relevant, especially under unfavorable operating conditions such as start-up or partial load [12,15]. Thus, VOC and PAH measurements are planned as one of the future steps.

6. Conclusions

In this study, combustion experiments in a small-scale biomass burner based on “top-lit updraft (TLUD)” with automatic process control were carried out to gain inside into the process and emission behaviors. The results showed that the batch combustion experiments were repeatable with low emissions over the entire process. Mainly, it was possible to separate the process into two phases; pyrolysis and char gasification which enabled to optimize the respective parameters for low-emission and effective operation for these sub-processes. The burner could operate with very low oxygen levels in the flue gas, which led to high flue gas temperatures and potentially high efficiencies for future applications. Due to the batch process, which is always kept in the optimum range, the emissions over the entire burn-up could be determined close to real-world operation. In comparison with the selected official standards, the developed set-up, which can be classified in the performance class of small-scale, could fulfill the permitted limits of small and medium-scale systems. Contrary to the commonly used emission values in steady-state mode, even the emission results with the averaged values over the entire process including the start-up phase were also below the limits. In addition to its main use as a pyrolytic cooker today, the TLUD process can offer a promising solution for a wide range of biomass-based combustion applications, in case high process temperatures (>1000 °C) and low emissions are the main focus. The setup can be also used to produce high-quality bio-char.

Author Contributions

Conceptualization, D.K.; methodology, D.K.; validation, D.K., Ö.Ç.M.; formal analysis, D.K.; investigation, D.K.; resources, D.K.; data curation, D.K.; writing—original draft preparation, D.K., Ö.Ç.M.; writing—review and editing, D.K., Ö.Ç.M.; visualization, D.K., Ö.Ç.M.; supervision, D.K.; project administration, D.K.; funding acquisition, D.K. All authors have read and agreed to the published version of the manuscript.

Funding

The authors would like to acknowledge the financial support for preliminary work, relevant measurements and writing this publication within the following projects; “Research and construction of a technology demonstrator for electricity network stabilizing heating based on biogenic solid fuels (micro-combined heat and power)” with grant agreement 100253153, funding from Sächsische Aufbaubank, and “LabTogo—Development of research capacities and demonstration of technologies for the use of biomass potential in Togo”, funding from Federal Ministry of Education and Research. (The project titles were translated from German to English.)Energies 14 03913 i001

Institutional Review Board Statement

Not applicable.

Informed Consent Statement

Not applicable.

Data Availability Statement

Not applicable.

Acknowledgments

The authors would like to acknowledge the technical support of Carsten Tilch and Marco Putbrese during the production of the developed burner as well as the measurement of the particle emissions.

Conflicts of Interest

The authors declare no conflict of interest. The funders had no role in the design of the study; in the collection, analyses, or interpretation of data; in the writing of the manuscript, or in the decision to publish the results.

Abbreviations

n.d.Not determined
PAHPolyaromatic hydrocarbon
PMParticulate matter
STPStandard temperature and pressure
TLUDTop-lit updraft
TPMTotal particulate matter
VOCVolatile organic compounds

References

  1. Dahlquist, E. Technologies for Converting Biomass to Useful Energy: Combustion, Gasification, Pyrolysis, Torrefaction and Fermentation; CRC Press: Boca Raton, FL, USA; Taylor & Francis Group: Abingdon, UK, 2013. [Google Scholar]
  2. Alemayehu, Y.A.; Asfaw, S.L.; Terfie, T.A. Exposure to urban particulate matter and its association with human health risks. Environ. Sci. Pollut. Res. 2020, 27, 27491–27506. [Google Scholar] [CrossRef] [PubMed]
  3. Obaidullah, M.; Bram, S.; de Ruyck, J. Characteristics of Particle Mass Concentrations from small scale biomass combustion-a review. Small 2020, 5, 6. [Google Scholar]
  4. Jones, J.M.; Lea-Langton, A.R.; Ma, L.; Pourkashanian, M.; Williams, A. Pollutants Generated by the Combustion of Solid Biomass Fuels; Springer: London, UK, 2014; ISBN 978-1-4471-6437-1. [Google Scholar]
  5. Lenz, V.; Thrän, D.; Pfeiffer, D. Methods for Measuring Emissions of Particulate Matter from Solid Biomass Combustion: Series of the Funding Programme “Biomass Energy Use”; DBFZ Deutsches Biomasseforschungszentrum Gemeinnützige GmbH: Leipzig Germany, 2018; Volume 8. [Google Scholar]
  6. Gitau, K.; Mutune, J.; Sundberg, C.; Mendum, R.; Njenga, M. Factors influencing the adoption of biochar-producing gasifier cookstoves by households in rural Kenya. Energy Sustain. Dev. 2019, 52, 63–71. [Google Scholar] [CrossRef]
  7. Van Loo, S.; Koppejan, J. (Eds.) The Handbook of Biomass Combustion and Co-Firing-Earthscan; Earthscan Publishing: Abingdon, UK, 2008. [Google Scholar]
  8. Tryner, J. Combustion Phenomena in Biomass Gasifier Cookstoves. Ph.D. Thesis, Colorado State University, Fort Collins, CO, USA, 2016. [Google Scholar]
  9. Toklu, E. Biomass energy potential and utilization in Turkey. Renew. Energy 2017, 107, 235–244. [Google Scholar] [CrossRef]
  10. Verma, V.; Bram, S.; De Ruyck, J. Small scale biomass heating systems: Standards, quality labelling and market driving factors—An EU outlook. Biomass Bioenergy 2009, 33, 1393–1402. [Google Scholar] [CrossRef]
  11. Schmidl, C.; Luisser, M.; Padouvas, E.; Lasselsberger, L.; Rzaca, M.; Cruz, C.R.-S.; Handler, M.; Peng, G.; Bauer, H.; Puxbaum, H. Particulate and gaseous emissions from manually and automatically fired small scale combustion systems. Atmosph. Environ. 2011, 45, 7443–7454. [Google Scholar] [CrossRef]
  12. Boman, C.; Pettersson, E.; Westerholm, R.; Boström, D.; Nordin, A. Stove Performance and Emission Characteristics in Residential Wood Log and Pellet Combustion, Part 1: Pellet Stoves. Energy Fuels 2011, 25, 307–314. [Google Scholar] [CrossRef]
  13. Kirch, T.; Birzer, C.; van Eyk, P.; Medwell, P.R. Influence of Primary and Secondary Air Supply on Gaseous Emissions from a Small-Scale Staged Solid Biomass Fuel Combustor. Energy Fuels 2017, 32, 4212–4220. [Google Scholar] [CrossRef]
  14. Tissari, J.; Sippula, O.; Kouki, J.; Vuorio, K.; Jokiniemi, J. Fine Particle and Gas Emissions from the Combustion of Agricultural Fuels Fired in a 20 kW Burner. Energy Fuels 2008, 22, 2033–2042. [Google Scholar] [CrossRef]
  15. Bhattu, D.; Zotter, P.; Zhou, J.; Stefenelli, G.; Klein, F.; Bertrand, A.; Temime-Roussel, B.; Marchand, N.; Slowik, J.G.; Baltensperger, U.; et al. Effect of Stove Technology and Combustion Conditions on Gas and Particulate Emissions from Residential Biomass Combustion. Environ. Sci. Technol. 2019, 53, 2209–2219. [Google Scholar] [CrossRef] [PubMed] [Green Version]
  16. Lamberg, H.; Sippula, O.; Tissari, J.; Jokiniemi, J. Effects of Air Staging and Load on Fine-Particle and Gaseous Emissions from a Small-Scale Pellet Boiler. Energy Fuels 2011, 25, 4952–4960. [Google Scholar] [CrossRef]
  17. Obernberger, I.; Brunner, T.; Bärnthaler, G. Fine Particulate Emissions from Modern Austrian Small-Scale Biomass Combustion Plants. In Proceedings of the 15th European Biomass Conference and Exhibition, Berlin, Germany, 7–11 May 2007; pp. 1546–1557. [Google Scholar]
  18. Jetter, J.; Zhao, Y.; Smith, K.R.; Khan, B.; Yelverton, T.; DeCarlo, P.; Hays, M.D. Pollutant Emissions and Energy Efficiency under Controlled Conditions for Household Biomass Cookstoves and Implications for Metrics Useful in Setting International Test Standards. Environ. Sci. Technol. 2012, 46, 10827–10834. [Google Scholar] [CrossRef] [PubMed]
  19. Jetter, J.J.; Kariher, P. Solid-fuel household cook stoves: Characterization of performance and emissions. Biomass Bioenergy 2009, 33, 294–305. [Google Scholar] [CrossRef]
  20. MacCarty, N.; Still, D.; Ogle, D. Fuel use and emissions performance of fifty cooking stoves in the laboratory and related benchmarks of performance. Energy Sustain. Dev. 2010, 14, 161–171. [Google Scholar] [CrossRef]
  21. Roth, C. Micro-Gasification: Cooking with Gas from Dry Biomass: An Introduction to Concepts and Applications of Wood-Gas. Burning Technologies for Cooking, 2nd ed.; GIZ-Deutsche Gesellschaft für Internationale: Bonn, Germany, 2013. [Google Scholar]
  22. Tryner, J.; Tillotson, J.W.; Baumgardner, M.E.; Mohr, J.T.; Defoort, M.W.; Marchese, A.J. The Effects of Air Flow Rates, Secondary Air Inlet Geometry, Fuel Type, and Operating Mode on the Performance of Gasifier Cookstoves. Environ. Sci. Technol. 2016, 50, 9754–9763. [Google Scholar] [CrossRef] [PubMed]
  23. Marchese, A.; Defoort, M.; Gao, X.; Tryner, J.; Dryer, F.L.; Haas, F.; Lorenz, N. Achieving Tier 4 Emissions in Biomass Cookstoves; Office of Scientific and Technical Information (OSTI): Oak Ridge, TN, USA, 2018. [Google Scholar]
  24. Scholz, S.B.; Sembres, T.; Roberts, K.; Whitman, T.; Wilson, K.; Lehmann, J. Biochar Systems for Smallholders in Developing Countries: Leveraging Current Knowledge and Exploring Future Potential for Climate-Smart Agriculture; International Bank for Reconstruction and Development/The World Bank: Washington, DC, USA, 2014. [Google Scholar]
  25. ISO 17225-2:2014. Solid Biofuels—Fuel Specifications and Classes: Part. 2: Graded Wood Pellets; International Organization for Standardization: London, UK, 2014. [Google Scholar]
  26. EN 15267-1:2009. Air Quality—Certification of Automated Measuring Systems: Part. 1: General Principles; Beuth: Berlin, Germany, 2009. [Google Scholar]
  27. EN 15267-2:2009. Air Quality—Certification of Automated Measuring Systems: Part. 2: Initial Assessment of the AMS Manufacturer’s Quality Management System and Post Certification Surveillance for the Manufacturing Process; Beuth: Berlin, Germany, 2009. [Google Scholar]
  28. EN 15267-4:2017. Air Quality—Certification of Automated Measuring Systems: Part. 4: Performance Criteria and Test. Procedures for Automated Measuring Systems for Periodic Measurements of Emissions from Stationary Sources; Beuth: Berlin, Germany, 2017. [Google Scholar]
  29. ISO 14175:2008. Welding Consumables—Gases and Gas. Mixtures for Fusion Welding and Allied Processes; International Organization for Standardization: London, UK, 2008. [Google Scholar]
  30. EN 13284-1:2017. Stationary Source Emissions—Determination of Low Range Mass Concentration of Dust: Part. 1: Manual Gravimetric Method; Beuth: Berlin, Germany, 2017. [Google Scholar]
  31. Gothe, P.; GmbH. Datenblatt/Data Sheet QUARZ-MIKROFASERFILTER: MK 360. Available online: https://www.paulgothe.com/. (accessed on 23 June 2021).
  32. Sippula, O.; Hokkinen, J.; Puustinen, H.; Yli-Pirilä, P.; Jokiniemi, J. Comparison of particle emissions from small heavy fuel oil and wood-fired boilers. Atmosph. Environ. 2009, 43, 4855–4864. [Google Scholar] [CrossRef]
  33. Kaivosoja, T.; Jalava, P.; Lamberg, H.; Virén, A.; Tapanainen, M.; Torvela, T.; Tapper, U.; Sippula, O.; Tissari, J.; Hillamo, R.; et al. Comparison of emissions and toxicological properties of fine particles from wood and oil boilers in small (20–25 kW) and medium (5–10 MW) scale. Atmosph. Environ. 2013, 77, 193–201. [Google Scholar] [CrossRef]
  34. Motyl, P.; Król, D.; Poskrobko, S.; Juszczak, M. Numerical Modelling and Experimental Verification of the Low-Emission Biomass Combustion Process in a Domestic Boiler with Flue Gas Flow around the Combustion Chamber. Energies 2020, 13, 5837. [Google Scholar] [CrossRef]
  35. Baumgarten, B.; Grammer, P.; Ehard, F.; Winkel, O.; Vogt, U.; Baumbach, G.; Scheffknecht, G.; Thorwarth, H. Novel metal mesh filter using water-based regeneration for small-scale biomass boilers. Biomass Convers. Biorefin. 2020, 636, 1–13. [Google Scholar] [CrossRef]
  36. Obernberger, I.; Brunner, T.; Mandl, C.; Kerschbaum, M.; Svetlik, T. Strategies and technologies towards zero emission biomass combustion by primary measures. Energ. Proc. 2017, 120, 681–688. [Google Scholar] [CrossRef]
  37. BImSchV. Erste Verordnung zur Durchführung des BundesImmissionsschutzgesetzes (Verordnung über Kleine und Mittlere Feuerungsanlagen—1. BImSchV). 2010. Available online: https://www.gesetze-im-internet.de/bimschv_1_2010/1._BImSchV.pdf (accessed on 22 October 2020).
  38. Blauer Engel. Holzpelletöfen. DE-UZ 111 February 2016, Version 2. Available online: https://produktinfo.blauer-engel.de/uploads/criteriafile/de/DE-UZ%20111-201602-de%20Kriterien-2020-01-07.pdf (accessed on 23 June 2021).
  39. Blauer Engel. Holzpellet—und Holzhackschnitzelheizlessel. DE-UZ 112, February2016, Version 2. Available online: https://produktinfo.blauer-engel.de/uploads/criteriafile/de/DE-UZ%20112-201602-de%20Kriterien-2020-01-03.pdf (accessed on 23 June 2021).
Figure 1. Schematic model of the burner (a) 3-D scheme without flanges and flue gas measuring section (b) 2-D scheme of the experimental set-up.
Energies 14 03913 g001
Figure 2. O2, CO2, CO and NOx content into standardized 13 vol. % O2 content in dry flue gas (STP), air ratio (secondary air to primary air) and temperatures (height over burner nozzle) for a complete combustion cycle without auto-switch-off at the end of combustion (Exp. 2); details of the CO emissions during the transition phase was given in the box (time after the start of the phase).
Energies 14 03913 g002
Figure 3. Average gaseous emissions for the different process phases (error bar: min./max. values; * incl. values for calculated auto-switch-off (Exp. 1 and Exp. 2)); (a) CO (b) NOx for standardized 13 vol. % O2 content in dry flue gas (STP).
Energies 14 03913 g003
Figure 4. Particle emissions for the different process phases; (a) average TPM emissions (error bar: min./max. values); Ph. 1, Ph. 2 and Ph. 4 within experiment 1–2; Ph. 7 within experiment 3–6; (b) filter from particle measurement for start-up (Ph. 1), pyrolysis (Ph. 2), char-burn (Ph. 4) and overall process (Ph. 7).
Energies 14 03913 g004
Figure 5. Average durations of different combustion phases within the overall process.
Energies 14 03913 g005
Figure 6. O2 content in the flue gas for the start-up phase.
Energies 14 03913 g006
Figure 7. Gaseous emissions content in the flue gas for the start-up phase; (a) CO and (b) NOx for standardized 13 vol. % O2 content in dry flue gas (STP).
Energies 14 03913 g007
Figure 8. Gaseous emissions content in the flue gas for the transition phase; (a) CO and (b) NOx (time after the start of the phase) for standardized 13 vol. % O2 content in dry flue gas (STP).
Energies 14 03913 g008
Table 1. Properties of wood pellets used as fuel in combustion experiments.
ParameterValue
Moisture (as received, wt.%)6.2
Ash (550 °C) (dry, wt.%)0.31
Proximate analysis (dry, wt.%)-
C51.0
H6.18
N0.05
S0.06
O (by difference)42.4
Lower heating value (MJ/kg)19.0
Table 2. Sensors, actuators and measuring devices used in the experiments.
DesignationTypeModel
Primary Air FanActuatorSanyo Denki 9GAX0412P3S001
Secondary Air FanActuatorSanyo Denki 9GAX0412P3S001
Primary Air—Air Mass SensorSensorHoneywell AWM720P1
Secondary Air—Air Mass SensorSensorHoneywell AWM720P1
Wideband Lambda SensorSensorBosch LSU 4.2
Gas analyzerMeasuring DeviceHoriba PG-350E *
Particle MeasurementMeasuring DevicePaul Gothe GmbH particle measuring system ITES
* Measuring principles: Paramagnetic for O2, NDIR (Nondispersive Infrared Sensor) for CO and Chemiluminescence for NOx.
Table 3. O2 content, emission values (normalized to 13 vol. % O2 in the dry flue gas (STP)) in the flue gas and duration time for the different phases of the experiments.
Ph. 1Ph. 2Ph. 3Ph. 4Ph. 5Ph. 6Ph. 7
O2 (vol. %)
Exp. 110.22.12.01.91.9 *2.0 *4.0 *
Exp. 29.72.12.01.91.9 *2.1 *3.8 *
Exp. 310.32.12.01.91.92.04.0
Exp. 49.72.22.01.92.02.13.8
Exp. 59.82.22.12.02.02.13.7
Exp. 69.72.22.12.02.02.13.9
CO (mg/m3)
Exp. 194.61.43.52.53.0 *2.0 *24.9 *
Exp. 299.01.23.32.43.6 *1.8 *24.4 *
Exp. 3117.11.93.42.723.42.722.5
Exp. 4156.31.33.92.24.32.026.6
Exp. 5195.81.110.42.35.12.842.3
Exp. 6143.50.98.72.238.13.435.8
NOx (mg/m3)
Exp. 177.4107.265.531.732.6 *83.9 *82.3 *
Exp. 269.7107.662.134.232.6 *85.8 *82.1 *
Exp. 375.5105.774.637.335.582.981.2
Exp. 478.5103.958.433.931.878.678.6
Exp. 579.5104.452.534.033.375.776.5
Exp. 683.9105.356.132.731.578.279.5
TPM (mg/m3)
Exp. 15.01.7n.d.7.2n.d.n.d.n.d.
Exp. 26.62.0n.d.6.7n.d.n.d.n.d.
Exp. 3n.d.n.d.n.d.n.d.n.d.n.d.3.6
Exp. 4n.d.n.d.n.d.n.d.n.d.n.d.3.4
Exp. 5n.d.n.d.n.d.n.d.n.d.n.d.3.9
Exp. 6n.d.n.d.n.d.n.d.n.d.n.d.3.3
Time (s)
Exp. 1839161437253433 *2553 *3392 *
Exp. 2799172233355614 *2625 *3424 *
Exp. 383716772607345327243561
Exp. 478916284636684328023591
Exp. 58031729447937631193922
Exp. 679315243946457126343427
Ph. 1: start-up; Ph. 2: pyrolysis; Ph. 3: transition; Ph. 4: char-burn; Ph. 5: burn-out; Ph. 6: overall process excl. start-up; Ph. 7: overall process; * calculated by identifying the auto-switch-off point in sensor data, n.d. refers to not determined.
Table 4. Mean emission values (mg/m3) for different process phases and all experiments for standardized 13 vol. % O2 content in dry flue gas (STP) (Ph. 2: Pyrolysis phase; Ph. 4: Char-burn phase; Ph. 6: Overall burn-up without start-up phase; Ph. 7: Overall burn-up).
Ph. 2Ph. 4Ph. 6Ph. 7
COMean1.32.42.5 *29.4 *
Max.1.92.73.442.3
NOxMean105.734.080.9 *80.0 *
Max.107.637.385.8 *82.3 *
TPMMean1.97.0n.d.3.6
Max.2.07.2n.d.3.9
* calculated by identifying the auto-switch-off point in sensor data.
Table 5. Overview of the emission limits in the official regulations [37,38,39].
Appliance TypeFuelNominal Heat OutputPM
(mg/m3)
CO
(mg/m3)
NOx
(mg/m3)
Ref. O2 Content (vol. %)
Blue Angel
Boiler
Wood pellets<500 kWth1515015013
Wood chips<500 kWth1516515013
Blue Angel
Stoves
Wood pellet<15 kWth15160 a/250 b150 a/200 b13
1. BlmSchV
small-medium
sized plants
Wood including bark (logs, wood chips), sawdust as well as pressings made of natural wood (briquettes, pellets)>4 kWth20400-13
a nominal load, b partial load.
Publisher’s Note: MDPI stays neutral with regard to jurisdictional claims in published maps and institutional affiliations.

