Abstract
The effect of reducing particle size on physical properties, the methane yield and energy flow were investigated through the biochemical methane potential (BMP) experiment of aerobic-anaerobic digestion (AAD) of rice straw (RS). The whole straw was crushed through four sieves of different aperture sizes (1, 3, 5, and 7 mm) to obtain the actual and non-uniform particle size distribution (PSD). The results indicated that the actual particle sizes were normally or logarithmic normally distributed. Reducing particle size could significantly promote the aerobic hydrolysis and acidification process, increase the content of volatile fatty acids (VFAs) from 4408.78 to 6225.15 mg/L and the degradation of volatile solids (VS) from 40.56% to 50.49%. The results of path analysis suggested that particle size reduction played an important role in improving lignocellulosic degradability, which was the main factor affecting methane production with the comprehensive decision of 0.4616. The maximum methane production obtained at 1 mm sieve size was 176.47 mLCH4g−1 VS. The phyla of Firmicutes (61.5%), Proteobacteria (9.3%), Chloroflexi (8.3%), Bacteroidetes (4.1%), Cyanobacteria/Chloroplast (4.6%) were mainly responsible for VFAs production and lignocellulose degradation. However, the net negative energy balance was observed at the 1 mm sieve size due to the increased energy input. Therefore, the optimum sieve size for AAD was 3 mm.
1. Introduction
Rice straw is one of the most abundant renewable energy sources in China, with an annual output of about 200 million t [1], which is mainly composed of 19–27% hemicellulose, 32–47% cellulose, and 5–24% lignin [2,3]. However, in addition to depletion of fossil energy, inappropriate disposal methods such as direct incineration have caused waste of resources and serious environmental pollution [4]. Therefore, it is urgent to find a clean technology that can simultaneously solve the two problems.
Anaerobic digestion (AD) is a highly desirable technology for converting organic wastes into value-added products such as biogas and organic fertilizer [5,6]. In general, it can be divided into two stages: hydrolysis-acidogenesis and methanogenesis, which are regulated by different kinds of microorganisms. In the first stage, complex particulate organic compounds such as carbohydrates and proteins are decomposed into VFAs by hydrolytic acidifying bacteria, providing the potential nutrient for the following step. Then in the second stage, methanogenic bacteria convert VFAs into biogas, a mixture of methane, carbon dioxide, and trace impurities. Due to the recalcitrant lignocellulosic structure, it is difficult to hydrolyze rice straw, resulting in the low AD efficiency [7]. As a result, various pretreatment methods have been applied to increase the accessibility of microorganisms to lignocellulose [8]. However, so far, no effective method has been found to strike a balance between economy and environmental friendliness.
Recently, it has been reported that aeration is a promising technology that can be used in three different ways of AD: pre-AD, in-AD and past-AD [9], which is contrary to the traditional concept of a strict anaerobic environment. In this study, aeration was performed during the hydrolysis and acidification steps of AD, namely aerobic hydrolysis and acidification, to accelerate the growth of hydrolysis and acidification bacteria, thereby obtaining higher extracellular hydrolytic enzymes in the presence of sufficient oxygen. In addition, a published study has proved that lignin can hardly be degraded under anaerobic conditions [10]. Molecular oxygen contributes to open the side chain of lignin and depolymerize the dense structure of lignocellulose, promoting its utilization by microorganisms. A previous study has been shown that aerobic pretreatment significantly improved the total volatile suspended solid reduction and the methane production [11]. Obviously, the aeration in the aerobic hydrolysis and acidification stages is of great significance for improving the AD performance of lignocellulose-rich raw materials. However, the particle size has a decisive effect on the aerobic hydrolysis and acidification process.
Many studies have proven that, regardless of the substrate, reducing particle size contributes to effective AD owing to providing larger surface area for the microorganism [12,13,14]. However, little research has been done on its effect on aerobic hydrolysis-acidification process. Moreover, it is a relatively high energy input step of AD. Therefore, there must be an optimal particle size to maintain the maximum net energy output between the energy consumption of the particle size reduction and the energy generated by the additional methane.
In conclusion, the objective of this study was to elucidate the effect of reducing particle size on the degradation of organic matter, micro-structure changes and biogas production during AAD process from RS. RS was pulverized with a hammer mill and sieved using four mesh apertures (1, 3, 5, and 7 mm) to obtain different particle distributions. The evaluation of pH, VFAs, degradation of lignocellulose, crystallinity index (CrI) were determined to interpret the mechanism of aerobic hydrolysis. The methane production tests were carried out to study the performance of particle sizes on AAD process. Path analysis was conducted to analyze the effect of the parameters (degradation of lignocellulose, reducing sugar, VFAs, and pH) after aerobic hydrolysis on the methane production.
16S rDNA technology was applied to investigate the microbial community structure and population dynamics. Furthermore, the energy balance analysis was also performed to obtain the optimum particle size in AAD process. We hypothesized that: (i) particle size reduction would improve degradation of lignocellulose, especially cellulose; (ii)small particle size would change bacterial community and promote aerobic hydrolysis and methane production potential; (iii) there would be an optimal particle size to balance the energy input and output.
2. Materials and Methods
2.1. Substrates and Inoculums
Naturally dried RS was obtained from the farm near Northeast Agriculture University, in Harbin, China. The aerobic inoculum was the supernatant taken from of the methanogenic phase reactor, while the anaerobic digestion sludge was from the large-scale methanogenic reactor using cow dung and corn stover as feedstock. The straw was pulverized by hammer mill (Model 9FQ-36B; motor power: 5.5 kW; Sida, Luoyang, China) with four different sieve sizes (1, 3, 5, and 7 mm in diameter) to obtain different PSD. The collected RS was placed in a sealed bag and the inoculums were stored in a refrigerator at 4 °C for further analysis. The main physicochemical properties were listed in Table 1.

Table 1.
Physicochemical properties of rice straw and inoculums.
2.2. Experimental Design
2.2.1. Aerobic Hydrolysis-Acidogenic Test
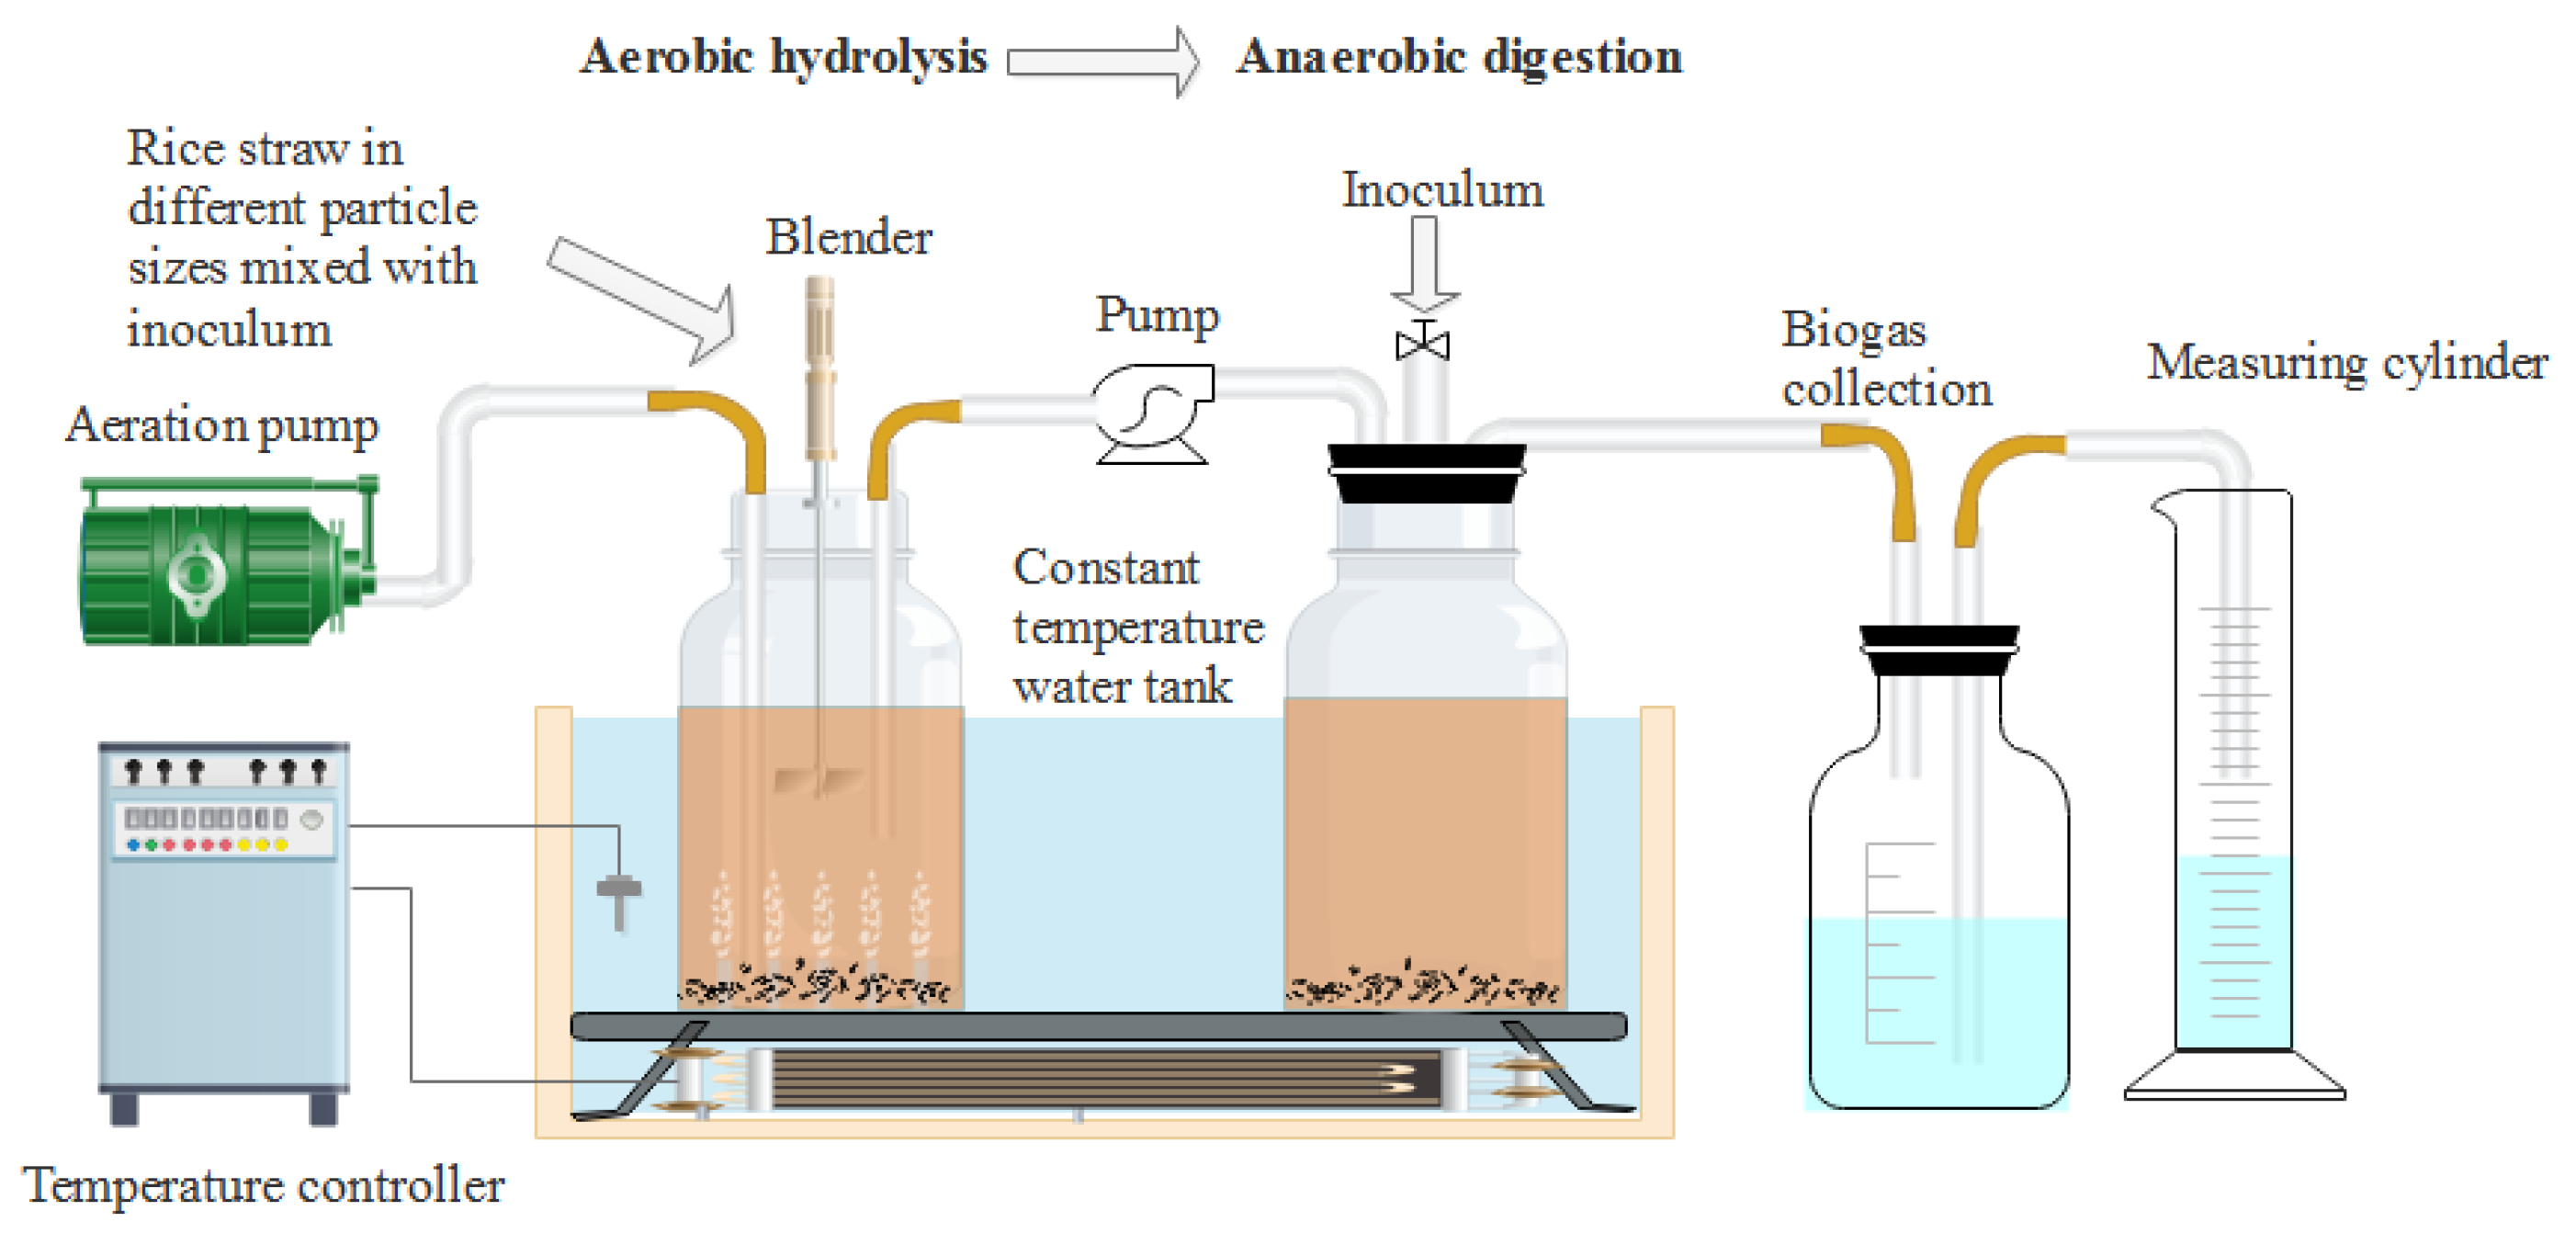
The experiments were divided into four groups: particle 1, particle 2, particle 3, and particle 4, corresponding to the treatment of crushing through 1, 3, 5, and 7 mm sieve sizes, respectively. 80 g milled RS of each group and 880 g aerobic inoculum (66.67 gVSadded) were thoroughly mixed and added to a 2.5 L hydrolysis and acidogenic reactor to adjust the TS to 8%. The blank group was not filled with rice straw and was added with the same amount of inoculum. The gas production of the blank group was deducted when calculating the gas production of different particle size groups. Air was injected into the above groups at a flow rate of 0.75 Lmin−1. The hydrolysis-acidogenic reactors were placed in a shaking water bath at 35 ± 1 °C for 24 h in triplicates to produce VFAs. A small amount of samples were taken to measure the pH value, VFAs contents, VS, degradation of lignocellulose, reducing sugar and microbial composition to evaluate the characteristics of aerobic hydrolysis-acidogenic process. The remaining substrates were transferred to the methanogenic reactor by the pump for subsequent AD experiments in a batch mode after 24 h. The experimental device used in this study was shown in Figure 1.
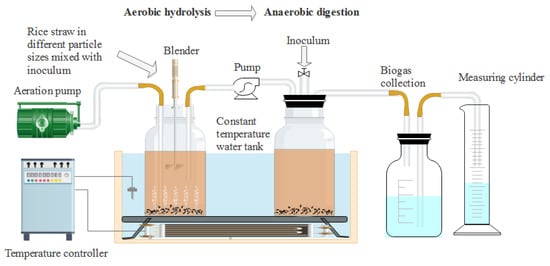
Figure 1.
Schematic diagram of the experimental device used in this study.
2.2.2. Anaerobic Digestion Test
The substrates after aerobic hydrolysis and acidogenic process were fully mixed with 900 g anaerobic inoculums (21.51 gVSadded) to start an AD process for 20 days at 35 ± 1 °C. The organic load rate (OLR) was 3.22 gVSL−1d−1. All groups were run in triplicates and were flushed with N2 for 5 min to maintain a strict anaerobic environment. Biogas in the headspace of the reactors was extracted using a sampling needle and was analyzed daily, while the changes of TS and vs. were monitored before and after the experiments.
2.2.3. Path Analysis
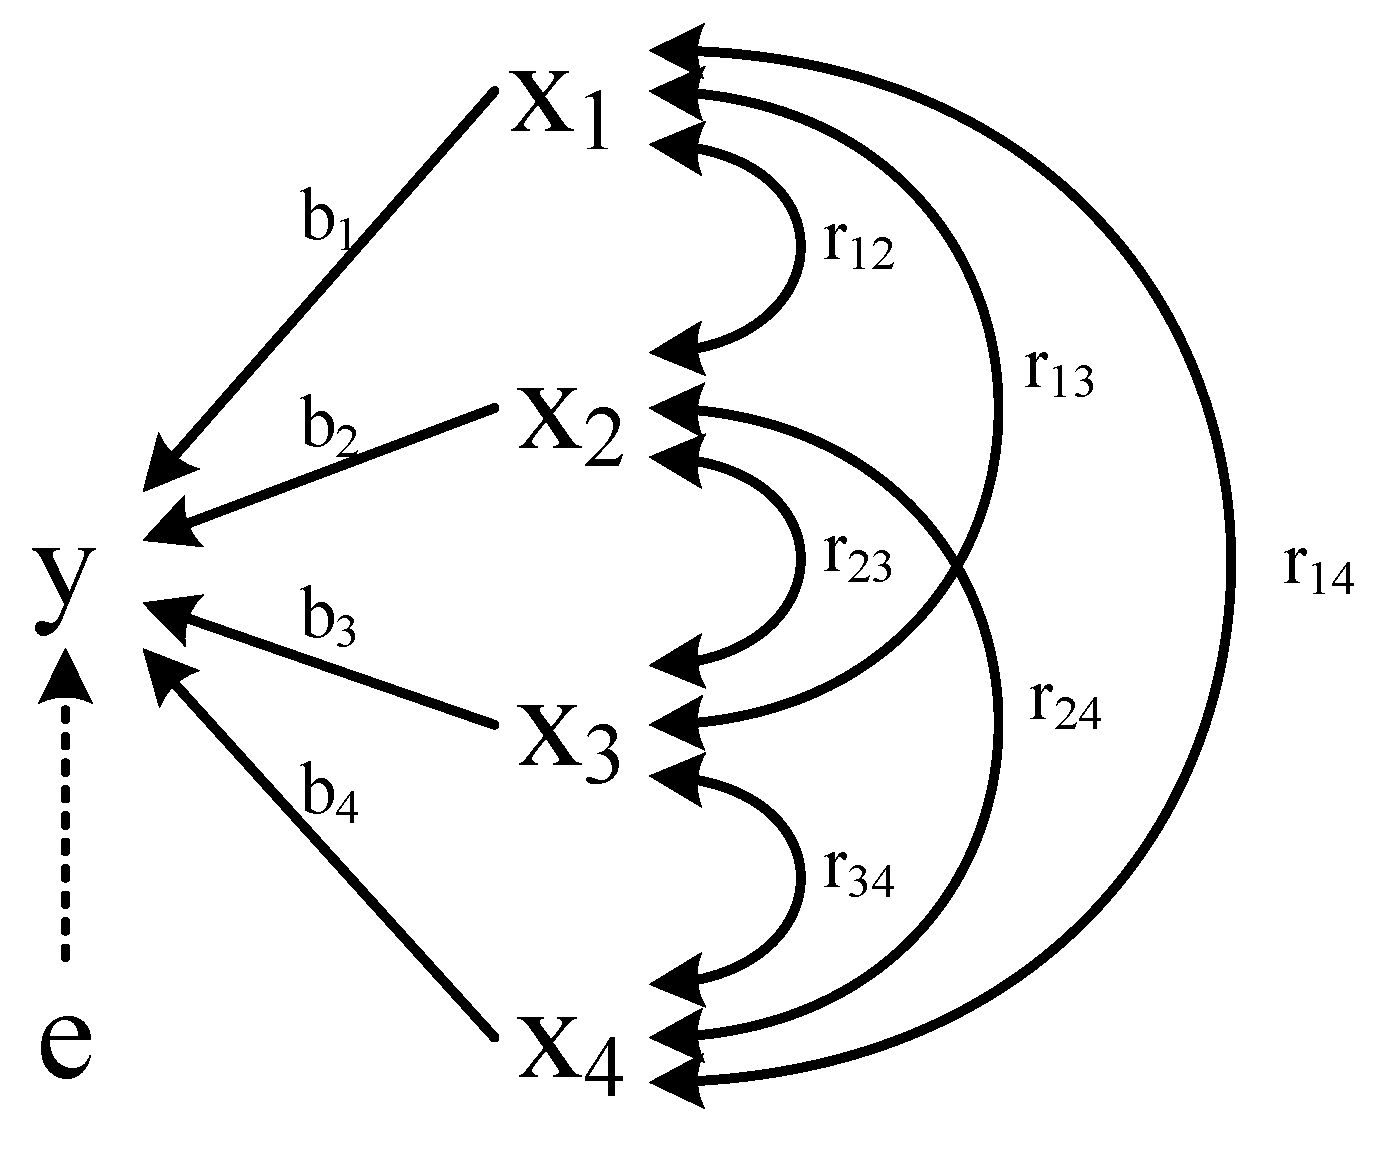
Path analysis can be used to analyze the linear relationship between multiple independent variables and dependent variables. It is an extension of regression analysis and can handle more complicated variable relationships. The relationships between exogenous variables and endogenous variable (BMP) were shown in Figure 2. The direct path was denoted as “←” indicating that there was a causal relationship between the independent variables, and the direction was from cause to effect. The indirect path “↔” was called correlation lines representing a parallel relationship between variables. Their importance was represented by bj and rjk. The independent variable, latent variable and dependent variable were marked by x, e, y, respectively [15]. The calculation method of path analysis was according to Formula (1) [16]:
where reflected the comprehensive action including the direct influence and indirect decision from the related factor xj on y, was the influence from xk to xj on y, rjy was the total effects from xj to y, and was the determination coefficient of xj to y.
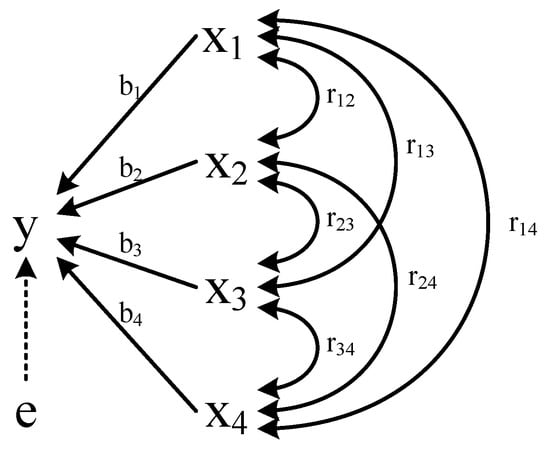
Figure 2.
Path coefficient analysis. Note: x1, x2, x3, x4, e, y represent lignocellulose degradation, VFAs content, reducing sugar, pH, residual path coefficient, BMP, respectively.
2.3. Analytical Methods
PSD of crushed rice straw was measured according to the standard method [17]. The energy consumed during the crushing process was measured using a power meter (AWS2103, OCT, China). The parameters such as the voltage (V), current (A), active electric energy (Wh), power factor, frequency (Hz) and time (t) were stored in real time. An XRD analyzer (X’PERT-PROMPO, PANalytical B.V., Almelo, The Netherlands) operated at 40 kV and 200 mA with Cu-Ka radiation at 1.54060 Å were used to detect the crystallization degree of the samples after aerobic-hydrolysis processes. The samples were scanned from 10° to 90° of diffraction angle (2θ) at a scanning speed of 2°min−1.
The total solids (TS), volatile solids (VS), and pH were measured according to APHA Standard Method [18]. The lignocellulose content was determined according to Van Soest with a fiber analyzer (Ankom 200i, Anke Borui Technologies Co., Ltd., Beijing, China). Reducing sugars were determined by NDS method. The volume of the biogas was measured by a water displacement method, which was corrected to the standard temperature and pressure (STP) conditions [19]. Biogas composition (H2, N2, CH4, and CO2) was determined via gas chromatography (GC-6890N, Agilent Inc., Santa Clara, CA, USA) using a thermal conductivity detector set to 220 °C and a packed column (TDX-01, 4 m × 3 mm, Harbin, China) with argon as the carrier gas at a flow rate of 30.8 mLmin−1. The temperature of the column and the injection port were set at 170 °C and room temperature, respectively. The ethanol and VFAs (acetic, propionic, butyric, and pentanoic) were measured by the same gas chromatography equipped with a Flame Ionization Detector (FID) and a capillary column (Agilent 122-7132-INT DB-Heavy WAX Polyethylene Glycol). The temperatures of injector port and FID detector were 220 °C and 250 °C, respectively. The programmed temperature of the oven was initially set to 60 °C for 1.2 min, and then increased to 140 °C at a rate of 15 °C min−1. Argon was used as the carrier gas at a flow rate of 30 mLmin−1.
16S rDNA sequencing technology was used to analyze microbial community diversity and shifts. Four samples of aerobic inoculum, particle 1 group at 1 h, particle 1 and particle 4 groups at 24 h in aerobic hydrolysis-acidification phase were selected for bacterial analyses, respectively. 515F (GTGCCAGCMGCCGCGG) and 907R (CCGTCAATTCMTTTRAGTTT) were used to amplify the V4–V5 region. Polymerase Chain Reaction (PCR) step was as follows: 94 °C for 120 s, 25 cycles of denaturation at 94 °C for 20 s, followed by 55 °C for 30 s and 72 °C for 60 s, and finally at 72 °C for 10 min. 16S rDNA sequencing was performed on an Illumina MiSeq Benchtop Sequencer by the Centre for Genetic & Genomic Analysis, Genesky Biotechnologies, Inc. (Shanghai, China).
2.4. Data Processing
2.4.1. Lignocellulosic Degradability
Lignocellulosic degradability was defined as Formula (2)
where M represented solid mass of RS, (Pj) was the percent of the composition for the total mass, i and r were initial and residual states of rice straw, respectively. (j = lignin, cellulose and hemicellulose).
2.4.2. Comparison with Removal after AAD
Removal after AAD was compared as Formula (3)
where VS(b-AAD) represented vs. of before AAD, VS(a-AAD) referred to vs. after AAD, VS(AI) and VS(AnI) were vs. of aerobic inoculum and anaerobic inoculum, respectively.
2.4.3. Methane Production
The modified Gompertz equation was used to fit the methane production of different particle sizes in the aerobic and anaerobic digestion shown in Formula (4) [20]
where P(t) was the cumulative methane production (mLg−1VS); P∞ was the total methane production potential (mLg−1VS); Rm was the maximum methane production rate (mLd−1g−1VS); λ was the lag-phase time (d); t was the elapsed time (d); and e was the Euler constant (2.718282).
2.4.4. First Order Kinetics of Biodegradable Substrate
First order kinetic was the simplest model used to describe the anaerobic digestion of complex organic matter, reflecting the cumulative effect of all micro-processes. The reaction rate was proportional to the amount of biodegradable substrate at time t. The first-order kinetic equation was shown in Formula (5) [21]
where s represented the amount of biodegradable substrate at time t (gVS); k was first-order substrate-degradation-rate constant (d−1).
For batch anaerobic digestion, the formula after integration was as
where s0 was the initial amount of biodegradable substrate (gVS).
When the rate of the substrate degradation and methane production were in equilibrium, the cumulative methane production could reflect the degradation rate of the substrate. The relationship between them was shown in Formula (7)
where P∞ was the total methane production potential (mLg−1VS); P(t) was the cumulative methane production (mLg−1VS). Combining Formulas (6) and (7), the first-order kinetic relationship between digestion time and cumulative methane production was
2.4.5. Crystallinity Index
Crystallinity index (CrI) of rice straw was calculated according to Formula (9) [22]. The CrI was a key factor in assessing the effectiveness of the pretreatment process.
where CrI represented the ratio of the crystalline regions to the total cellulose; I200 represented the total cellulose including crystalline and amorphous cellulose where the highest peak intensity of 2θ was usually obtained at ~22°; and Iam represented amorphous cellulose at ~18° of 2θ.
2.4.6. Energy Balance
Except for the crushing energy consumption, the input energy (such as heating, power pump, agitator, aeration pump, and other auxiliary equipment) of all groups were considered the same and heat recovery was also ignored. In summary, the energy balance was analyzed to assess whether the additional methane production obtained by reducing particle size was sufficient to meet the extra crushing costs. The crushing energy consumption and methane yield at different particle sizes were all measured by the experiments. The output energy was calculated according to the Formulas (10)–(12) [23,24], respectively
in which was the output energy (kJg−1 VS); was the lower heating value of methane (35.8 MJ m−3CH4) [25]; was the methane yield (mLCH4g−1VS) of each particle size group; an energy conversion efficiency () of 90% was also considered in this study; refers to different particle size groups, respectively, and represents excess energy needed to be consumed gradually from coarse to fine particle size; was the conversion of heat from methane combustion into electricity, is the conversion factor (0.4).
The crushing energy consumption was determined by the following formulas [26]
where was the crushing energy consumption based on fed vs. (kJ g−1 VS); was power in Watt consumed by hammer mill at time t, was the average power consumption in Watt under idle conditions of the hammer mill, was net power consumption in Watt at time t; and was dry matter mass in g of RS to be crushed, VS% was the mass fraction of vs. contained in the RS; was the input crushing energy increment for smaller particle size.
The net energy was the difference between the and and expressed as
2.4.7. Statistical Analysis
The experiment data were analyzed using Origin 8 (Origin Lab Corporation, Northampton, MA, USA). One way ANOVA of the collected data and path analysis were analyzed using IBM SPSS Statistics 21 software.
3. Results
3.1. PSD of Rice Straw
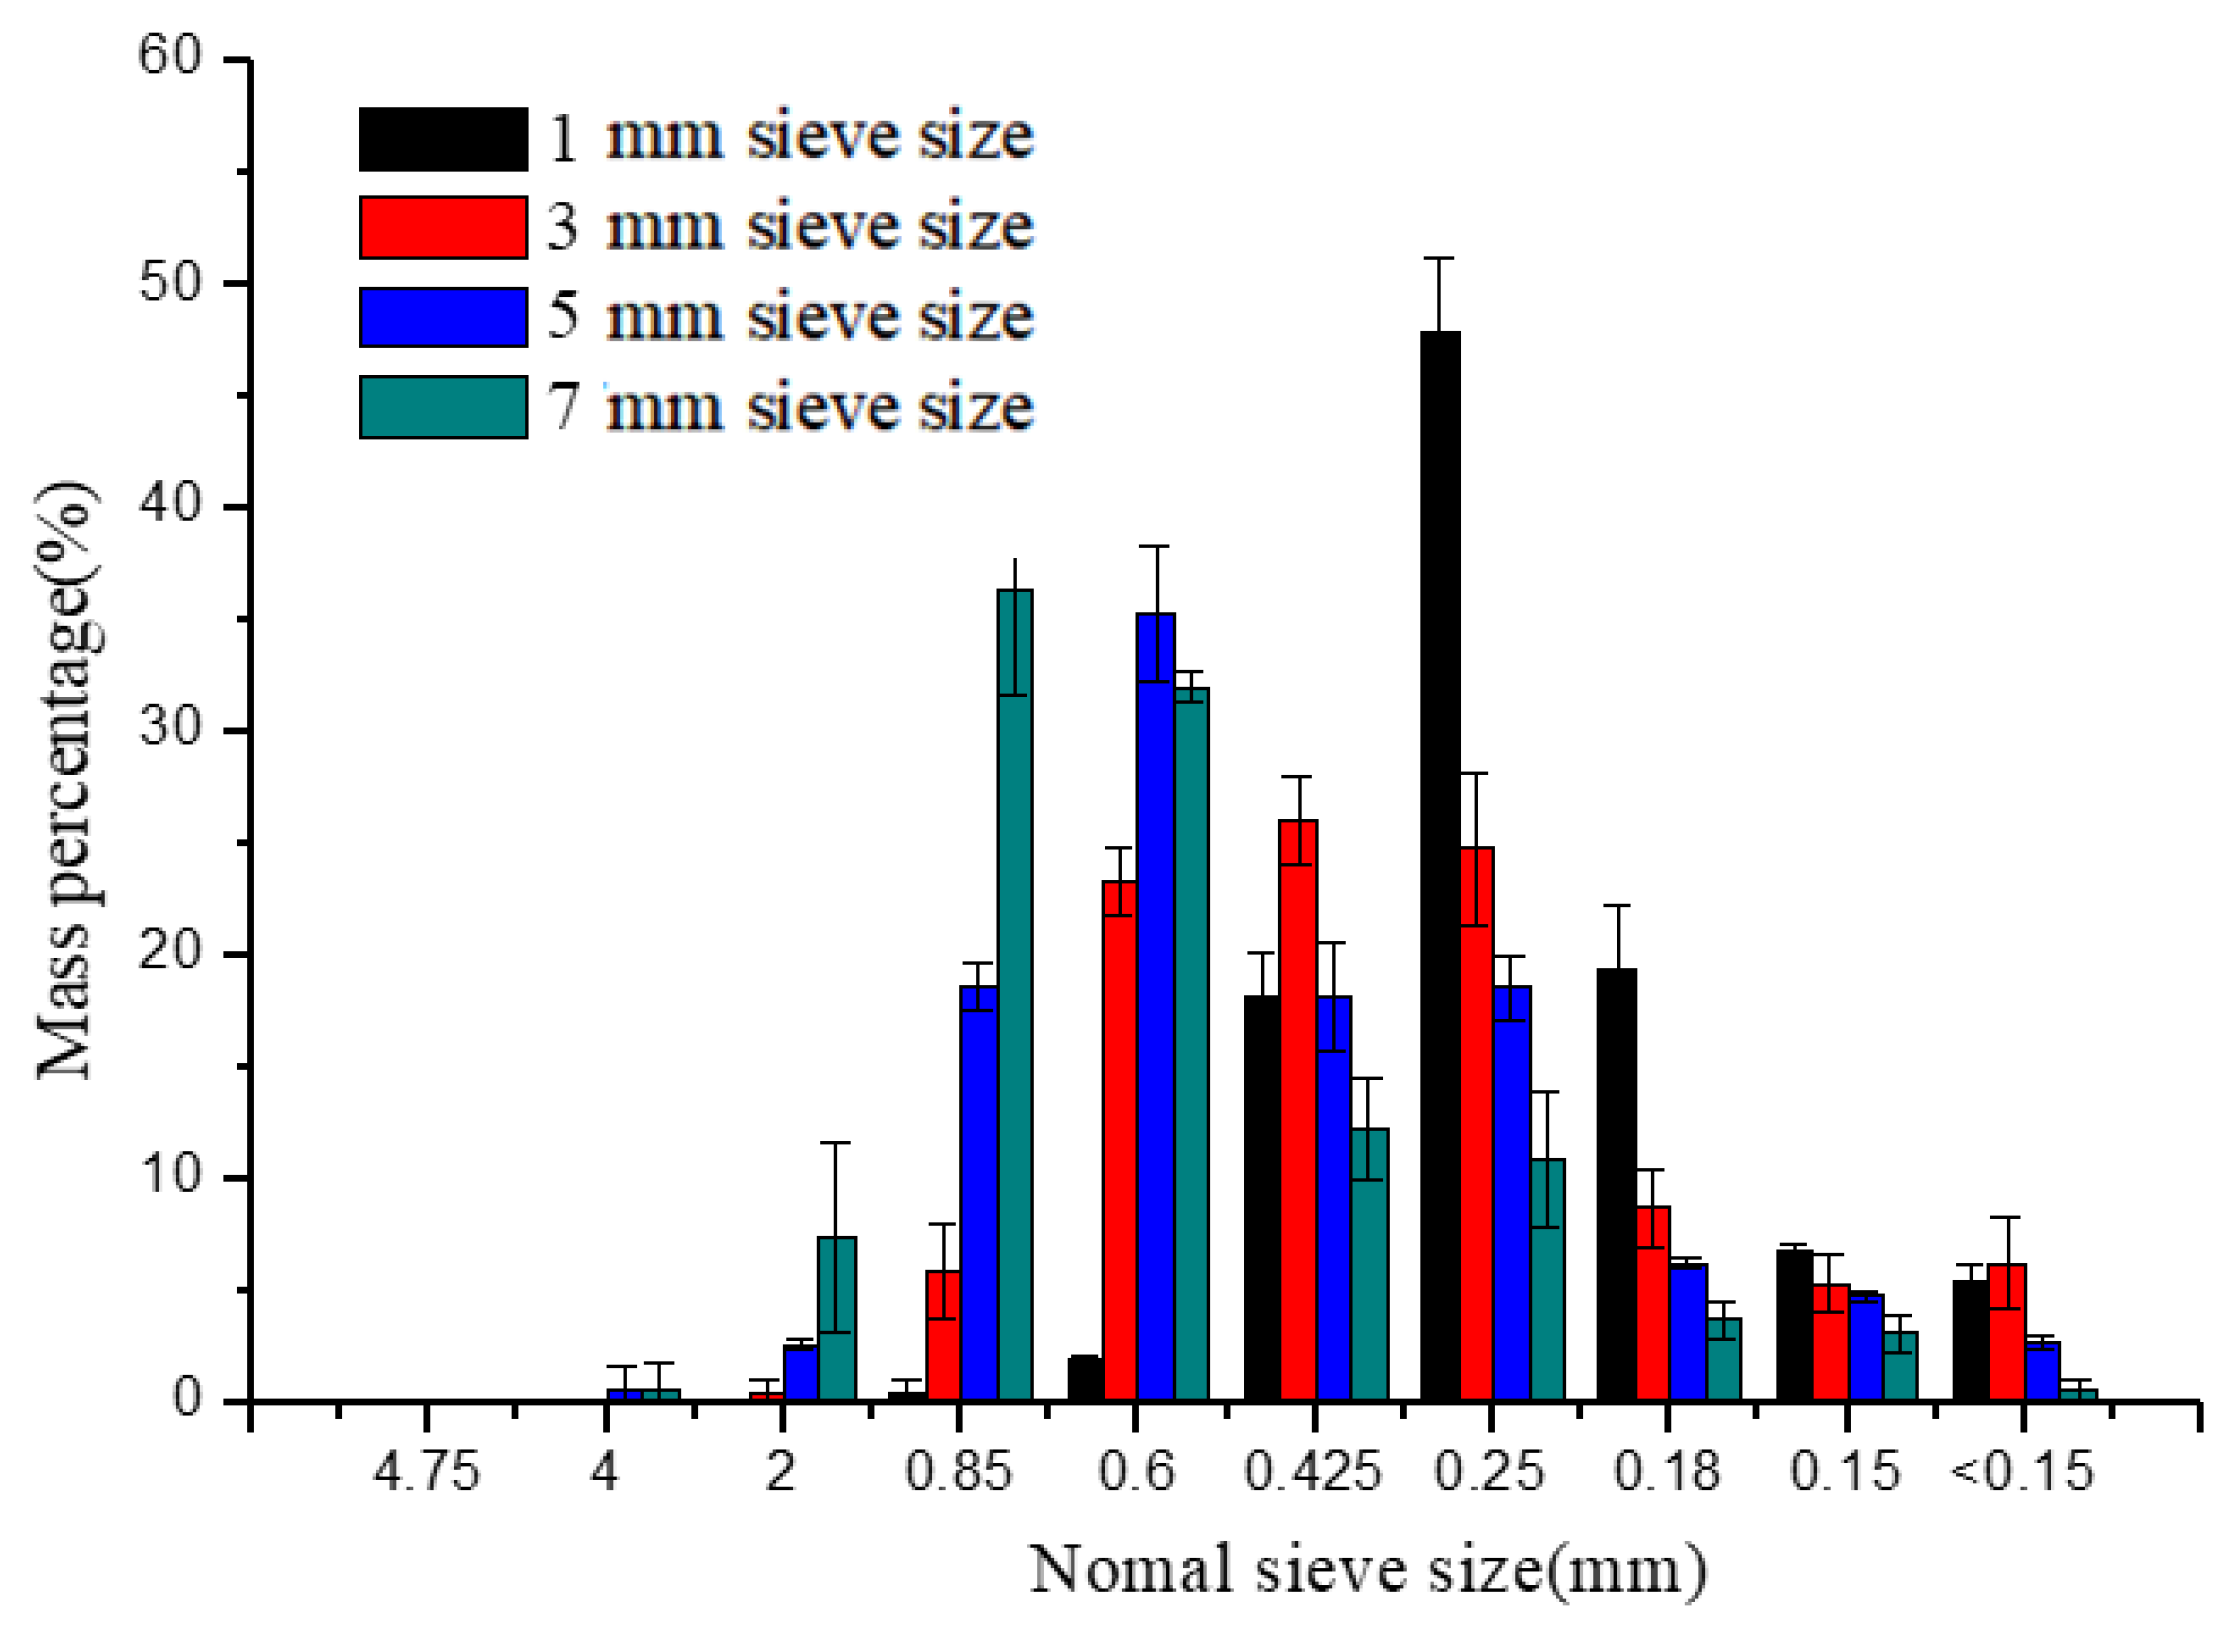
The percentages of particles retained on different-sized sieves of different groups were shown in Figure 3. As can be seen from Figure 3, micro-particles (<1 mm) accounted for more than 90% of the whole particles. The PSD was normally and logarithmic normally distributed as the previously reported [27]. The peak gradually moved backward when the sieve sizes were changed from 7 to 1 mm, illustrating that finer particle sizes were obtained. The most distributed particles were 0.85–2 mm and 0.6–0.85 mm at 7 and 5 mm sieve sizes, respectively. Whereas the mass percentages of 0.25–0.425 mm, 0.425–0.6 mm, and 0.6–0.85 mm particles had relatively small differences in the 3 mm sieve size group. The 0.25–0.425 mm particles accounted for 47.82% at the 1 mm sieve size showing that the particle sizes were in a narrower range than other groups.
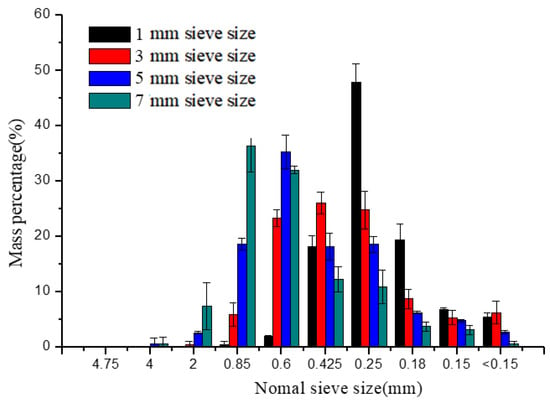
Figure 3.
Particle size distribution of different sieve sizes.
3.2. Influence of Particle Size on the Performance of Aerobic and Anaerobic Digestion Process
3.2.1. pH and VFAs Production
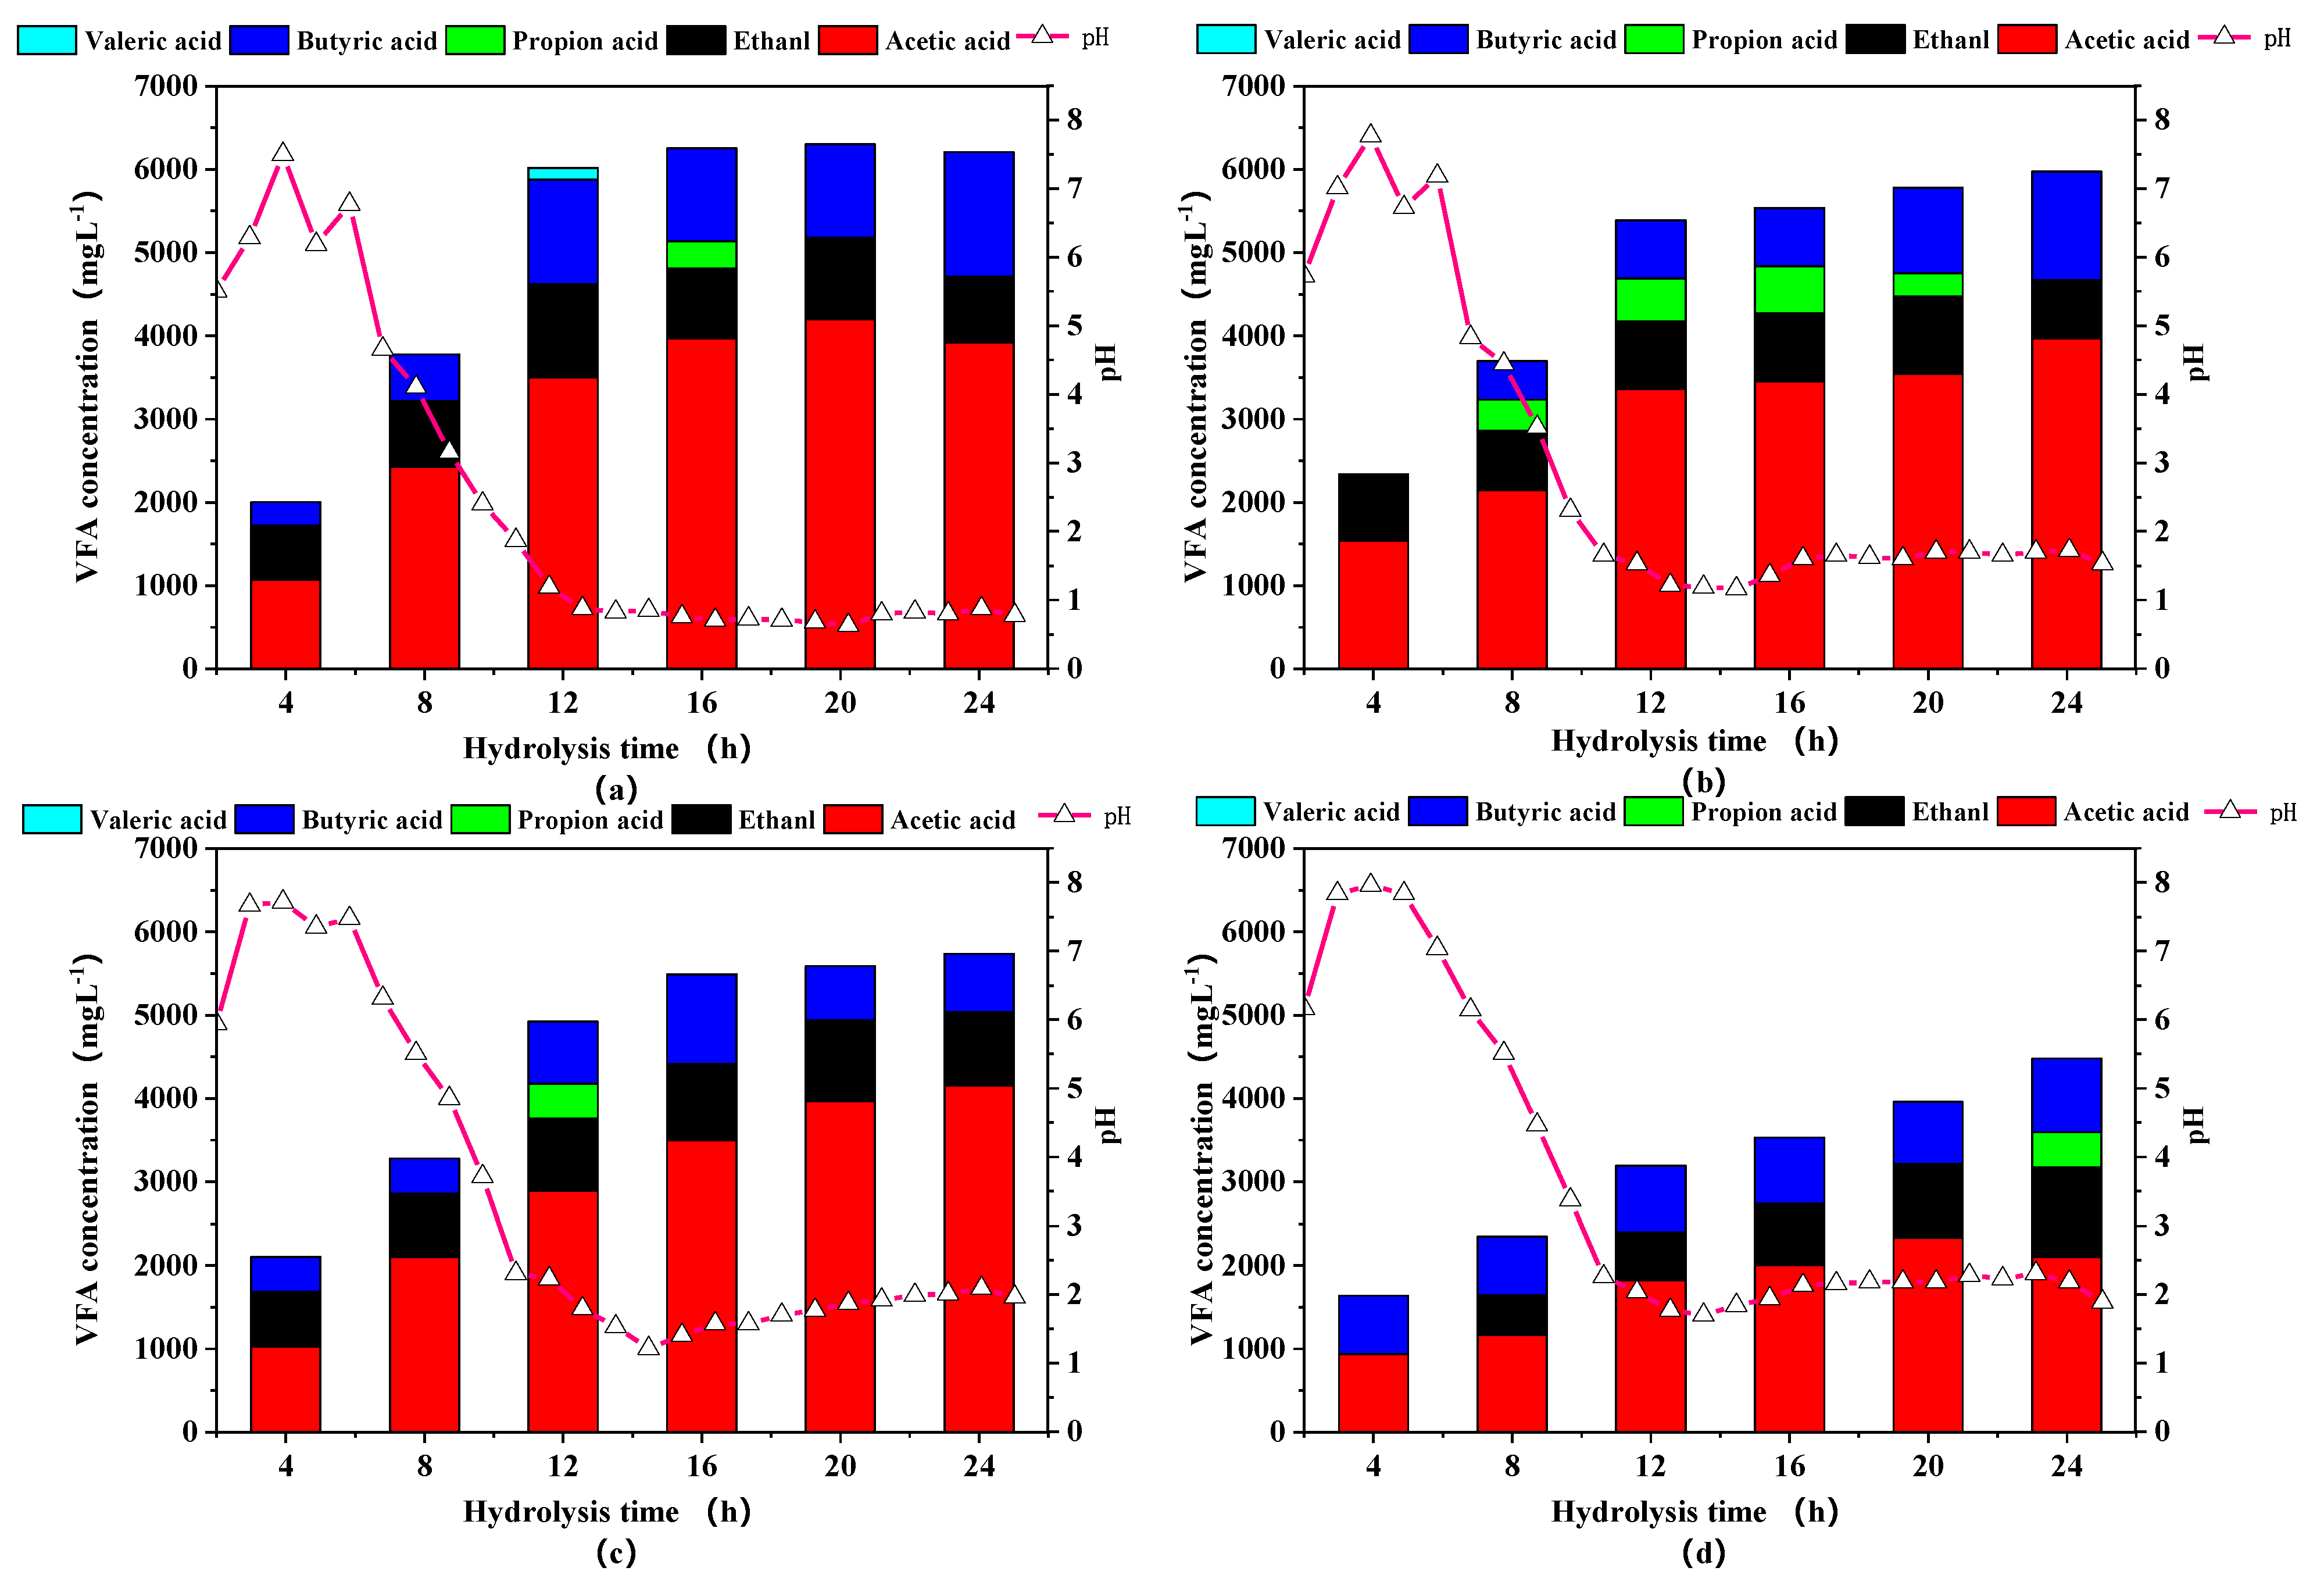
pH and VFA are two interrelated indicators that reflect the degree of hydrolysis and acidogenesis processes [28]. The changes of pH value and VFAs at different times in the aerobic hydrolysis and acidification process were shown in Figure 4. In comparison with the initial pH, the pH values of all groups showed a rapid upward trend in the first 4 h, which was speculated that the growth rate of protein ammoniated bacteria was higher than that of acid-producing bacteria, leading to higher production of alkaline substances and lower VFAs content. The above assumptions were also confirmed by the increase of Proteobacteria in the next part of the microbial community analysis. S. Montalvo et al. also proved that this pH increase could be explained by the generation of ammonia from hydrolysis of protein during the aeration phase [29]. Over 4–12 h, a large amount of hydrolyzed products were converted to volatile fatty acids resulting in a sharp drop in pH. After 12 h, the pH was basically stable between 5 and 6. As the particle size decreased, the pH value also decreased because more usable lignocellulose could be effectively converted to VFAs by the aerobic acid-generating bacteria.
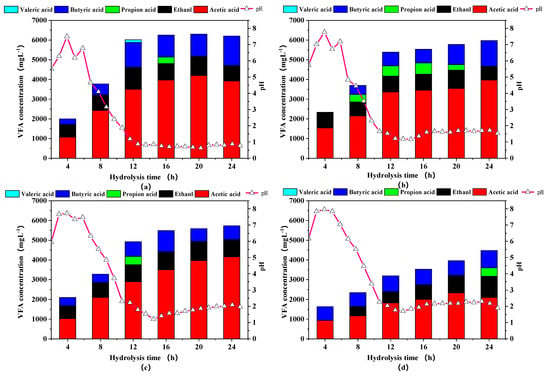
Figure 4.
Volatile fatty acids (VFAs) concentrations and pH of rice straw with different particle sizes in aerobic hydrolysis and acidification step. Notes: (a–d) are sieve size diameter of 1, 3, 5, 7 mm, respectively.
The particle size reduction significantly affected the production rather than the composition of VFAs. The percentage of acetate and butyrate in all groups generally changed from about 60% to 80% in this study, showing a stable acid production state [30,31,32]. Although propionic acid and valeric acid were briefly formed, they were quickly converted to acetic acid without inhibiting acidification process [33]. The concentrations of VFAs from particle 1 to particle 3 groups increased sharply in the first 12 h, then slowly stabilized. In contrast, the VFAs concentration in particle 4 group continuously increased by the end of the hydrolysis, illustrating that fine pulverization could destroy the structure of lignocellulose to the greatest extent, shorten the hydrolysis and acidification time, promote solubilization and increase the yield of VFAs, due to greater contact area between microorganisms and substrates. The maximum content of the VFAs content of 6225.15 mgL−1 was obtained at particle 1 group, 41.20% higher than the particle 4 group, which was similar to Dai et al. [34].
3.2.2. Lignocellulose Degradability and vs. Removal
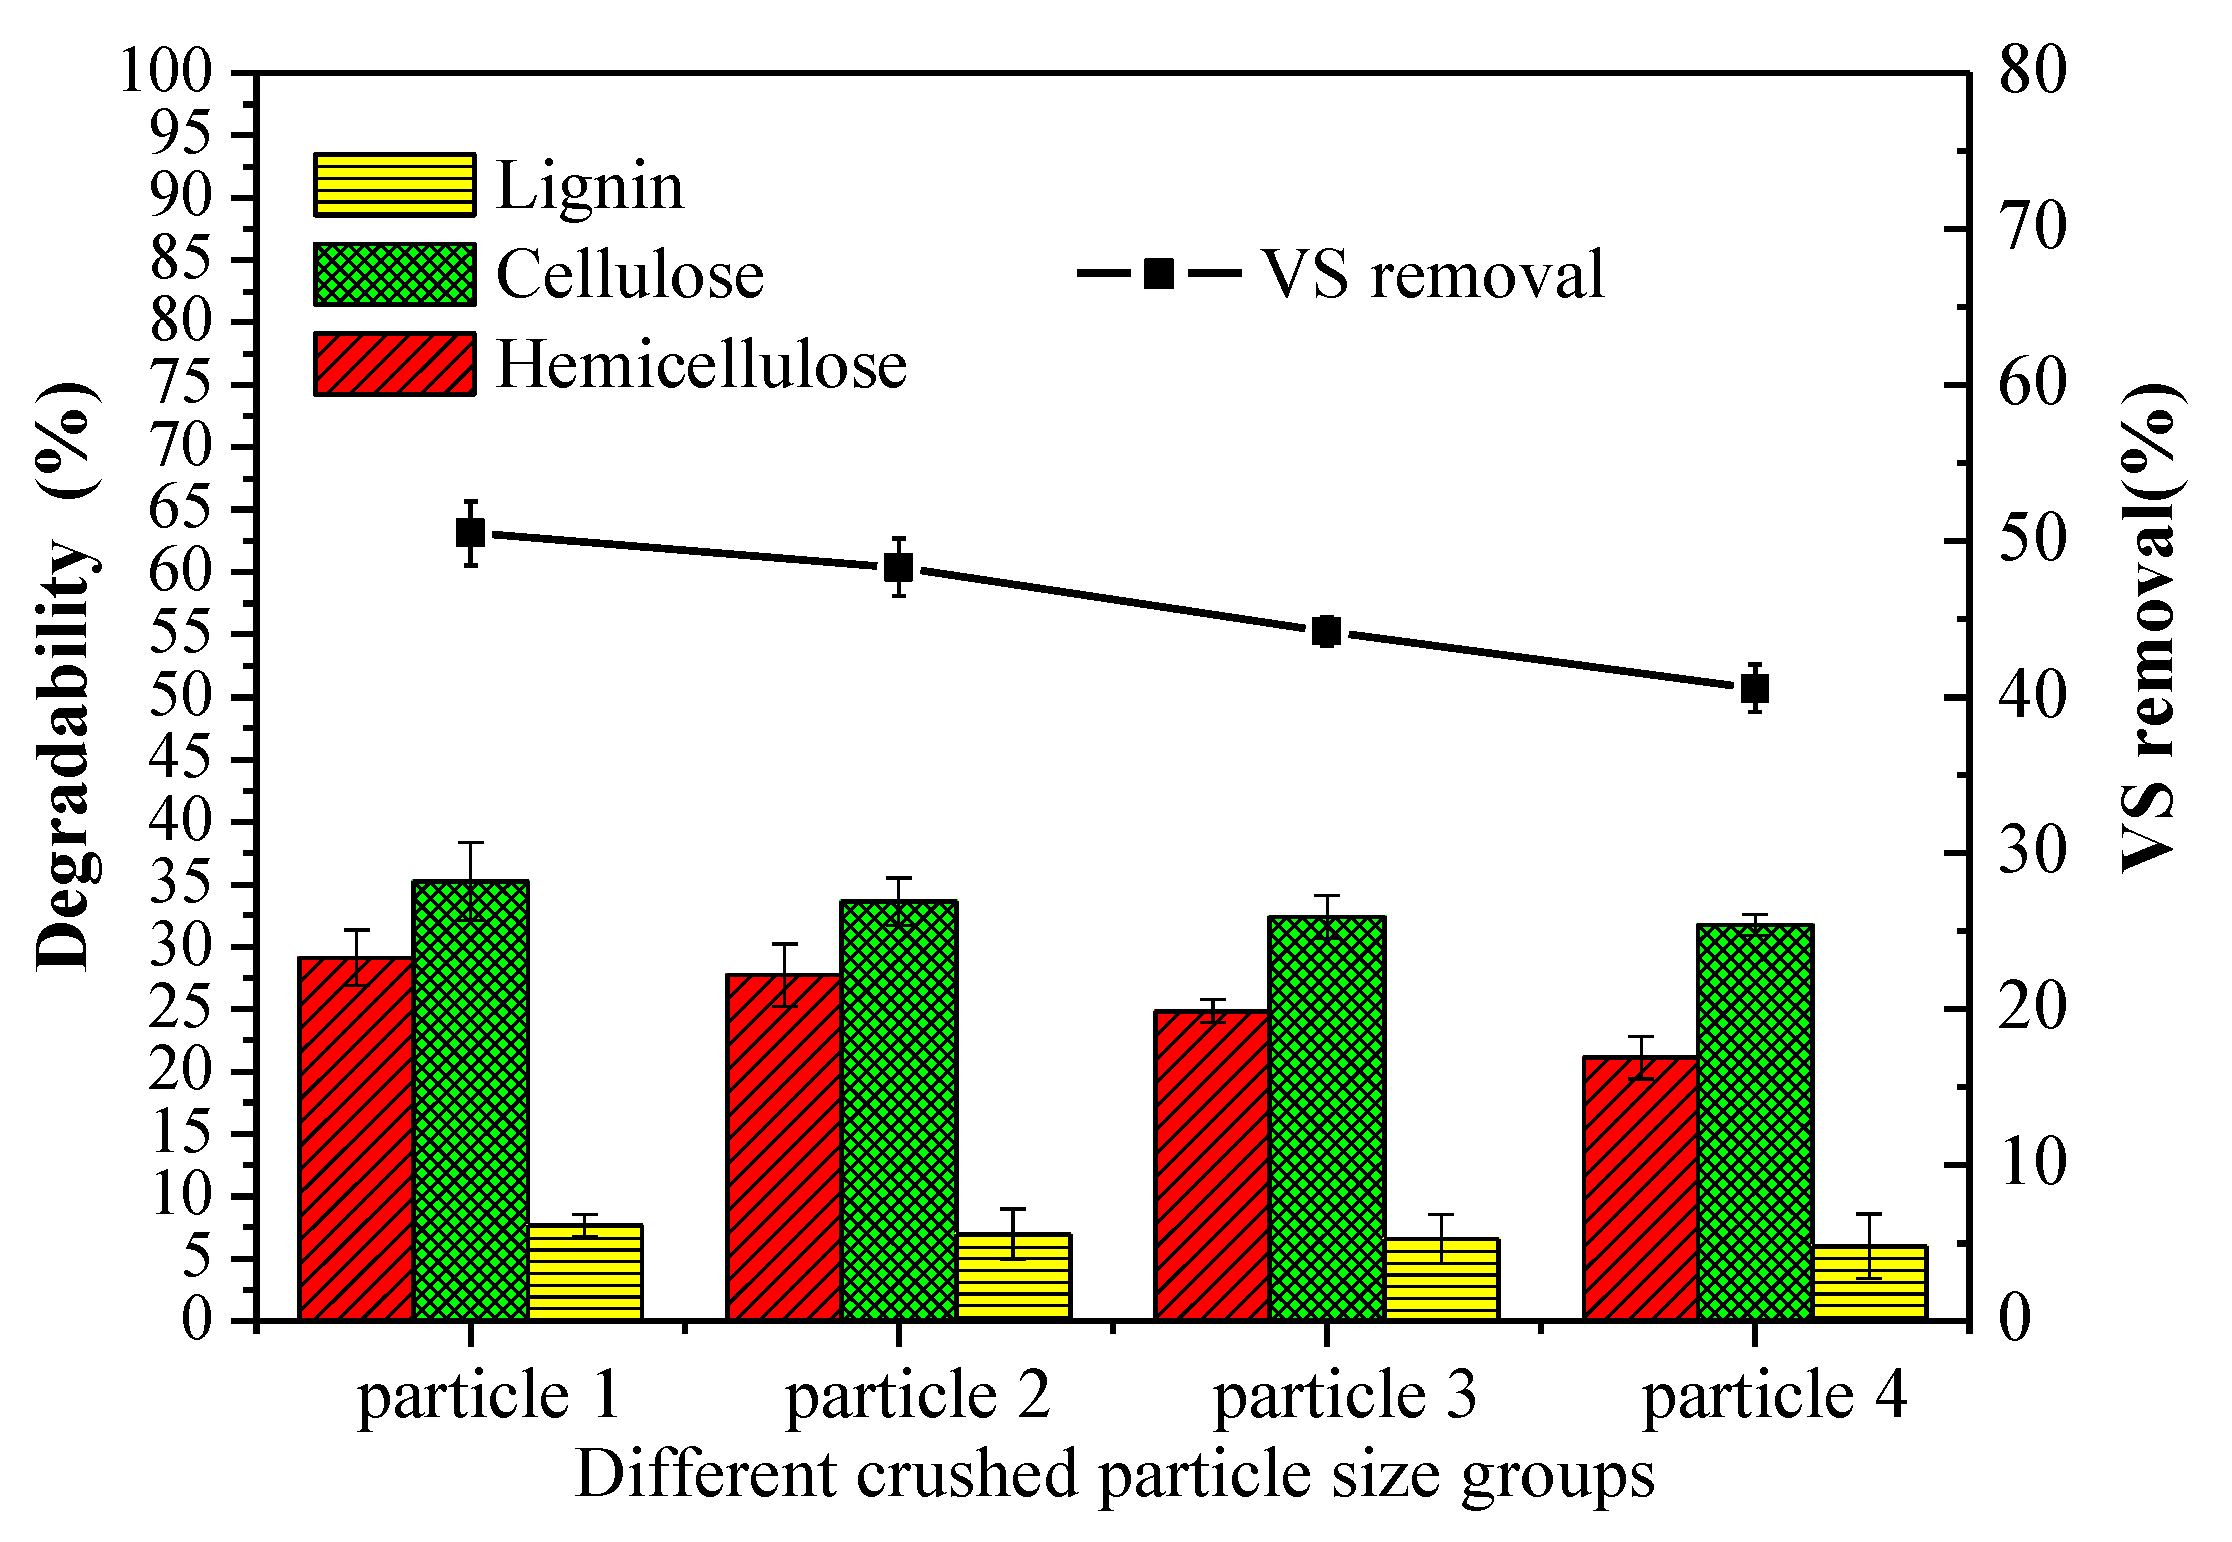
Figure 5 showed that the lignocellulose degradability from high to low was hemicellulose, cellulose and lignin, which were 21.10–29.12%, 31.75–35.21%, and 6.01–7.64%, respectively. The highest lignocellulose degradability was obtained in particle 1 group, demonstrating that the reduction in particle size favored the organic degradation. The degradation of lignin, cellulose, and hemicellulose at the optimum condition was 7.64%, 35.21%, and 29.12%, respectively. Reducing particle size leads to more severe lattice distortion and a lower degree of polymerization, which are beneficial to undermine the bond between cellulose and other ingredients, promoting cellulose degradation [35]. The results of statistical significance of cellulose, hemicellulose, and lignin showed that particle size had a significant impact on the degradation of cellulose, hemicellulose (p = 0.02, p = 0.004), compared with lignin (p = 0.781). According to the published studies [35,36], the lignin can be significantly broken down by enhanced extracellular hydrolytic enzymes in the presence of oxygen.
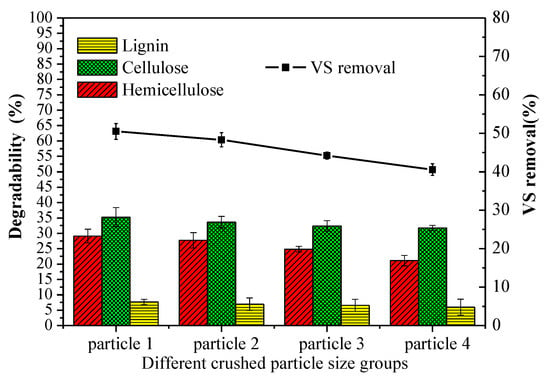
Figure 5.
Degradability of lignocellulose after aerobic hydrolysis and acidification and vs. removal after AAD of different particle sizes. Notes: particle 1–4 represent sieve size diameter of 1, 3, 5, 7 mm group, respectively.
The higher vs. removal was attributed to more soluble substrates produced in the aerobic hydrolysis-acidification process. Therefore, the data indicated that vs. removal increased with decreasing the particle size. The vs. removal usually occurred in the anaerobic digestion phase instead of aerobic hydrolysis and acidification process (about 1%). The vs. removal of different particle groups was from 40.56% to 50.49% after anaerobic digestion, which was comparable to the previous studies [34]. The highest vs. removal in particle 1 group was 4.49%, 14.26%, and 24.48% higher than that of particle 2, particle 3, and particle 4 groups, respectively.
3.2.3. Crystallinity Index
In order to further understand the microstructural changes, a widely used and crucial factor XRD was used to assess the structural changes of rice straw after the hydrolysis-acidification process [37]. The results of XRD at different particle size groups were shown in Table 2. Compared to the untreated rice straw, the CrI in all particle size groups decreased from 24.65% to 15.31–21.61%, indicating a decrease of 12.33–37.89%. Obviously, the properties of RS were significantly altered by reducing particle size after aerobic hydrolysis and acidification process, indicating that more crystallized cellulose can be utilized [38].

Table 2.
Crystallinity index at different particle size groups after the hydrolysis and acidification process.
3.2.4. Methane Yield
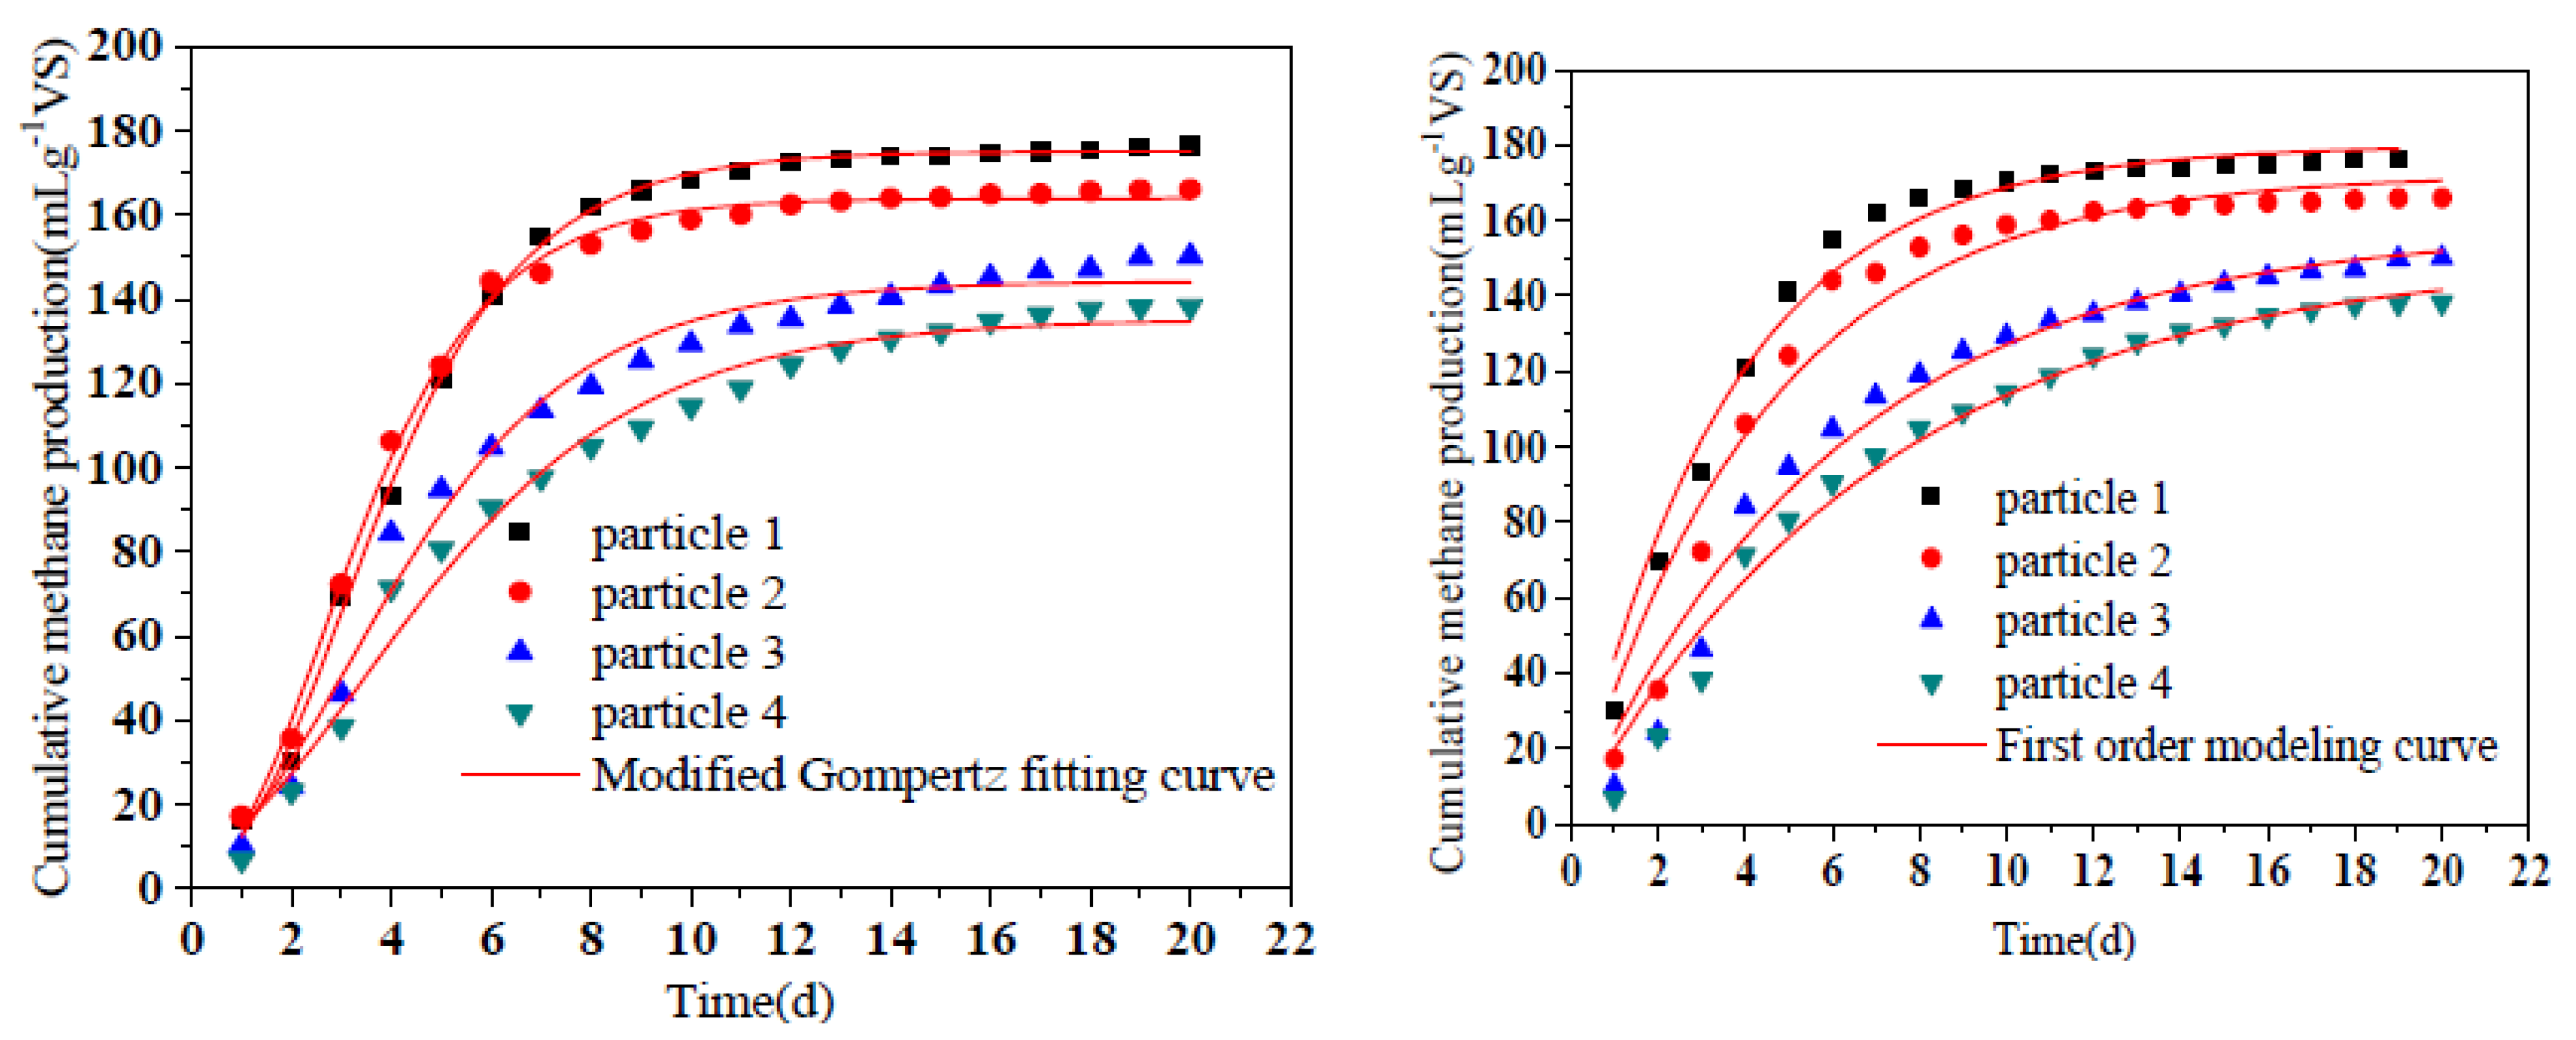
The methane production and the fitting data of the modified Gompertz equation were shown in Figure 6 and Table 3. The coefficients R2 of the modified Gompertz equation were all above 0.98, suggesting that the equation can fit the cumulative methane trend well. The lag time was slightly prolonged with the decrease of particle size in this study. These phenomena turned our insight into the small loss of solubility during the aerobic hydrolysis and acidification process. Easily degradable substances were converted into mixed gases, which were lost to the surrounding air during ventilation. It was apparent that greater losses would be obtained at smaller particle sizes, leading to a longer lag time in the following anaerobic digestion stage. Generally, the lag time of all groups was less than 1 d, indicating that hydrolyzed products were immediately transformed to biogas by the methanogens [39]. The cumulative methane yields of the experimental values were 176.47, 166.07, 150.15, and 138.24 mLCH4g−1VS, respectively. Xiao et al. found that the highest cumulative methane yield was obtained at the particle size of 0.25–1.0 mm which was constant with this study [40]. Moreover, Rm values represented for the maximum daily methane production rate, ranging from 16.22 to 33.10 mLd−1g−1VS. The statistical analysis (ANOVA) of the P∞ value of the modified Gompertz model and the first-order model represents the total methane production potential, indicating that reducing the particle size has a significant effect on the methane production of RS. According to the results of the first-order model, substrate-degradation-rate constant k was in the range of 0.14 d−1 to 0.28 d−1. The amount of methane production in first-order kinetic could directly reflect the degradation rate of the substrate. The increase of the k constant indicated that reducing particle size contributed to accelerating the degradation rate of substrate in AAD process. R2 of first-order kinetics were lower than modified Gompertz kinetics indicating that first-order kinetics were more suitable for estimating the degradation of substrates with infinite cell or enzyme concentration than the AAD process of lignocellulosic-contained materials.
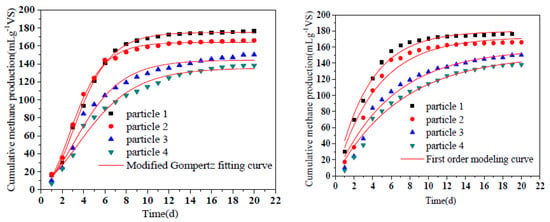
Figure 6.
Methane production of different particle sizes in AAD process. Notes: particle 1-4 represent sieve size diameter of 1, 3, 5, 7 mm group, respectively.

Table 3.
Kinetic parameter of methane production in different particle size groups.
3.2.5. Relationships between the Parameters after Aerobic Hydrolysis and BMP
Path analysis was used to elucidate the relationship between the substrate after aerobic hydrolysis (lignocellulose degradation, VFAs, reducing sugar, and pH) and BMP. As shown in Table 4, the correlation coefficients between the lignocellulose degradation, VFAs, reducing sugar, pH and BMP were 0.8330, 0.8930, 0.372, and −0.763, respectively. The direct influence of lignocellulose degradation, VFAs, reducing sugar, pH on BMP were 1.315, 0.027, −0.692, and −0.046, respectively. The direct and indirect influence of lignocellulose degradation to make decisions for BMP were both the highest (1.315 and 1.1875), which indicated that lignocellulose degradation after aerobic hydrolysis was the primary factor to improve BMP. Aerobic hydrolysis could change the structure of lignocellulose making it easier to contact with the hydrolysis of bacteria [41]. The established regression equation for the effect of lignocellulose degradation, VFAs, reducing sugar and pH on the BMP was as follows:

Table 4.
Path analysis.
3.2.6. Shifts of Bacterial Community
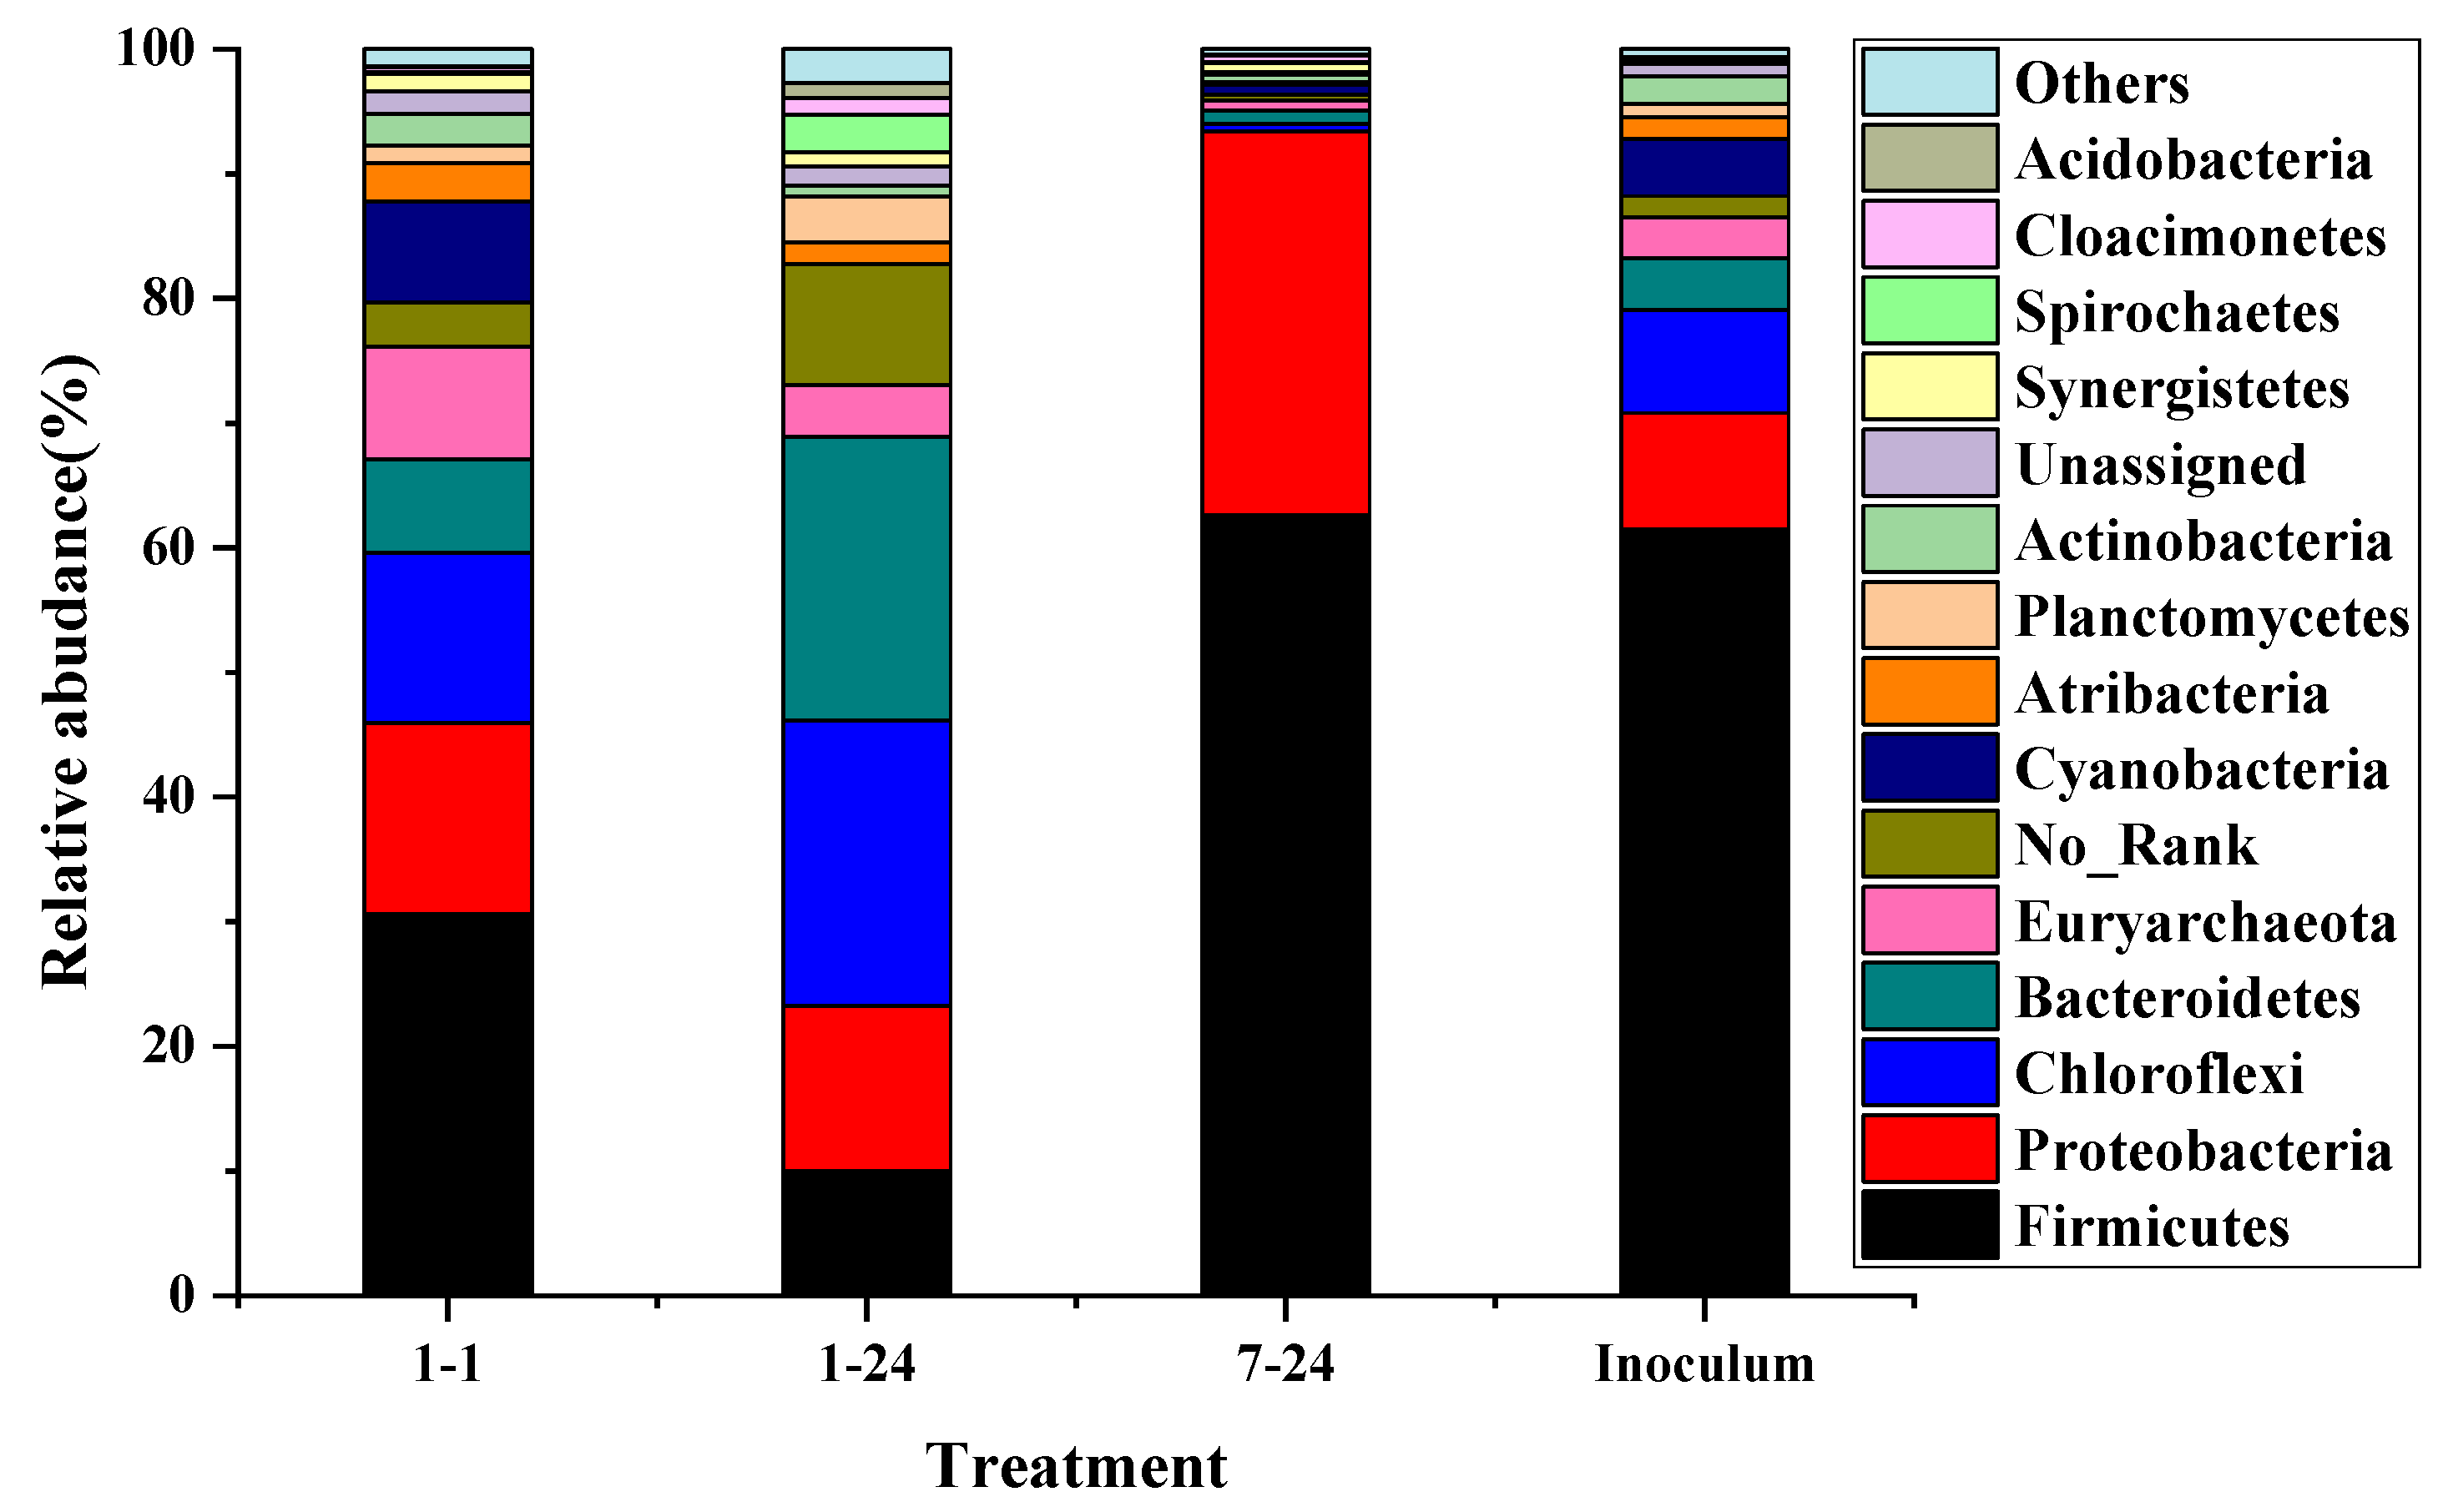
The typical groups were selected to analyze the changes of the microbial community. From Figure 7, the particle size led to significant effects on the bacterial diversity. The most dominant phyla of 1 mm sieve size group at 1 h were Firmicutes (61.5%), followed by Proteobacteria (9.3%), Chloroflexi (8.3%), Bacteroidetes (4.1%), Cyanobacteria/Chloroplast (4.6%), Atribacteria (1.1%), Planctomycetes (1.1%), and Actinobacteria (2.2%), which was similar to that in inoculum. However, the relative abundance has changed dramatically. The proportion of Firmicutes was reduced to 30.6%, while the relative abundance of Bacteroidetes increased sharply by 81%. Previous studies have shown that Firmicutes and Bacteroidetes phylum played a crucial role in the hydrolysis of hemicellulose, cellulose and other polysaccharides [19,41]. Firmicutes also played important roles in the hydrolysis of lignocellulose materials. In addition, the population of Proteobacteria was approximately 64.6% higher than the inoculum, which was responsible for controlling the VFA concentration and maintaining a balance between the substrate and product. The relative abundance of Planctomycetes was increased from 1.1% to 1.4%. Proteobacteria and Planctomycetes were related to the transformation of NO2-N to NO3-N during the composting process, which demonstrated that protein was first hydrolyzed under the aerobic condition in this study resulting in an increase in pH. When the hydrolysis time was 24 h, the relative abundance of Firmicutes was further reduced to 9% due to the reduced hydrolysis rate of lignocellulose and the completion of the hydrolysis reaction. The relative abundances of Bacteroidetes and Chloroflexi were increased to 22.9% and 22.7%, respectively. By reviewing the Berger Bacterial Identification Manual, most bacteria of Bacteroidetes and Chloroflexi phylum were aerobic microorganisms that thrived under aerobic conditions. Chloroflexi was reported to be associated with the bacterial function of carbohydrate metabolism [19]. In contrast, the microbial diversity was significantly reduced at the 7 mm sieve size. The total amount of Firmicutes and Proteobacteria accounted for over 90% of the total bacteria, indicating that the hydrolysis and acidification reaction was still in progress. Larger particle sizes limited the contact of microorganisms with the substrate, reduced the efficiency of hydrolysis and acidification, and led to a decrease in microbial diversity. The synergistic effects of various microorganisms were more conducive to the overall stability of the aerobic hydrolysis and acidification process.
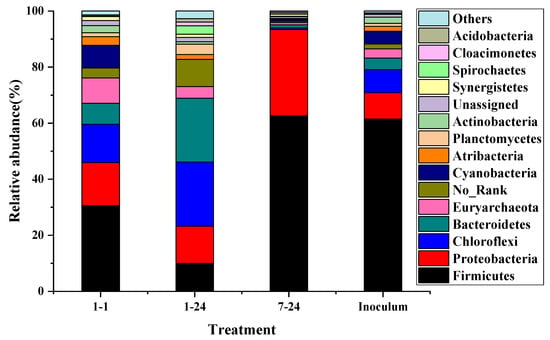
Figure 7.
Relative abundances of phylum in each sample; 1–1 represents for particle 1 group at 1 h hydrolysis time; 1–24, 7–24 represents particle 1 group and particle 4 group at 24 h hydrolysis time, respectively; inoculum represents the aerobic inoculum.
3.2.7. Energy Balance Assessment
The energy balance of different particle size groups was shown in Table 5. The detected specific energy consumption for crushing rice straw with the hammer mill screen sizes of 1, 3, 5, and 7 mm were 82.14, 38.49, 27.57, and 20.68 kWh t−1, corresponding to 0.37, 0.17, 0.12, and 0.09 kJg−1VS, respectively. From Table 4, the net energy of Particle 2 and Particle 3 group were positive, which indicated that the improvement in methane production by reducing particle size was enough to deduct the additional input energy. However, due to extremely high pulverization energy consumption, a negative net energy was observed when the particle size is 1 mm. Moreover, the service life of the crusher would be shortened if smaller sieve size was used.

Table 5.
Energy balance of different particle size groups.
4. Conclusions
- (1)
- The particle size distribution was in a narrower range under smaller sieve sizes. The most distributed particles were 0.25–0.425 mm, 0.425–0.6 mm, 0.6–0.85 mm, and 0.85–2 mm in the 1, 3, 5, 7 mm sieve size group indicating the peak gradually moved backward.
- (2)
- The particle size reduction significantly affected the production rather than the composition of VFAs. VFAs were all composed of acetic acid, propionic acid and butyric acid. The maximum content of the VFAs content of 6225.15 mgL−1 was obtained at particle 1 group, 41.20% higher than the particle 4 group, indicating that smaller screen aperture could shorten the hydrolysis and acidification time, promoted solubilization and increased the yield of VFAs.
- (3)
- The particle size had a significant impact on the degradation of cellulose, hemicellulose. The methane yields were improved as the particle size gradually decreased. The 1 mm sieve size group enhanced the methane yield by approximately 6.26%, 17.53%, and 27.65% in comparison with 3, 5, 7 mm sieve size.
- (4)
- The shorter the aerobic time and the larger the sieve aperture, the microbial flora distribution of the group was similar to that of the inoculum. The most dominant phyla were Firmicutes (61.5%), Proteobacteria (9.3%), Chloroflexi (8.3%), Bacteroidetes (4.1%), Cyanobacteria/Chloroplast (4.6%), Atribacteria (1.1%), Planctomycetes (1.1%), Actinobacteria (2.2%).
- (5)
- Although the highest methane yield was observed at 1 mm sieve size group, the net energy balance decreased because of the improvement in crushing energy consumption. To sum up, 3 mm was the most suitable sieve size for further application.
This study provides novel insights into mechanical pre-treatment of AAD process. The ideal cutting length of 3 mm leads to a substantial increase in methane production and an increase in power balance. It provides some basic data for the application of mechanical pretreatment in the actual-scale AAD process biogas plant.
Author Contributions
L.L., Y.Q., W.L. and Y.S. conceived and designed the experiments; L.L., W.G. and L.Q. carried out the experiments; L.L., Y.Q., W.G. and L.Q., devoted to reagents/materials/analysis tools; L.L. was responsible for the data analysis and writing the paper. All authors have read and agreed to the published version of the manuscript.
Funding
This research received no external funding.
Institutional Review Board Statement
Not applicable.
Informed Consent Statement
Not applicable.
Data Availability Statement
MDPI Research Data Policies.
Acknowledgments
The authors are grateful for the support of the National Key R&D Program of China (2019YFD1100603), the Science and technology plan of Heilongjiang Province (YS20B01), “Academic Backbone” Project of Northeast Agricultural University (20XG06), the China Scholarship Council (201906615023) and “Heilongjiang Key Laboratory of Technology and Equipment for the Utilization of Agricultural Renewable Resources”.
Conflicts of Interest
The authors declare no conflict of interest.
Abbreviations
| BMP | Biochemical methane potential |
| AAD | Aerobic-anaerobic digestion |
| AD | Anaerobic digestion |
| RS | Rice straw |
| PSD | Particle size distribution |
| VFAs | Volatile fatty acids |
| VS | Volatile solids |
| TS | Total solids |
| TC | Total carbon |
| TN | Total nitrogen |
| OLR | Organic load rate |
| TCD | Thermal conductivity detector |
| STP | Standard temperature and pressure |
| FID | Flame ionization detector |
| PCR | Polymerase chain reaction |
| CrI | Crystallinity index |
References
- Wang, D.; Jiang, Z.; Li, B.; Wang, G.; Jiang, Y. Experiment on sliding friction characteristics between rice straw and baler steel-roll. Trans. CSAE 2017, 33, 44–51. [Google Scholar]
- Mustafa, A.M.; Poulsen, T.G.; Sheng, K. Fungal pretreatment of rice straw with Pleurotus ostreatus and Trichoderma reesei to enhance methane production under solid-state anaerobic digestion. Appl. Energy 2016, 180, 661–671. [Google Scholar] [CrossRef]
- Zhao, R.; Zhang, Z.Y.; Zhang, R.Q.; Li, M.; Lei, Z.F.; Utsumi, M.; Sugiura, N. Methane production from rice straw pretreated by a mixture of acetic–propionic acid. Bioresour. Technol. 2010, 101, 990–994. [Google Scholar] [CrossRef]
- Sun, Y.; Zhang, Z.Z.; Sun, Y.M.; Yang, G.X. One-pot pyrolysis route to FeN-Doped carbon nanosheets with outstanding electrochemical performance as cathode materials for microbial fuel cell. Int. J. Agric. Biol. Eng. 2020, 13, 207–214. [Google Scholar]
- Wang, Z.; Liu, Z.Y.; Noor, R.S.; Cheng, Q.S.; Chu, X.D.; Qu, B.; Zhen, F.; Sun, Y. Furfural wastewater pretreatment of corn stalk for whole slurry anaerobic co-digestion to improve methane production. Sci. Total Environ. 2019, 674, 49–57. [Google Scholar] [CrossRef]
- Luo, L.N.; Gong, W.J.; Qin, L.Y.; Ma, Y.W.; Ju, W.C.; Wang, H.Y. Influence of liquid- and solid-state coupling anaerobic digestion process on methane production of cow manure and rice straw. J. Mater. Cycles Waste Manag. 2018, 20, 1804–1812. [Google Scholar] [CrossRef]
- Ambrose, H.W.; Chin, C.T.-L.; Hong, E.; Philip, L.; Suraishkumar, G.K.; Sen, T.K.; Khiadani, M. Effect of hybrid (microwave-H2O2) feed sludge pretreatment on single and two-stage anaerobic digestion efficiency of real mixed sewage sludge. Process Saf. Environ. Protect. 2020, 136, 194–202. [Google Scholar] [CrossRef]
- Candia-García, C.; Delgadillo-Mirquez, L.; Hernandez, M. Biodegradation of rice straw under anaerobic digestion. Environ. Technol. Innov. 2018, 10, 215–222. [Google Scholar] [CrossRef]
- Girotto, F.; Peng, W.; Rafieenia, R.; Cossu, R. Effect of Aeration Applied During Different Phases of Anaerobic Digestion. Waste Biomass Valorization 2016, 9, 161–174. [Google Scholar] [CrossRef]
- Zhang, B.; Li, W.Z.; Xu, X.; Li, P.F.; Li, N.; Zhang, H.Q.; Sun, Y. Effect of Aerobic Hydrolysis on Anaerobic Fermentation Characteristics of Various Parts of Corn Stover and the Scum Layer. Energies 2019, 12, 381. [Google Scholar] [CrossRef] [Green Version]
- Jang, H.M.; Park, S.K.; Ha, J.H.; Park, J.M. Microbial community structure in a thermophilic aerobic digester used as a sludge pretreatment process for the mesophilic anaerobic digestion and the enhancement of methane production. Bioresour. Technol. 2013, 145, 80–89. [Google Scholar] [CrossRef] [PubMed]
- Hajji, A.; Rhachi, M. The Influence of Particle Size on the Performance of Anaerobic Digestion of Municipal Solid Waste. Energy Procedia 2013, 36, 515–520. [Google Scholar] [CrossRef] [Green Version]
- Sebola, M.; Muzenda, E.; Tesfagiorgis, H. Effect of particle size on anaerobic digestion of different feedstocks. S. Afr. J. Chem. Eng. 2015, 20, 11–26. [Google Scholar]
- Palmowski, L.M.; Müller, J.A. Influence of the size reduction of organic waste on their anaerobic digestion. Water Sci. Technol. 2000, 41, 155–162. [Google Scholar] [CrossRef]
- Zou, S.; Wang, H.; Wang, X.; Zhou, S.; Li, X.; Feng, Y. Application of experimental design techniques in the optimization of the ultrasonic pretreatment time and enhancement of methane production in anaerobic co-digestion. Appl. Energy 2016, 179, 191–202. [Google Scholar] [CrossRef]
- Wang, Z.; Cheng, Q.; Liu, Z.; Qu, J.; Sun, Y. Evaluation of methane production and energy conversion from corn stalk using furfural wastewater pretreatment for whole slurry anaerobic co-digestion. Bioresour. Technol. 2019, 293, 121962. [Google Scholar] [CrossRef]
- ANSI/ASAE S424.1 MAR1992 (R2007). Method of Determining and Expressing Particle Size of Chopped Forage Materials by Screening; American Society of Agricultural and Biological Engineers: St. Joseph, MI, USA, 1992; pp. 663–665. [Google Scholar]
- APHA Association. Standard Methods for the Examination of Water and Wastewater, 17th ed.; American Public Health Association: Washington, DC, USA; American Water Works Association: Denver, CO, USA; Water Pollution Control Federation: Alexandria, VA, USA, 1989. [Google Scholar]
- Strömberg, S.; Nistor, M.; Liu, J. Towards eliminating systematic errors caused by the experimental conditions in Biochemical Methane Potential (BMP) tests. Waste Manag. 2014, 34, 1939–1948. [Google Scholar] [CrossRef]
- Zwietering, M.H.; Jongenburger, I.; Rombouts, F.M.; Riet, K.V. Modeling of bacterial growth curve. Appl. Environ. Microbiol. 1990, 56, 1875–1881. [Google Scholar] [CrossRef] [Green Version]
- Batstone, D.J.; Keller, J.; Angelidaki, I.; Kalyuzhnyi, S.V.; Pavlostathis, S.G.; Rozzi, A.; Sanders, W.T.M.; Siegrist, H.; Vavilinet, V.A. The IWA Anaerobic Digestion Model No 1 (ADM1); IWA Publishing: London, UK, 2002; pp. 65–73. [Google Scholar]
- Kong, L.; Zhao, Z.; He, Z.; Yi, S. Effects of steaming treatment on crystallinity and glass transition temperature of Eucalyptuses grandis × E. urophylla. Results Phys. 2017, 7, 914–919. [Google Scholar] [CrossRef]
- Passos, F.; Ferrer, I. Influence of hydrothermal pretreatment on microalgal biomass anaerobic digestion and bioenergy production. Water Res. 2015, 68, 364–373. [Google Scholar] [CrossRef] [Green Version]
- Yuan, T.; Cheng, Y.; Zhang, Z.; Lei, Z.; Shimizu, K. Comparative study on hydrothermal treatment as pre-and post-treatment of anaerobic digestion of primary sludge: Focus on energy balance, resources transformation and sludge dewaterability. Appl. Energy 2019, 239, 171–180. [Google Scholar] [CrossRef]
- Yao, R.S.; Hu, H.J.; Deng, S.S.; Wang, H.; Zhu, H.X. Structure and saccharification of rice straw pretreated with sulfur trioxide micro-thermal explosion collaborative dilutes alkali. Bioresour. Technol. 2011, 102, 6340–6343. [Google Scholar] [CrossRef]
- Miao, Z.; Grift, T.E.; Hansen, A.C.; Ting, K.C. Energy requirement for comminution of biomass in relation to particle physical properties. Ind. Crop. Prod. 2011, 33, 504–513. [Google Scholar] [CrossRef]
- Mani, S.; Tabil, L.G.; Sokhansanj, S. Grinding performance and physical properties of wheat and barley straws, corn stover and switchgrass. Biomass Bioenergy 2004, 27, 339–352. [Google Scholar] [CrossRef]
- Zhao, G.; Ma, F.; Wei, L.; Chua, H. Using rice straw fermentation liquor to produce bioflocculants during an anaerobic dry fermentation process. Bioresour. Technol. 2012, 113, 83–88. [Google Scholar] [CrossRef]
- Montalvo, S.; Huiliñir, C.; Ojeda, F.; Castillo, A.; Lillo, L.; Guerrero, L. Microaerobic pretreatment of sewage sludge: Effect of air flow rate, pretreatment time and temperature on the aerobic process and methane generation. Int. Biodeterior. Biodegrad. 2016, 110, 1–7. [Google Scholar] [CrossRef]
- Fu, S.F.; Wang, F.; Yuan, X.Z.; Yang, Z.M.; Luo, S.J.; Wang, C.S.; Guo, R.B. The thermophilic (55 °C) microaerobic pretreatment of corn straw for anaerobic digestion. Bioresour. Technol. 2015, 175, 203–208. [Google Scholar] [CrossRef] [PubMed]
- Izumi, K.; Okishio, Y.K.; Nagao, N.; Niwa, C.; Yamamoto, S.; Toda, T. Effects of particle size on anaerobic digestion of food waste. Int. Biodeterior. Biodegrad. 2010, 64, 601–608. [Google Scholar] [CrossRef]
- Motte, J.C.; Escudié, R.; Bernet, N.; Delgenes, J.P.; Steyer, J.P.; Dumas, C. Dynamic effect of total solid content, low substrate/inoculum ratio and particle size on solid-state anaerobic digestion. Bioresour. Technol. 2013, 144, 141–148. [Google Scholar] [CrossRef]
- Xu, S.Y.; Selvam, A.; Wong, J.W.C. Optimization of micro-aeration intensity in acidogenic reactor of a two-phase anaerobic digester treating food waste. Waste Manag. 2014, 34, 363–369. [Google Scholar] [CrossRef]
- Dai, X.H.; Hua, Y.; Dai, L.L.; Cai, C. Particle size reduction of rice straw enhances methane production under anaerobic digestion. Bioresour. Technol. 2019, 293, 122043. [Google Scholar] [CrossRef] [PubMed]
- Bar-Lev, S.S.; Kirk, T.K. Effects of molecular oxygen on lignin degradation by Phanerochaete chrysosporium. Biochem. Biophys. Res. Commun. 1981, 99, 373–378. [Google Scholar] [CrossRef]
- Mshandete, A.; Björnsson, L.; Kivaisi, A.K.; Rubindamayugi, S.T.; Mattiasson, B. Enhancement of anaerobic batch digestion of sisal pulp waste by mesophilic aerobic pre-treatment. Water Res. 2005, 39, 1569–1575. [Google Scholar] [CrossRef] [PubMed]
- Xu, W.Y.; Fu, S.F.; Yang, Z.M.; Lu, J.; Guo, R.B. Improved methane production from corn straw by microaerobic pretreatment with a pure bacteria system. Bioresour. Technol. 2018, 259, 18–23. [Google Scholar] [CrossRef] [PubMed]
- Akobi, C.; Yeo, H.; Hafez, H.; Nakhla, G. Single-stage and two-stage anaerobic digestion of extruded lignocellulosic biomass. Appl. Energy 2016, 184, 548–559. [Google Scholar] [CrossRef]
- Mao, C.; Wang, X.; Xi, J.; Feng, Y.; Ren, G. Linkage of kinetic parameters with process parameters and operational conditions during anaerobic digestion. Energy 2017, 135, 352–360. [Google Scholar] [CrossRef]
- Xiao, X.; Zhang, R.H.; He, Y.F.; Li, Y.Q.; Feng, L.; Chen, C.; Liu, G.Q. Influence of Particle Size and Alkaline Pretreatment on the Anaerobic Digestion of Corn Stover. BioResources 2013, 8, 5850–5860. [Google Scholar] [CrossRef] [Green Version]
- Ariesyady, H.D.; Ito, T.; Okabe, S. Functional bacterial and archaeal community structures of major trophic groups in a full-scale anaerobic sludge digester. Water Res. 2007, 41, 1554–1568. [Google Scholar] [CrossRef]
Publisher’s Note: MDPI stays neutral with regard to jurisdictional claims in published maps and institutional affiliations. |
© 2021 by the authors. Licensee MDPI, Basel, Switzerland. This article is an open access article distributed under the terms and conditions of the Creative Commons Attribution (CC BY) license (https://creativecommons.org/licenses/by/4.0/).

