Article

NOx Emission from Diesel Vehicle with SCR System Failure Characterized Using Portable Emissions Measurement Systems

1
Xiamen Environment Protection Vehicle Emission Control Technology Center, Xiamen 361000, China
2
National Lab of Auto Performance and Emission Test, School of Mechanical and Vehicular Engineering, Beijing Institute of Technology, Beijing 100081, China
3
School of Environment, Tsinghua University, Beijing 100084, China
*
Authors to whom correspondence should be addressed.
Energies 2021, 14(13), 3989; https://doi.org/10.3390/en14133989
Submission received: 22 March 2021 / Revised: 31 May 2021 / Accepted: 28 June 2021 / Published: 2 July 2021
(This article belongs to the Section B: Energy and Environment)

Abstract

:
Nitrogen oxides (NOx) emissions from diesel vehicles are major contributors to increasing fine particulate matter and ozone levels in China. The selective catalytic reduction (SCR) system can effectively reduce NOx emissions from diesel vehicles and is widely used in China IV and V heavy-duty diesel vehicles (HDDVs). In this study, two China IV HDDVs, one with SCR system failure and the other with a normal SCR system, were tested by using a portable emissions measurement system (PEMS). Results showed that the NOx emission factors of the test vehicle with SCR system failure were 8.42 g/kW∙h, 6.15 g/kW∙h, and 6.26 g/kW∙h at loads of 0%, 50%, and 75%, respectively, which were 2.14, 2.10, and 2.47 times higher than those of normal SCR vehicles. Emission factors, in terms of g/km and g/kW∙h, from two tested vehicles were higher on urban roads than those on suburban and motorways. The NOx emission factor of the vehicle with failed SCR system did not meet the China IV emission standard. The time-weighted results for normal SCR vehicle over the three road types show that, except for NOx emission factor 12.17% higher than the China IV limit at 0% load, the emission values are 16.21% and 27.54% below the China IV standard limit at 50% load and 75% load, respectively. In general, with higher load, NOx emissions (in terms of g/kW∙h) from the tested vehicle decreased. Furthermore, NO/NOx concentrations of both vehicles with normal and failed SCR systems showed a decreasing trend with the increase in load.

1. Introduction

With the increasing economy, the logistics industry has also been developed fast. Diesel vehicles have been considered as the main carrier of land transportation. These reliable, fuel-efficient, and high-torque engines power the vast majority of the world’s heavy-duty trucks, buses, and off-road vehicles [1]. However, diesel vehicles have the disadvantage of emitting significant amounts of carbon monoxide (CO), total hydrocarbons (THC), particulate matter (PM) and nitrogen oxides (NOx) into the atmosphere [2,3,4]. These pollutants cause serious adverse health effects as well as damage to the urban atmospheric environment [5,6].
The U.S., Europe, Japan, and South Korea have been developing amounts of retrofit emission control devices to respond to the challenge of reducing air pollution from the in-use diesel vehicle fleet. In China, after-treatment technologies for diesel engines were applied in July 2013, when the China IV emission standard was implemented. Many of these diesel after-treatment technologies are working in a manner that is similar to that of the advanced emission control technologies that are now available in the newer “clean” diesel engines used in motorway and off-road applications, including diesel particulate filters (DPF) for controlling PM emissions and urea-selective catalytic reduction (SCR) systems for controlling NOx emissions [7,8].
Considerable emission reduction was brought about by the implementation of the emission standard [9,10], and the emission limitation of the China V emission standard is more stringent, which reduces the emission of pollutants. However, the concentration of particulate matter in air has been decreasing in many cities in China over the years [11]. In contrast, the concentration of nitrogen dioxide (NO2) in air has not been decreasing in regions with large diesel vehicle ownership and has been rising in regions with developed economies such as the Beijing-Tianjin-Hebei region as well as in the Yangtze and Pearl River Deltas [12,13,14]. Simultaneously, industrial sources in these areas have achieved ultra-low emissions, and the contribution of NOx from motor vehicles is increasing [15,16], which shows that in practice, the emission of NOx from diesel vehicles, especially for heavy-duty diesel vehicles, have not been effectively controlled.
NOx emissions from diesel vehicles, especially heavy-duty diesel Trucks (HDDTs), have become the focus of our attention and the next challenge in controlling nitrogen oxides in cities [17,18]. To ensure real-world emissions reductions and compliance with regulatory standards, exhaust pollutants are measured using a portable emissions measurement system (PEMS) under real-world driving cycles. In the U.S., the Not-to-Exceed (NTE) method is the regulatory protocol used for assessment of in-use emissions [19,20]. With limitations associated with the NTE metric, EU JRC in 2011 applied the moving average work-based window (WBW) as part of the regulatory protocol to evaluate in-use NOx emissions conformity for heavy-duty vehicles by using PEMS [20,21]. Therefore, real driving emission (RDE) has gained importance in NOx emission research for heavy-duty vehicles. McCaffery et al. [22] tested 50 heavy-duty vehicles of different vocations and engine technologies using portable emissions measurement systems. Results showed that for most vehicles, the in-use NOx emissions were higher than the certification standards for the engine. They also found that NOx emissions were strongly dependent on the SCR temperature, with SCR temperatures below 200 °C resulting in elevated brake-specific NOx. Misra et al. [23] tested the five refuse trucks equipped with SCR and TWC during real-world operation, indicating that the brake-specific NOx emissions from the conventional diesel engines were significantly higher despite the exhaust temperature being high enough for proper SCR function. Quiros et al. [24] measured seven heavy-duty vehicles on six selected routes in California, showing that NOx emissions exceeded brake-specific certification limits during lower-speed driving routes. NOx emissions on highway driving were lower than certification values for some engine families and higher than certification values for others. However, the study on emission characteristics of NOx in various SCR failure cases is relatively rare. In this paper, the emission characteristics of selected typical vehicles over the selected routes are analyzed, and the emission factors under different circumstances are given, providing data support for constructing accurate urban air emission inventory and also for future China heavy-duty vehicle management, which provides policy recommendations for pollutant emission control.

2. Methods and Experiments
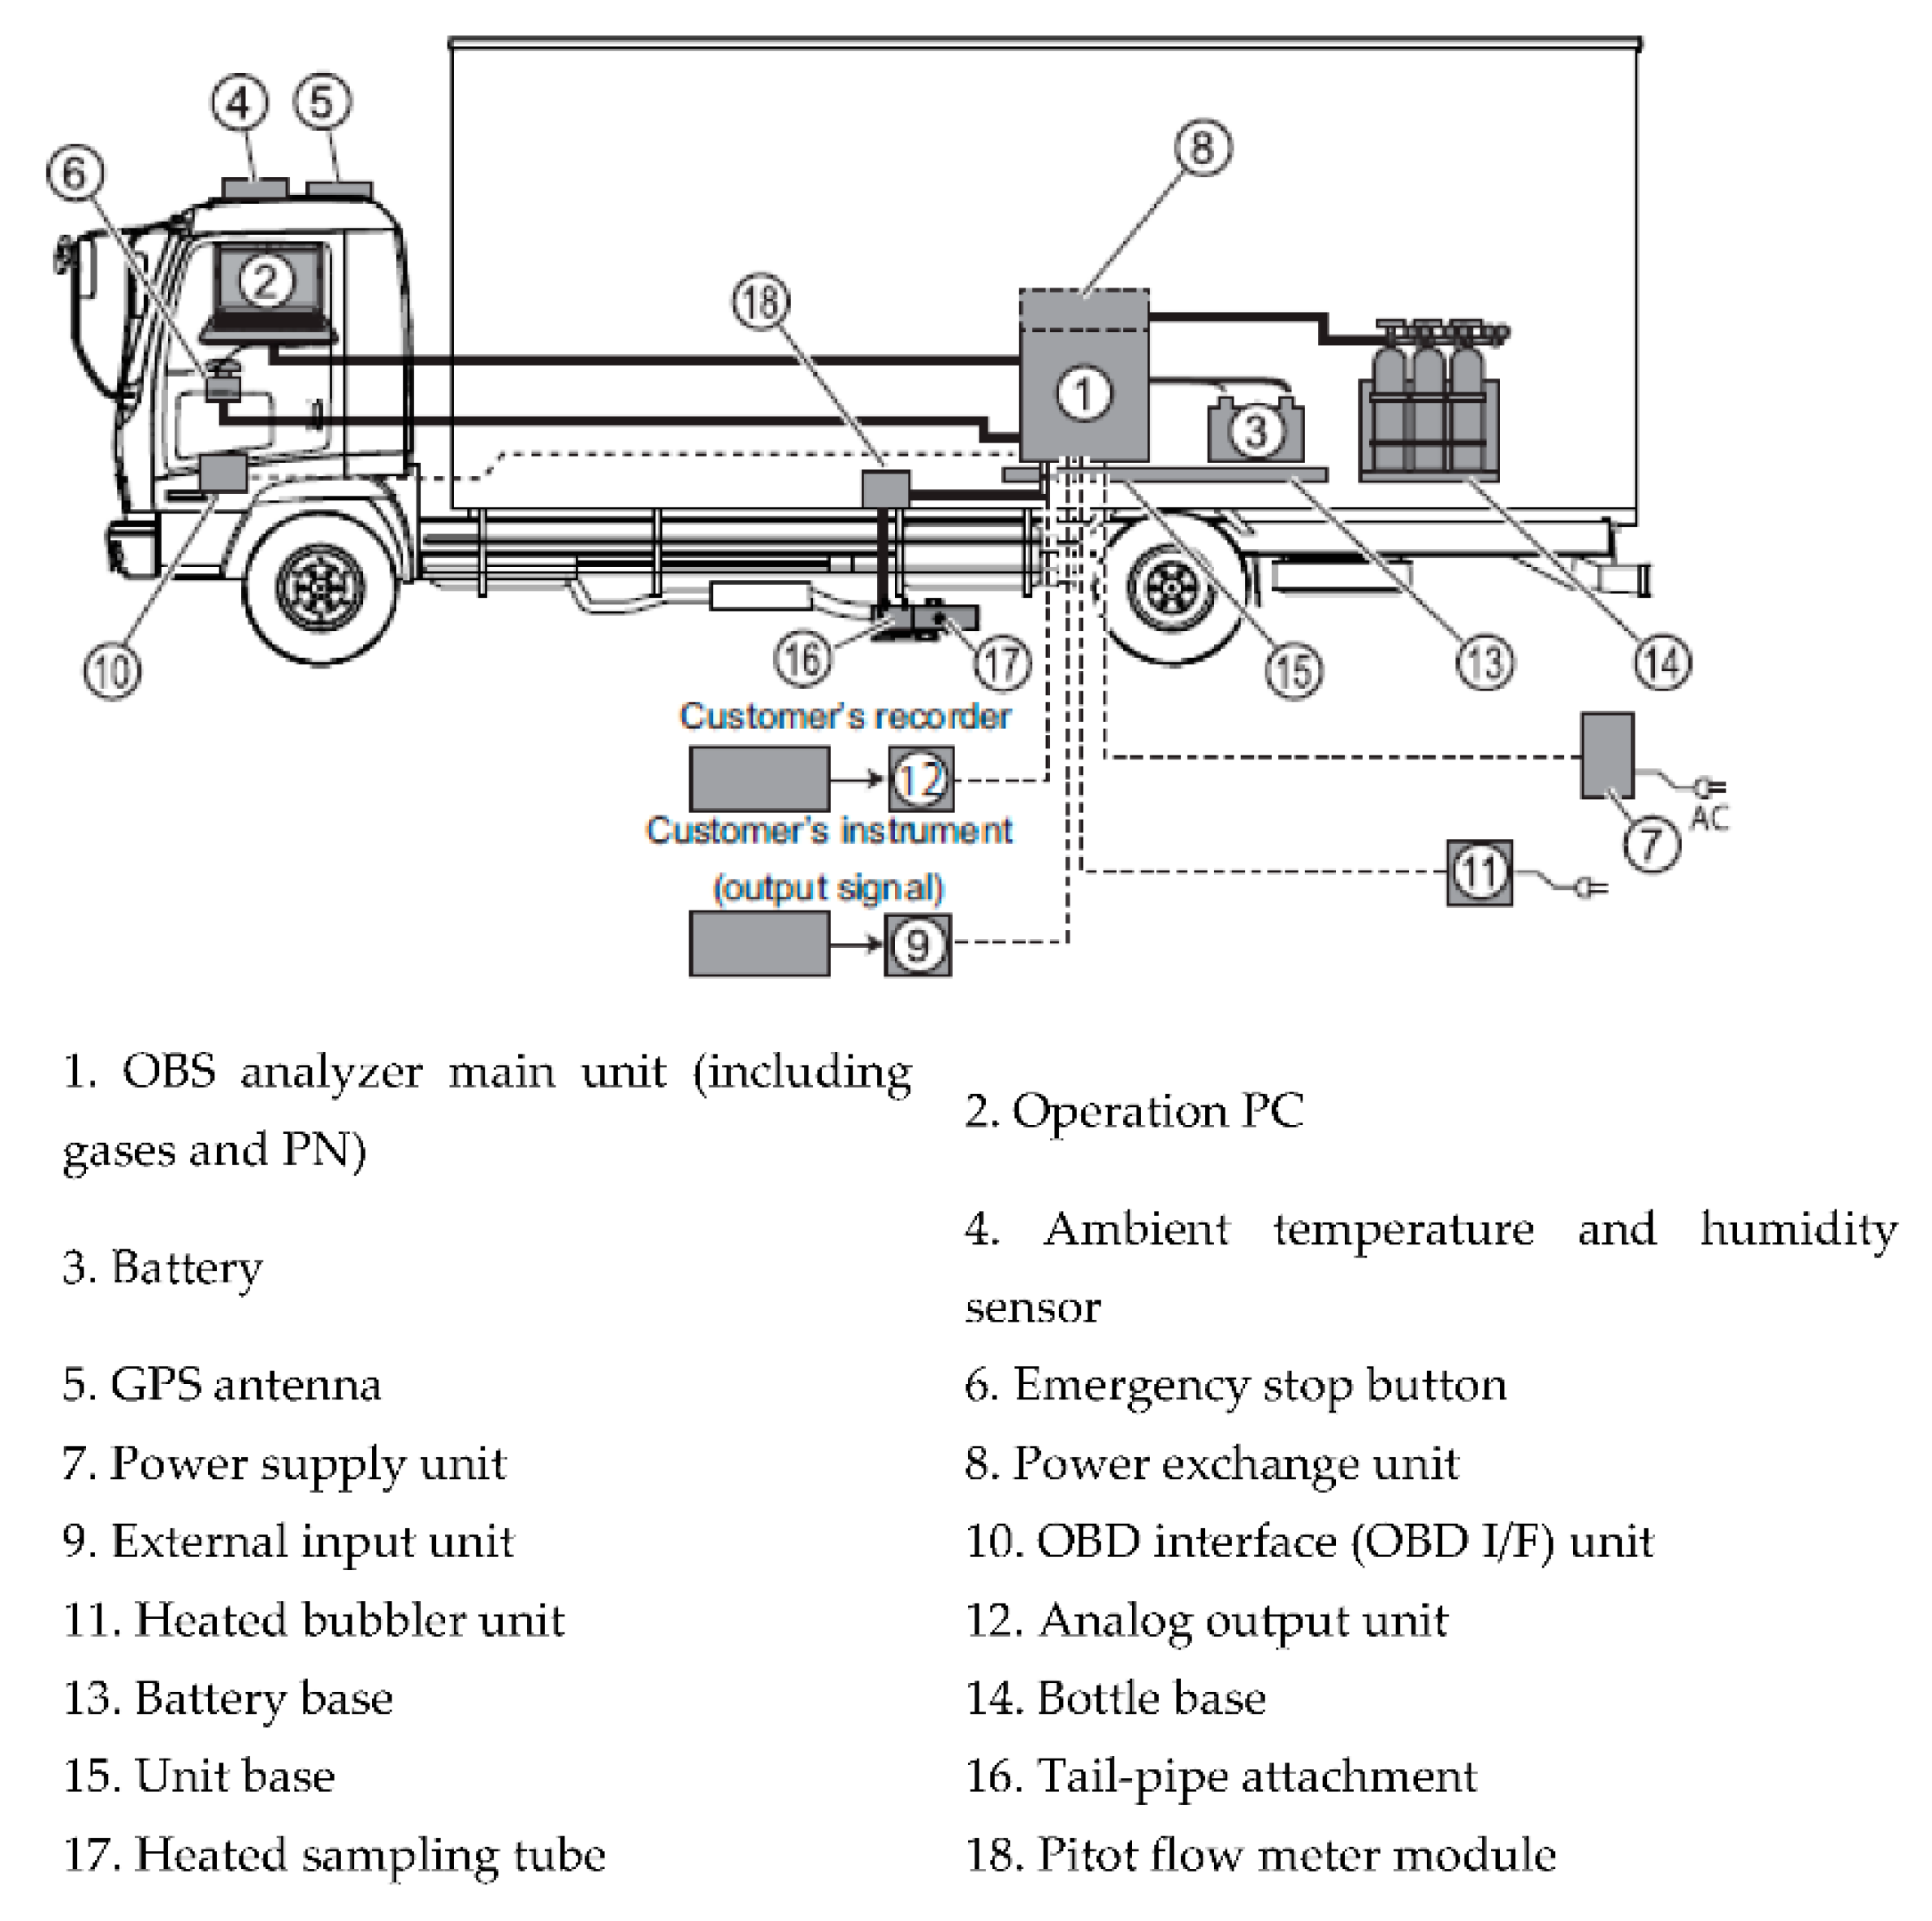
2.1. Test Equipment

In these tests, we used the commercially available PEMS, HORIBA OBS-ONE, which includes two measurement parts: gaseous measurement module and particle number measurement module (Figure 1). The exhaust flow meter (EFM) in our PEMS test system was to determine the exhaust volume with Pitot (pressure difference), exhaust pressure, and temperature measurement sensor. The PEMS specifications are presented on Table S1. From the data of exhaust flow rate and the measured exhaust gas concentration, the mass emissions are calculated. Before the emission test, zero and span calibration will be carried out to make sure all the test modules are at normal status.

2.2. Tested Vehicles

The list of vehicles tested in this program is listed in the Table 1. These two diesel heavy-duty vehicles have the same vehicle type, engine power and aftertreatment technology. It should be noted that Vehicle No. 1 has the failure SCR system, while No. 2 vehicle has the normal SCR system. There are two possible reasons for SCR system failure of the No. 1 sample vehicle. The first reason is NOx sensor failure. Sensor failure leads to a low reading, which affects the urea injection volume. Finally, NOx emissions increased. Another reason is vehicle owner illegal rewrite OBD program to adjust the actual reading of the NOx sensor to reduce the urea consumption. Both reasons may lead to SCR system failure and higher NOx emission.

2.3. Test Route and Load

As shown in Figure 2, vehicle No. 1 with the failed SCR device and vehicle No. 1 with the normal SCR device were operated over normal driving routes according to legislation GB 17691-2018 [25]. We use sandbags as the load for test vehicles. The weight of each sandbag is 25 kg. Therefore, each vehicle was tested at 0%, 50%, and 75% of the load for more than 3 h each time according to the number of sandbags, and a single test consisted of 20% urban roads, 25% suburban roads, and 55% motorways, in terms of test time. In this study, the length of test route is about 180 km (see Figure S1). The lanes (single direction) of urban road, suburban road and motorways are 3-4, 1-2 and 3, and speed limits of three road types are 60 km/h, 70 km/h and 120 km/h, respectively.

2.4. Test Data Source

The parameters that were recorded are listed in Table S2. The unit mentioned is the reference unit, whereas the source column shows the types of methods that were used.
The weighing method is used to compare the urea/fuel consumption ratio (R) of the two vehicles to verify the working status of the post-processing. Before and after the test, urea and fuel were discharged and weighed with an electronic scale to calculate the urea consumption and fuel consumption of the test. The formula of urea/fuel consumption ratio is as follows:
R = a b c d × 100 %
where R is urea/fuel consumption ratio (%); a is weight of urea before the test (kg); b is weight of urea after the test (kg); c is weight of fuel before the test (kg); d is weight of fuel after the test (kg).

2.5. Calculation of Emission Factors

The formula used in this study for calculating the NOx emission factor based on mileage (g/km) and work done (g/kW∙h) is as follows:
E F d = i = 1 n u × c i × Q i × T e m 0 T e m 20 × ρ × 0.06 i = 1 n v i
E F w = i = 1 n u × c i × Q i × T e m 0 T e m 20 × ρ × 18 × 10 4   i = 1 n ( R P M i × ( T a , i T f , i ) × T r × π )
where E F d is the mileage-based NOx emission factor (g/km); n is the amount of data per test; i indicates test moment i; u is the ratio of the density of the pollutant in the exhaust gas to the concentration of the exhaust gas (u is 0.001587 for NOx from diesel vehicles); c i is the NOx concentration (ppm) at the ith second; Q i is the tail gas mass flow (kg/min) recorded by the EFM at 20 °C temperature and 101.3 kPa pressure; T e m 0   and   T e m 20 represent absolute temperature values at 0 °C and 20 °C, i.e., 273.15 K and 293.15 K, respectively; ρ is the exhaust concentration (1.2943 kg/m3); ν indicates the instantaneous speed (km/h) of the vehicle as recorded by GPS; E F w indicates a work-based emission factor (g/kW∙h); R P M i indicates the instantaneous engine speed of the test vehicle (r/min); T a , i represents the percentage of actual engine torque at moment i captured by the OBD system (%); T f , i represents the percentage of engine frictional torque acquired by the OBD system at moment i (%); and T r represents the reference torque of the test vehicle (950 Nm).

3. Test Results and Analysis

3.1. Driving Cycles

Driving cycle is one of key factors that can affect engine performance significantly and thus is very important in analyzing vehicle emission characteristics [7]. Table 2 presents the time proportions of driving cycles and average driving speed for the tested diesel vehicle based on three different types of roads. The methodology for calculating vehicle driving parameters was documented by Wang et al. [26]. As can been seen on the table, the vehicles have an amount of time proportion of idling pattern on urban roads. In addition, the average driving speeds of two vehicle on urban roads are 22.43 and 23.32 km/h, which is slower than the average speed on suburban roads and motorways. This can be attributed to the high traffic density and the interference from traffic lights on urban areas. Furthermore, the average driving speed of two tested vehicles can reach 72 km/h on motorways, which means that vehicles were able to drive freely on the motorway during the emission measurement period. Our results were similar to those of other literatures and reflected the real-world driving characteristics of vehicles on different types of roads [27,28].
A comparison of the relationship between NOx emissions from two test heavy-duty diesel vehicles and the temperature at the end of the exhaust pipe, using a 75% load test as an example, is shown in Figure 3. The test values for the temperature at the end of the exhaust pipe are from the EFM. The curves of temperature on three types of road have different variations. The temperature of the exhaust gas was maintained below 200 °C during the urban road test (Vehicle No. 1: 142.40 ± 15.48 °C; Vehicle No. 2: 138.95 ± 7.67 °C) and rose to approximately 200 °C during suburban road tests (Vehicle No. 1: 199.29 ± 18.81 °C; Vehicle No. 2: 212.85 ± 21.72 °C). Moreover, the overall temperature of the exhaust collected during the motorways test is above 200 °C (Vehicle No. 1: 236.67 ± 26.16 °C; Vehicle No. 2: 253.88 ± 24.56 °C). The temperatures at the EFM of these two vehicles have no significant difference, which reflected the SCR system which should work in similar temperature conditions for these two vehicles. Typically, when the temperature exceeds approximately 200 °C, the SCR system is activated to spray urea solution and ammonia, and urea can reduce NOx to N2 and H2O, thereby significantly lowering the NOx concentration of the emissions [29]. Average NOx emission concentrations for vehicle No. 1 were 500.18 ppm and 352.79 ppm on suburban road and motorways, respectively. The average NOx emission concentrations for Vehicle No. 2 were 173.99 ppm and 127.89 ppm in the suburban areas and motorways, respectively, which are decreases of 65.21% and 63.75% compared to the values of Vehicle No. 1.
Figure 4 shows engine speed–torque contour plots and the corresponding NOx emission rates. The engine speed–torque variation range of the two tested vehicles was similar in urban and suburban areas, with speeds essentially below 2000 rpm and torque between 0–800 Nm; when vehicle is driving on motorway, engine speed can reach 2400 rpm. As for No. 1 vehicle with faultier SCR system, higher NOx emission zone was concentrated in the “upper right corner”, i.e., the high-torque phase (>400 Nm), at high rpm (1000–2000 rpm/min) on three types of roads, probably owing to the higher engine output corresponding to the high-torque state and high rpm, where increased air intake and higher combustion temperatures resulted in increased NOx production. The peak values happened on urban road, which can be attributed to the fast changing of engine loads. In contrast, NOx emission rates from No. 2 vehicle are lower than those from No. 1 vehicle on three types of roads. Especially on suburban road and motorway, NOx emission rates are always below 0.2 g/s with higher engine speed and larger torque zone, which indicate that the SCR system can better reduce NOx emission on suburban road and motorway.

3.2. NOx Emission Factors under Different Types of Roads

The vehicle emissions are presented in Figure 5 as brake specific emissions for the complete test routes. These values are not used to evaluate the conformity of the engines with the applicable standards; they simply represent an indication of the average engine emission performance over the corresponding test conditions. The test results show that the NOx emission factors of a vehicle with SCR failure under 0%, 50%, and 75% load conditions are 8.42 g/kW∙h, 6.15 g/kW∙h, and 6.26 g/kW∙h, respectively. The NOx emission factors of normal SCR vehicles under 0%, 50%, and 75% load conditions were 3.93 g/kW∙h, 2.93 g/kW∙h, and 2.54 g/kW∙h, respectively, which are 12.17%, 16.21%, and 27.54% lower than the values of vehicles with SCR failure. CO emission factor of Vehicle No. 2 is higher than that of Vehicle No. 1 under the same load. The possible reason is the larger mileage of No. 2 vehicle causing the poor combustion on engine cylinders. We also measured the urea and fuel consumption by weighing method. Under the condition of only a 115 s difference in test time, the urea consumption of the vehicle with SCR failure was only 55.91% of that of the vehicle with normal SCR, and the urea/fuel consumption ratio of the vehicle with SCR failure was 59.11% of that of the vehicle with normal SCR. The results further confirmed that the failure of the SCR system of the vehicle with SCR failure caused a decrease in the injection volume of urea solution and a significant decrease in NOx removal efficiency in the exhaust.
The NOx emission limit of ESC cycle in China III and China IV standards are 5.0 g/kW∙h and 3.5 g/kW∙h, respectively [30]. As shown in Figure 6, the NOx emission factor of Vehicle No. 1 on three road types failed to meet the China IV emission standard and even failed to meet the China III standard at 0% load. Under no-load conditions, the NOx emission factors (g/kW∙h) of Vehicle No. 1 in urban roads, suburban roads, and motorways were 5.14, 3.91, and 1.83 times the limit of China IV standards, respectively, and 3.59, 2.73 and 1.28 times the limit of China III standards, respectively. The time-weighted results for the vehicle with normal SCR over the three road types show that, except for NOx emission factor 12.17% higher than the China IV standard limit at 0% load, the emission values were 16.21% and 27.54% below the China IV standard limit at 50% load and 75% load, respectively. During the test, the NOx emission factors of both vehicles were the highest for the urban area, followed by the suburban area, and the emission factor for the motorway was the lowest. For example, when tested at 75% load, the NOx emission factors of Vehicle No. 1 and Vehicle No. 2 in urban areas were 1.43 and 5.43 times higher than those in suburban areas, and 2.43 and 7.83 times higher than those for motorways, respectively. In general, the NOx emission factor in g/kW∙h decreases with increase in load, and the effect of load on NOx emission factor in g/km is different in different road conditions. For the time-weighted NOx emission factor, the standard deviation of NOx emission factors in g/kW∙h for Vehicle No. 1 and 2 were 1.28 g/kW∙h and 0.72 g/kW∙h, respectively, whereas the standard deviations of NOx emission factor in g/km were 0.07 g/km and 0.09 g/km, respectively. The results show that the variation of emission factor in term of g/km is smaller. In addition, by comparing Vehicle No. 1 and 2, the impact of the failed SCR system on emissions was mainly manifested in suburban roads and motorways. Normal SCR equipment could significantly reduce NOx emissions in suburban roads and motorways, whereas in urban roads, the impact was relatively small because it was difficult for the corresponding exhaust temperature to reach the critical condition for urea injection. The literature [7,31,32,33] has showed that NOx emission factors in term of g/kW∙h from diesel vehicle with SCR system are higher on urban roads. It can be attributed to the low engine speed and torque on urban road, which exceed the diesel engine certification controlling area. Furthermore, low exhaust temperature on urban roads will inhibit SCR reaction on the catalyst, which causes the lower NOx reduction rate.

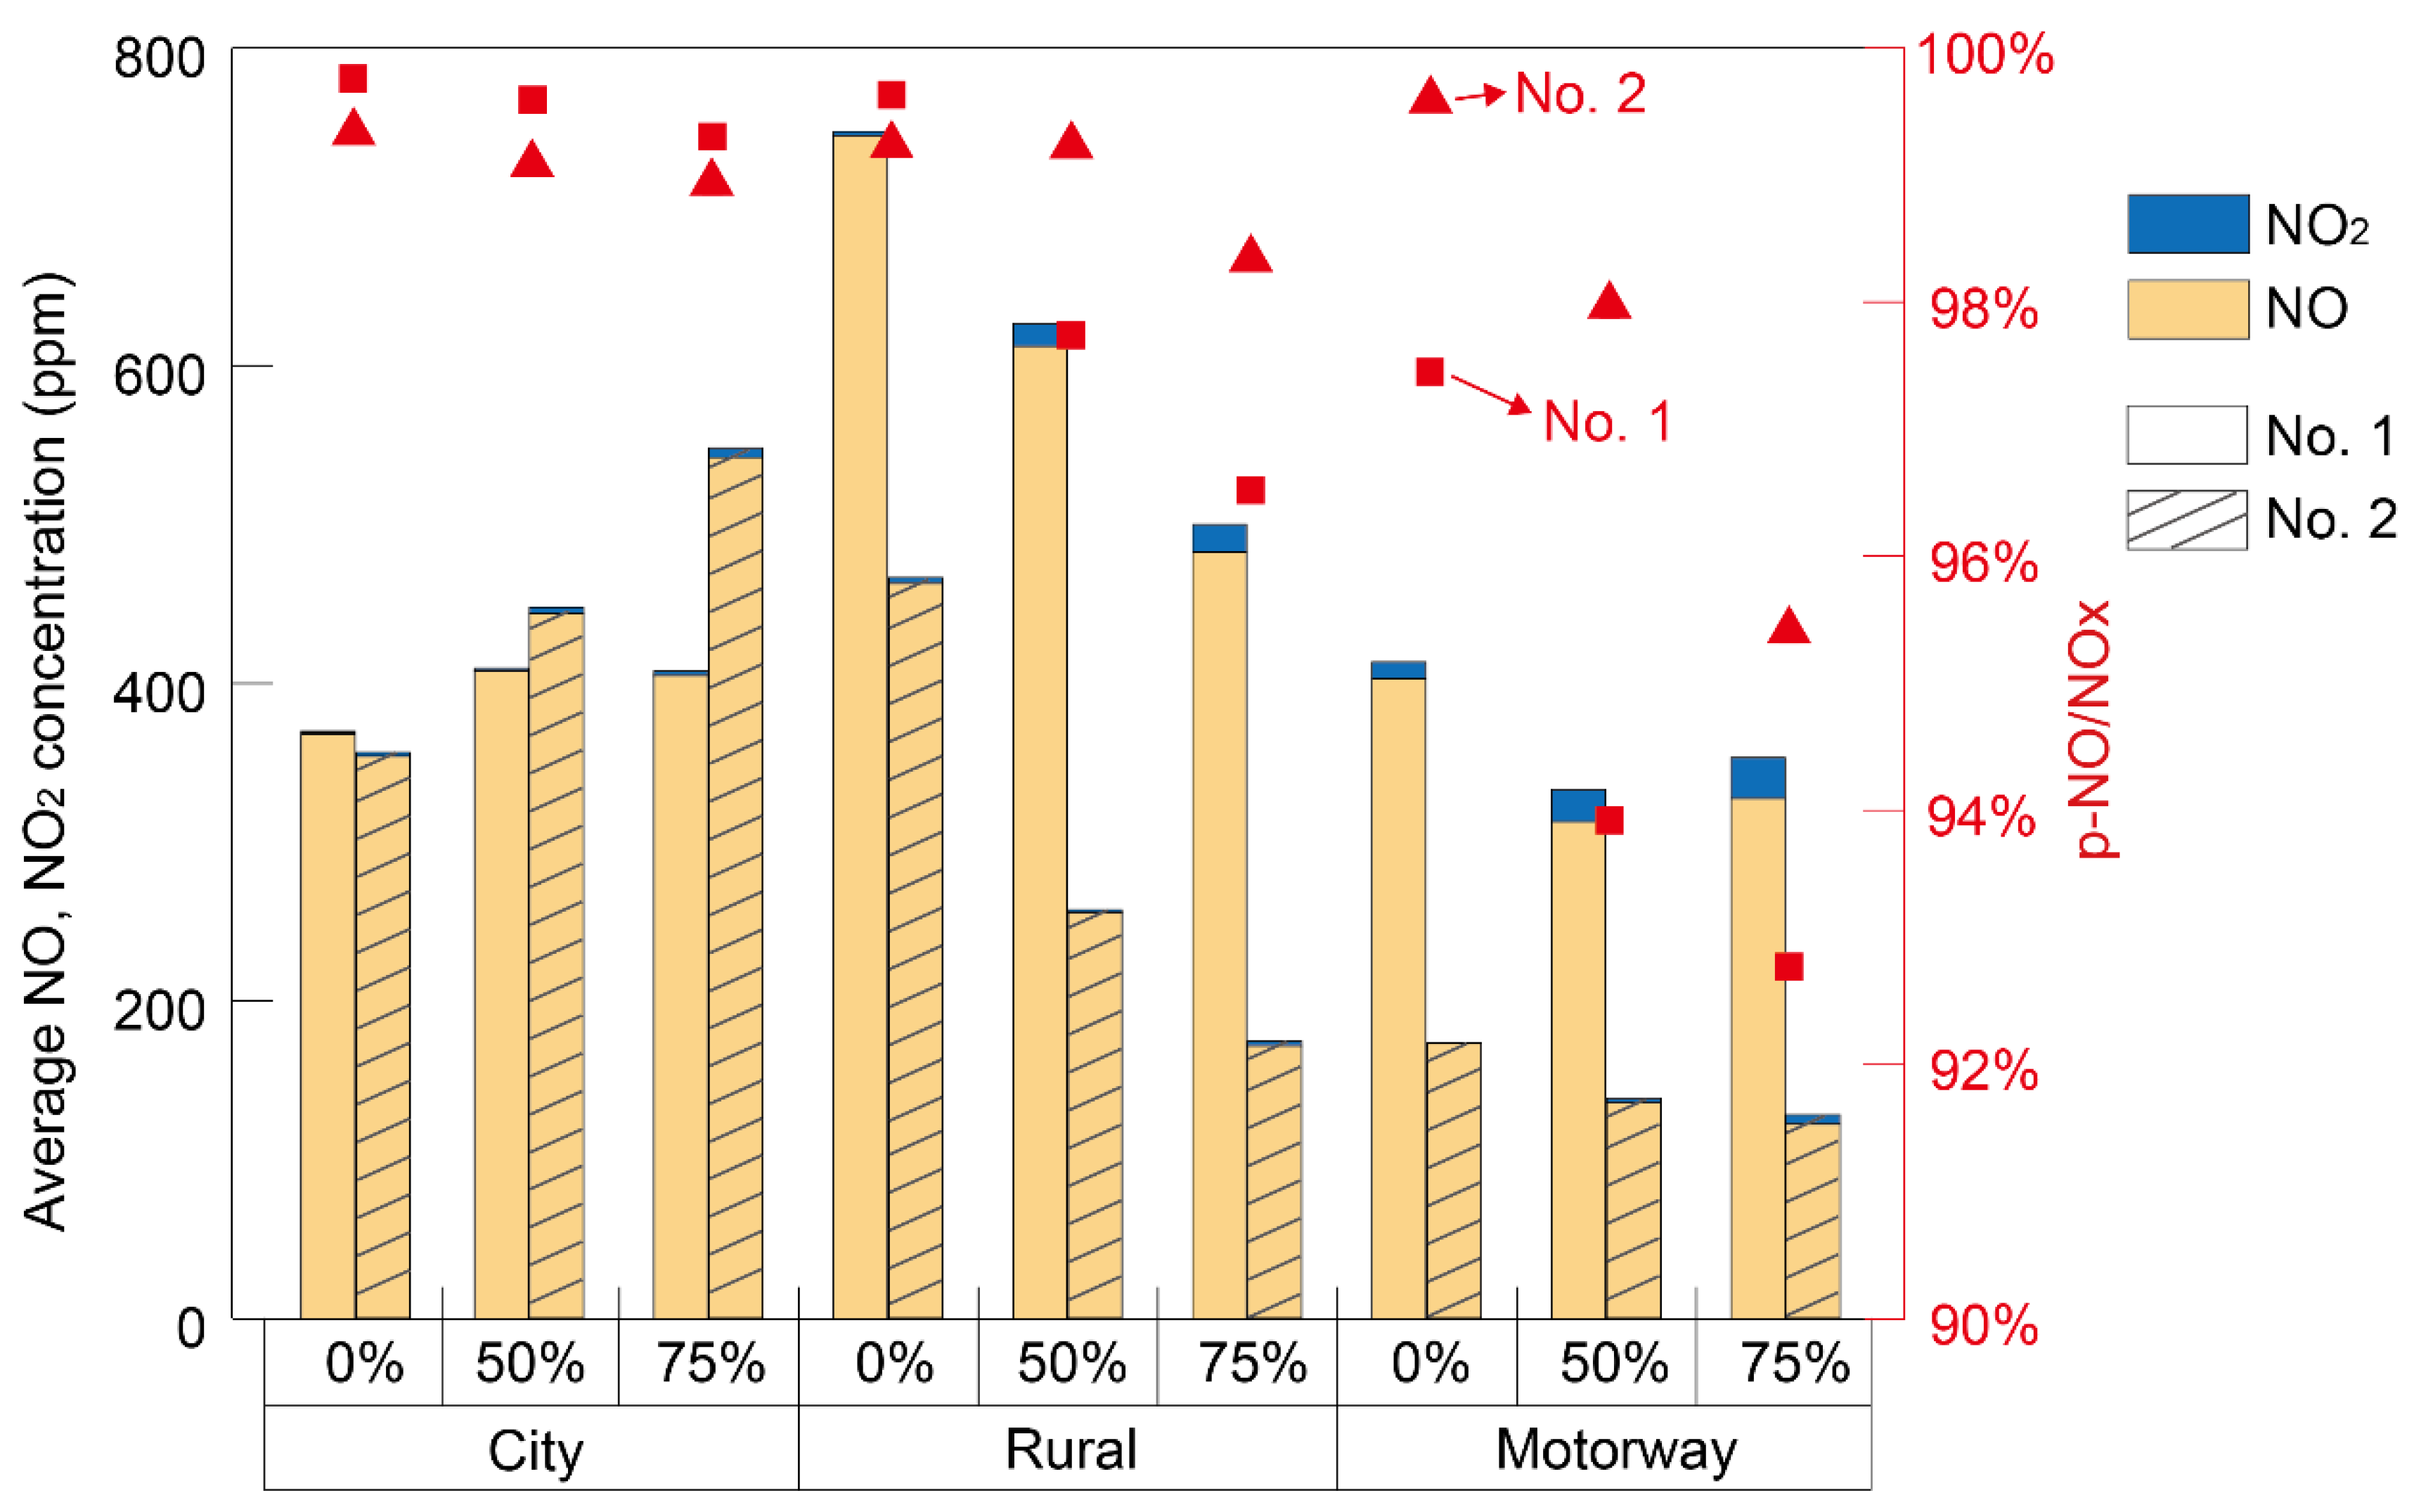
3.3. Emission Characteristics of NO and NO2

Figure 7 shows the average concentration of NO and NO2 in the exhaust gas and the proportion of NO in the exhaust NOx of the test vehicle for three road types and three load conditions. The results show that NO was the main component of NOx (NOx ≡ NO + NO2) in the test vehicles, accounting for more than 90% emissions in the test results of both vehicles. Vehicle No. 1 had the highest average concentration of NO in suburban roads. The average concentration of NO2 increases in the following order: urban areas, suburban roads, and motorways; however, NO/NOx concentration is gradually decreasing in urban areas, suburban areas, and motorways. The average NO concentration of Vehicle No. 2 was the highest in the suburban areas when the load was 0, and the average NO concentration was the highest in the urban areas when the load was 50% and 75%. Furthermore, the variation trend of NO2 was the same. Under non-urban road conditions, NO and NO2 emissions of Vehicle No. 2 were lower than those of Vehicle No. 1 for the same type of roads and load conditions. In urban areas, the NO2 emission of Vehicle No. 2 under 0, 50%, and 75% load increased by 169%, 144%, and 108%, respectively, whereas the NO emission changes were −4%, 9%, and 34%, respectively. In addition, NO/NOx emissions of both normal SCR vehicles and vehicles with SCR failure showed a decreasing trend with increase in load. The average NO/NOx concentrations of the two test vehicles at 50% load and 75% load decreased by 0.62–2.75% compared with those at 0% load.

4. Conclusions

In this study, NOx emission factors from two China IV HDDVs, one with failure SCR system and the other with a normal SCR system, were obtained by using PEMS. The following conclusions were made:
(1)
NOx emission factors of test vehicle with SCR system failure were 8.42 g/kW∙h, 6.15 g/kW∙h, and 6.26 g/kW∙h at 0%, 50%, and 75% load, respectively, which were 2.14, 2.10, and 2.47 times higher than those for vehicles with normal SCR. Higher NOx emission concentrations from HDDVs with after-treatment failure were observed on three types of road, especially on suburban roads and motorways. Urea consumption of vehicles with SCR failure is much lower than that of vehicles with normal SCR.
(2)
The NOx emission factor of the vehicle with SCR failure did not meet China IV emission standard in three road types. The NOx emission factors (g/kW∙h) for vehicles with SCR failure at 0% load on urban roads, suburban roads, and motorways were 5.14, 3.91, and 1.83 times the China IV standard limit and 3.59, 2.73 and 1.28 times the China III standard limit, respectively. The time-weighted results for the normal SCR vehicle over the three road types show that, except for a NOx emission factor 12.17% higher than the China IV standard limit at 0% load, the emission values were 16.21% and 27.54% below the China IV standard limit at 50% load and 75% load, respectively. In general, with higher load, NOx emissions in terms of g/kW∙h from the tested vehicle decreased; however, NOx emissions in terms of g/km exhibited no regular changes under three road types.
(3)
NO accounted for more than 90% of NOx concentration in the exhaust of both vehicles. The average NO/NOx concentration of the two test vehicles at 50% load and 75% load decreased by 0.62–2.75% compared with that at 0% load.

Supplementary Materials

The following are available online at https://www.mdpi.com/article/10.3390/en14133989/s1, Figure S1: Topographic map of test route; Table S1: specifications of PEMS; Table S2: Parameters and methods of test.

Author Contributions

Conceptualization, methodology, software, S.S.; validation, formal analysis, investigation, Y.G.; resources, data curation, Y.Z.; writing—original draft preparation, S.S.; writing—review and editing, Y.Z.; visualization, supervision, project administration, Y.Z.; All authors have read and agreed to the published version of the manuscript.

Funding

This research received no external funding.

Institutional Review Board Statement

Not applicable.

Informed Consent Statement

Not applicable.

Data Availability Statement

Data sharing not applicable. No new data were created or analyzed in this study. Data sharing is not applicable to this article.

Acknowledgments

The authors are grateful to Wang Xin, Lv Liqun and Wang Yachao of Beijing Institute of Technology for their suggestions on this paper.

Conflicts of Interest

The authors declare no conflict of interest.

References

  1. Mollenhauer, K.; Tschöke, H. Handbook of Diesel Engines; Springer Science and Business Media LLC: Berlin/Heidelberg, Germany, 2010. [Google Scholar]
  2. Lin, Y.-C.; Li, Y.-C.; Amesho, K.T.; Chou, F.-C.; Cheng, P.-C. Characterization and quantification of PM2.5 emissions and PAHs concentration in PM2.5 from the exhausts of diesel vehicles with various accumulated mileages. Sci. Total Environ. 2019, 660, 188–198. [Google Scholar] [CrossRef] [PubMed]
  3. Shen, X.; Yao, Z.; Zhang, Q.; Wagner, D.V.; Huo, H.; Zhang, Y.; Zheng, B.; He, K. Development of database of real-world diesel vehicle emission factors for China. J. Environ. Sci. 2015, 31, 209–220. [Google Scholar] [CrossRef] [PubMed]
  4. Song, C.; Ma, C.; Zhang, Y.; Wang, T.; Wu, L.; Wang, P.; Liu, Y.; Li, Q.; Zhang, J.; Dai, Q.; et al. Heavy-duty diesel vehicles dominate vehicle emissions in a tunnel study in northern China. Sci. Total Environ. 2018, 637-638, 431–442. [Google Scholar] [CrossRef] [PubMed]
  5. Jonson, E.J.; Borken-Kleefeld, J.; Simpson, D.; Nyíri, A.; Posch, M.; Heyes, C. Impact of excess NOx emissions from diesel cars on air quality, public health and eutrophication in Europe. Environ. Res. Lett. 2017, 12, 094017. [Google Scholar] [CrossRef] [Green Version]
  6. Ristovski, Z.D.; Miljevic, B.; Surawski, N.C.; Morawska, L.; Fong, K.M.; Goh, F.; Yang, I.A. Respiratory health effects of diesel particulate matter. Respirology 2012, 17, 201–212. [Google Scholar] [CrossRef] [Green Version]
  7. Fu, M.; Ge, Y.; Wang, X.; Tan, J.; Yu, L.; Liang, B. NOx emissions from Euro IV busses with SCR systems associated with urban, suburban and freeway driving patterns. Sci. Total Environ. 2013, 452–453, 222–226. [Google Scholar] [CrossRef] [PubMed]
  8. Lee, S.H.; Kwak, J.H.; Lee, J.H. On-road chasing and laboratory measurements of exhaust particle emissions of diesel vehicles equipped with aftertreatment technologies (DPF, urea-SCR). Int. J. Automot. Technol. 2015, 16, 551–559. [Google Scholar] [CrossRef]
  9. Wu, B.; Shen, X.; Cao, X.; Yao, Z.; Wu, Y. Characterization of the chemical composition of PM2.5 emitted from on-road China III and China IV diesel trucks in Beijing, China. Sci. Total Environ. 2016, 551–552, 579–589. [Google Scholar] [CrossRef] [PubMed] [Green Version]
  10. Yao, Z.; Wu, B.; Wu, Y.; Cao, X.; Jiang, X. Comparison of NOx emissions from China III and China IV in-use diesel trucks based on on-road measurements. Atmos. Environ. 2015, 123, 1–8. [Google Scholar] [CrossRef]
  11. Bai, K.; Ma, M.; Chang, N.-B.; Gao, W. Spatiotemporal trend analysis for fine particulate matter concentrations in China using high-resolution satellite-derived and ground-measured PM2.5 data. J. Environ. Manag. 2019, 233, 530–542. [Google Scholar] [CrossRef]
  12. Liang, D.; Wang, Y.-Q.; Wang, Y.-J.; Ma, C. National air pollution distribution in China and related geographic, gaseous pollutant, and socio-economic factors. Environ. Pollut. 2019, 250, 998–1009. [Google Scholar] [CrossRef]
  13. Si, Y.; Wang, H.; Cai, K.; Chen, L.; Zhou, Z.; Li, S. Long-term (2006–2015) variations and relations of multiple atmospheric pollutants based on multi-remote sensing data over the North China Plain. Environ. Pollut. 2019, 255, 113323. [Google Scholar] [CrossRef] [PubMed]
  14. Zhang, X.; Zhang, W.; Lu, X.; Liu, X.; Chen, D.; Liu, L.; Huang, X. Long-term trends in NO2 columns related to economic developments and air quality policies from 1997 to 2016 in China. Sci. Total Environ. 2018, 639, 146–155. [Google Scholar] [CrossRef] [PubMed]
  15. Sun, W.; Shao, M.; Granier, C.; Liu, Y.; Ye, C.S.; Zheng, J.Y. Long-Term Trends of Anthropogenic SO2, NOx, CO, and NMVOCs Emissions in China. Earth’s Future 2018, 6, 1112–1133. [Google Scholar] [CrossRef] [Green Version]
  16. Yang, H.; Chen, J.; Wen, J.; Tian, H.; Liu, X. Composition and sources of PM2.5 around the heating periods of 2013 and 2014 in Beijing: Implications for efficient mitigation measures. Atmos. Environ. 2016, 124, 378–386. [Google Scholar] [CrossRef]
  17. He, L.; Hu, J.; Zhang, S.; Wu, Y.; Guo, X.; Song, J.; Zu, L.; Zheng, X.; Bao, X. Investigating Real-World Emissions of China’s Heavy-Duty Diesel Trucks: Can SCR Effectively Mitigate NOx Emissions for Highway Trucks? Aerosol Air Qual. Res. 2017, 17, 2585–2594. [Google Scholar] [CrossRef] [Green Version]
  18. Wu, Y.; Zhang, S.; Hao, J.; Liu, H.; Wu, X.; Hu, J.; Walsh, M.P.; Wallington, T.J.; Zhang, K.M.; Stevanovic, S. On-road vehicle emissions and their control in China: A review and outlook. Sci. Total Environ. 2017, 574, 332–349. [Google Scholar] [CrossRef] [Green Version]
  19. Badshah, H.; Posada, F.; Muncrief, R. Current State of NOx Emissions from In-Use Heavy Duty Diesel Vehicles in the United States; The International Council on Clean Transportation: Washington, DC, USA, 2019. [Google Scholar]
  20. Pondicherry, R.; Besch, M.C.; Thiruvengadam, A.; Carder, D. A Vehicle Activity-based Windowing approach to evaluate real-world NOx emissions from Modern Heavy-duty Diesel Trucks. Atmos. Environ. 2021, 247, 118169. [Google Scholar] [CrossRef]
  21. JRC European Union. Commission Regulation EU582/2011. 2011. Available online: http://refhub.elsevier.com/S1352-2310(20)30899-2/sref14 (accessed on 25 May 2011).
  22. McCaffery, C.; Zhu, H.; Tang, T.; Li, C.; Karavalakis, G.; Cao, S.; Oshinuga, A.; Burnette, A.; Johnson, K.C.; Durbin, T.D. Real-world NOx emissions from heavy-duty diesel, natural gas, and diesel hybrid electric vehicles of different vocations on California roadways. Sci. Total Environ. 2021, 784, 147224. [Google Scholar] [CrossRef] [PubMed]
  23. Misra, C.; Ruehl, C.; Collins, J.; Chernich, D.; Herner, J. In-Use NOx Emissions from Diesel and Liquefied Natural Gas Refuse Trucks Equipped with SCR and TWC, Respectively. Environ. Sci. Technol. 2017, 51, 6981–6989. [Google Scholar] [CrossRef]
  24. Quiros, D.C.; Thiruvengadam, A.; Pradhan, S.; Besch, M.; Thiruvengadam, P.; Demirgok, B.; Carder, D.; Oshinuga, A.; Huai, T.; Hu, S. Real-World Emissions from Modern Heavy-Duty Diesel, Natural Gas, and Hybrid Diesel Trucks Operating Along Major California Freight Corridors. Emiss. Control Sci. Technol. 2016, 2, 156–172. [Google Scholar] [CrossRef] [Green Version]
  25. MEE (Ministry of Ecology and Environment, P.R. China); SAMR (State Administration for Market Regulation). Limits and Measurement Methods for Emissions from Diesel Fuelled Heavy-Duty Vehicles (CHINA VI), GB 17691–2018. 2018. Available online: http://203.187.160.133:9011/www.mee.gov.cn/c3pr90ntc0td/ywgz/fgbz/bz/bzwb/dqhjbh/dqydywrwpfbz/201807/W020180703397013304274.pdf (accessed on 13 July 2018).
  26. Wang, Q.; Huo, H.; He, K.; Yao, Z.; Zhang, Q. Characterization of vehicle driving patterns and development of driving cycles in Chinese cities. Transp. Res. Part D Transp. Environ. 2008, 13, 289–297. [Google Scholar] [CrossRef]
  27. Ko, J.; Myung, C.-L.; Park, S. Impacts of ambient temperature, DPF regeneration, and traffic congestion on NOx emissions from a Euro 6-compliant diesel vehicle equipped with an LNT under real-world driving conditions. Atmos. Environ. 2019, 200, 1–14. [Google Scholar] [CrossRef]
  28. Yang, Z.; Liu, Y.; Wu, L.; Martinet, S.; Zhang, Y.; Andre, M.; Mao, H. Real-world gaseous emission characteristics of Euro 6b light-duty gasoline- and diesel-fueled vehicles. Transp. Res. Part D Transp. Environ. 2020, 78, 102215. [Google Scholar] [CrossRef]
  29. Boriboonsomsin, K.; Durbin, T.; Scora, G.; Johnson, K.; Sandez, D.; Vu, A.; Jiang, Y.; Burnette, A.; Yoon, S.; Collins, J.; et al. Real-world exhaust temperature profiles of on-road heavy-duty diesel vehicles equipped with selective catalytic reduction. Sci. Total Environ. 2018, 634, 909–921. [Google Scholar] [CrossRef] [Green Version]
  30. MEE (Ministry of Ecology and Environment, P.R. China); SAMR (State Administration for Market Regulation). Limits and Measurement Methods for Exhaust Pollutants from Compression Ignition and Gas Fuelled Positive Ignition Engines of Vehicles (III, IV, V), GB 17691–2005. 2005. Available online: http://www.mee.gov.cn/ywgz/fgbz/bz/bzwb/dqhjbh/dqydywrwpfbz/200701/W020110127400649893698.pdf (accessed on 30 May 2005).
  31. Grigoratos, T.; Fontaras, G.; Giechaskiel, B.; Zacharof, N. Real world emissions performance of heavy-duty Euro VI diesel vehicles. Atmos. Environ. 2019, 201, 348–359. [Google Scholar] [CrossRef]
  32. Liu, Z.; Ge, Y.; Johnson, K.C.; Shah, A.N.; Tan, J.; Wang, C.; Yu, L. Real-world operation conditions and on-road emissions of Beijing diesel buses measured by using portable emission measurement system and electric low-pressure impactor. Sci. Total Environ. 2011, 409, 1476–1480. [Google Scholar] [CrossRef]
  33. Liu, Y.; Tan, J. Green Traffic-Oriented Heavy-Duty Vehicle Emission Characteristics of China VI Based on Portable Emission Measurement Systems. IEEE Access 2020, 8, 106639–106647. [Google Scholar] [CrossRef]
Figure 1. Outline view of HDDV PEMS.
Energies 14 03989 g001
Figure 2. Diagram of the testing process.
Energies 14 03989 g002
Figure 3. NOx emission and EFM exhaust temperature of tested vehicles.
Energies 14 03989 g003
Figure 4. The NOx emission maps of the engines of tested vehicles.
Energies 14 03989 g004
Figure 5. CO (a), CO2 (b), and NOx (c) brake specific emission factors for tested vehicles at different loads; fuel consumption (d) and urea/fuel ratio (e) for tested vehicles at different loads. The urea/fuel ratio of Vehicle No. 2 at 0% load was not measured in this test.
Energies 14 03989 g005
Figure 6. NOx emission factors of vehicles for three driving patterns and three load conditions.
Energies 14 03989 g006
Figure 7. Average NO, NO2 concentrations and p-NO/NOx from Vehicle No. 1 and 2 for three driving patterns and three load conditions.
Energies 14 03989 g007
Table 1. Information about vehicles tested.
Vehicle IDTotal Mass (kg)OperationEmission StageDisplacement (L)Power (kW)After-TreatmentOdometer (km)
No. 124,600Long HaulChina IV6.5162Failure SCR48,280
No. 224,600Long HaulChina IV6.5162Normal SCR74,538
Table 2. Comparison of the tested driving cycles on different road types.
Vehicle IDRoad TypeTime Proportions of Driving Cycles (%)Average Speed
(km/h)
IdlingCruising aAcceleration aDeceleration a
No. 1Urban road4.4563.8716.6615.0223.32
Suburban road1.6369.8215.5612.9954.06
Motorway2.7153.124.0520.1572.51
No. 2Urban road5.9755.3520.691822.43
Suburban road0.6555.5923.5720.251.95
Motorway3.1652.6222.6421.5872.39
a Definitions of acceleration, cruising, and deceleration during the driving periods are an incremental speed change of >0.1 m s−2, within ±0.1 m s−2, and <−0.1 m s−2, respectively.3.2 NOx concentration and exhaust temperature.
Publisher’s Note: MDPI stays neutral with regard to jurisdictional claims in published maps and institutional affiliations.

