Abstract
In Canada, more than 80% of energy in the residential sector is used for space heating and domestic hot water (DHW) production. This study aimed to model and compare the performance of four different systems, using solar energy as a renewable energy source for DHW production. A novel microchannel (MC) solar thermal collector and a microchannel-based hybrid photovoltaic/thermal collector (PVT) were fabricated (utilizing a microchannel heat exchanger in both cases), mathematical models were created, and performance was simulated in TRNSYS software. A water-to-water heat pump (HP) was integrated with these two collector-based solar systems, namely MCPVT-HP and MCST-HP, to improve the total solar fraction. System performance was then compared with that of a conventional solar-thermal-collector-based system and that of a PV-resistance (PV-R) system, using a monocrystalline PV collector. The heat pump was added to the systems to improve the systems’ efficiency and provide the required DHW temperatures when solar irradiance was insufficient. Comparisons were performed based on the temperature of the preheated water storage tank, the PV panel efficiency, overall system efficiency, and the achieved solar fraction. The microchannel PVT-heat pump (MCPVT-HP) system has the highest annual solar fraction among all the compared systems, at 76.7%. It was observed that this system had 10% to 35% higher solar fraction than the conventional single-tank solar-thermal-collector-based system during the wintertime in a cold climate. The performance of the two proposed MC-based systems is less sensitive than the two conventional systems to collector tilt angle in the range of 45 degrees to 90 degrees. If roof space is limited, the MCPVT-HP system is the best choice, as the MCPVT collector can perform effectively when mounted vertically on the facades of high-rise residential and commercial buildings. A comparison among five Canadian cities was also performed, and we found that direct beam radiation has a great effect on overall system solar faction.
1. Introduction
Renewable and sustainable energy generation technologies have been a concern for scientists due to climate change, increasing greenhouse gas emissions, and limited fossil fuel resources. More than 32% of the energy used in Canada is in the building sector; more than 80% of this fraction is used for space heating and to generate domestic hot water (DHW) [1]. Solar thermal collectors are a common way to generate DHW directly from solar irradiation. However, they are currently being overtaken by photovoltaic panels as the dominant method of solar energy production due to the decreasing manufacturing cost of photovoltaic panels. There is excellent potential for coupling PV arrays to heat DHW by using electricity. To improve photovoltaics’ efficiency by reducing the temperature of photovoltaic cells while simultaneously generating electricity and thermal energy, hybrid Photovoltaic/Thermal systems (PVT) have been studied by many researchers [2]. Additionally, PVT collectors can be used as a source of energy for DHW production. A variety of sustainable choices for solar hot-water heating are currently available, including traditional solar thermal systems (ST-DHW), PV powered electric resistance-based water heaters (PV-R), and systems combining both technologies (PVT-DHW). Currently, there are no clear winners, and to date, few direct comparisons of energy performance have been made. In the current study, all these systems are compared to measure their performance as DHW heaters in cold-climate applications.
Providing enough thermal energy for DHW during the wintertime is crucial because solar collectors cannot generate enough high-temperature water. For that reason, solar thermal collectors and PVT collectors are integrated with a water-to-water heat pump to use low-temperature water as a heat source to produce the desired DHW temperature. To enhance the efficiency of solar thermal collectors, a novel microchannel (MC) flat-plate heat exchanger was designed that consisted of very thin channels inside the heat exchanger covering most of its active surface. The microchannel flat-plate heat exchanger offers significant improvements in thermal efficiency by using a continuous fluid jacket adjacent to the surface of the active plate of the exchanger, thus providing a large active area of heat exchange and maintaining a uniform temperature across the whole active surface without the temperature peaks that occur in between the tubes of current “plate and tubes” solutions.
Based on the MC heat exchanger, a novel solar thermal collector was fabricated and will be laboratory bench and field tested as a part of ongoing research. The MC heat exchanger was also upgraded to a PVT collector by adding PV panels on top of the exchanger. Due to the microchannel heat exchanger design, coolant circulating through the MC heat exchanger evenly cools all the photovoltaic cells. This leads to enhanced cooling efficiency across the entire area of PV cells and to increased efficiency of the photovoltaic process. This type of collector is suitable for integration with HPs to supply DHW.
The most efficient tilt angle for a fixed solar thermal and PVT collectors is around the local latitude [3]. The main gap in the literature is how to combine a PVT collector to a vertical façade without significant efficiency drop of the system. A high tilt angle makes the system more compatible for the summertime by preventing overheating the collector and water tank. On the other hand, in the wintertime the collector can absorb more irradiance than a non-vertical tilt angle. The main objective of this study was to design a solar-based system with a high solar fraction, to provide DHW for a cold climate, such as Canada’s. In this study, a novel microchannel heat exchanger is used to make better heat exchange through the collector. Adding a heat pump to the system makes it possible to harvest solar energy with higher efficiency but at a lower water tank temperature. The heat pump produces domestic hot water from low-temperature water. Thus, the whole combination of MCPVT-HP and MCST-HP makes it possible to have a high solar fraction for a 60–90-degree tilt angle which is invaluable insight and finding. This paper aimed to assess four different solar systems for DHW generation in cold climates (Canada) and evaluated the efficiency of the microchannel based solar thermal and PVT collectors. Five systems were modeled in TRNSYS software: a conventional solar thermal collector (ST-DHW), a PV resistance (PV-R) system, a microchannel solar thermal collector integrated with a water-to-water heat pump (MCST-HP), a microchannel PVT collector integrated with a water-to-water heat pump (MCPVT-HP), and a simple electrical water heater tank as the base case system. All solar systems had the same 4 m2 collector area to allow for more consistent comparisons. The systems were evaluated and compared to investigate which system was most suitable for single-family DHW provision in cold climates such as Canada’s. The role of critical system parameters, such as preheat tank size, circulation pump flow rate, and collector tilt angle on overall system performance, was studied.
In Section 2, a review of solar DHW systems and previous work is presented. In Section 3, the modeling methodology is discussed, and system descriptions are provided. The novelty of the proposed collectors is also explained. Section 4 contains results, system comparisons, and discussions. The main conclusion and recommended future works are presented in Section 5.
2. Background
Many studies have been completed for DHW provision by solar systems such as solar thermal collectors, PVT collectors, and PV-resistance. Each method has unique advantages and disadvantages. Solar-assisted heat pump (SAHP) systems with different applications are investigated in many research studies as a reliable source of residential heating demand [4]. A comprehensive review of different solar-assisted heat pump types, especially for DHW provision, is presented by References [5,6]. Direct and indirect solar-assisted heat pumps with a single DHW tank are studied in most research. By summarizing the available published works, Rodriguez et al. [7] found a strong relationship between theoretical and experimental prototypes of a single-tank direct solar-thermal heat pump. According to their findings, a 5.6 m2 solar thermal collector could maintain DHW for 150 L/day of consumption in Spain’s climate. The coefficient of performance (COP) varied between 1.7 and 2.9, and a maximum condensation temperature of 57 °C was reported. Many factors affected the efficiency of the overall system. Seara et al. [8] showed that the COP of a direct solar-assisted heat pump is highly dependent on the solar irradiance availability and ambient temperature.
Photovoltaic (PV) panels can only convert between 16% and 28% [9] of the incident solar radiation to electricity under controlled conditions (Standard Test Conditions (STC), i.e., for the one Sun (AM1.5) illumination and a cell at a temperature of 25 °C). STC conditions are rarely met in the field and most solar photovoltaic installations are operating at temperatures greater than 25 °C. What is important is that the efficiency of contemporary photovoltaic cells drops when temperature increases above 2 °C, with a decline of between 0.1% and 0.5% per every 1 °C temperature increase [10]. Under ordinary conditions, more than 80% of the incident solar radiation is converted to heat or reflected. These losses are the main result of increasing the temperature of PV panels [7]. A hybrid Photovoltaic/Thermal (PVT) system harvests solar energy to generate both electricity and heat simultaneously. This technology is used to improve the PV panel’s efficiency by cooling down its PV cells while generating thermal energy for heating. This technology uses less surface area in comparison to using solar thermal collectors and solar PV panels separately.
In many cases, PVT systems are designed to enhance the electrical output of the PV panels by lowering the surface temperature of PV cells (with the goal of approaching Standard Test Conditions). Thus, for a water-based PVT system to have a higher electrical efficiency it is important to keep the fluid temperature low. On the other hand, by allowing temperature increase of the coolant leaving the PVT collector, the system becomes suitable for heating applications that need a relatively high-temperature water supply. However, in this case the electrical output of the PV cells declines. It is essential to understand the system’s purpose and find a trade-off for optimum electrical and thermal output. Brottier et al. [11] performed thermal analysis of 28 different PVT solar DHW collectors in different European cities. Each PVT was installed with a different collector area and a preheat tank to collect solar thermal energy. This study shows that a PVT collector can be used as a preheater of DHW even when summertime daily maximum temperatures of above 45 °C are reached. The study shows that, in certain conditions, a PVT collector could provide twice as much electricity as a “PV only” panel with the same absorber area. Herrando et al. [12] investigated a PVT collector for the provision of DHW and electricity to a UK house. It was shown that, with a flow rate of 20 L/h and 100% PVT fill factor, 36% of the total hot water and 51% of the home’s total electricity could be covered by the PVT system. Higher flow rate had a small impact on the PV efficiency improvement; on the other hand, by decreasing the flow rate, the collector’s thermal efficiency increased significantly. The increase in efficiency was a result of the system having a bypass circuit which only allowed water from the collector to enter the tank when the collector temperature was higher than the tank temperature. For higher mass flow rates, the outlet temperature of the PVT collector decreased. Because of the single-tank system design, a higher flow rate reduced the total collector efficiency and increased collector heat loss. The study observed that, due to the cooling effect, the PVT system could produce 2% more electricity than a PV-only system. Kalogirou and Tripanagnostopoulos [13] performed a TRNSYS simulation based on a fabricated PVT collector. Despite a small electrical reduction output of PV panels, the total harvested energy was noticeably higher than the PV-only system. Their economic analysis shows that weather conditions have a noticeable impact on the return on investment (ROI), which can vary between 15 and 30 years.
Adding a heat pump to improve the overall efficiency of the PVT–DHW system and provide desired DHW temperature is beneficial. A prototype of an indirect PVT solar-assisted heat pump/heat pipe was made by Fu et al. [14] in Hong Kong. This system has a single DHW tank charged directly by a solar thermal collector or a heat pump cycle. A 4.668 m2 PVT collector showed that, under the heat-pipe mode, the system could hardly maintain viable DHW temperature. In the heat pipe mode, the daily average efficiency of the system was 36.5–38.4%. However, switching to solar-assisted heat pump mode could increase the daily average efficiency to 61.1–82.2%, with a COP of 4.01 on sunny days. Many other kinds of research focused on PVT collectors for residential low-temperature thermal demand can be found in References [2,15]. Annual system performance will also depend on climate and load, further complicating the comparison. Banister et al. [16] made an apparatus to evaluate the accuracy of the TRNSYS model for a dual-tank solar-assisted water-to-water heat pump. The experimental results showed high accuracy and reliability of TRNSYS simulations, which led the current study to use this software as the modeling and simulation platform.
The surface temperature of a PV panel has a noticeable effect on the PV efficiency. When surface temperature increases, PV efficiency decreases [17,18]. Many different systems were investigated to reduce the PV panel temperature and increase the PV panel efficiency [17,19]. One of the most reliable equations to show the temperature–power relationship was derived by Evans [20] and is applicable for most PV panels. It was shown that, for each PV array, the total output power of the panel is restricted by the lowest efficient PV cell [18]. In common PVT collectors, the heat absorber pipes of the thermal collectors are attached to the PV panels’ back with a relatively high distance between each pipe. Since coolant is circulating inside the pipes, the PV cell temperature drops for those cells in contact with the pipes. However, PV cells that are not in contact with the pipes are cooled down at a lower rate, and their temperature remains higher than other PV cells. Higher temperature reduces PV cell power; hence, the panel’s total power is reduced due to this restriction. The creation of high- and low-temperature spots on the surface of PV cells is one reason for PV panel power reduction in many PVT collectors.
Designing an efficient heat exchanger to remove heat flux and increase the thermal efficiency of the system is one of the most important system design factors [21]. There are different methods of enhancing the thermal efficiency of heat exchangers, such as using nanoparticles to the based fluid, vibration, and adding roughness to the surface of heat exchangers. However, in many cases, enlarging the surface area (such as using fins or microchannel) is considered to enhance heat exchanger thermal efficiency [22]. The microchannel heat exchanger can remove thermal energy in a more compact size than regular heat exchangers. They are relatively easy to be manufactured and can be more cost effective than other types of heat exchangers. Much research has been conducted to study the effect of different fluid and nanofluid on the thermal conductivity of the microchannel heat exchanger [23,24,25]. Arani et al. [26] studied the effect of nanofluid particle volume fraction on heat transfer inside a microchannel heat sink. It was shown that, by increasing the nanoparticle volume fraction, the microchannel thermal resistance decreased. It could lead to accelerating the heat transfer rate and decreasing the temperature gradient ratio of the microchannel’s bottom wall. Behnampour et al. [27] studied the effect of different rib shapes of microchannel heat exchanger wall on the heat transfer of water–Ag nanofluid. It was shown that the triangular rib has the best thermal performance among other shapes of ribs and the rectangular rib form has the highest change in the streamlines. There is not enough study on utilizing different types of microchannel heat exchangers in PVT collectors. Motamedi et al. [28] developed a prototype and utilized a microchannel heat exchanger and nanofluids in a PVT collector to reduce pumping power requirement. It was shown that, by using Ag/SiO2 as nanofluid, the pressure drop along the microchannel heat exchanger reduced on average 17% in comparison with a smooth channel.
In this paper, to minimize the PV panel hot and cold spots to improve PV efficiency, a novel type of microchannel (MC) heat exchanger was designed and fabricated. The MC heat exchanger consists of many narrow channels covering all surface areas of the heat exchanger. The coolant flows through the channels and makes a uniform temperature gradient all over the heat exchanger’s surface. Due to the very high surface area in the MC heat exchanger and uniform temperature gradient, it can be assumed that all PV cells have the same temperature gradient as the heat exchanger. As a result, high and low-temperature spots no longer exist on the surface of PV cells due to a more uniform cooling process. All PV cells in contact with the MC heat exchanger can have the same output power due to uniform temperature gradient over the PV panel surface. In addition, the higher active surface area of the MC heat exchanger results in more thermal energy being collected. In this paper, the impact of using a microchannel heat exchanger for solar thermal and PVT collectors was investigated.
3. Methodology and Simulation
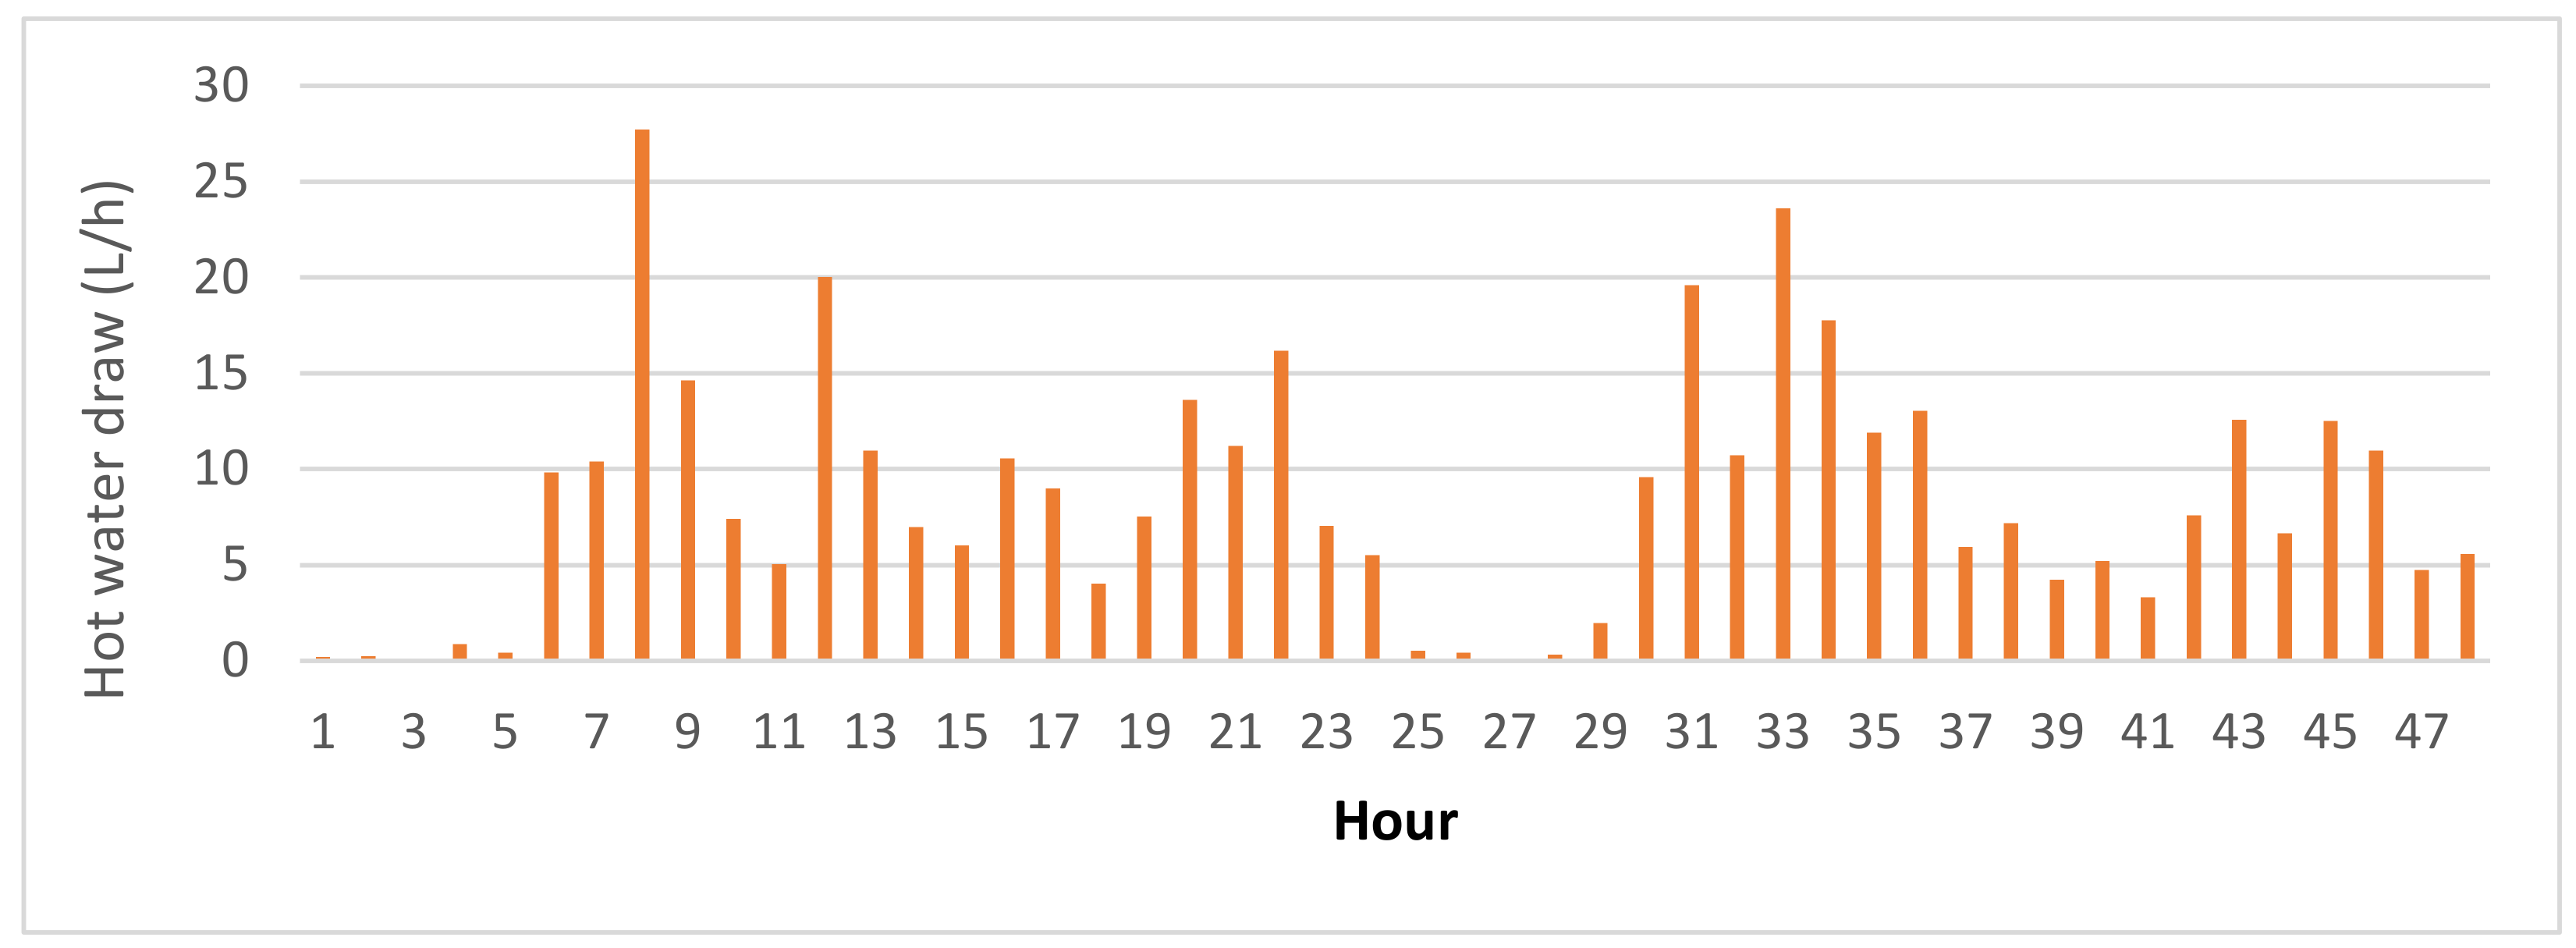
A microchannel heat exchanger (MCHX) was fabricated in collaboration with a Canadian company that works on microchannel-based solar thermal systems. Based on that microchannel heat exchanger, a microchannel solar thermal collector and a microchannel-based PVT collector were designed and fabricated to study the impact of the MCHX on the proposed solar systems. Both MC-based solar collectors were integrated with a water-to-water heat pump (HP) for DHW provision in a Canadian single-family dwelling. Since HPs are able to work with low-temperature heat sources, they can use solar thermal energy generated by the collectors efficiently even at low temperatures. This paper is a preliminary modeling and simulation study to investigate the potential of such microchannel-based ST and PVT in DHW systems for cold-climate applications. The scope of this study was to model, simulate, and then compare the following solar-based DHW heating systems: (1) microchannel-based solar thermal collector and heat pump (MCST-HP), (2) microchannel-based PVT collector and heat pump (MCPVT-HP), (3) PV collector and resistance element (PV-R) system, and (4) conventional single-tank solar thermal collector (ST)-based DHW heaters. In addition, a commonly used electric DHW heater tank is also modeled as the base case for the comparison. To compare different aspects of all five systems, the systems were simulated in TRNSYS software. The TRNSYS Metronome library provides the Toronto weather data for the simulation. In a simulation involving hot-water loads, it is essential to correctly model the water-draw profile. A typical residential water-draw profile varies from region to region and is strongly dependent on resident behavior [29]. An average 2-day hot-water-draw (205 and 196 L/day) profile (Figure 1) was chosen for this study based on Canada DHW usage reported by IEA Annex 42 [30]. In this report, a model with 0.21 L/min resolution was programmed based on IEA SHC Task 26 DHW model [31] to drive the DHW profile. The program produced sets of DHW profiles at different time steps (from 1 min to 60 min) and different daily DHW consumption. The model was validated by comparing it to the available Canada DHW profiles. In contrast with Europe, most dishwashers and washing machines in Canada use DHW instead of cold water. The water-draw profile in Canada has one morning and one evening peak driven by showers and washing machines. The morning peak is from 6:00 to 9:00 a.m. with an average of 18 L per hour. The evening peak is from 8:00 to 10:00 p.m. with an average of 18 L per hour. There is almost no water draw from midnight to 5:00 a.m. The rest of the hours have an average of 8 L per hour of hot-water draw. The cold-water supply temperature delivered to the tank is chosen from the climate data library in TRNSYS. The cold-water supply temperature in Toronto varies from 6 °C in the wintertime to a maximum of 16 °C in the summertime.
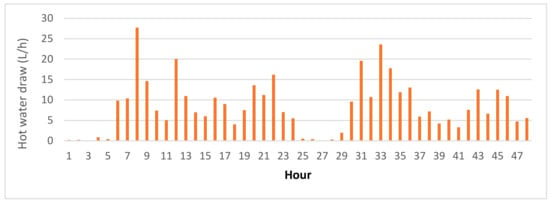
Figure 1.
Average Canadian 2-day water-draw profile.
Hailu and Fung [3] indicated that the optimum seasonal tilt angle for PVT for the Toronto climate should be 66°–69°, 40°, 27°, and 50°–53° for winter, spring, summer, and fall, respectively. At these angles, a solar collector can collect the highest amount of solar irradiation. Based on an anisotropic model, the authors indicate that the optimum annual tilt angle for the Greater Toronto Area (GTA) may be around 46°. For this work, a fixed tilt angle is used for the collector for all seasons. As all collectors do not have solar tracking systems to improve their efficiency, they all have 0° azimuth angle and are faced due south. A sensitivity analysis on the effect of tilt angle on overall system solar fraction is performed to investigate whether different systems would have different optimal tilt angles. In this study, all collectors (in all cities) have a 45° tilt angle.
While each proposed DHW system presented in this paper has a different configuration and parameters, some components are the same in all systems. For all the systems, circulation pump energy consumption and pipe heat loss were ignored due to their minimal impact on the results.
This section may be divided by subheadings. It should provide a concise and precise description of the experimental results, their interpretation, as well as the experimental conclusions that can be drawn.
3.1. Electric-Resistance Water Heater (Base Case)
A base-case electric-resistance water-heater system is chosen to compare to the four different proposed solar-based DHW systems with regard to energy consumption, efficiency, etc. It consists of a conventional hot-water tank that has two 1500 W immersed electric resistance element heaters that function as a master–slave pair. The bottom element can be enabled only when the top element is off. Thus, it is not possible to allow both elements to be on at the same time. This setting helps to improve overall efficiency of the system by controlling water temperature at each node and reducing tank heat loss. If there is no water draw, only the top part of the tank should be set to 55 °C. The top element has a 55 °C set point with 5 °C deadband to ensure load temperature is always around 55 °C. The bottom heater has a 35 °C set point with 5 °C deadband to preheat water in the lower portion of the tank. Table 1 shows the base case DHW heating energy consumption and average temperature for five Canadian cities. It shows that Edmonton has the lowest average ambient temperature and the highest base case DHW energy demand. All parameters of the electric water heater are shown in Table 2. The tank is refilled by city water and the TRNSYS Metronome library provides the city water-supply temperature.

Table 1.
Monthly base case DHW energy vs. temperature.

Table 2.
Preheat and DHW tank characteristics.
3.2. Microchannel Solar Thermal Collector and Heat Pump System (MCST-HP)
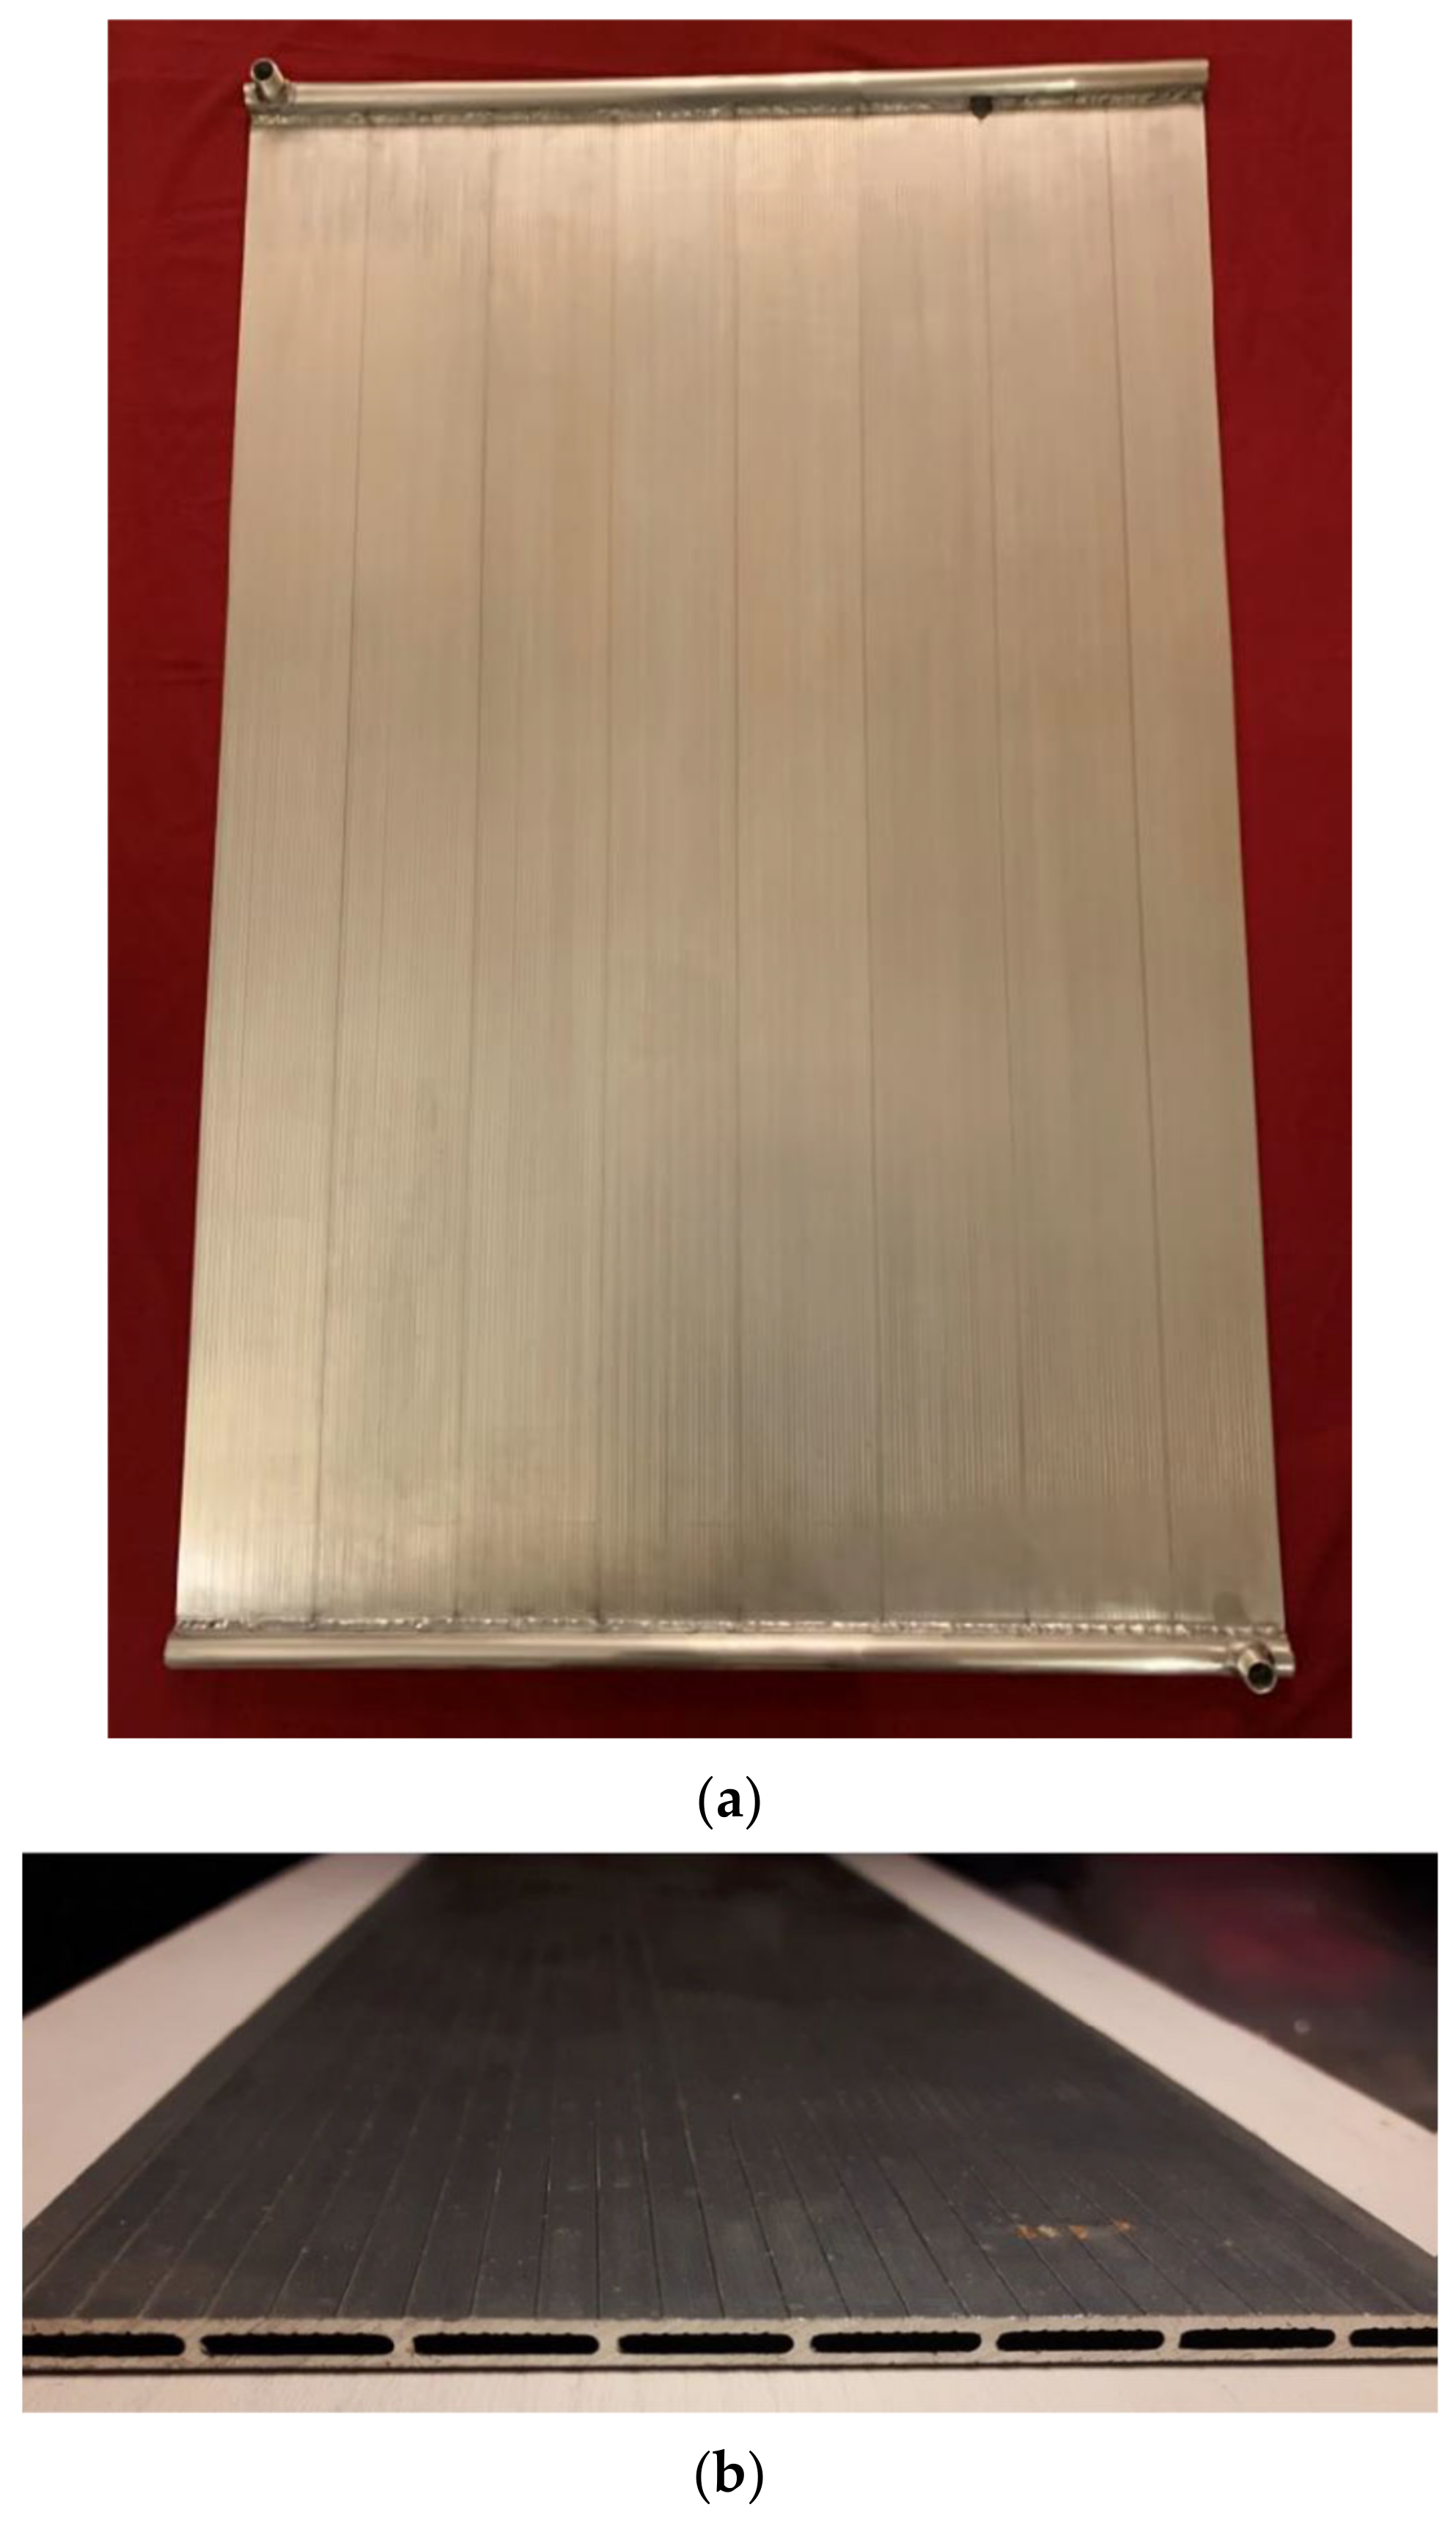
A novel microchannel solar thermal collector that consists of a microchannel heat exchanger was fabricated (Figure 2a,b) for experimental research. Based on the fabricated collector’s thermal properties, the TRNSYS model of MCST type was made. TRNSYS simulations are made of individual components. These individual components represent a piece of equipment that is made of a system of equations to calculate its performance. A complete model is made of different component (known as “types”) that are connected in a logical sequences and similarly to how they would be connected in real life [32].
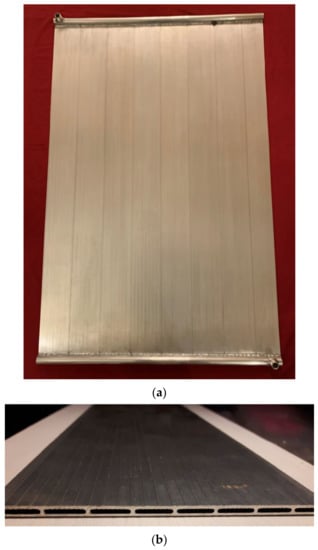
Figure 2.
(a) Fabricated microchannel (MC) heat exchanger; (b) Cross-section of the MC heat exchanger element.
Table 3 presents the specifications of the MC heat exchanger and the fabricated MC solar thermal collector. Very thin microscale channels allow liquid to flow inside the MC heat exchanger. Because the absorber has many channels, it has a higher active absorber surface area which leads to a better heat exchange rate. Total absorber area of 4 m2 was chosen for modeling in all four solar-based DHW systems. As each collector has a 2 m2 (1 m × 2 m) absorber area, two MCST collectors are connected in parallel to have an overall 4 m2 collector area.

Table 3.
Microchannel Heat Exchanger Specifications and Microchannel Solar Thermal Collector Specification.
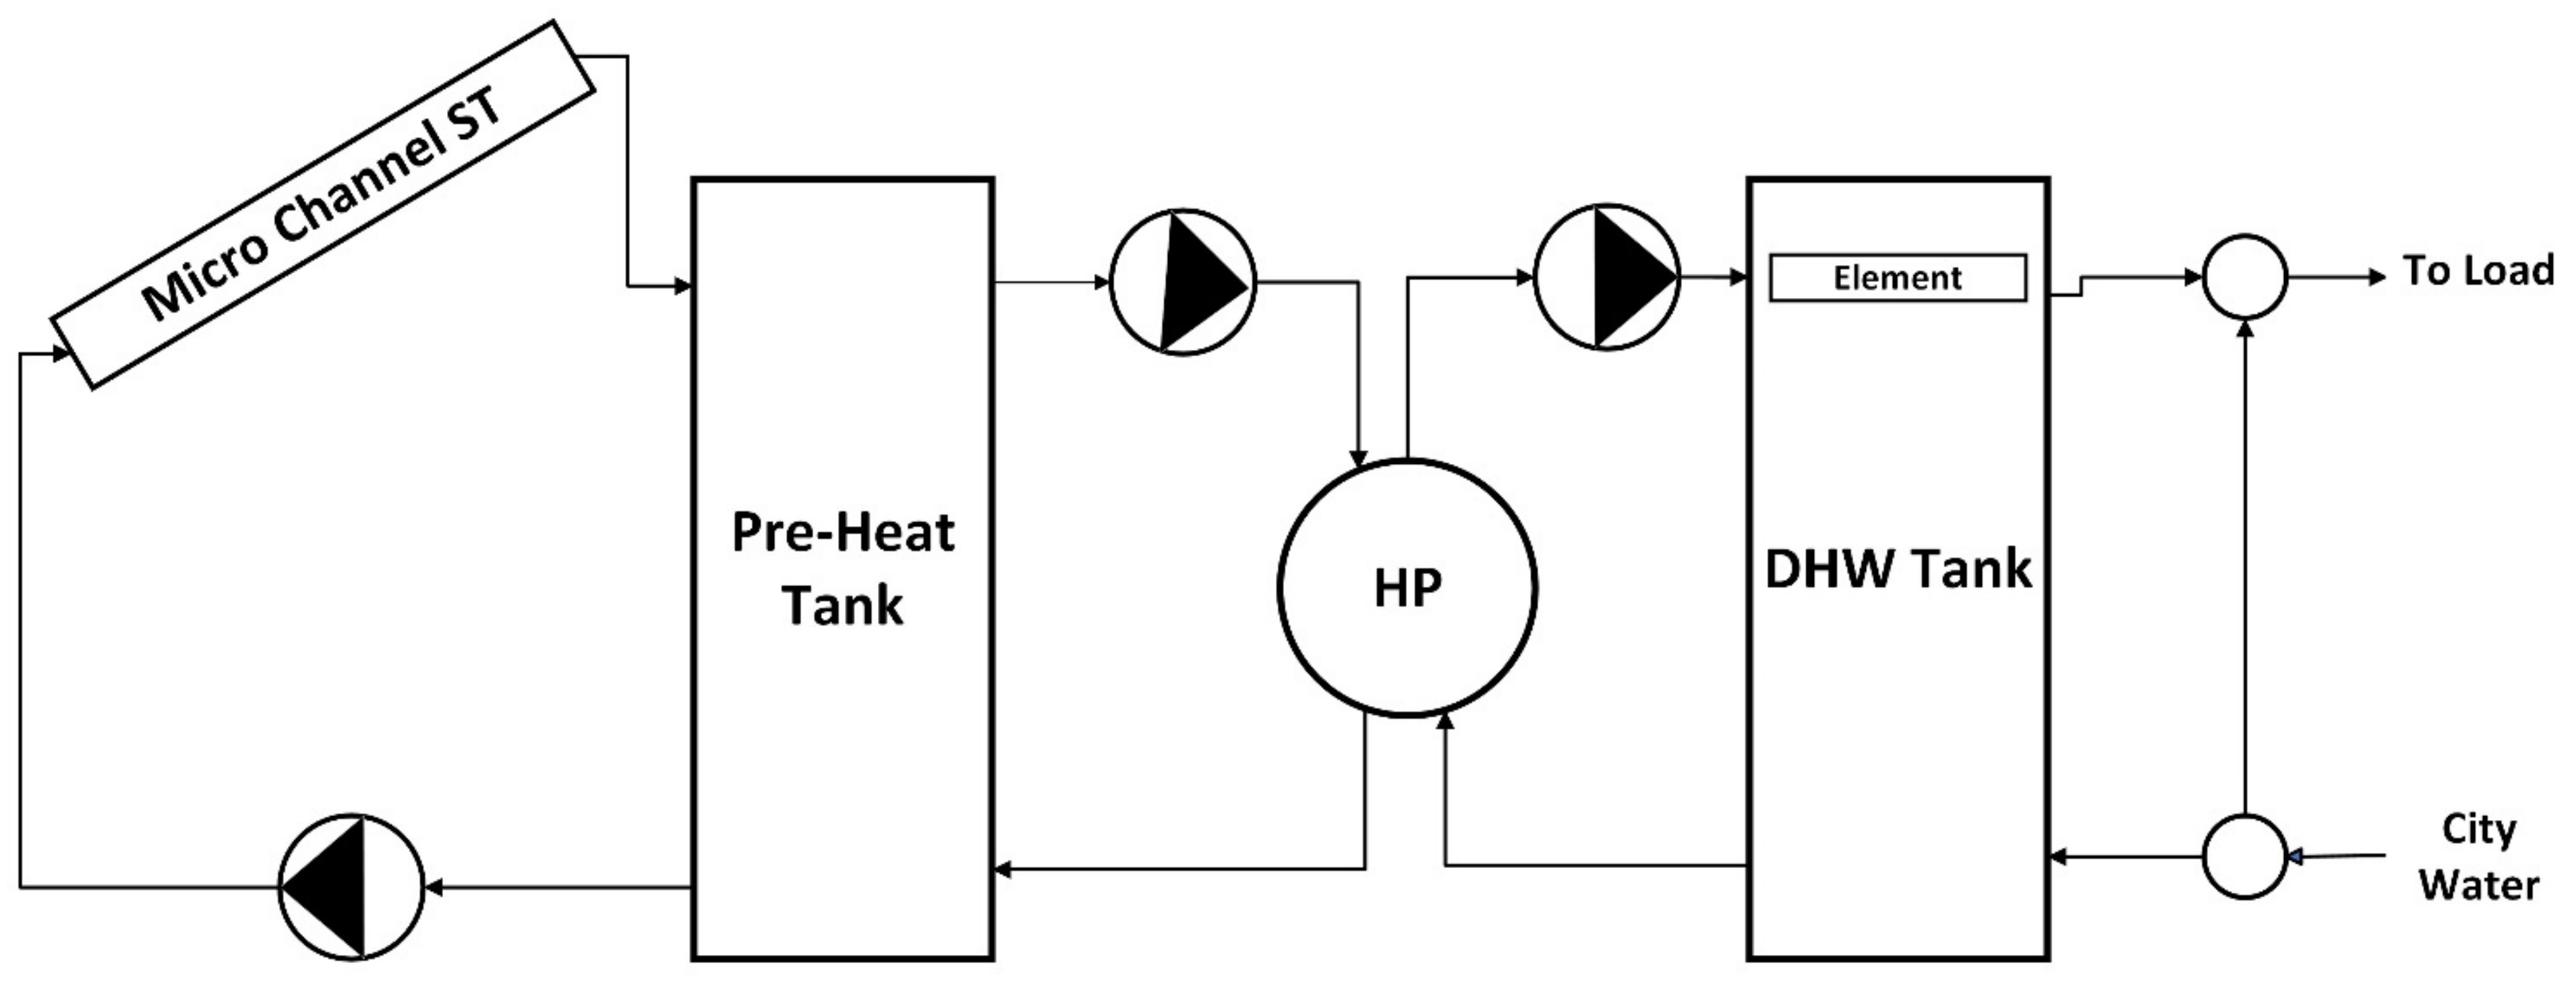
An indirect dual-storage solar-assisted heat pump is presented in Figure 3. The configuration of a microchannel-based solar thermal with heat pump (MCST-HP) domestic hot-water system consists of the following: a microchannel solar thermal collector, two stratified tanks (one of them with electric resistance elements), a water-to-water heat pump, pumps for circulating water/anti-freeze, controllers, and aquastats.
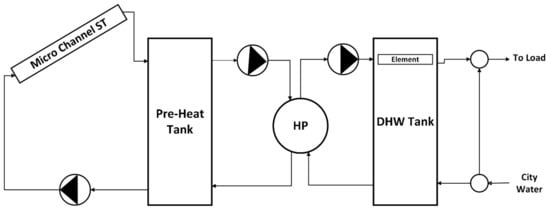
Figure 3.
Schematic of MCST-HP DHW system.
The first tank (preheat tank) on the left-hand side of Figure 3 is connected to the MCST collector. It collects solar thermal energy and provides a stable source of heat for the water-to-water heat pump. Having the first tank connected to the HP makes it possible to collect as much solar thermal energy as possible into the preheat tank. The HP can work in a wide temperature range from −3.5 to 60 °C. For this reason, the HP can be integrated with the preheat tank and collect all the heat collected by the MCST collector and minimize heat loss from the collector to surroundings due to temperature differences. To study and control water temperature more accurately based on the height of the tank, the preheat tank was divided vertically into 20 nodes, having node 1 at the top and node 20 at the bottom. An aquastat controller controls the variable speed pump to circulate the fluid/anti-freeze inside the MCST collector. The pump starts circulating the working fluid/anti-freeze when there is a 5 °C temperature difference between the outlet of the collector and the bottom part of the preheat tank. In order to prevent freezing during wintertime, a mixture of 50–50% water–glycol solution is used as the circulating fluid. The preheat tank has two pairs inlets/outlets. For the first inlet/outlet pair, the cold anti-freeze leaves the tank from node 20 and goes to the MCST collector. Preheated fluid/anti-freeze from the MCST collector enters the tank from node 1. The second inlet/outlet pair is connected to the water-to-water heat pump. Preheated anti-freeze leaves from node 1 and goes to the evaporator of the heat pump while the cooled anti-freeze returns back to the preheat tank at node 20. A water-to-water heat pump is connected between the preheat tank and the DHW tank on the right-hand side of Figure 3. The preheat tank acts as a heat source for the HP’s evaporator. The second tank (DHW tank) is designed to receive the heat output from the heat pump’s condenser which provides DHW. To consistently maintain the outlet temperature of the DHW close to the set-point temperature, a backup electrical resistance element is positioned at node 1 of the DHW tank. Finally, at the DHW tank outlet, an anti-scald safety valve is integrated to prevent excessive high-temperature water supply to household services.
There is a critical relationship between the solar thermal collector area and the preheat tank volume. Comakli et al. [33] showed that, when the preheat tank size increased, the system’s overall efficiency increased. However, the stored water temperature fell, and may not have been high enough for DHW usage, particularly during wintertime in cold-climate regions. An optimized preheat tank size should be considered to prevent overheating of the system while maintaining optimum collector efficiency. Rodríguez et al. [34] showed that the correlation between collector absorber area (A) and tank volume (V) follows Equation (1) when the preheat tank is optimally sized. It was shown that, by considering V/A = 0.08 to 0.1, there was a balance between the system’s total cost (ST collector + preheat tank) and the system energy efficiency. For a 4 m2 solar collector, a 0.42 m3 (110 USG) preheat tank was selected as a standard water tank size.
In order to reduce tank heat loss, 2-inch eco-friendly blanket foam with thermal insulation of R13 (or RSI of 2.29) was used as a thermal insulator around and on top of the preheat tank. Table 2 shows the specifications of the preheat and DHW tanks.
Table 4 shows specifications of a water-to-water heat pump with a nominal output of 2.93 kW. In order to ensure that the HP does not extract too much heat from the preheat tank, a scale factor of 0.5 was applied to the HP simulation, reducing output to 1.46 kW. The HP component (Type) in the TRNSYS model is a single-stage water-to-water heat pump. The heat pump rejects heat from one liquid stream to a second. The HP model (Type) relies upon catalog data readily available from HP manufacturers. At the heart of the HP model, there is a heating performance data file that provides normalized capacity and power draw of the HP as functions of entering load fluid temperature and entering source fluid temperature. This component can interpolate data within the range of input values (cannot extrapolate) specified in the data files. If the HP heating signal is considered to be ON, the HP component, based on the entering load and source fluid temperature, calls the TRNSYS data file. In the next step based on the data file specified by the manufacturer, the TRNSYS component returns HP’s heating capacity and power draw. HP manufacturer catalog is provided in Appendix A Table A1.

Table 4.
Water-to-water HP specifications [35].
A controller is used to run the HP whenever node 4 temperature (bellow the backup electric resistance element) of the DHW tank is below 55 °C with a 5 °C deadband. This ensures that as much heat comes from the solar loop to the system as possible, and if there is not enough energy, the master-and-slave electrical heating elements provide the rest of the needed energy. An aquastat controls the minimum and maximum allowed temperature of −3.5 and 90 °C for the preheat tank.
To circulate the water–glycol and water in different parts of the system, variable speed pumps are used, and their specifications are given in Table 5 [36]. Six flow rates of 50, 100, 150, 200, 250, and 350 kg/h were applied on the left-hand side of the preheat tank to study the influence of flow rate on the PVT and ST systems’ efficiencies. However, for the main simulation a 350 kg/h flow rate was chosen for the solar loop. On the preheat tank’s right side (HP side) all pumps have a maximum of 900 kg/h flow rate, based on the HP specifications. Table 6 shows all TRNSYS simulation components and types used for the model.

Table 5.
Water pump specification [36].

Table 6.
TRNSYS components for MCST-HP and MCPVT-HP systems.
3.3. Microchannel Photovoltaic/Thermal Collector and Heat Pump System (MCPVT-HP)
Based on the heat exchanger used in the MCST collector, a microchannel PVT collector was designed and fabricated. It consists of a PV panel attached on top of the microchannel-based heat exchanger (MCHX). The MCST collector in TRNSYS has systems of the equation to calculate solar gain and thermal loss. The overall loss coefficient due to convection (STF1) and radiation (STF2) from the top of the collector can be calculated from Equations (1) and (2) [32].
where Ncover is the number of covers over the absorber, Ta is the ambient temperature, Tm is the mean collector temperature, hwind is the heat transfer coefficient due to wind, is the emittance of absorber plate, and is the emittance of cover glass. The overall loss coefficient is the sum of these contributions in kJ/h plus the loss coefficient from the back and edges of the collector (Ube):
Moreover, for flat-plate collectors, the reference overall loss coefficient (UL) is adjusted for both the transmittance, and the cell temperature can be calculated from Equation (5). UL,ref is the overall loss coefficient before adjusting for transmittance and cell temperature, is the cover transmittance, and is the PV cell efficiency at the reference conditions.
where .
In the PVT model, the PV efficiency was calculated based on the cell efficiency at reference conditions. Reference cell efficiency indicated the rate at which the PV section of the collector converts solar irradiance to electrical energy at reference and known cell temperature. Then the cell efficiency () can be calculated by Equation (6), wherein C is the temperature coefficient of the PV panel.
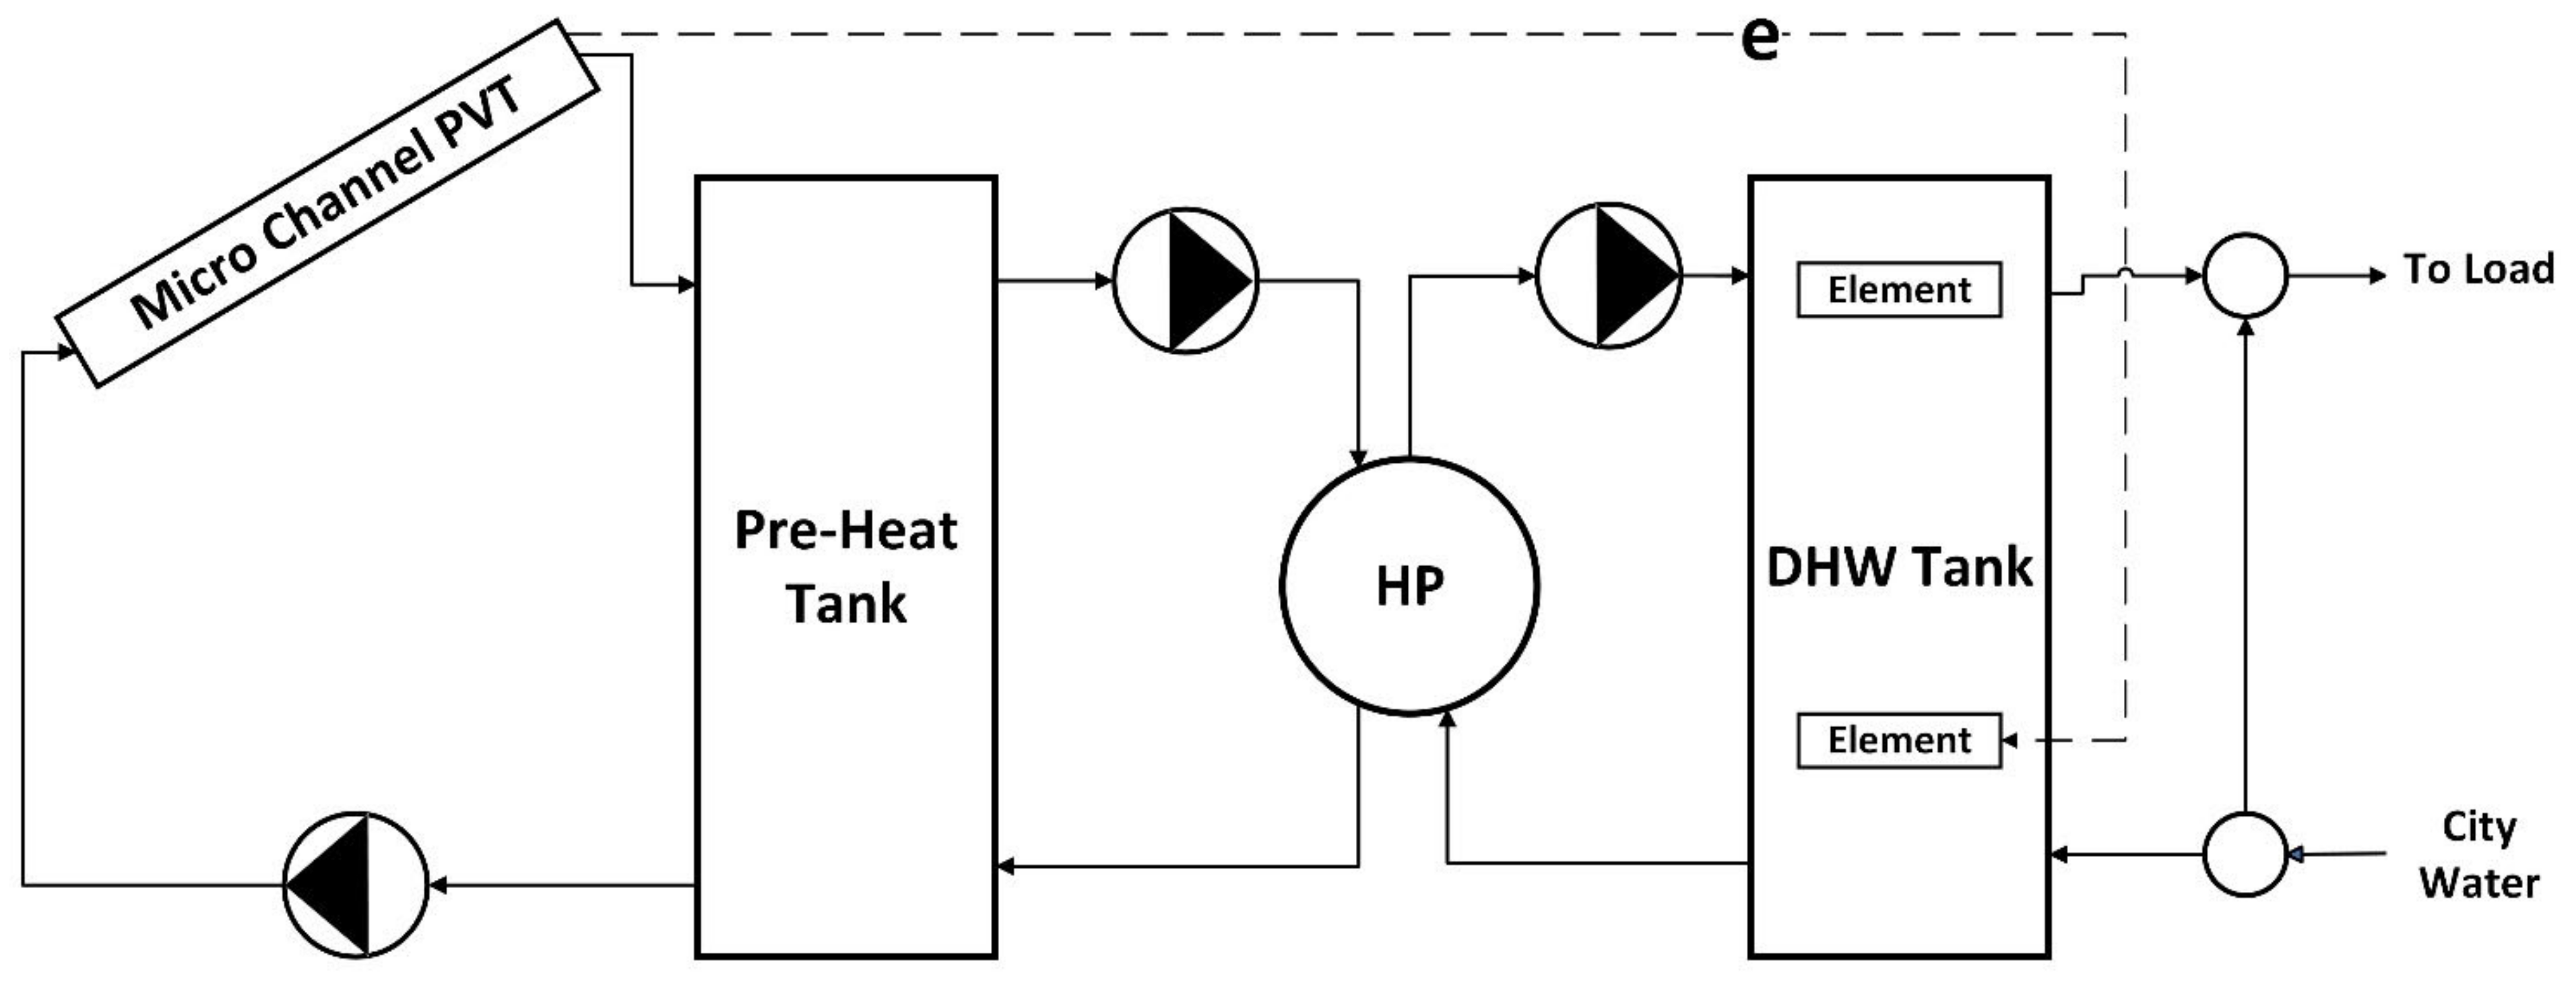
A dual-tank microchannel PVT collector integrated with a water-to-water heat pump is considered to improve the system’s overall efficiency (Figure 4). The electricity generated by the PVT collector is transmitted through a DC/AC inverter with a 95% conversion efficiency to a resistance heater located at node 10 of the DHW tank. Similar to MCST-HP, the HP is located between preheat tank and DHW tank. A controller with set points of 55 and 5 °C deadband turns on the HP whenever the DHW outlet temperature drops below the set point. Hot water from the HP enters the DHW tank from node 3. An electrical resistance element is added to the DHW tank in order to ensure 55 °C DHW supply. In this system, there are three possible ways to heat the water in the DHW tank: (1) hot water from the HP, (2) PVT electricity, and (3) backup electric resistance heater. All the other parts of the MCPVT-HP system are the same as what was presented for the MCST-HP system.
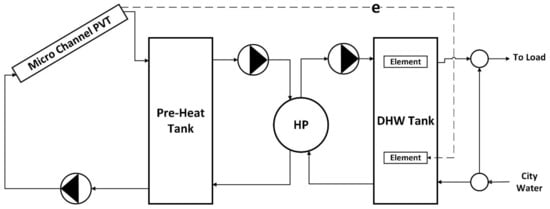
Figure 4.
Schematic of MCPVT-HP.
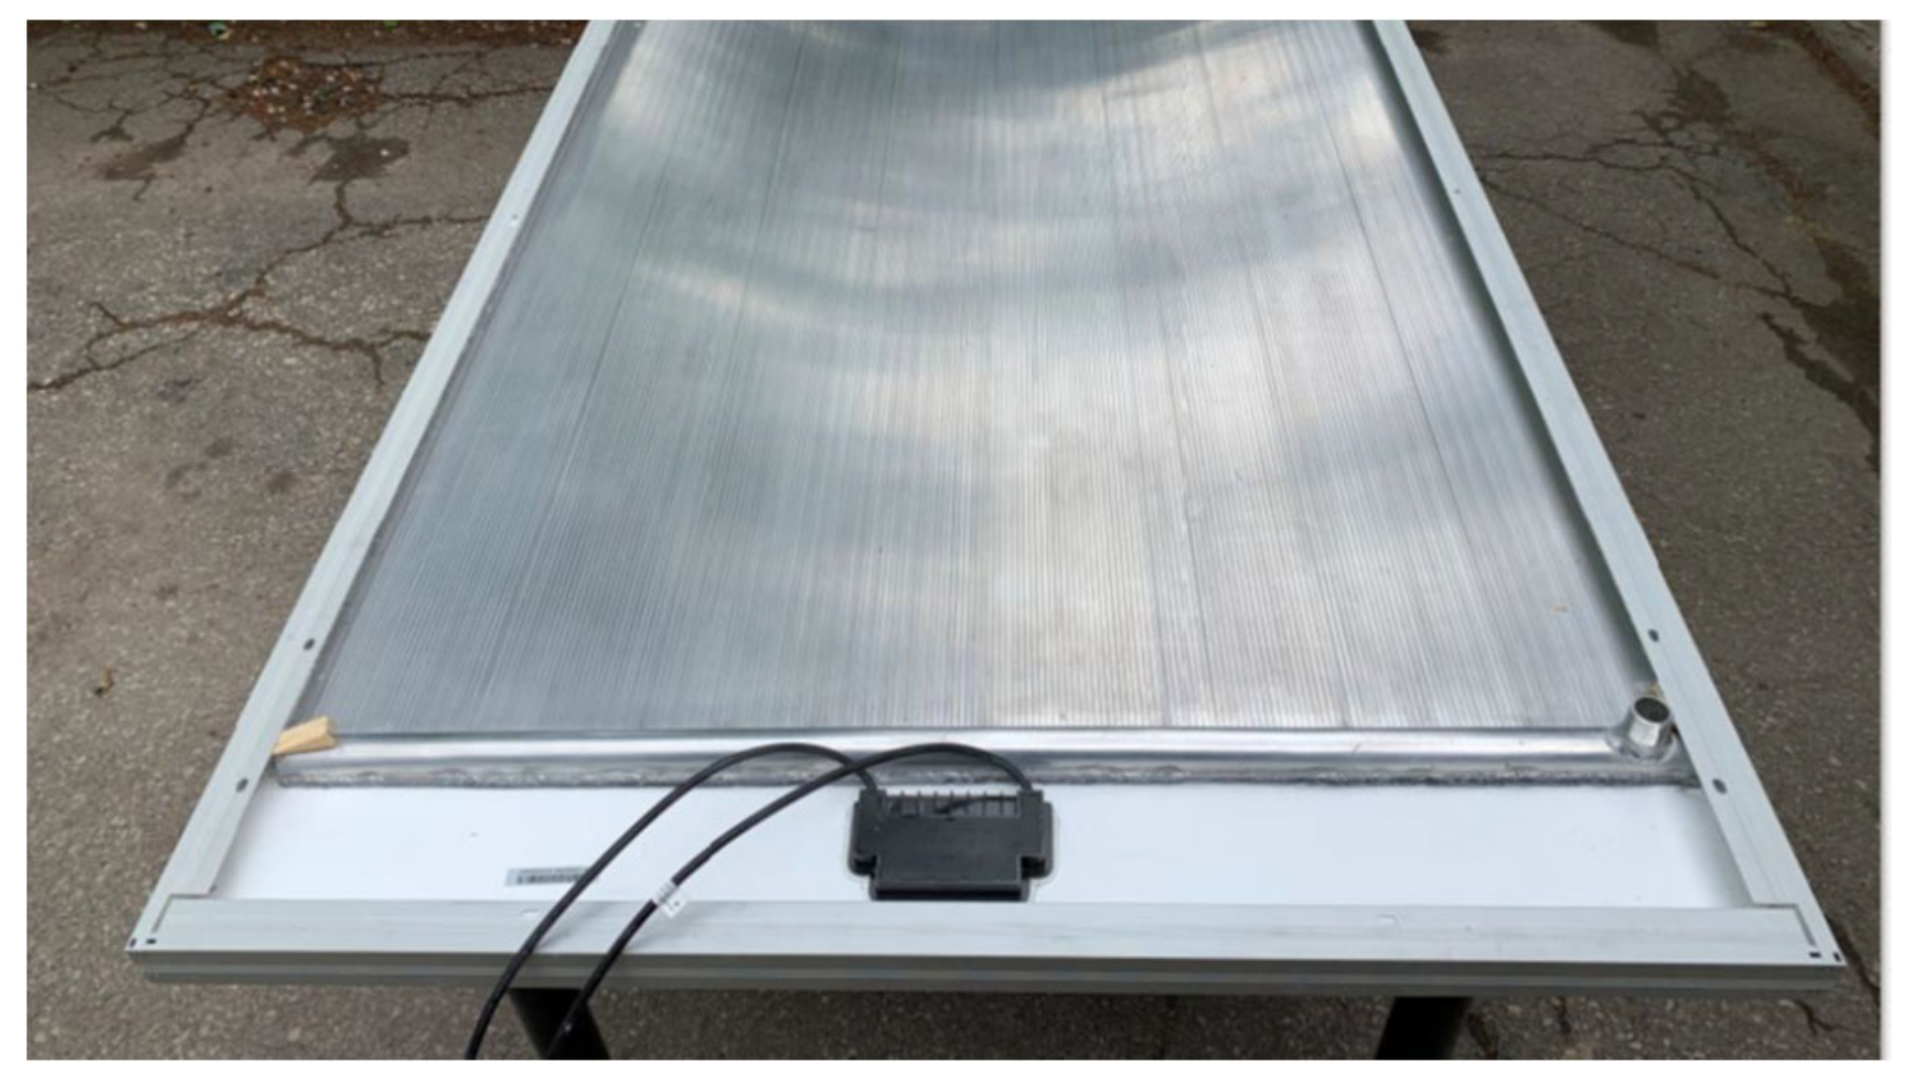
In order to model the PVT collector in TRNSYS, an unglazed liquid-based PVT collector type in TRNSYS is used. Its parameters are modified according to the microchannel thermal collector’s specifications. PVT parameters that were used for simulation are given in Table 7. The microchannel heat exchanger is directly attached to the PV panel’s back (the same PV panels for the PV-R system in Section 3.4) and has its back side insulated with a 1-inch polyisocyanurate sheet. Figure 5 shows the fabricated prototype of the MCPVT collector. Two MCPVT collectors are connected in parallel to have an overall 4 m2 collector area. Furthermore, Figure 5 shows the back side of the collector where the microchannel heat exchanger is attached to the back of the PV panel. The top part of the PV array is not covered by the microchannel heat exchanger.

Table 7.
PVT parameters for modeling in TRNSYS.
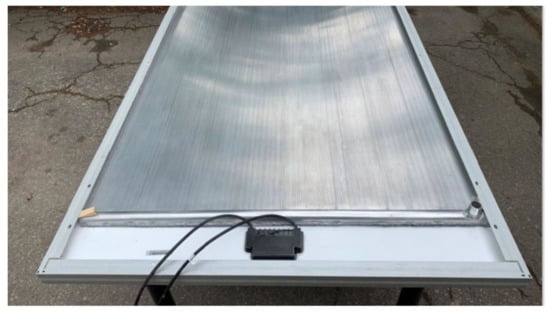
Figure 5.
Fabricated microchannel PVT collector.
Similar to MCST-HP, this system has an aquastat to monitor the temperature of the hot-water supply, which reduces the frequency with which the HP switches on/off. Electricity generated by the PV panels of the PVT collector passes through a DC/AC inverter, after which it is directly converted to heat by an electrical resistance element and heats the DHW tank. All the other components of this system have the same function and specifications as the MCST-HP system from Section 3.2.
3.4. PV-Resistance DHW Heater (PV-R)
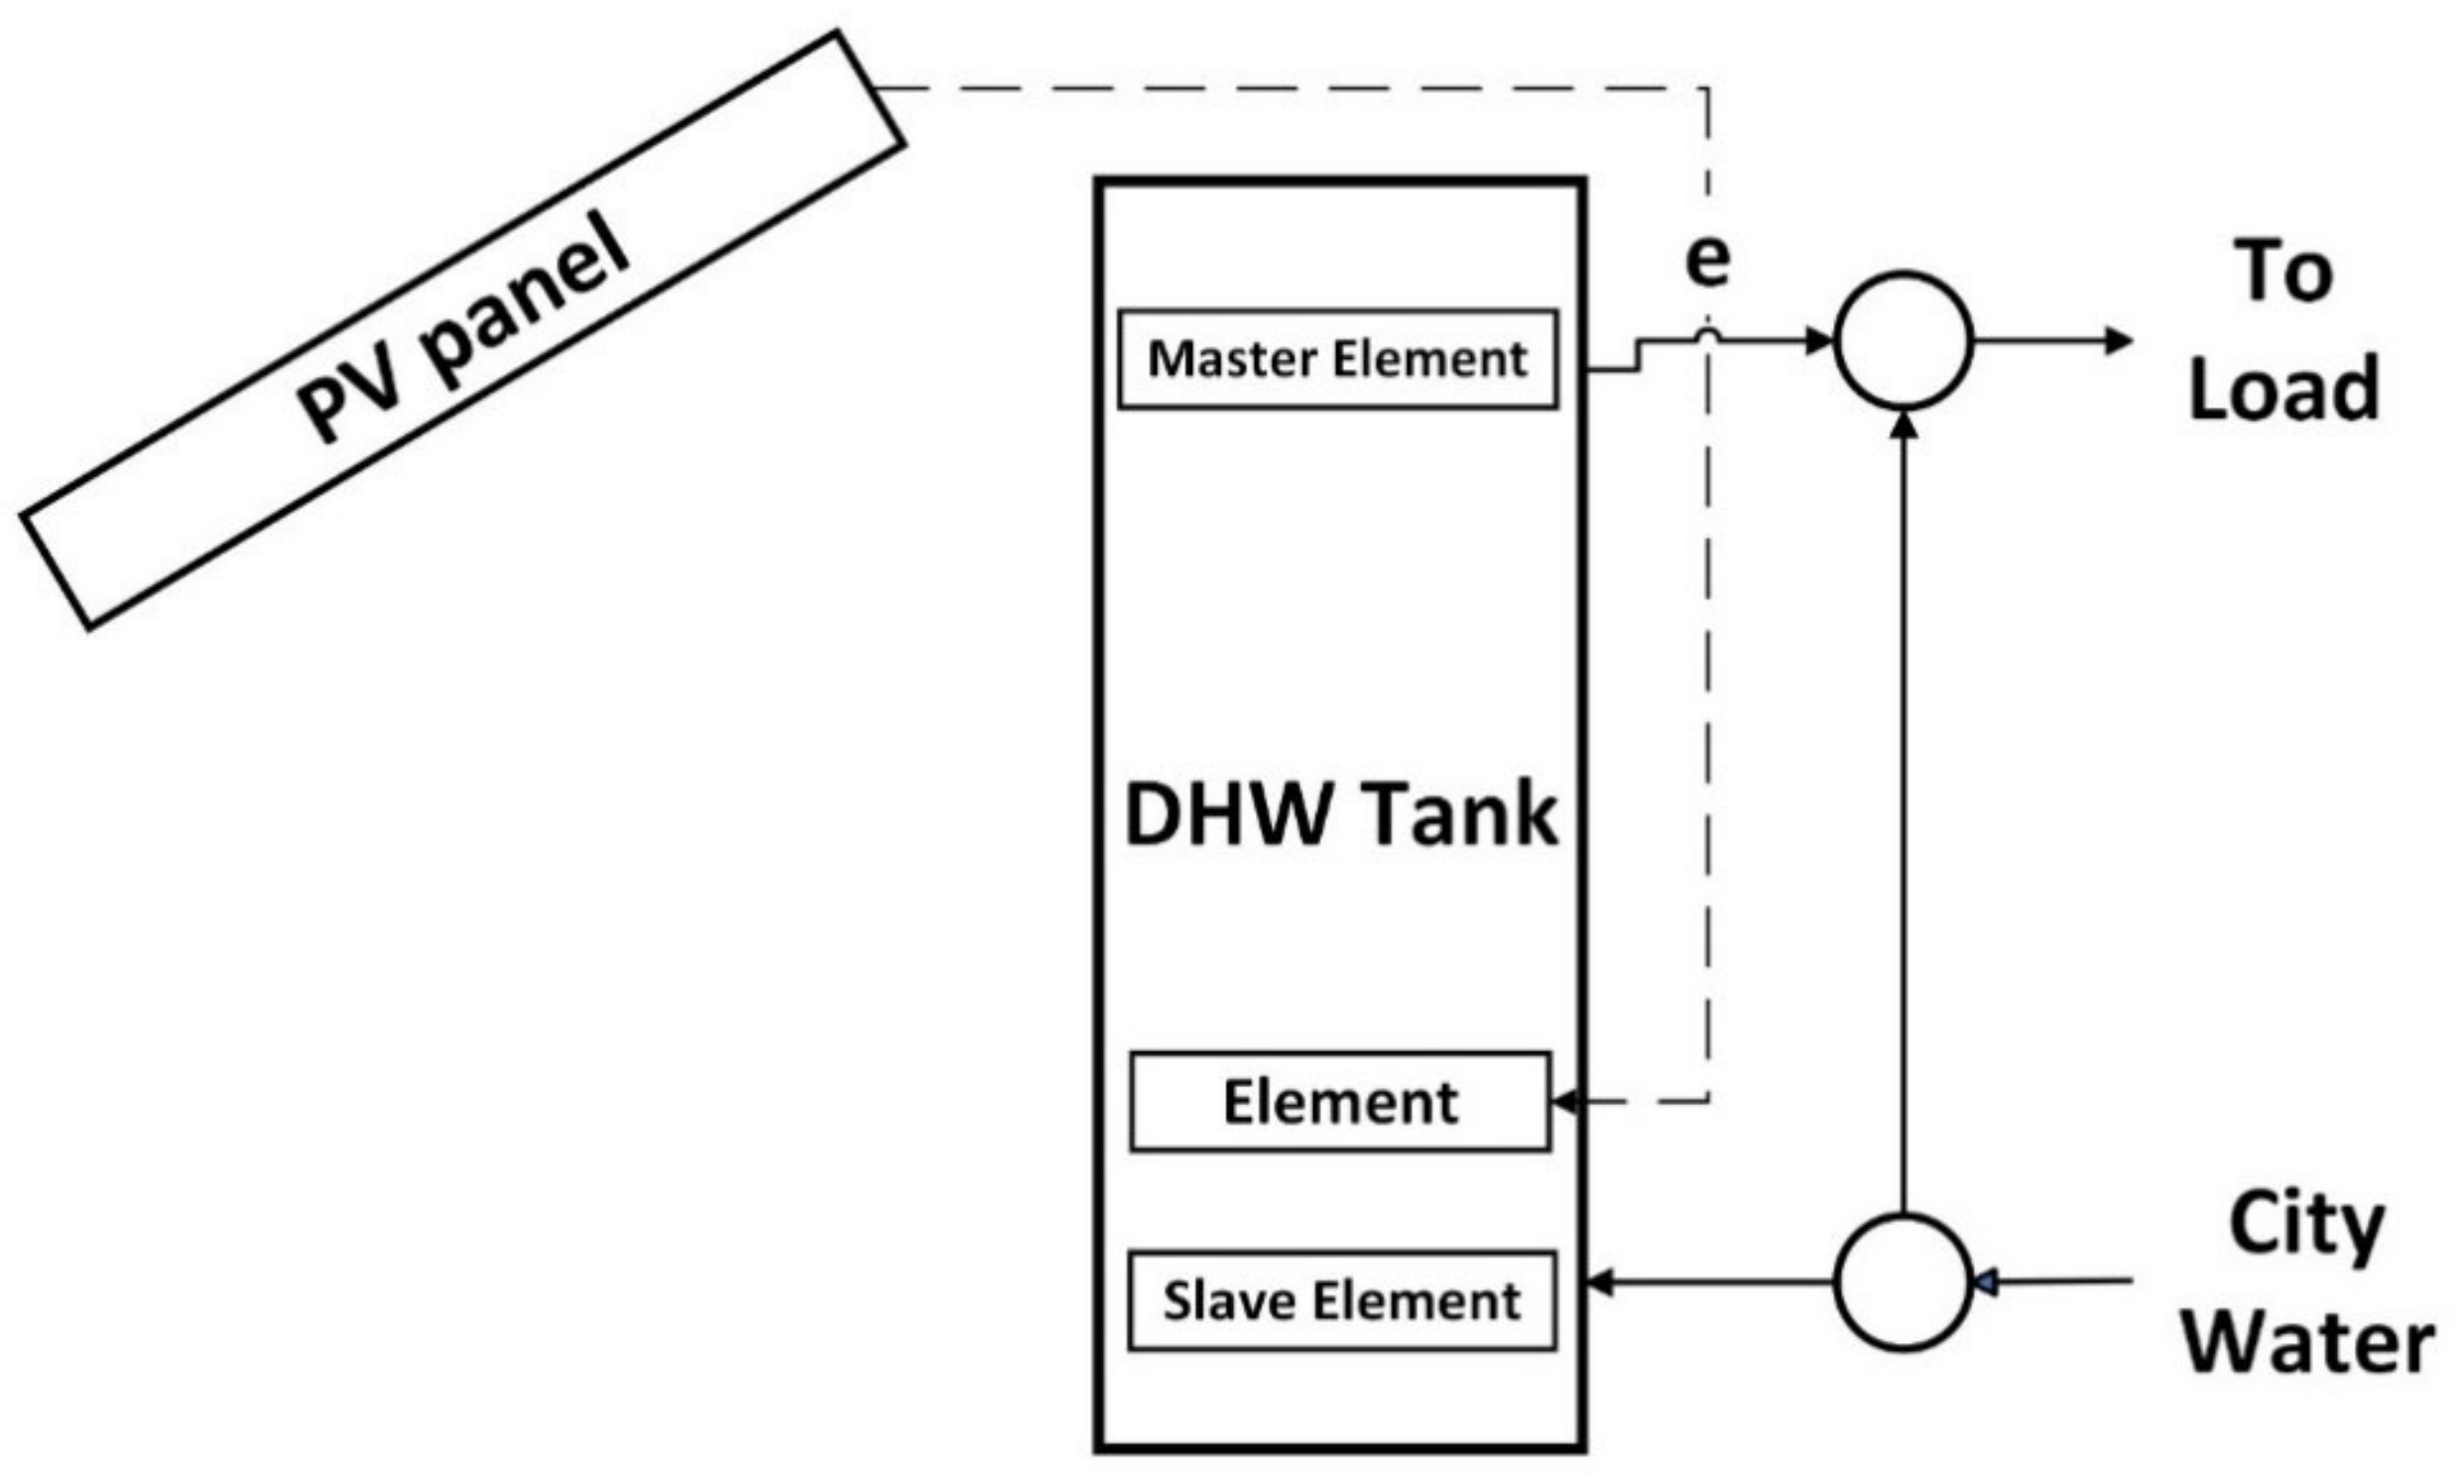
Two 335 W solar PV panels with a total collector area of 3.95 m2 are connected in series to generate electricity. The PV panel characteristics are shown in Table 8. Figure 6 presents the proposed PV-R system. The generated electricity is transmitted through a DC/AC inverter with a 95% conversion efficiency to a resistance heater located at node 10 of the DHW tank. The electricity inside the resistance heater is converted to useful thermal energy that can be calculated by using Equation (7):

Table 8.
PV panel characteristics [37].
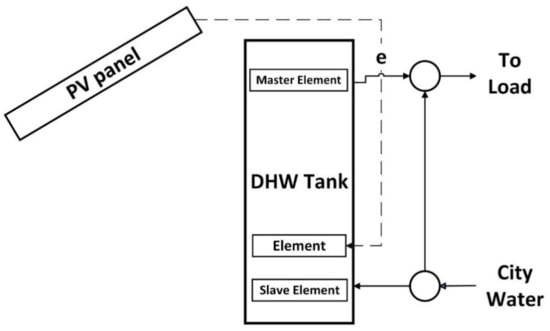
Figure 6.
Schematic of PV-R DHW system.
QFluid is the thermal energy delivered to the water tank, Qelec is the electrical energy delivered to the electrical resistance, and ηheat is the electricity-to-heat conversion efficiency, which was assumed to be unity. There is no battery to store the electricity, and all generated electricity is converted to thermal energy. To maintain DHW around 55 °C during low solar irradiance, a slave–master element is added to the tank with the same configuration as described in the previous systems.
3.5. Single-Tank Solar Thermal System (ST)
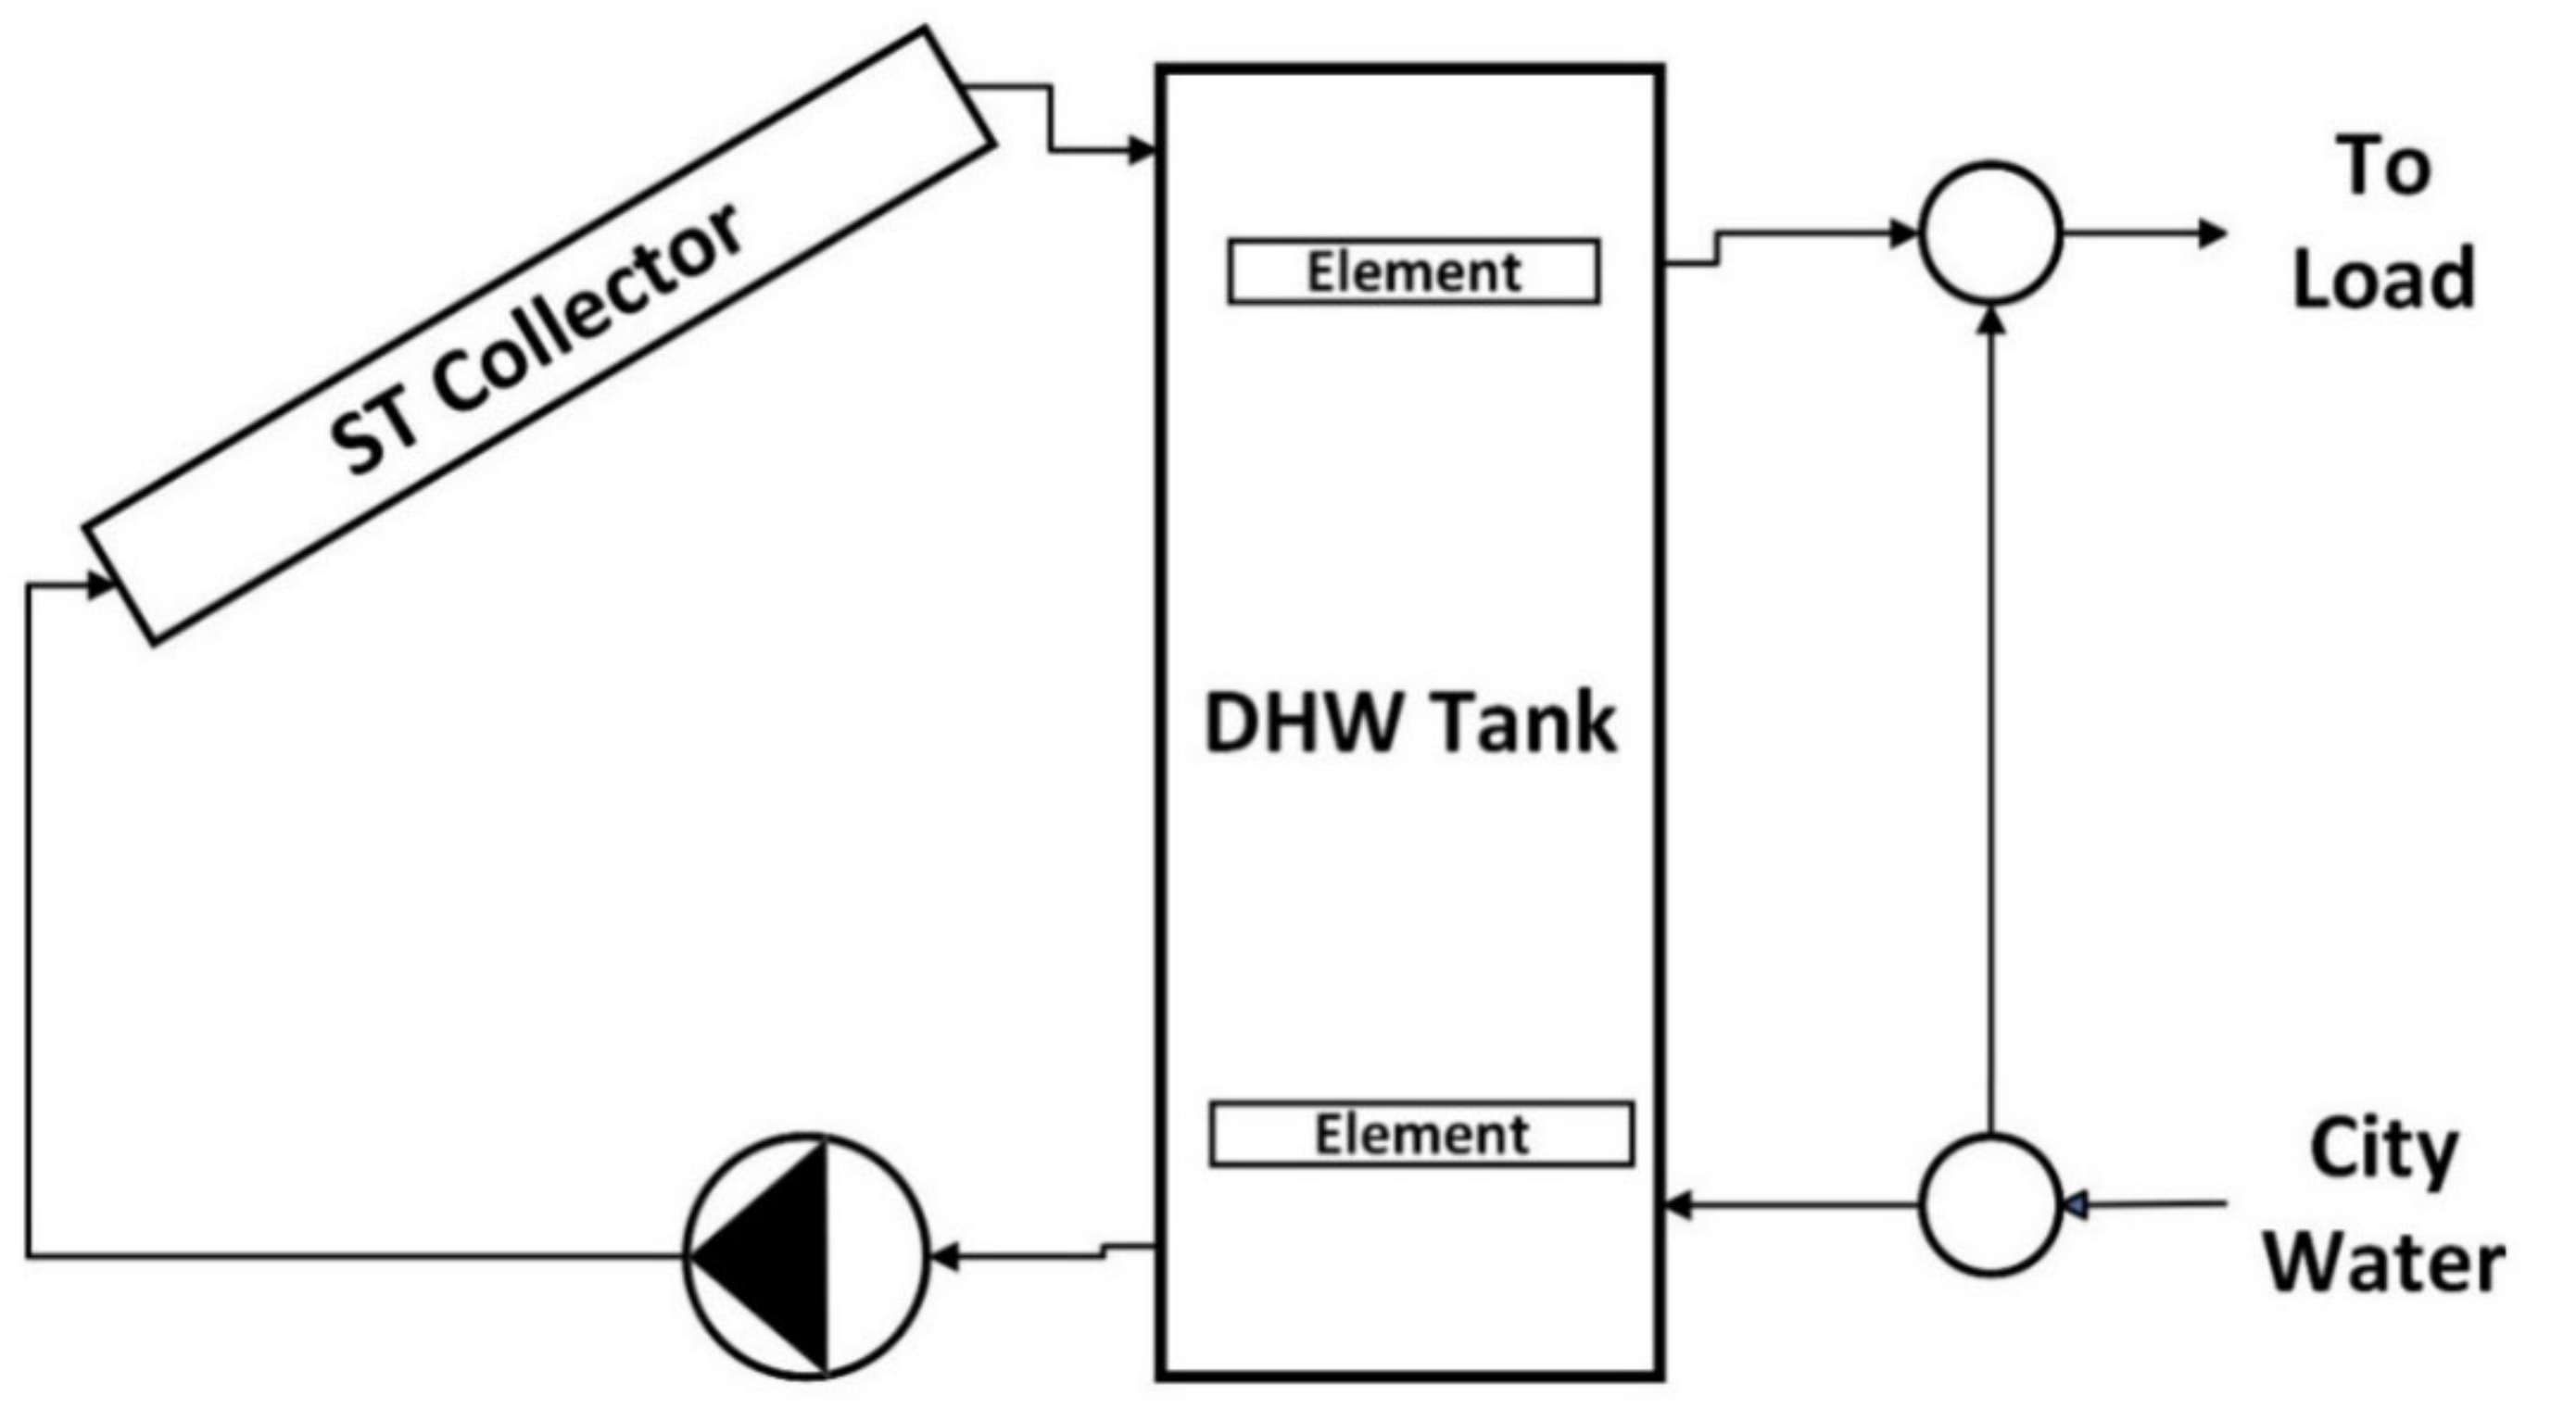
A conventional single-tank flat-plate solar-thermal-collector-based DHW system (Figure 7) is modeled to provide a meaningful point of comparison for MC systems. Kamyar, Fung, and Kumar [38] found that, for Canadian cities in the winter season, flat-plate solar thermal collectors could produce more thermal energy than evacuated tube collectors. One primary reason for the evacuated tubes’ lower overall efficiency was snow and ice cover in the winter months due to the evacuated tubes’ greater insulating properties. A flat-plate solar collector was chosen for the current study due to its higher efficiency in cold climates.
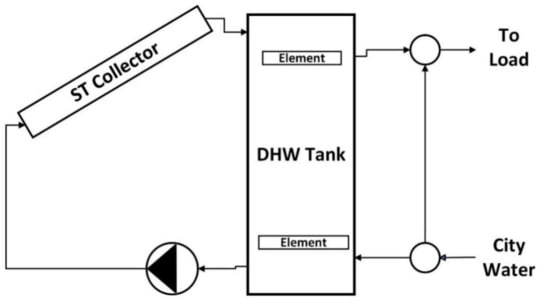
Figure 7.
Schematic of conventional single-tank ST DHW system.
4. Simulation Results
All systems were modeled and simulated by using TRNSYS for Toronto weather conditions. Table 9, Table 10, Table 11, Table 12 and Table 13 show the simulation results of each system (four solar-based DHW heaters) specifically. It is shown that, with the specific water-draw profile (200 L/day on average) in the cold climate of Toronto, approximately 3750 kWh/year energy is needed for DHW provision.

Table 9.
Conventional single-tank flat-plate ST-based system simulation results for Toronto with 45-degree tilt angle.

Table 10.
PV-R system simulation results for Toronto with 45-degree tilt angle.

Table 11.
MCST-HP system simulation results for Toronto with 45-degree tilt angle.

Table 12.
MCPVT-HP system simulation results for Toronto with 45-degree tilt angle.

Table 13.
Monthly solar fraction of four solar-based DHW systems for Toronto with 45-degree tilt angle.
Solar fraction number (SF) shows what percentage of the total required energy for DHW can be provided by solar energy. For instance, the SF number for the MCPVT-HP system can be calculated from Equation (3), where QHPEvap is thermal energy received by the evaporator of the HP, EPV is the electrical energy produced by the PV panel of the PVT collector, EHP is the HP compressor’s electrical energy consumption, and EER is the electrical energy consumption of the backup electric elements inside the DHW tank.
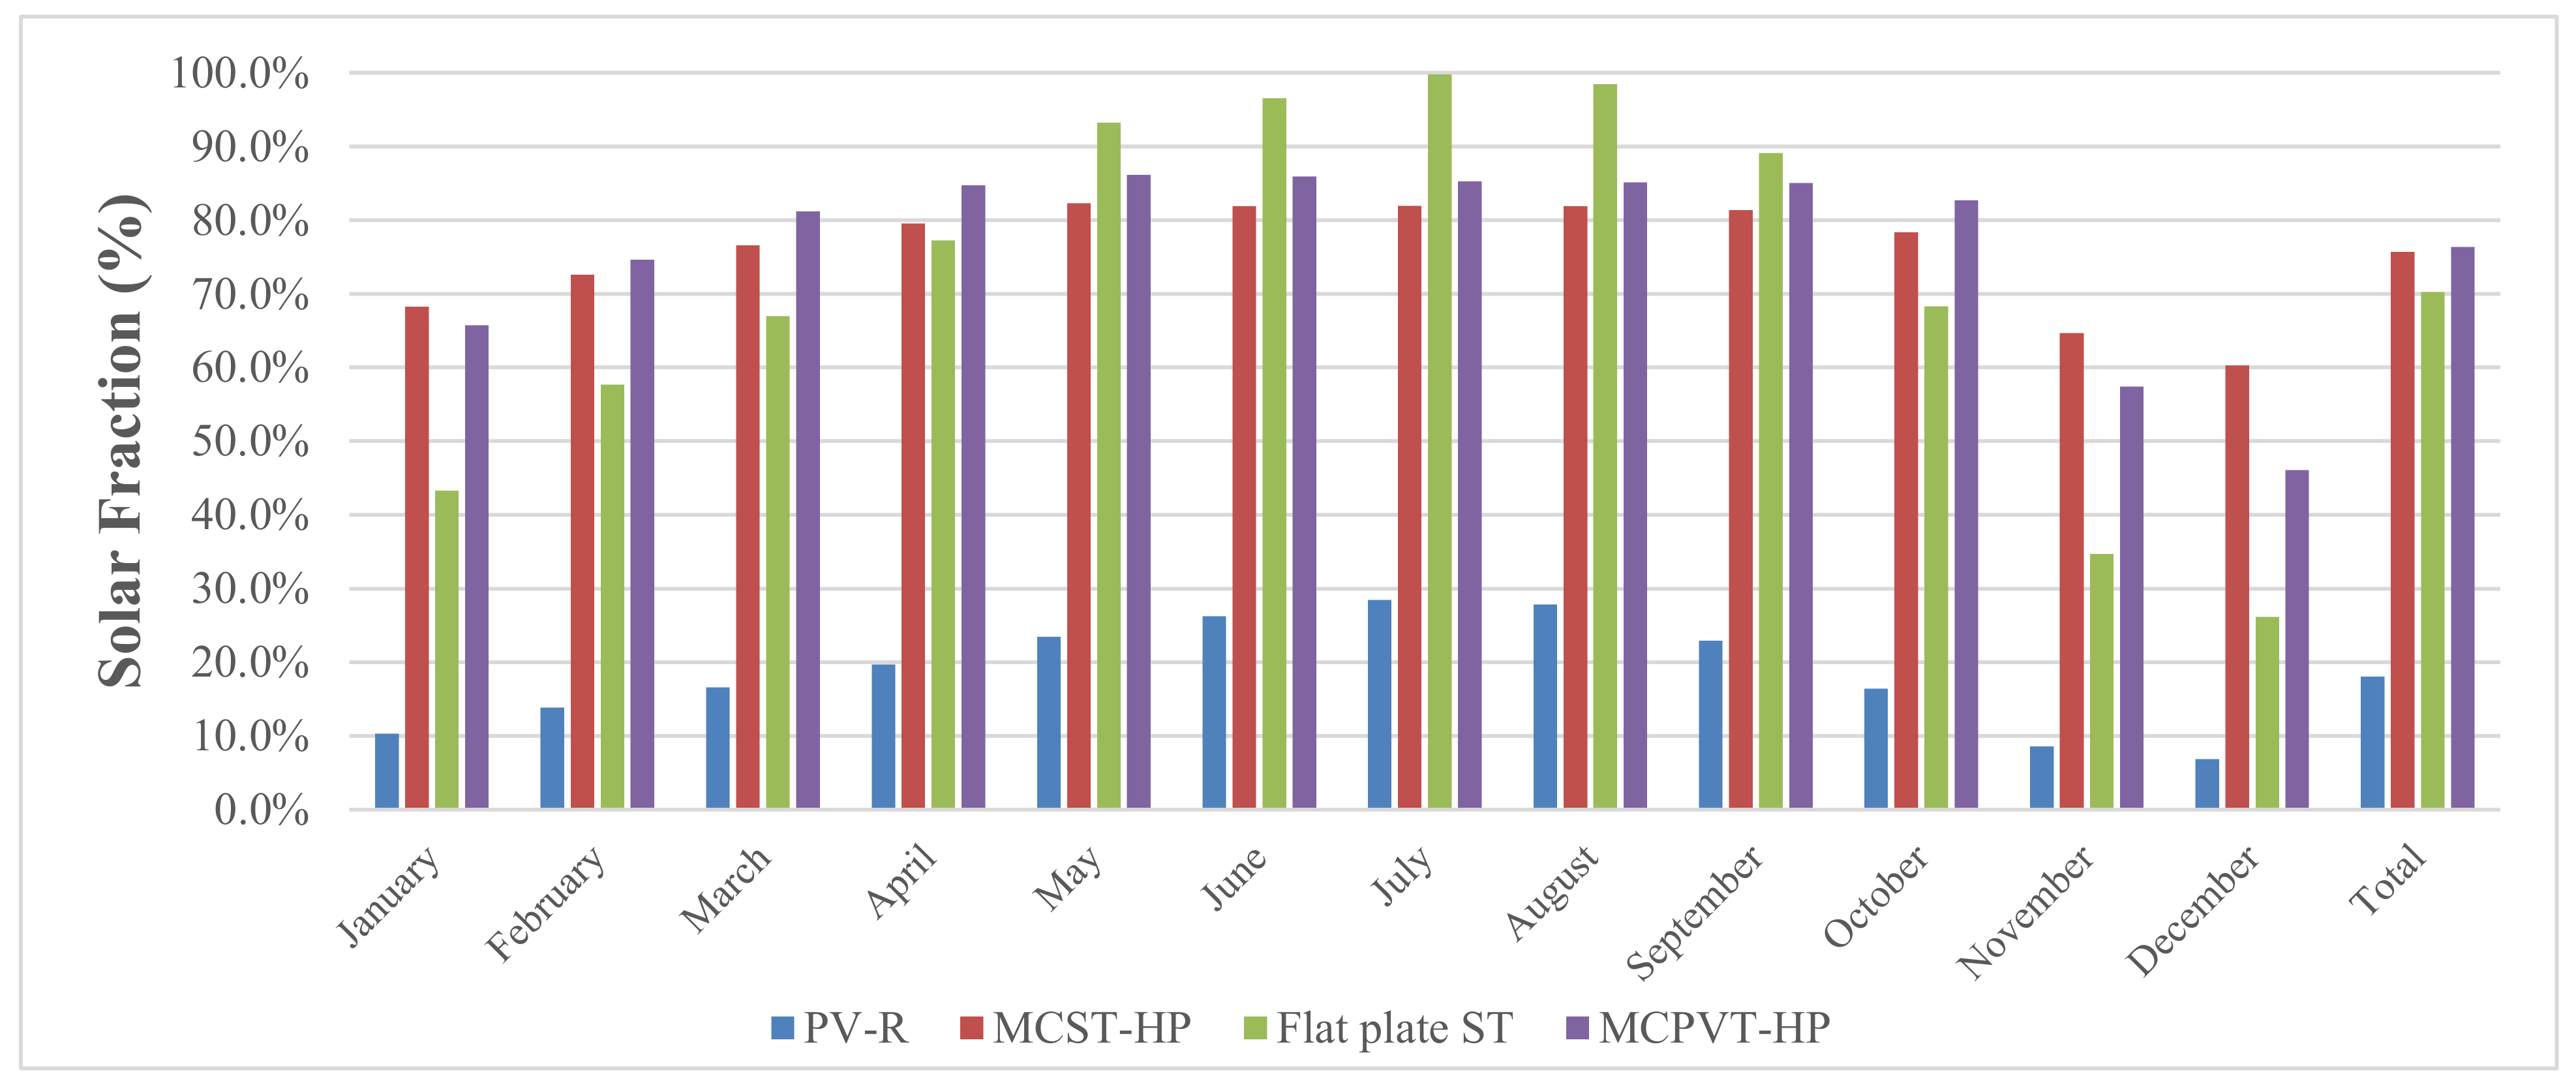
Figure 8 shows the solar fraction (SF) of each of the proposed systems. The MCPVT-HP system has the highest SF number, at 76.3%. This is 6.1% higher than a conventional flat-plate solar thermal collector and 58.3% higher than the PV-R system. The second highest SF is that of the MCST-HP system, which has 5.4% higher SF than a conventional flat-plate solar thermal collector. There is only a 1.5% difference between the MCPVT-HP and MCST-HP systems. One reason for this minor difference is that the fabricated PVT collector has a 90% fill factor, which reduces the collector’s thermal efficiency [14]. Lowering the fill factor can enhance the thermal efficiency. The other reason is a reduction in PV efficiency due to the high surface temperature. This is discussed in the following sections of the study.
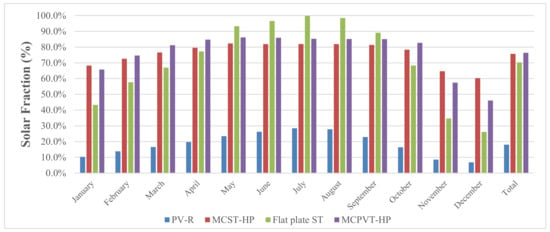
Figure 8.
Monthly solar fraction of different solar-based DHW heaters for Toronto with 45-degree tilt angle.
Table 13 shows the monthly solar fraction of each system. The PV-R system always has the lowest SF number among the systems. In the summertime, the MCPVT-HP and MCST-HP experience lower SF than a conventional solar thermal collector. This is mainly because the HP consumes energy in order to transfer energy from the preheat tank to the DHW tank, even though there is high solar availability in the summertime. This, of course, can be easily improved by designing a HP bypass to be used in the summertime. In the wintertime, the MCPVT-HP system works better than the other systems and has a 10–35% higher solar fraction than that of the flat-plate solar-thermal-collector-based system.
The preheat tank of the MCPVT-HP experiences an average 10–30 °C lower temperature than the conventional ST system with the flat-plate solar thermal collector. Circulating lower temperature fluid through the collector improves the efficiency of the collector and reduces the radiation and convection losses of the collector to the environment.
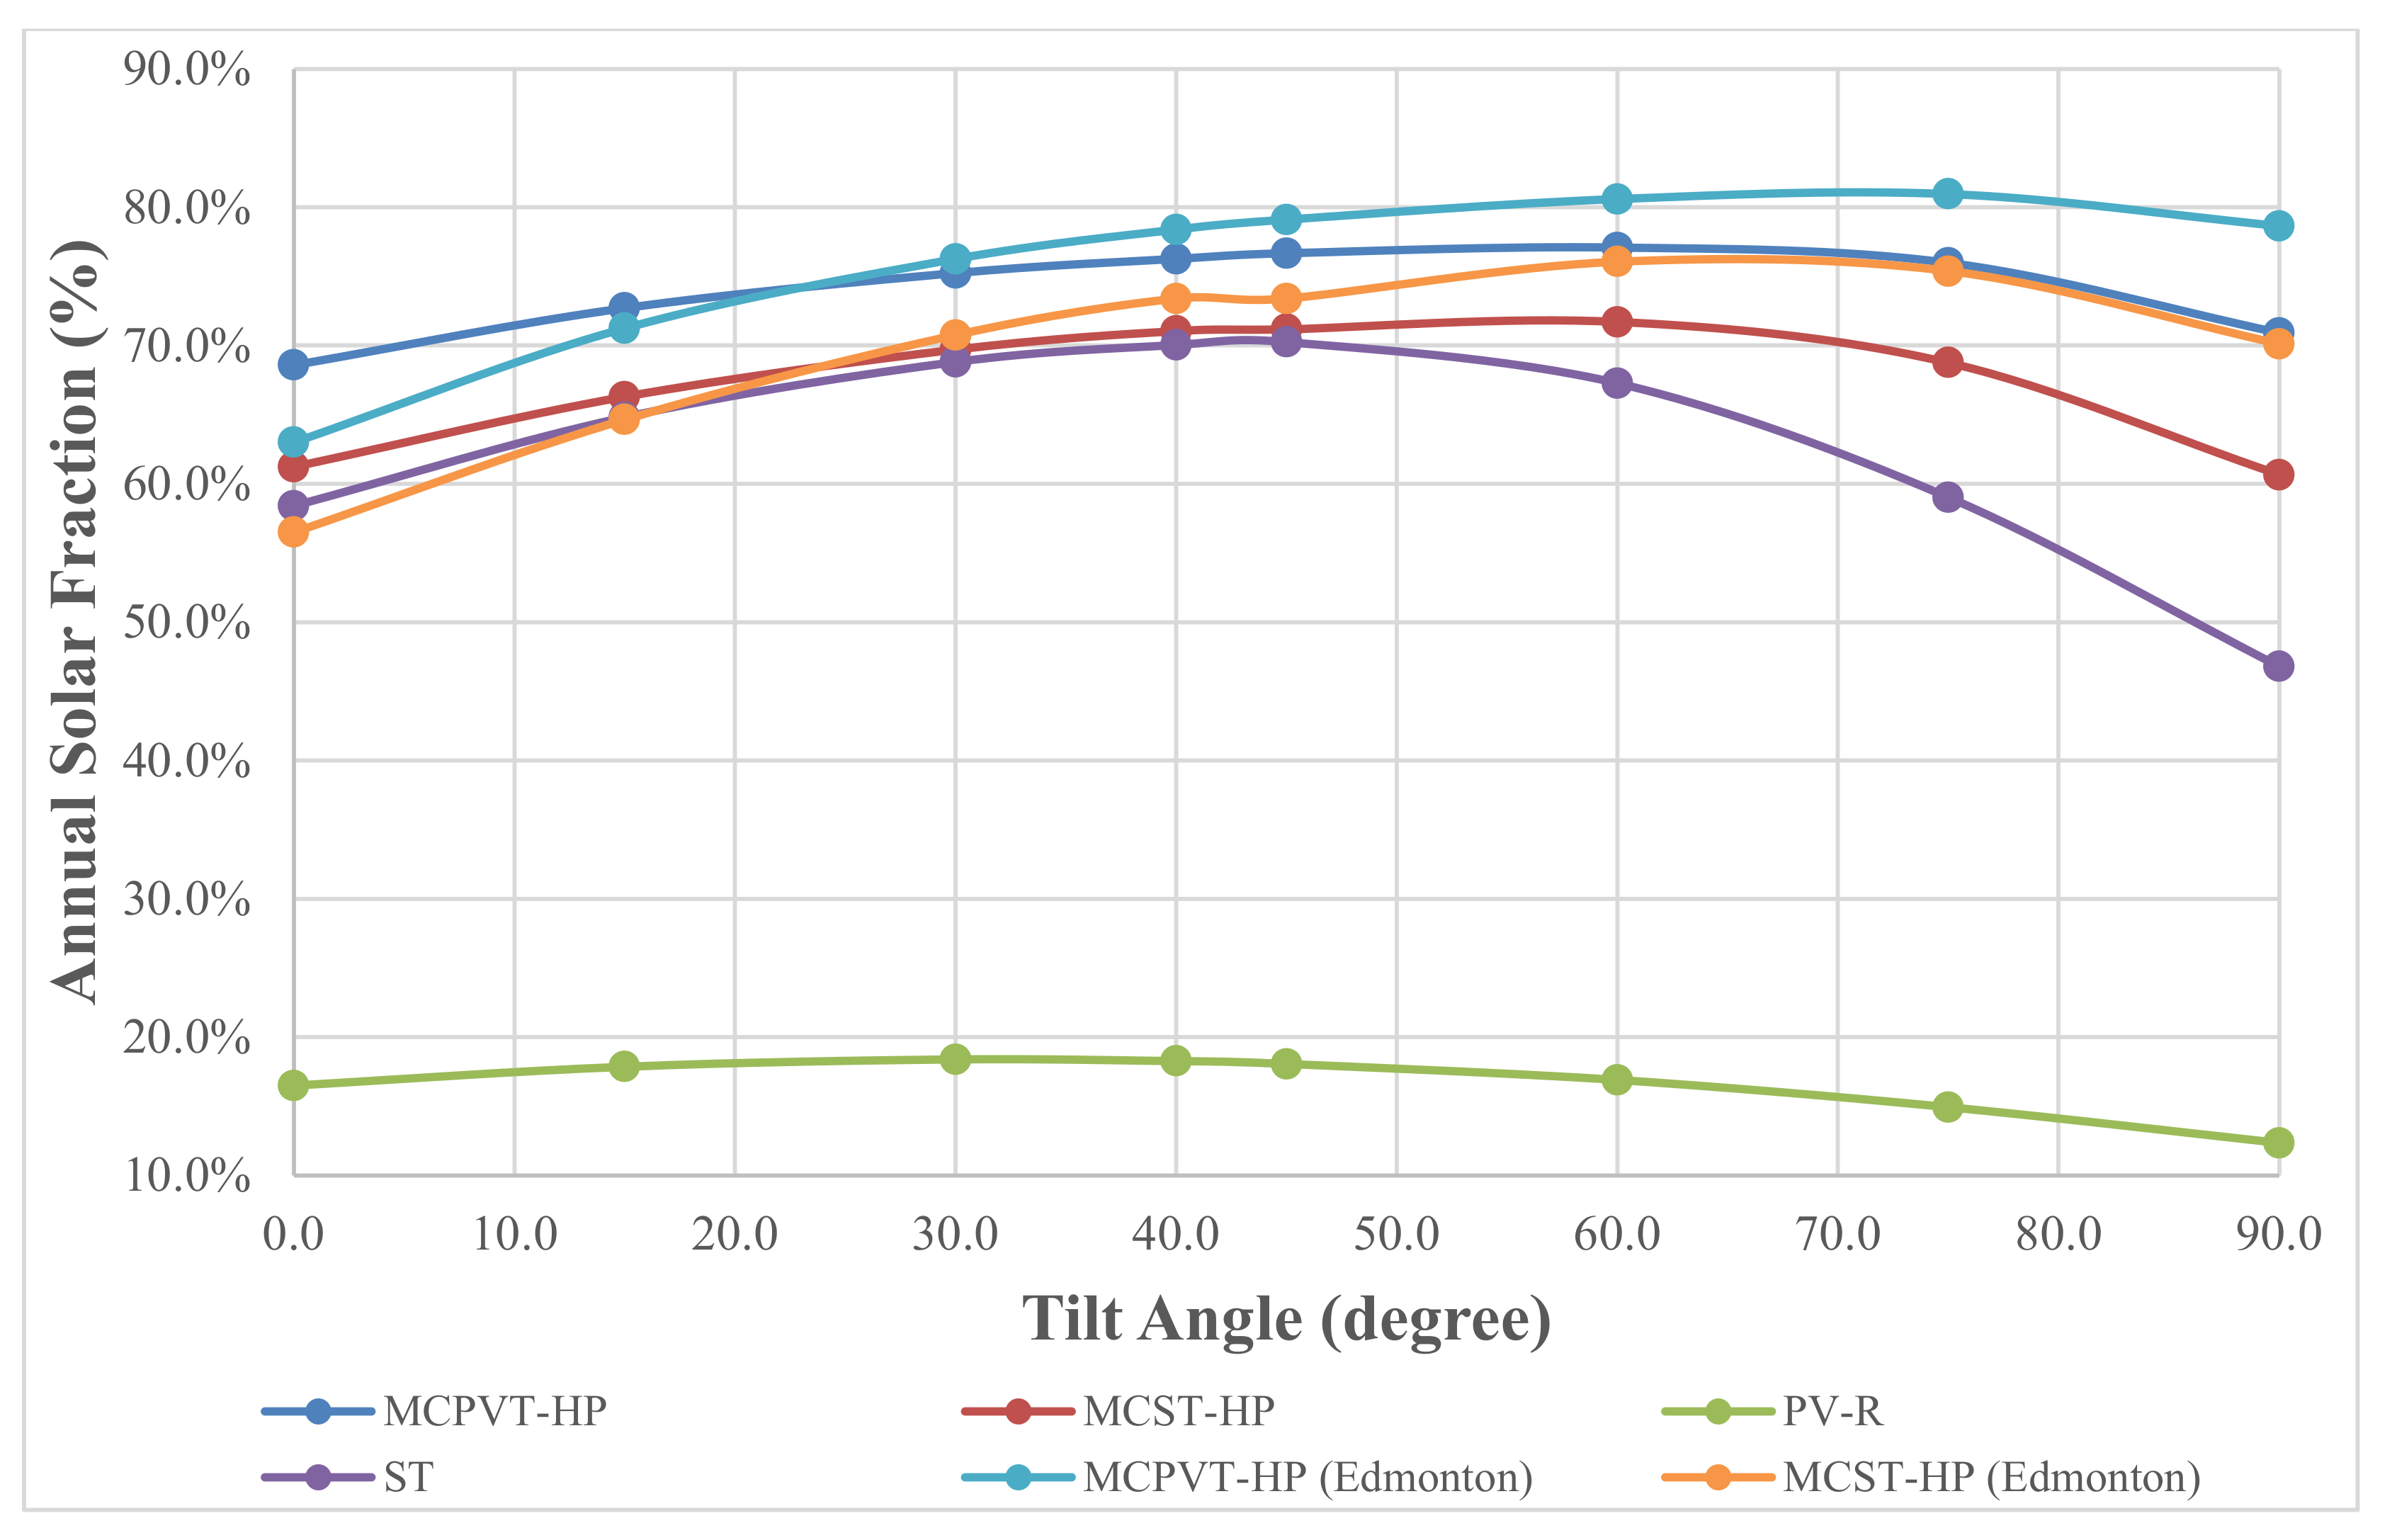
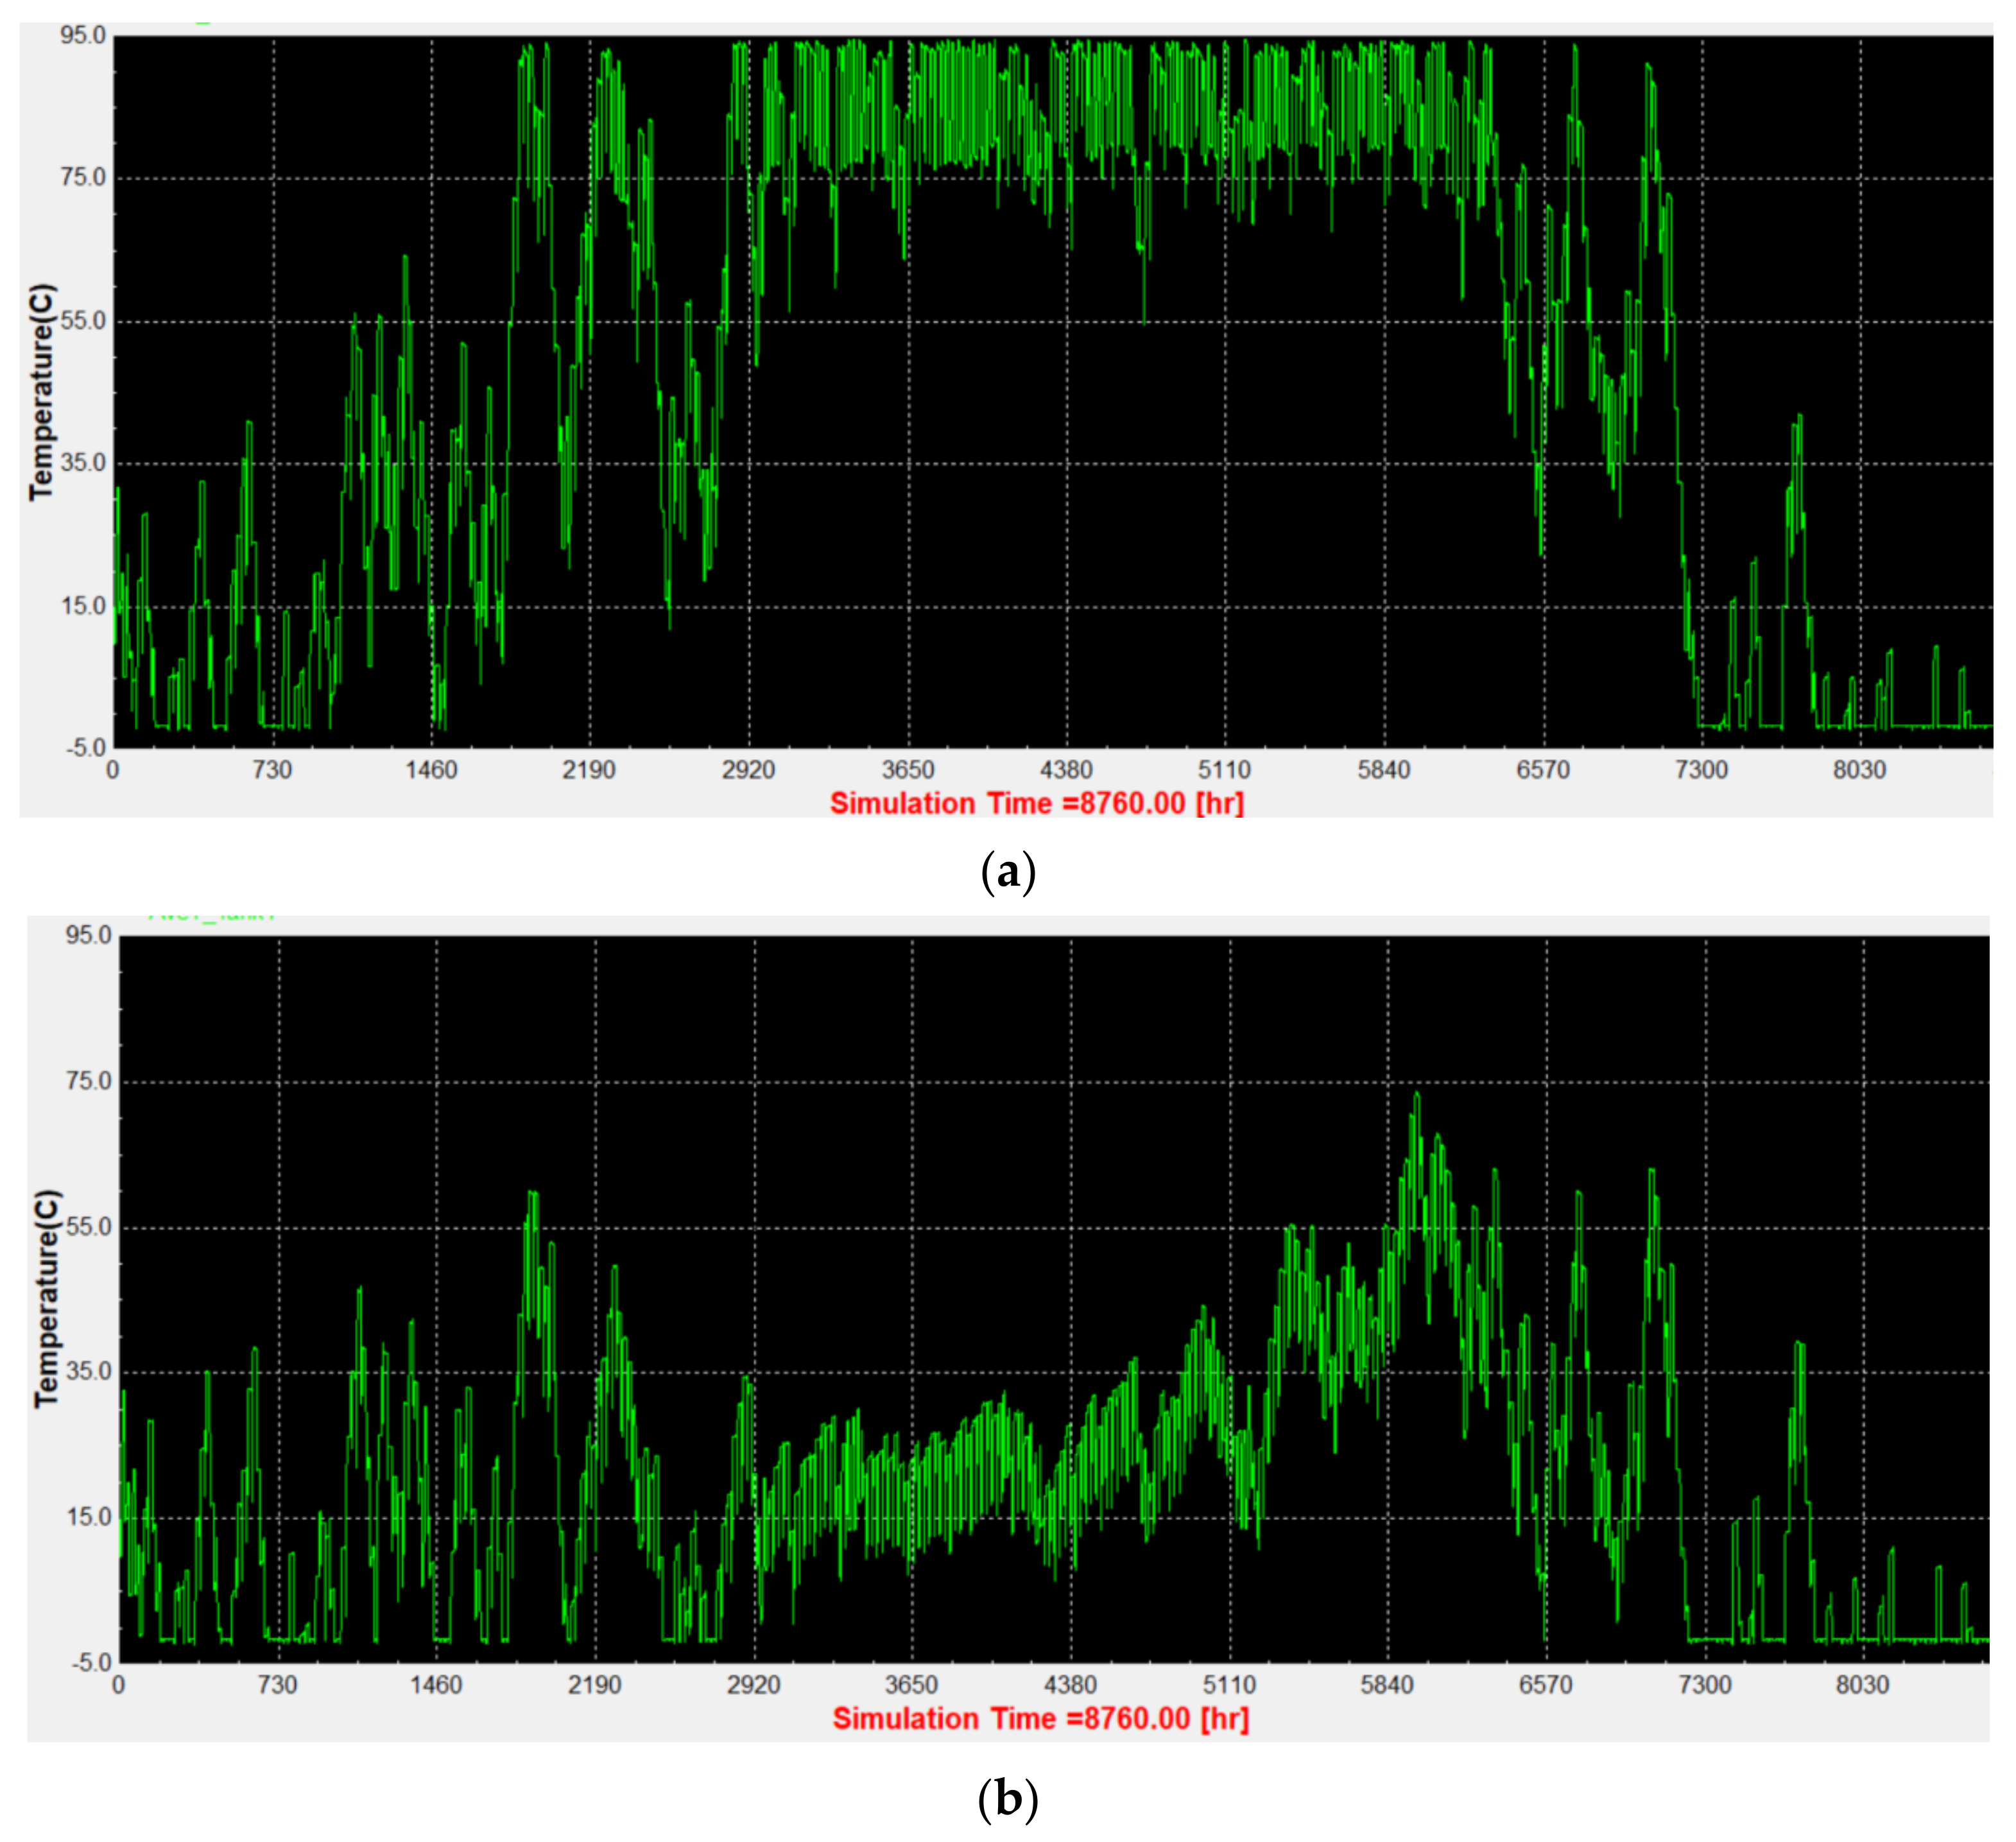
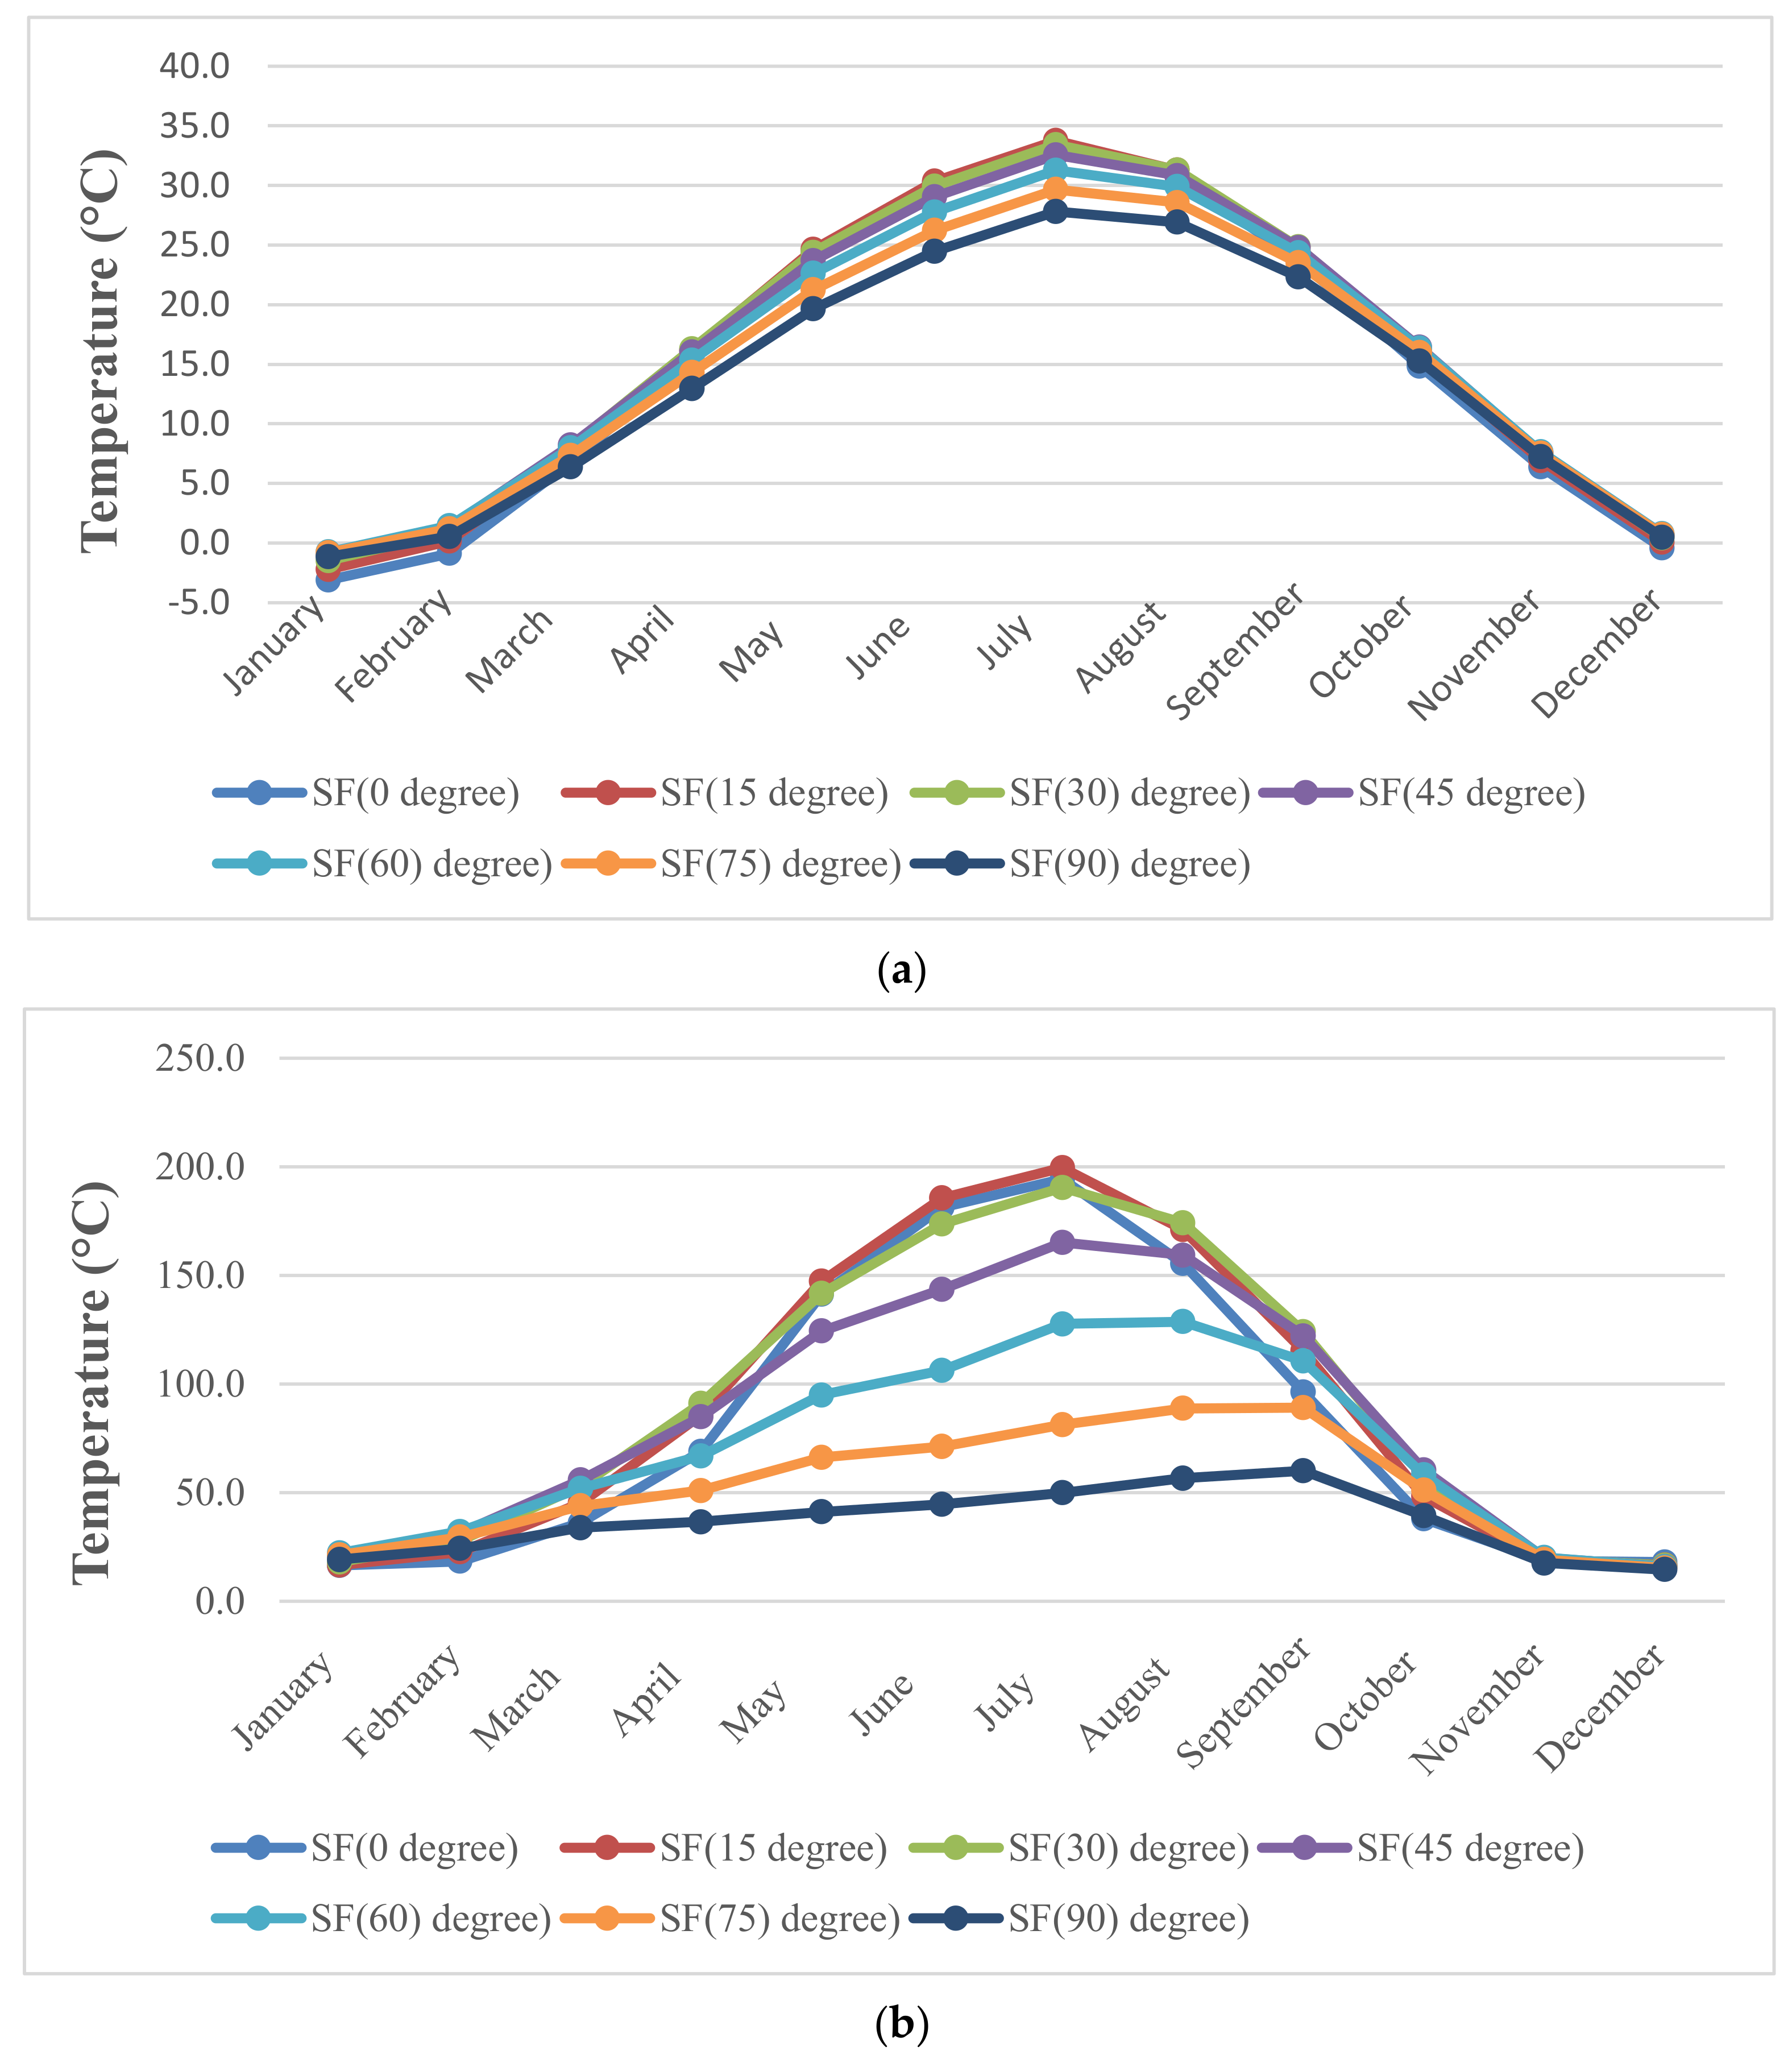
To study the potential effect of solar collector tilt angle on the overall system performance, a sensitivity analysis is performed. The effect of solar collector tilt angle on the overall system solar fraction is presented in Figure 9. The annual solar fraction is the fraction of the total annual DHW energy that comes from solar energy. It is interesting to note that the optimal tilt angle for the PV-R system is around 30° while the optimal tilt angle for the conventional ST system is around 45°. Figure 9 shows that, conversely, both heat pump-based systems exhibit a higher optimal tilt angle of around 60°. Furthermore, the performance of the MCPVT-HP and MCST-HP systems seem to be less sensitive compared to two conventional solar DHW systems, to the collector tilt angle for tilts up to 90°. Figure 9 shows that the MCPVT-HP system tilt angle sensitivity in a colder city than Toronto, such as Edmonton, has almost the same pattern. This is a very important finding because it demonstrates that, unlike other solar-based systems examined, the MCPVT-HP system can be applied to south-facing vertical facades of high-rise buildings without much performance degradation. Therefore, MCPVT-HP and MCST-HP will benefit from higher tilt angles. On the other hand, for the conventional ST DHW system, the highest SF can be obtained at around 45°, an angle which corresponds to the Toronto latitude. Due to the high amount of solar irradiance, the system may be overheated in the summertime, and a bypass loop is necessary to prevent overheating and system degradation. Using a vertical south-facing MCPVT-HP collector can reduce the overheating issue significantly during the summertime. In addition, the MCPVT-HP collector can still produce almost the same amount of energy as the lower tilt angle collector during winter. Figure 10a,b shows how 45° and 90° tilt angles affect the preheat tank. They show that, for a 45° tilt angle during the summertime, having a bypass loop is necessary to prevent overheating the system. However, for the 90° tilt angle, during the summertime, the preheat tank’s temperature on average varies between 15 to 55 °C, which is a suitable temperature range for the HP.
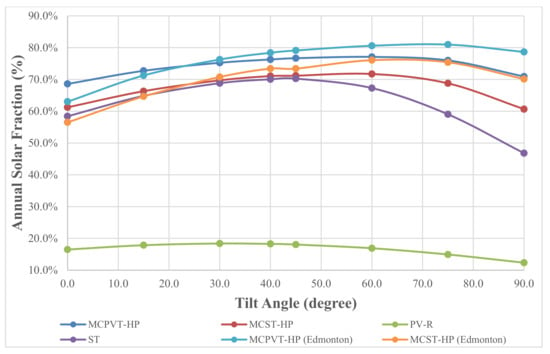
Figure 9.
Impact of collector tilt angle on the overall system solar fraction for Toronto and Edmonton.
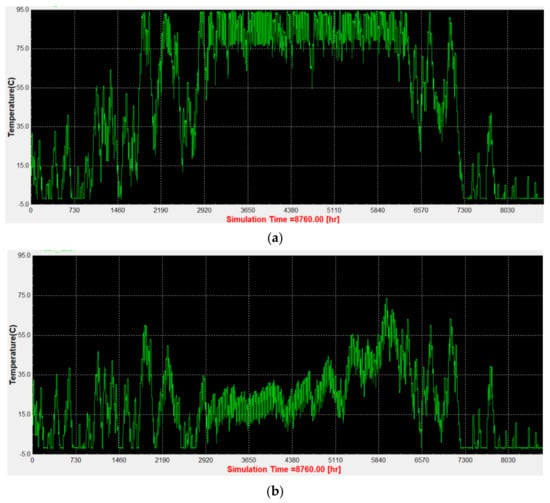
Figure 10.
(a) Average preheat tank temperature for 45° tilt angle for Toronto; (b) Average preheat tank temperature for 90° tilt angle for Toronto.
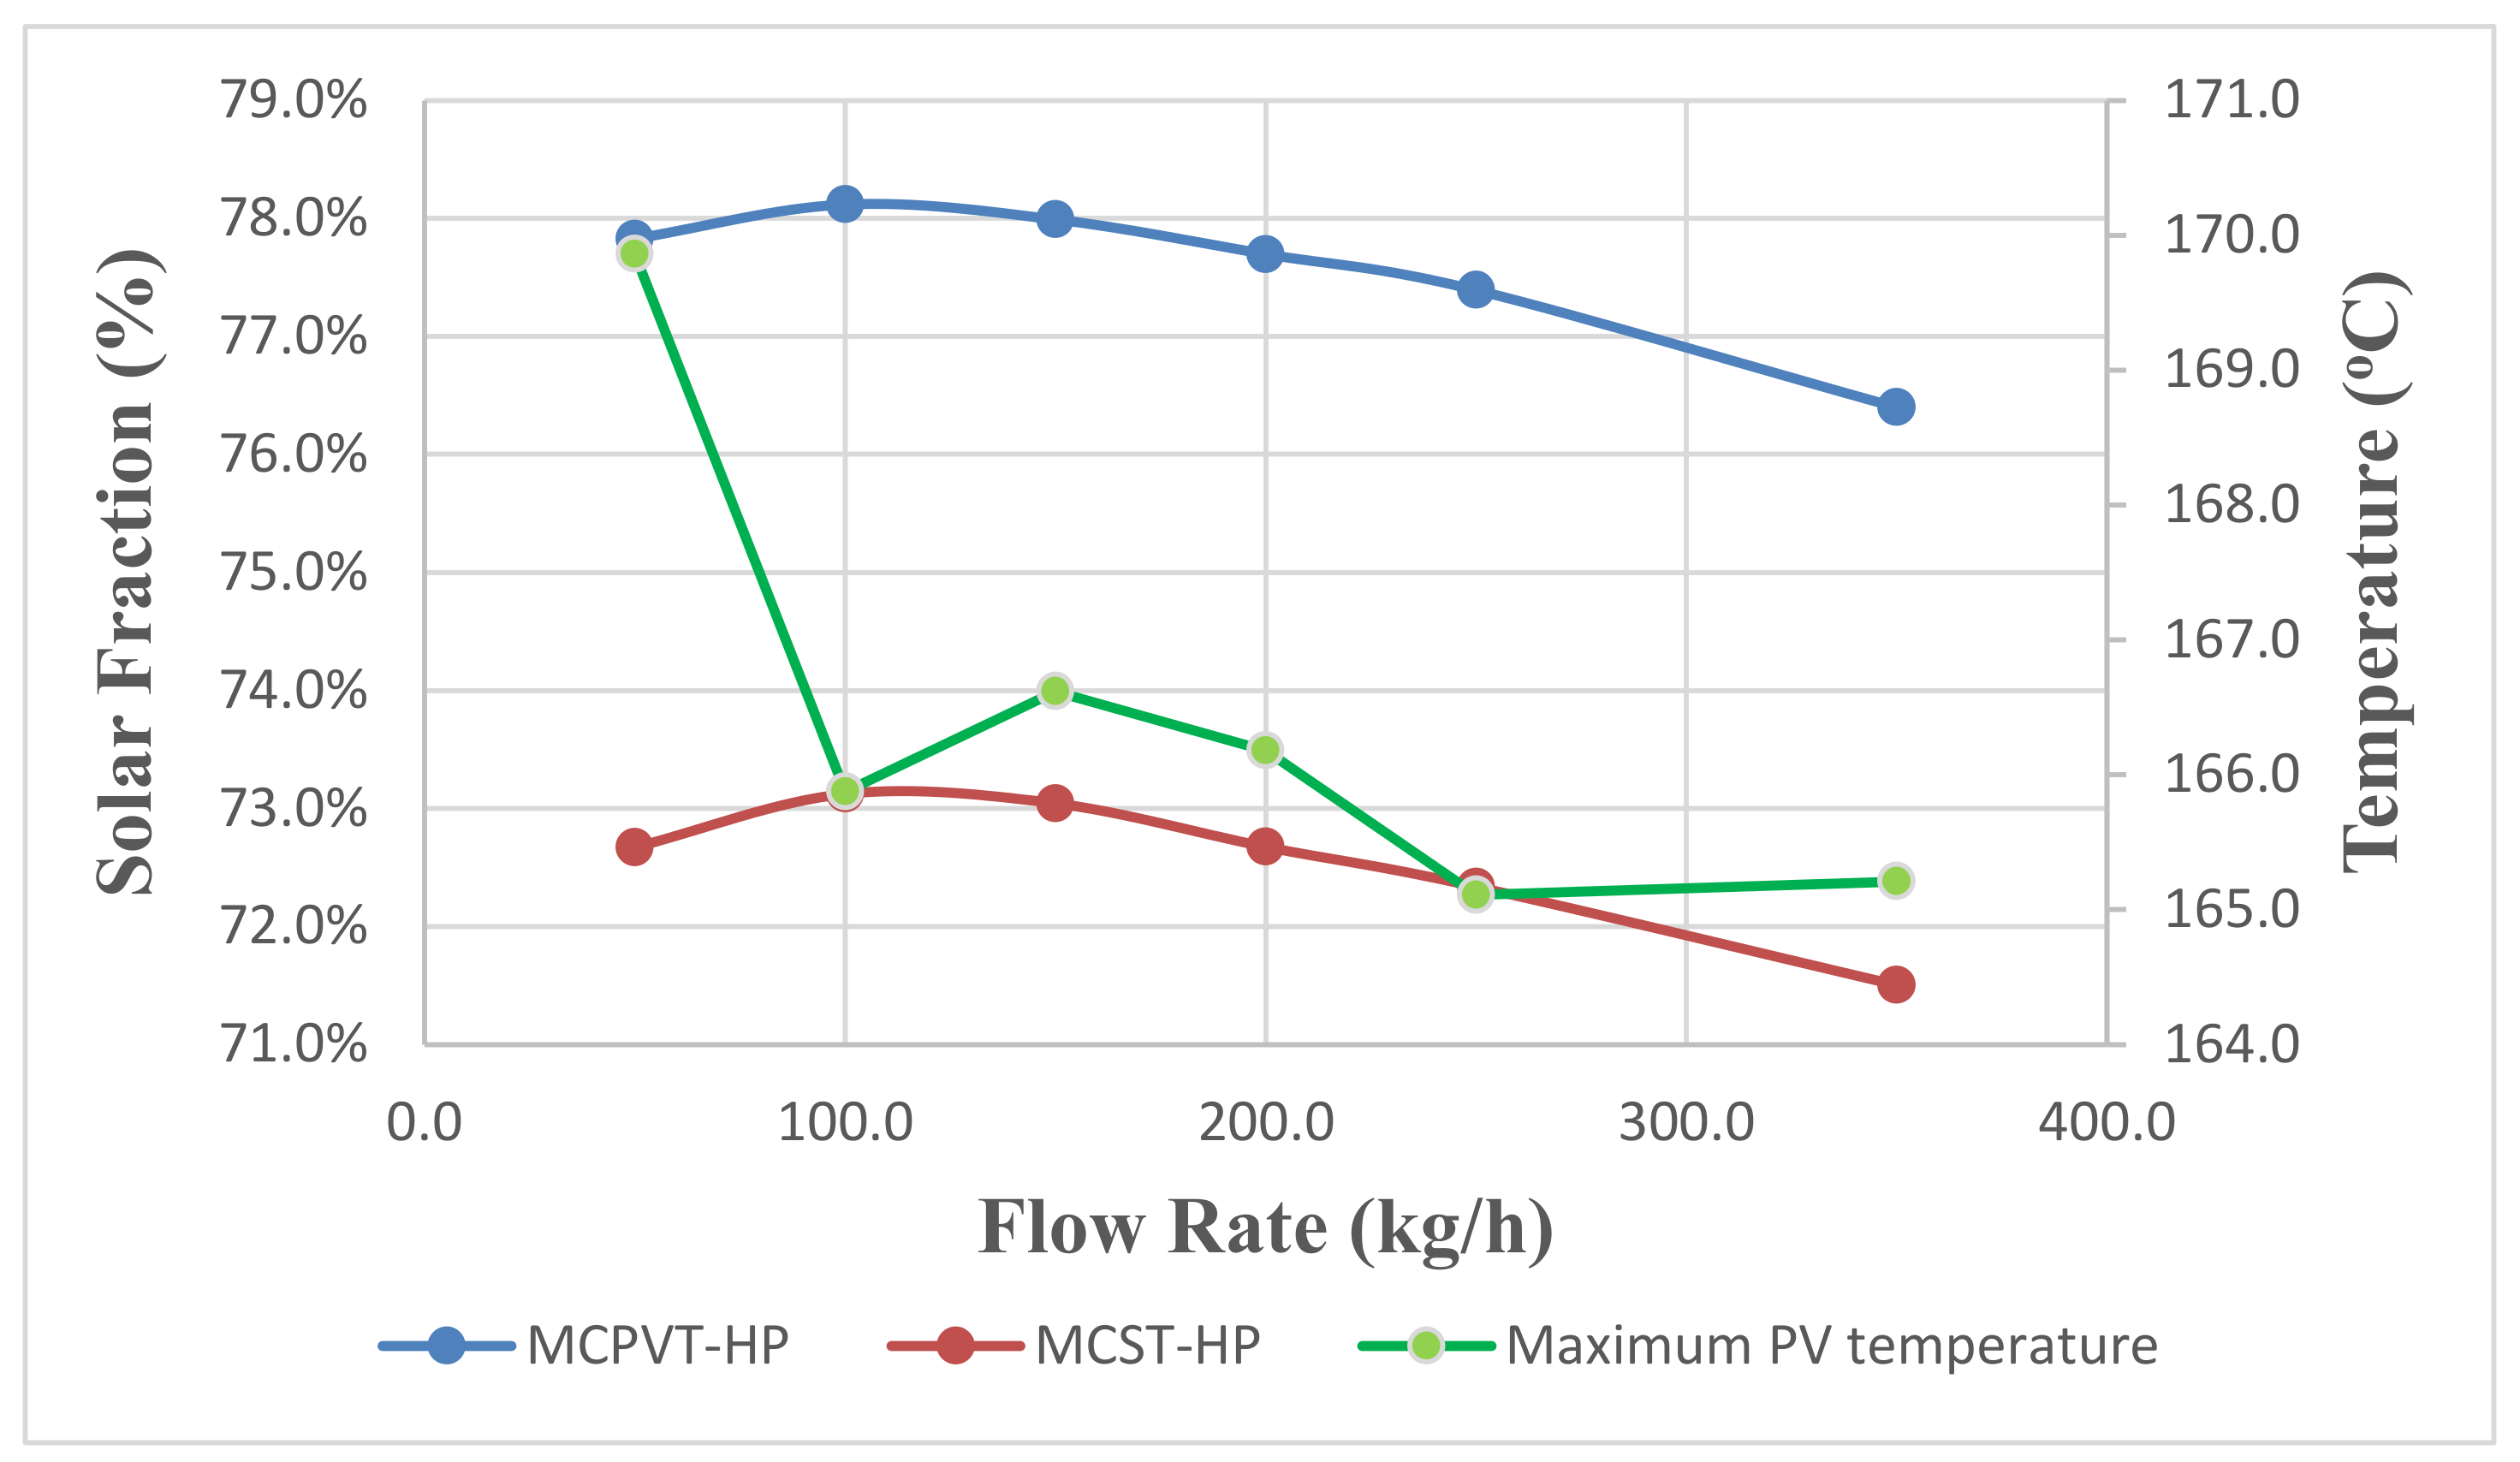
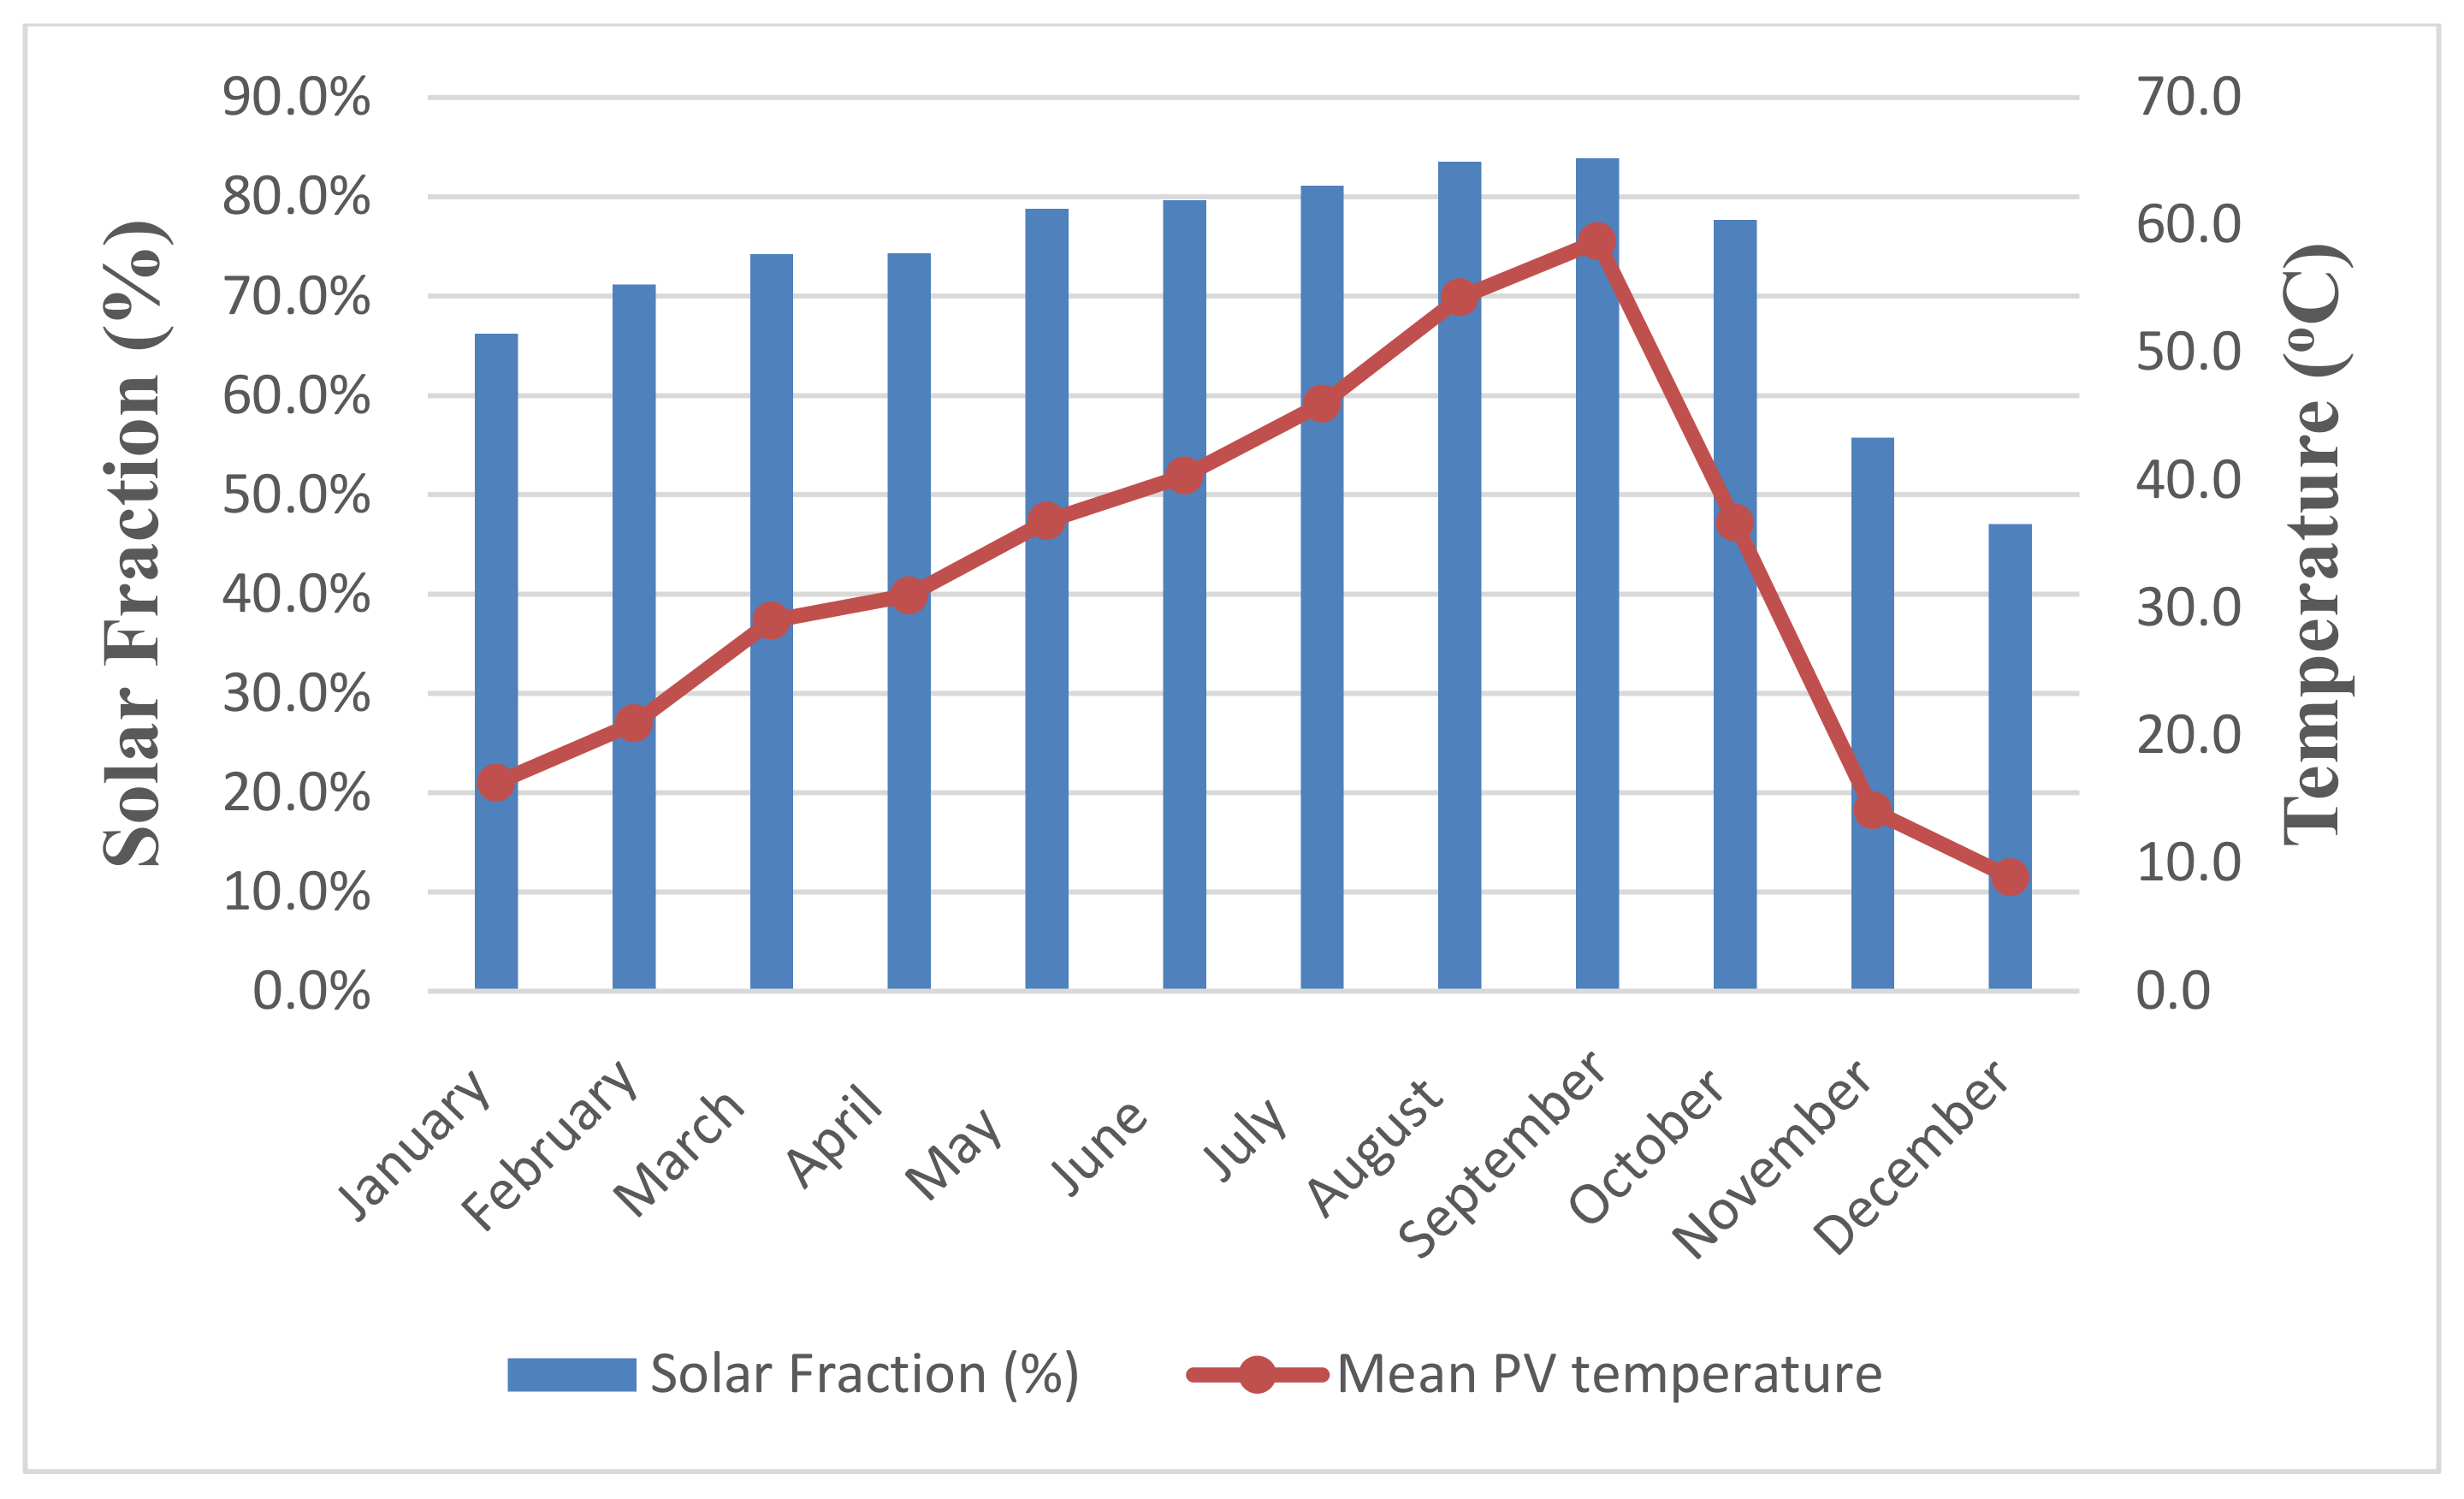
Different flow rates of water–glycol for the MCPVT and MCST collectors are also studied to determine their influence on the system’s SF. Figure 11 shows that, when the flow rate is increased from 150 to 350 kg/h, there is a 2.1% and 2.3% reduction in the annual SF number of the MCST-HP and MCPVT-HP, respectively. Thus, for the MCST-HP, it is better to keep the flow rate around 100 kg/h to have the maximum annual SF number. On the other hand, although the MCPVT-HP has the highest SF number for the 100 kg/h flow rate, one needs to consider that the PV panel surface temperature is dependent on the flow rate and solar irradiance. In the summertime, due to high solar radiation, the solar panels’ temperature rises significantly. The corresponding maximum temperature of the PV panel during summertime for each flow rate for the MCPVT-HP system is illustrated in Figure 11. It shows that, for all flow rates, the PV panels experience very high temperatures during the summertime. To overcome this problem, it is recommended that a higher flow rate of around 250 kg/h be implemented, and PVT collector tilt angle be increased. These two modifications let the PV panels operate in the acceptable temperature range even during the summertime and prevent PV degradation due to high surface temperatures. Figure 12 shows that, by increasing the tilt angle of the PVT collector, the highest PV surface temperature during the day in the summertime (September) drops from 170 to 60 °C. This temperature drop improves the PV panel efficiency and extends its lifetime. In other months, the PV panel operates within an acceptable temperature range.
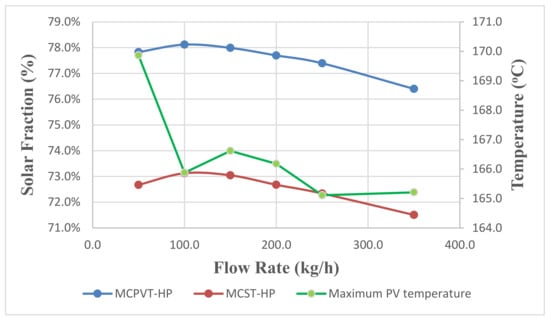
Figure 11.
MCPVT-HP and MCST-HP solar collector flow-rate sensitivity analysis.
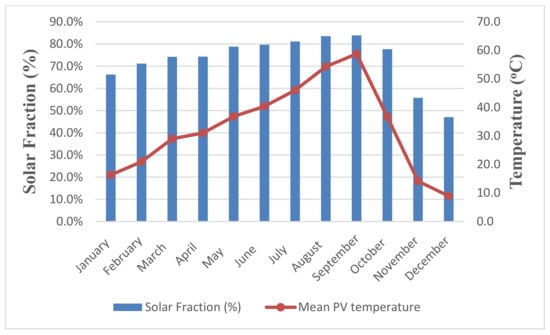
Figure 12.
Maximum PV panel surface temperature of the MCPVT-HP system with 90° tilt angle and 250 kg/h flow rate vs the solar fraction.
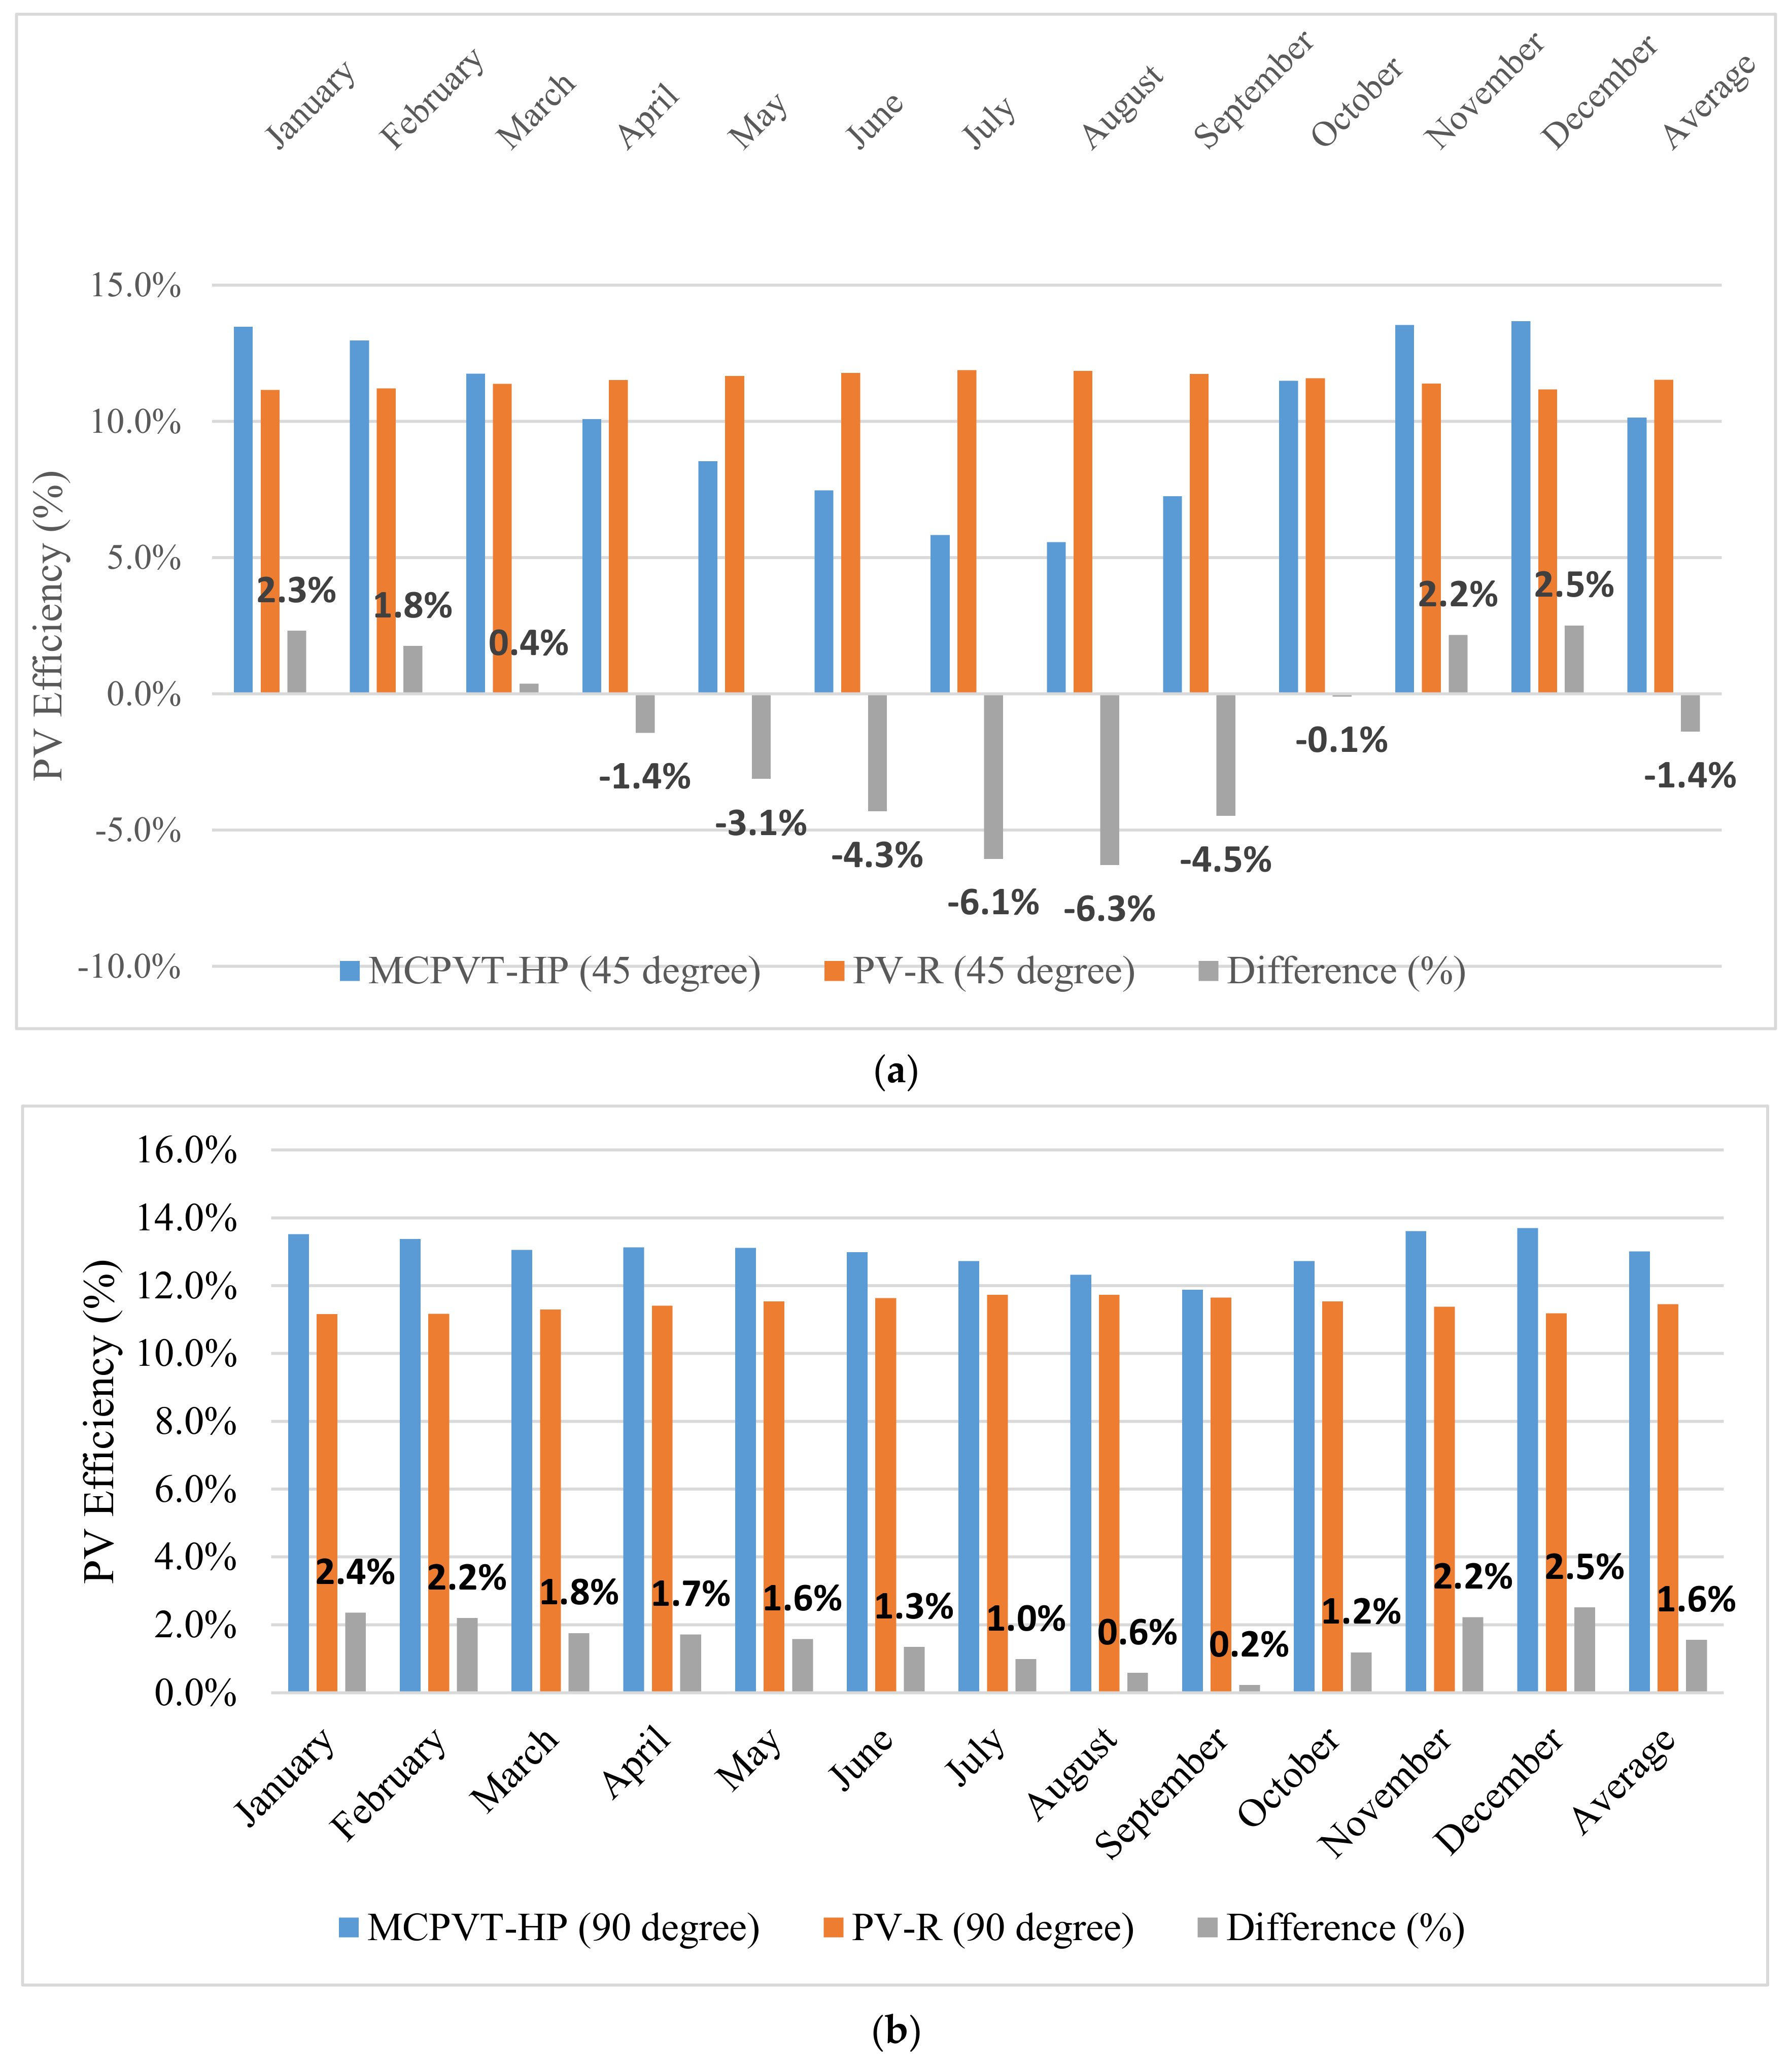
PV panel efficiency presented in Figure 13a shows an overall 1.5% average efficiency reduction for the MCPVT-HP system compared with an individual PV panel. In the summertime, the difference is 5.5%, and the PV efficiency of the PVT collector drops to 6%. Due to the nature of the PVT collector, the PV panel’s surface temperature is higher than an individual PV panel. This is a major reason for PV efficiency reduction in PVT collectors. Increasing the PVT flow rate is one potential way to increase the PV efficiency. It should be considered that reducing the flow rate increases the PV panel surface temperature. Therefore, the panel should be kept in its operating temperature range to avoid PV cell/panel degradation. A trade-off between flow rate and PV temperature should be considered. The other way to reduce the PV surface temperature is by increasing the PV tilt angle, a strategy which is discussed in further detail below. By increasing the tilt angle to 90°, the PV efficiency of the MCPVT-HP system can be enhanced. In particular, during the summertime there was a 6% PV efficiency enhancement. Figure 13b shows that the MCPVT-HP system has better PV efficiency for higher tilt angles.
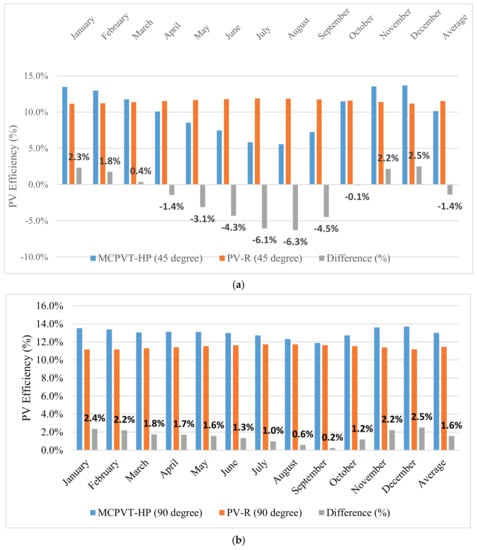
Figure 13.
(a) PV efficiency comparison between MCPVT and PV-R system with a 45° tilt angle; (b) PV efficiency comparison between MCPVT and PV-R system with a 90° tilt angle.
Figure 14a shows the monthly average of daily average temperature of the PV panel of the PV-R system during the 6:00 a.m. to 6:00 p.m. window with different tilt angles. It can be seen that, during the wintertime, PV-surface temperature is not very sensitive to the tilt angle. During the summertime, PV-temperature dependency on the tilt angle is not significant. Figure 14b shows that, for the MCPVT-HP, there is a significant PV-surface temperature drop when tilt angle is increased to 90°. It is important to consider that a higher tilt angle decreases the PV-panel temperature in the MCPVT-HP system and improves the overall efficiency of the PV panel. However, for the conventional PV-R system, tilt angle has a minimal impact on PV-surface temprature.
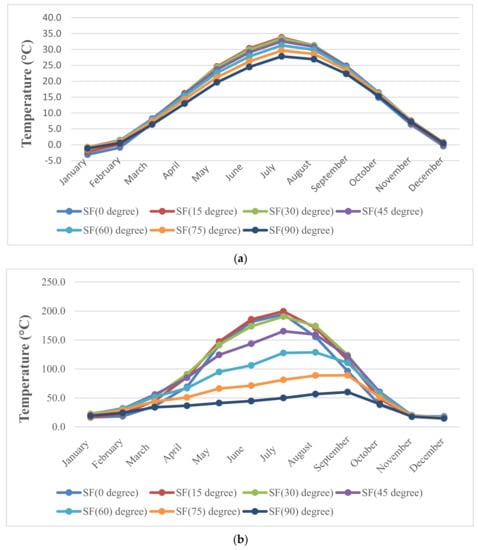
Figure 14.
(a) Monthly average for daily average temperature of the PV panel surface temperature as a function of tilt angle for PV-R system for the 6:00 a.m. to 6:00 p.m. window; (b) Monthly average for daily average temperature of the PV panel surface temperature as a function of tilt angle for MCPVT-HP system for the 6:00 a.m. to 6:00 p.m. window.
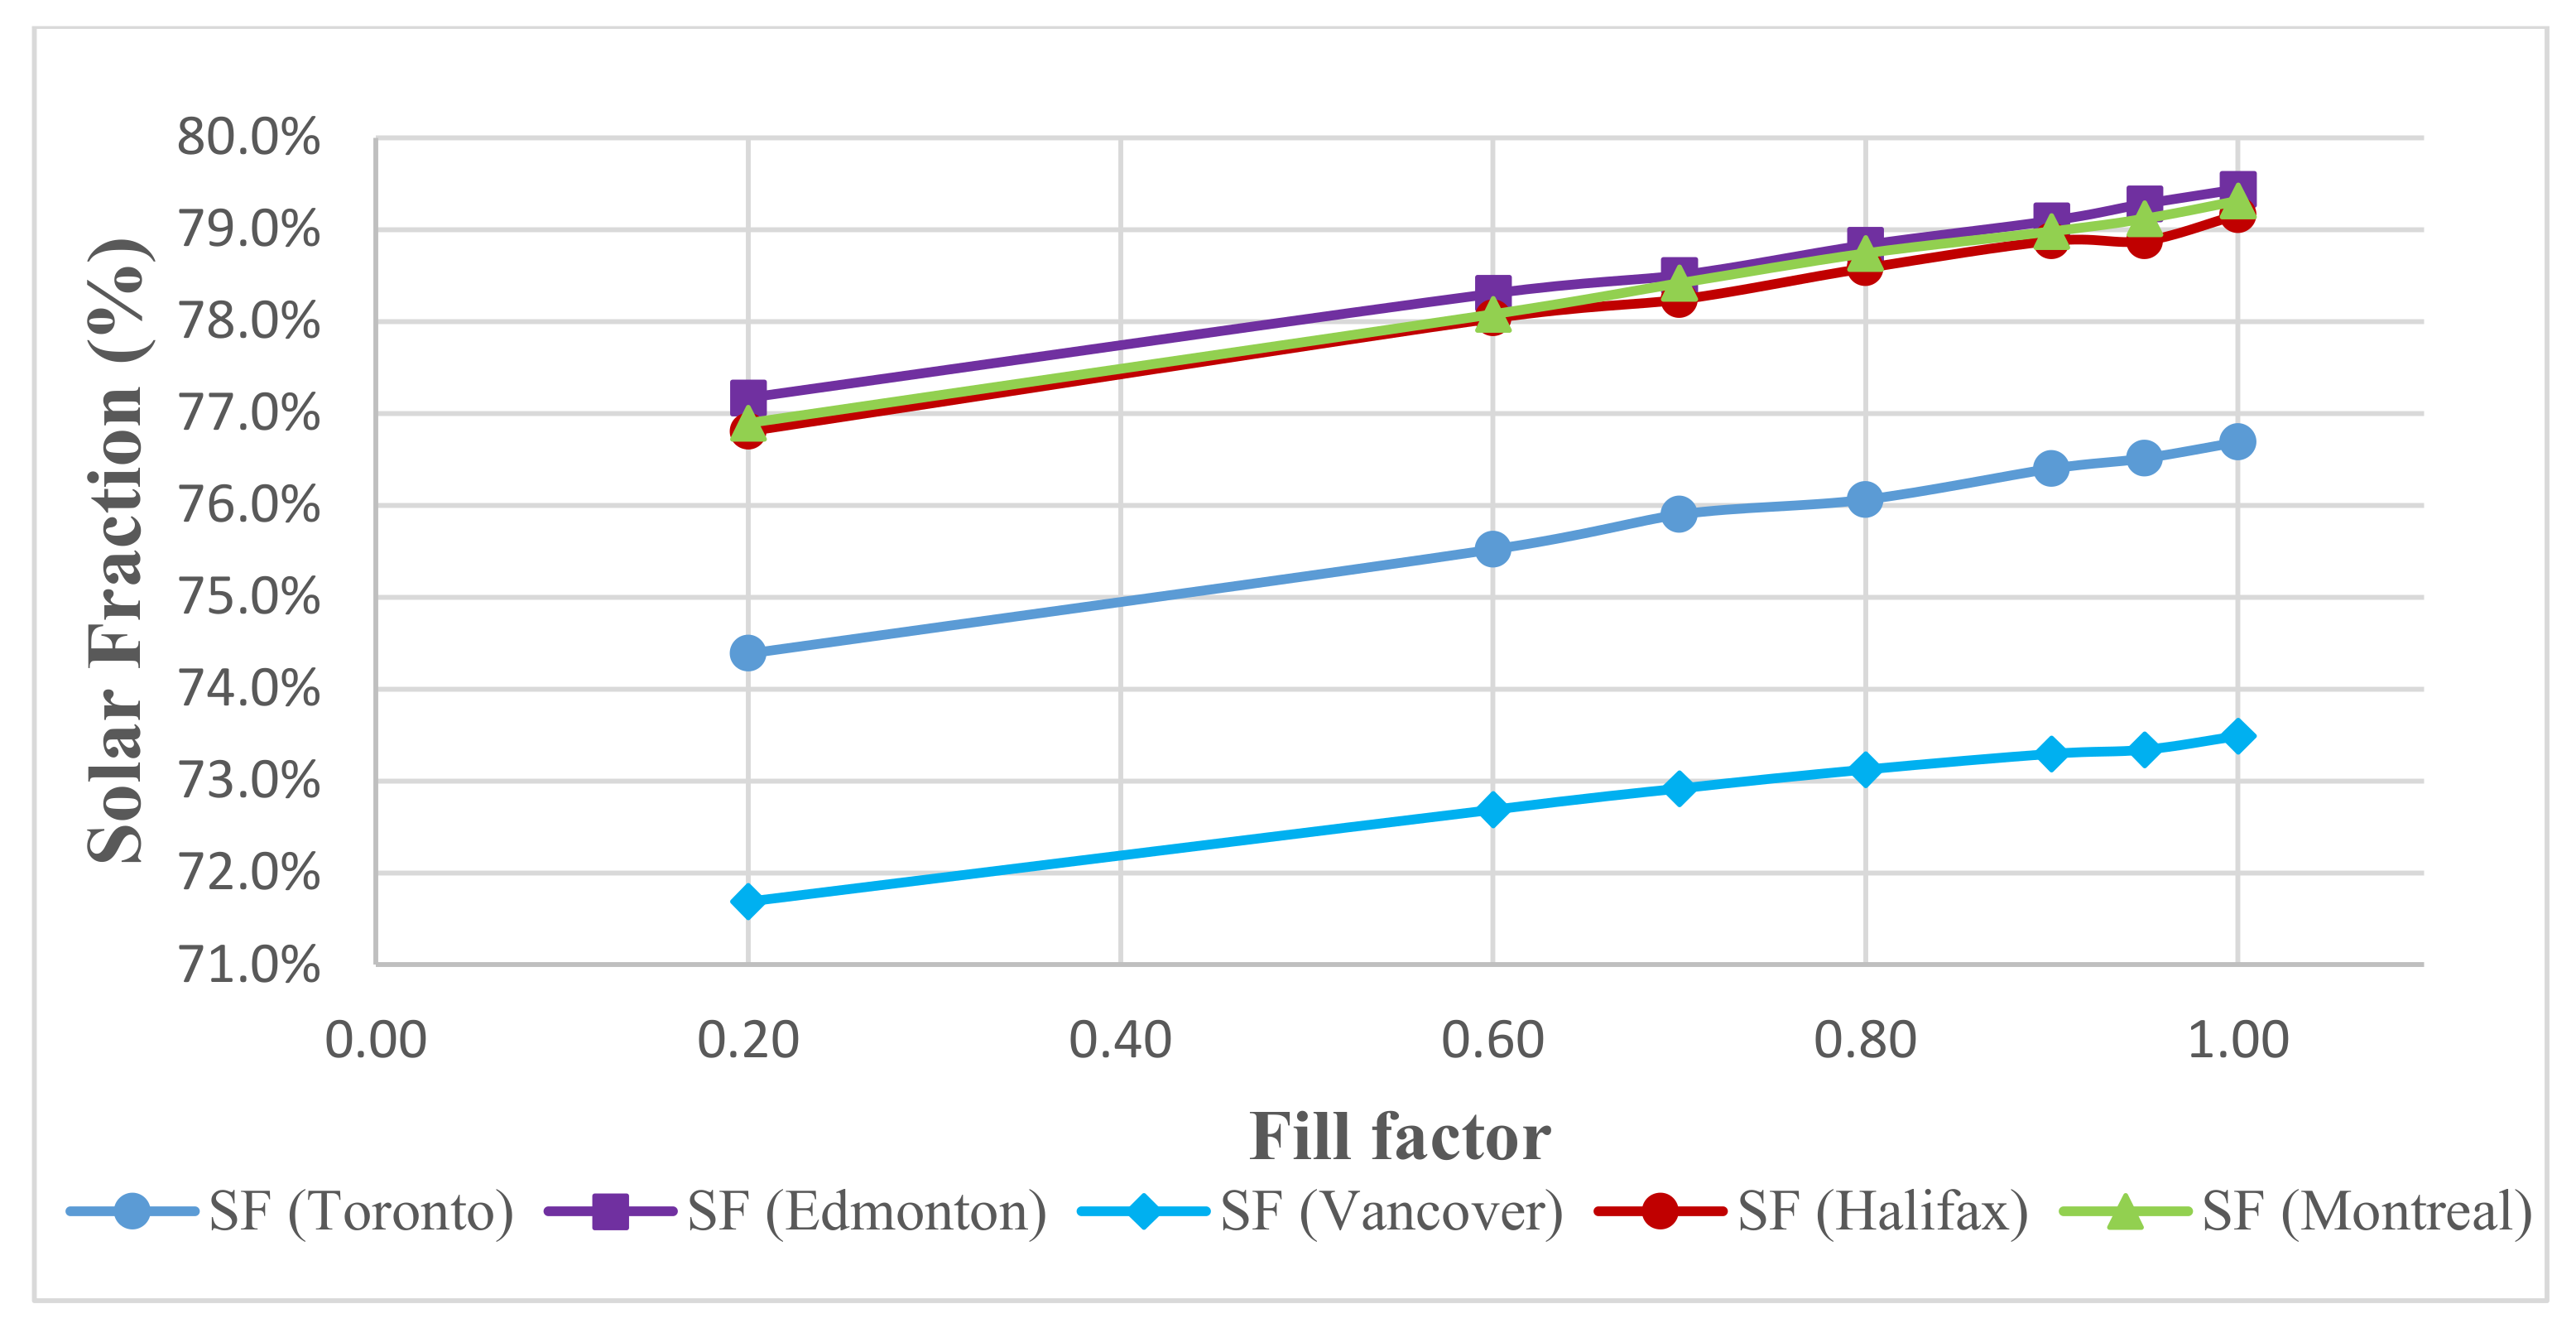
Fill factor (packing factor) of the PVT collector is the fraction of collector that is covered by the PV panel. The fill factor can have a large impact on the overall efficiency of the system. Figure 15 shows that, by increasing the fill factor of the MCPVT, the SF number of the MCPVT-HP system increases. It can be seen that the fill factor and SF number have the same pattern in Toronto and Edmonton despite the two locations having different solar availability.
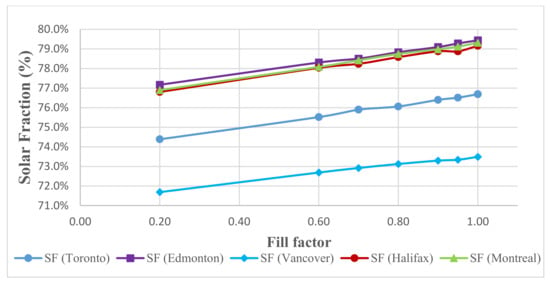
Figure 15.
MCPVT-HP PV fill factor sensitivity analysis for Toronto and Edmonton.
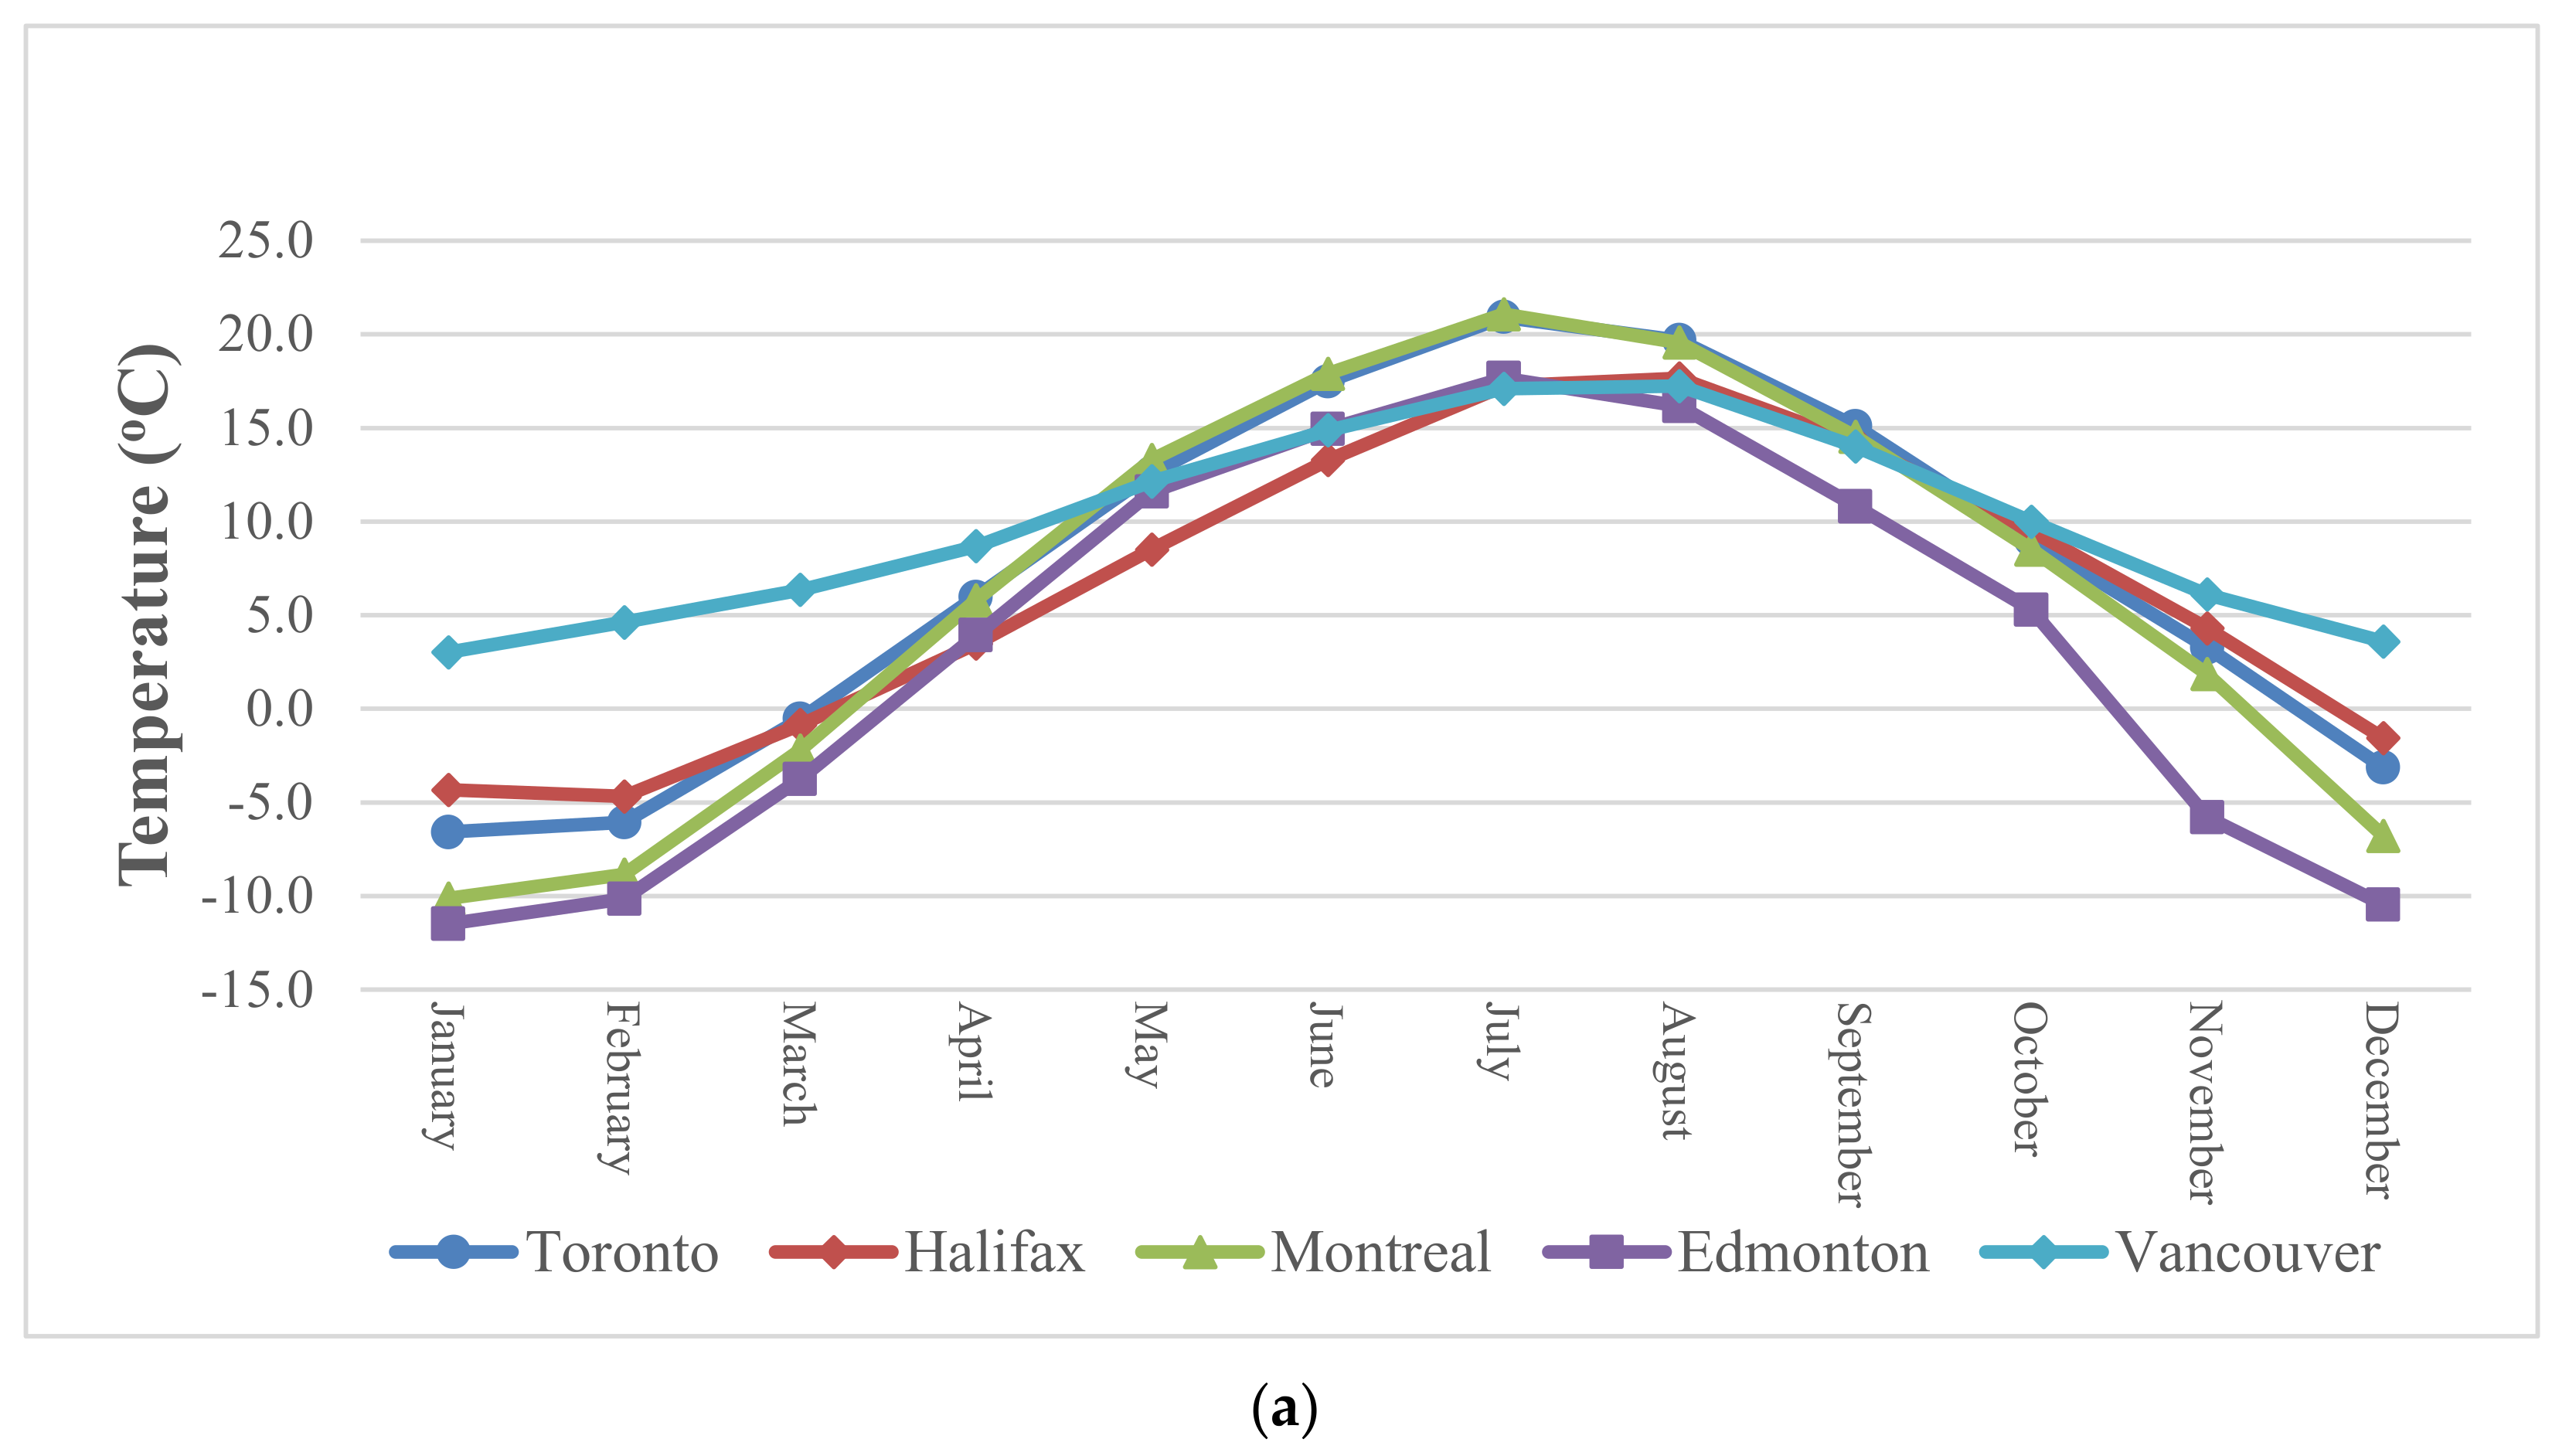
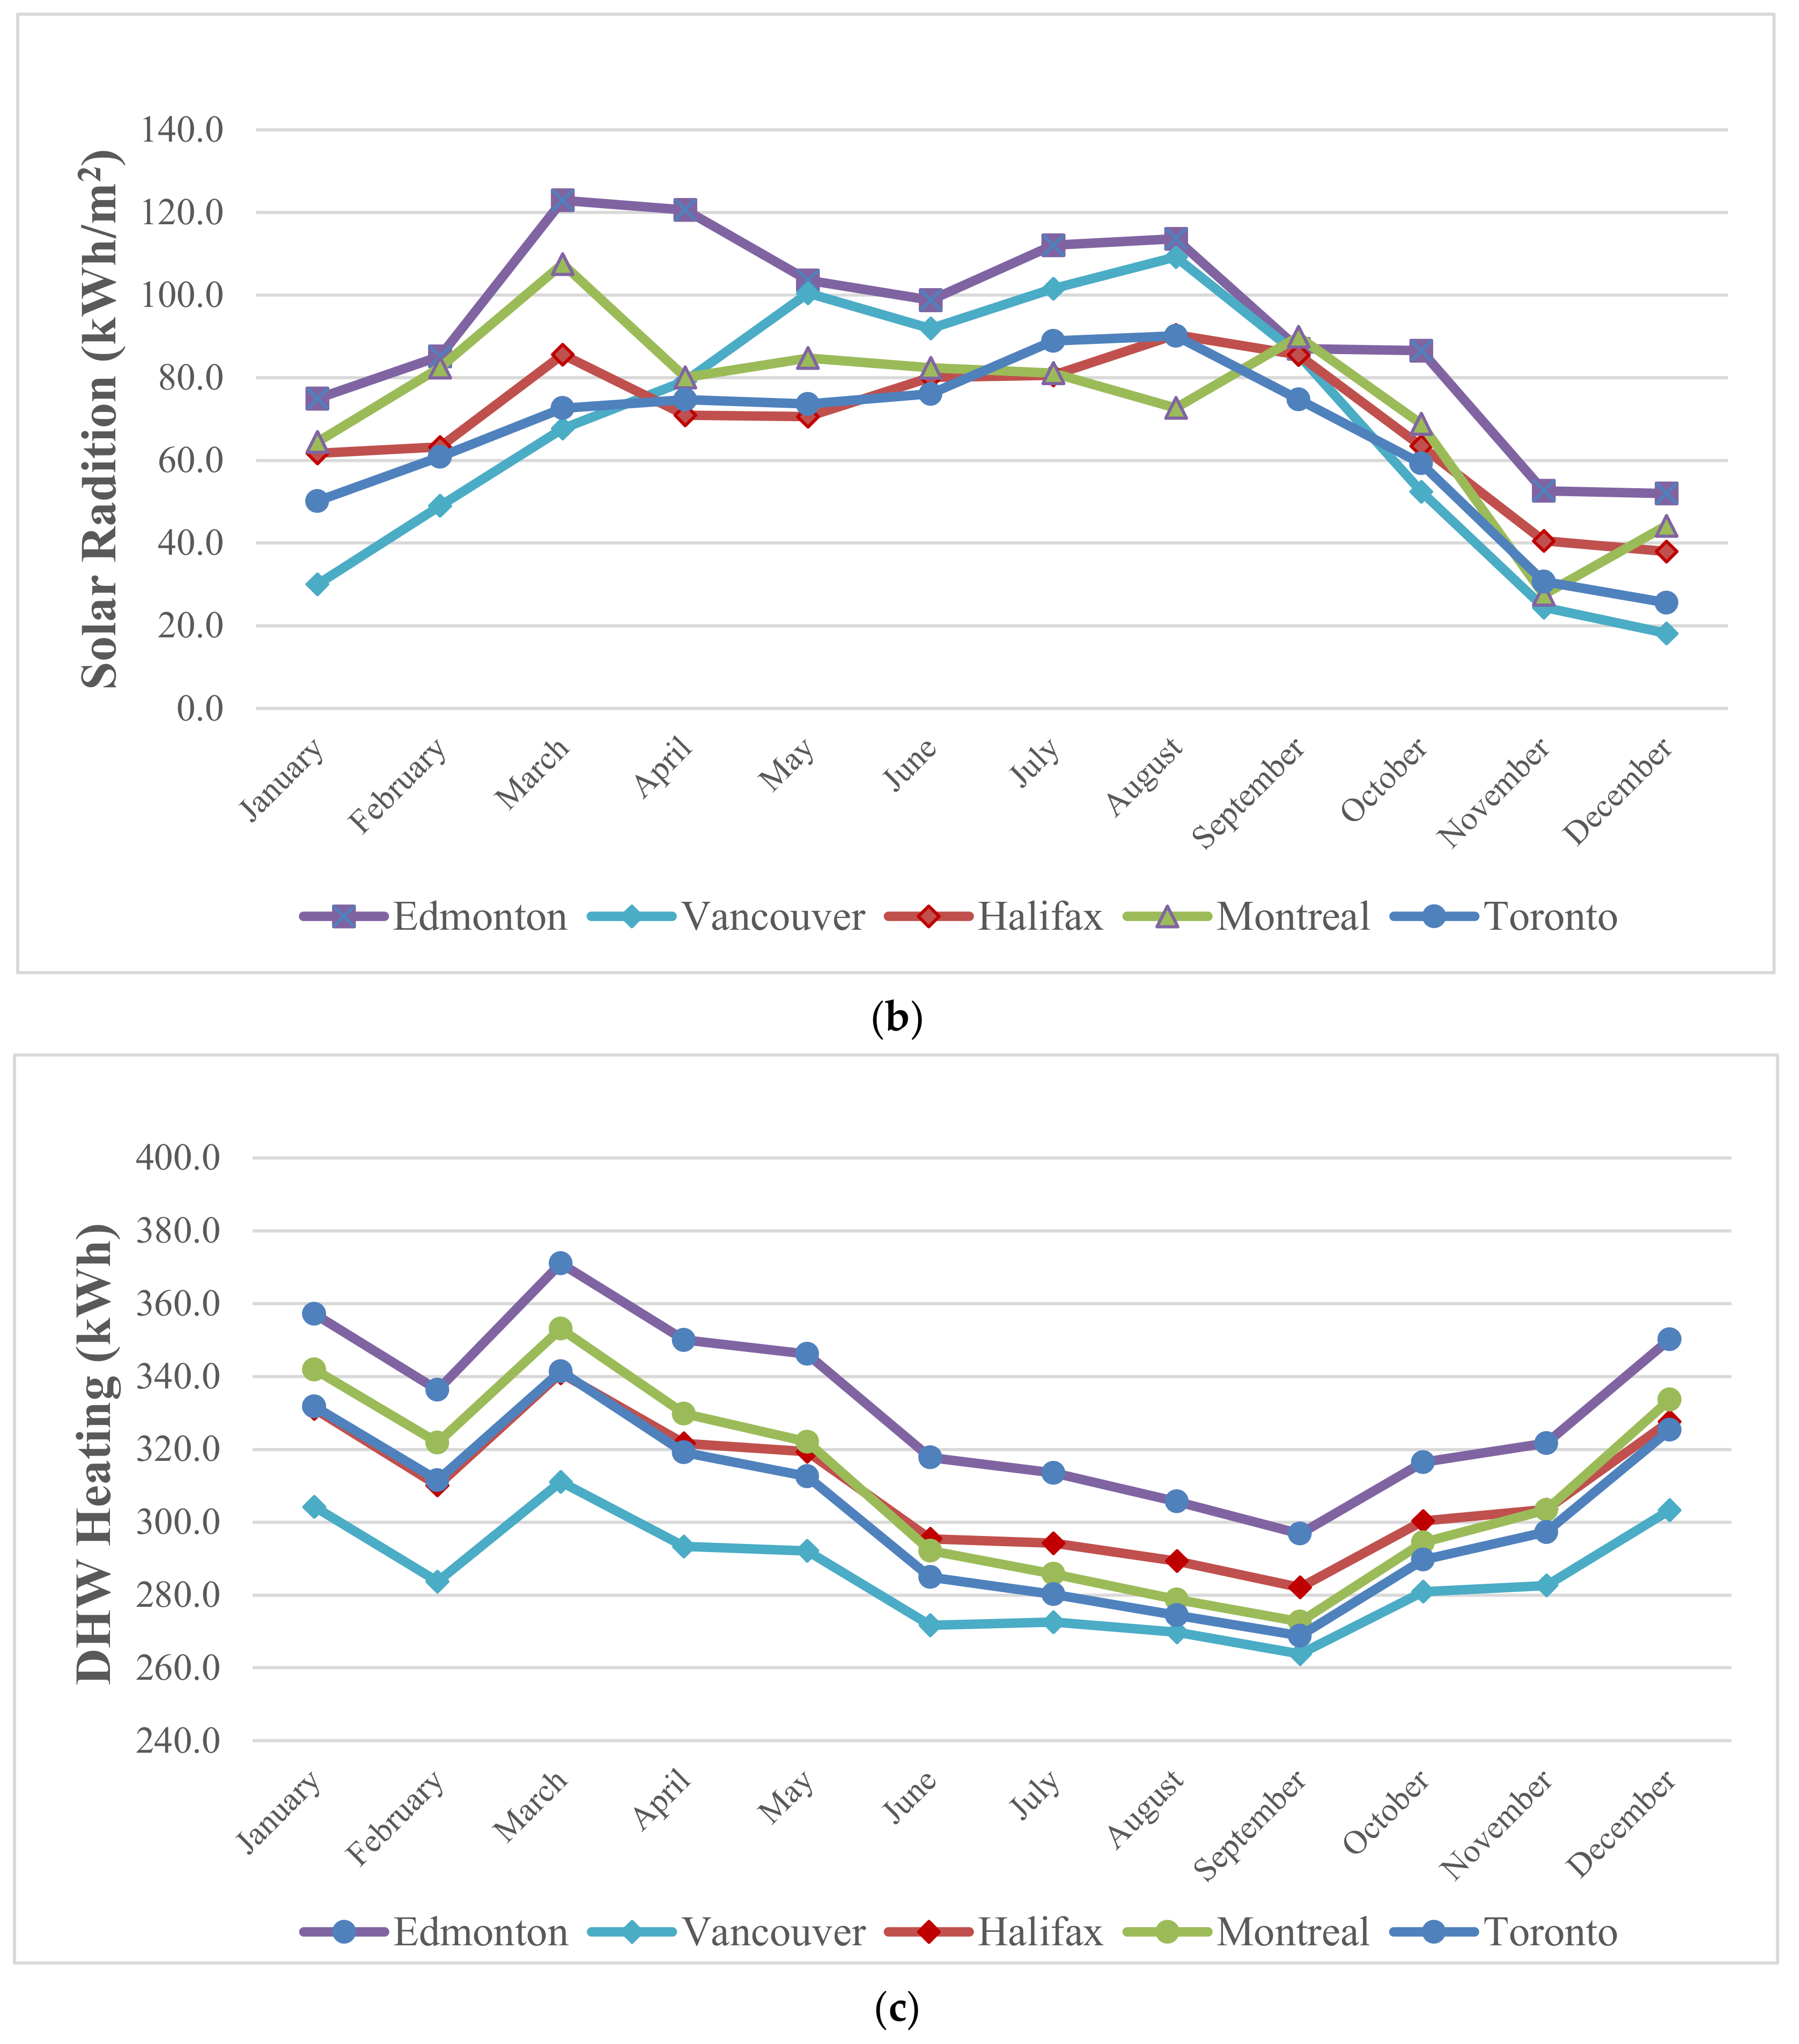
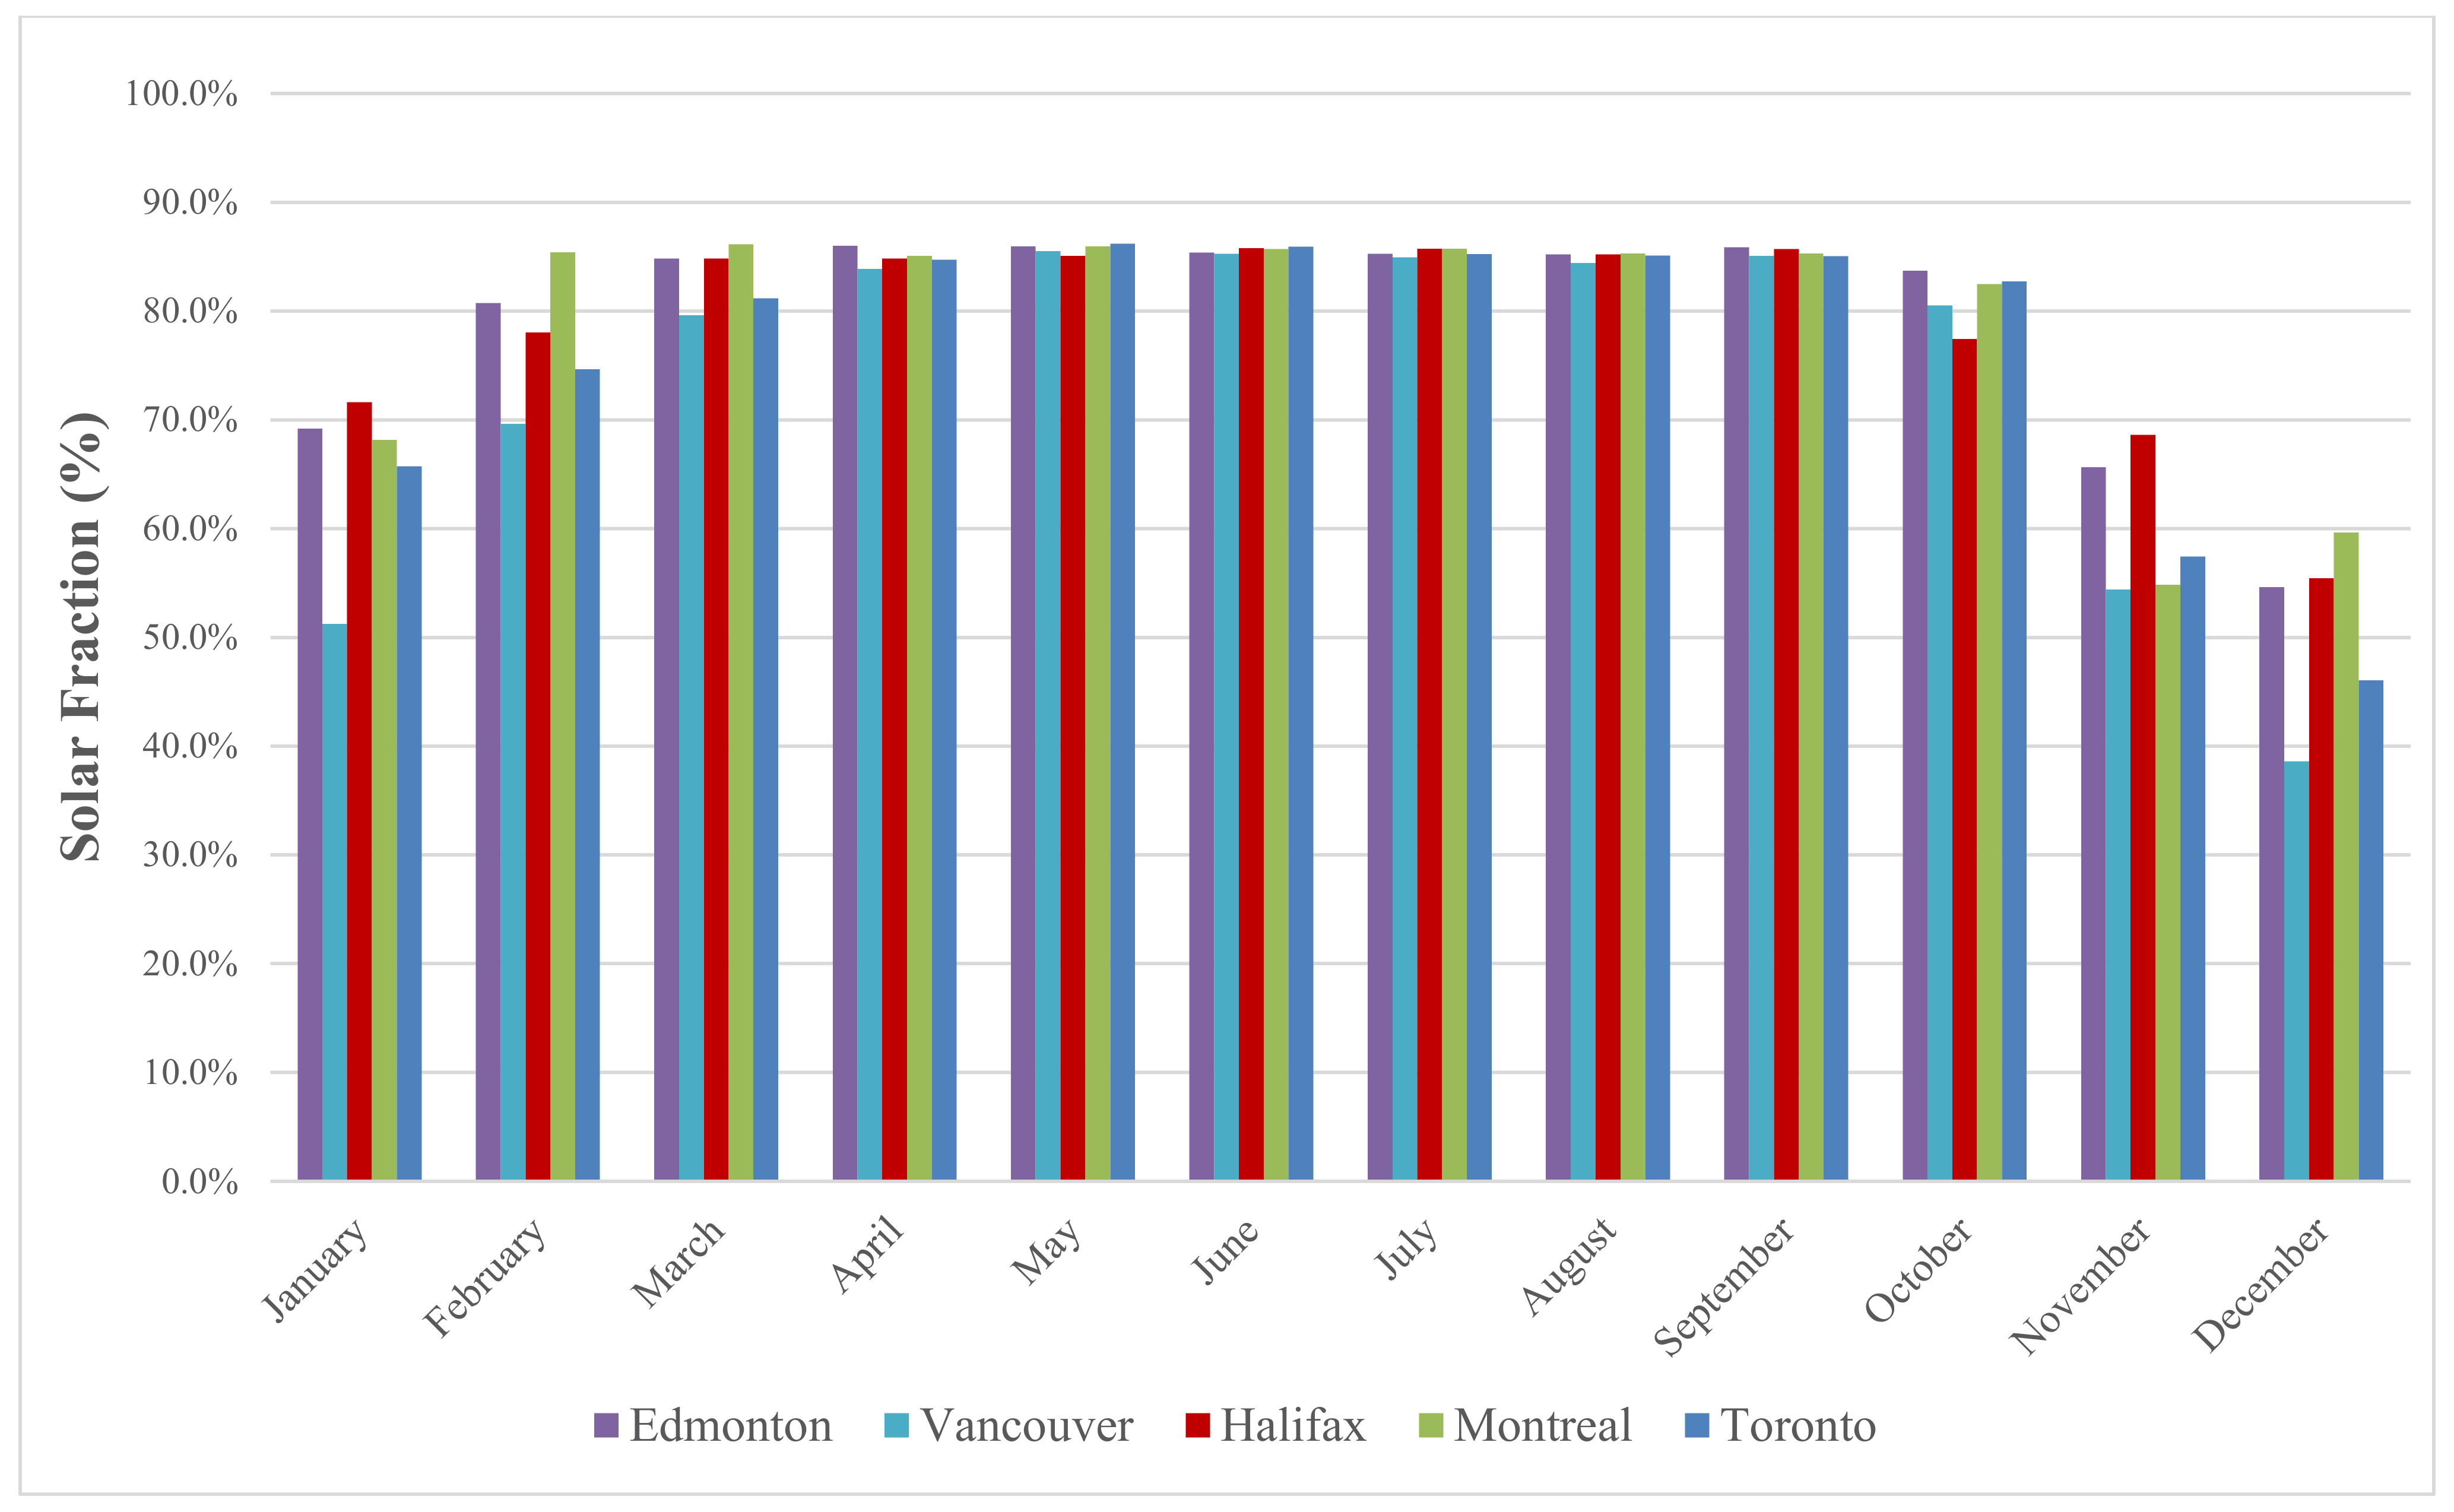
To study climatic effects on overall system efficiency, all systems are simulated at 45° tilt angle in five different Canadian cities with different annual ambient temperatures. Figure 16a shows that Vancouver and Edmonton are the warmest and coldest cities, respectively. Figure 16b also shows that Edmonton and Vancouver have the highest and lowest direct solar irradiance availability, respectively. Figure 16c shows a direct relationship between ambient temperature and monthly DHW base case energy. Edmonton has the coldest average ambient temperature and has 16% higher DHW energy demand than Vancouver.
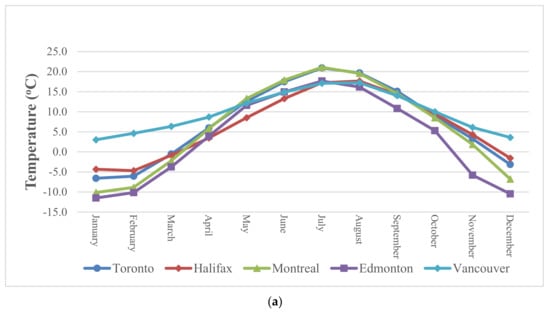
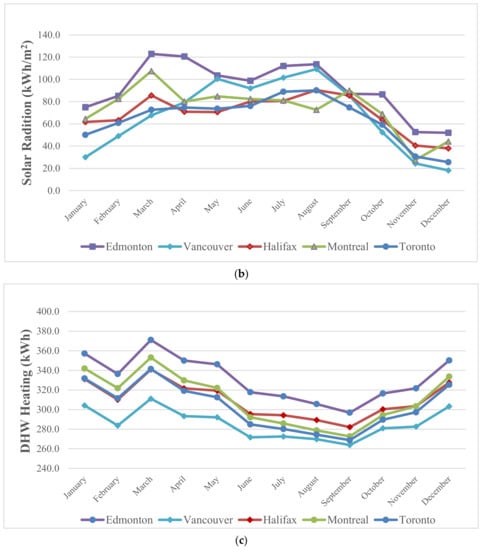
Figure 16.
(a) Average monthly ambient temperature of five Canadian cities; (b) Monthly direct beam radiation on surface; (c) Monthly DHW base case energy.
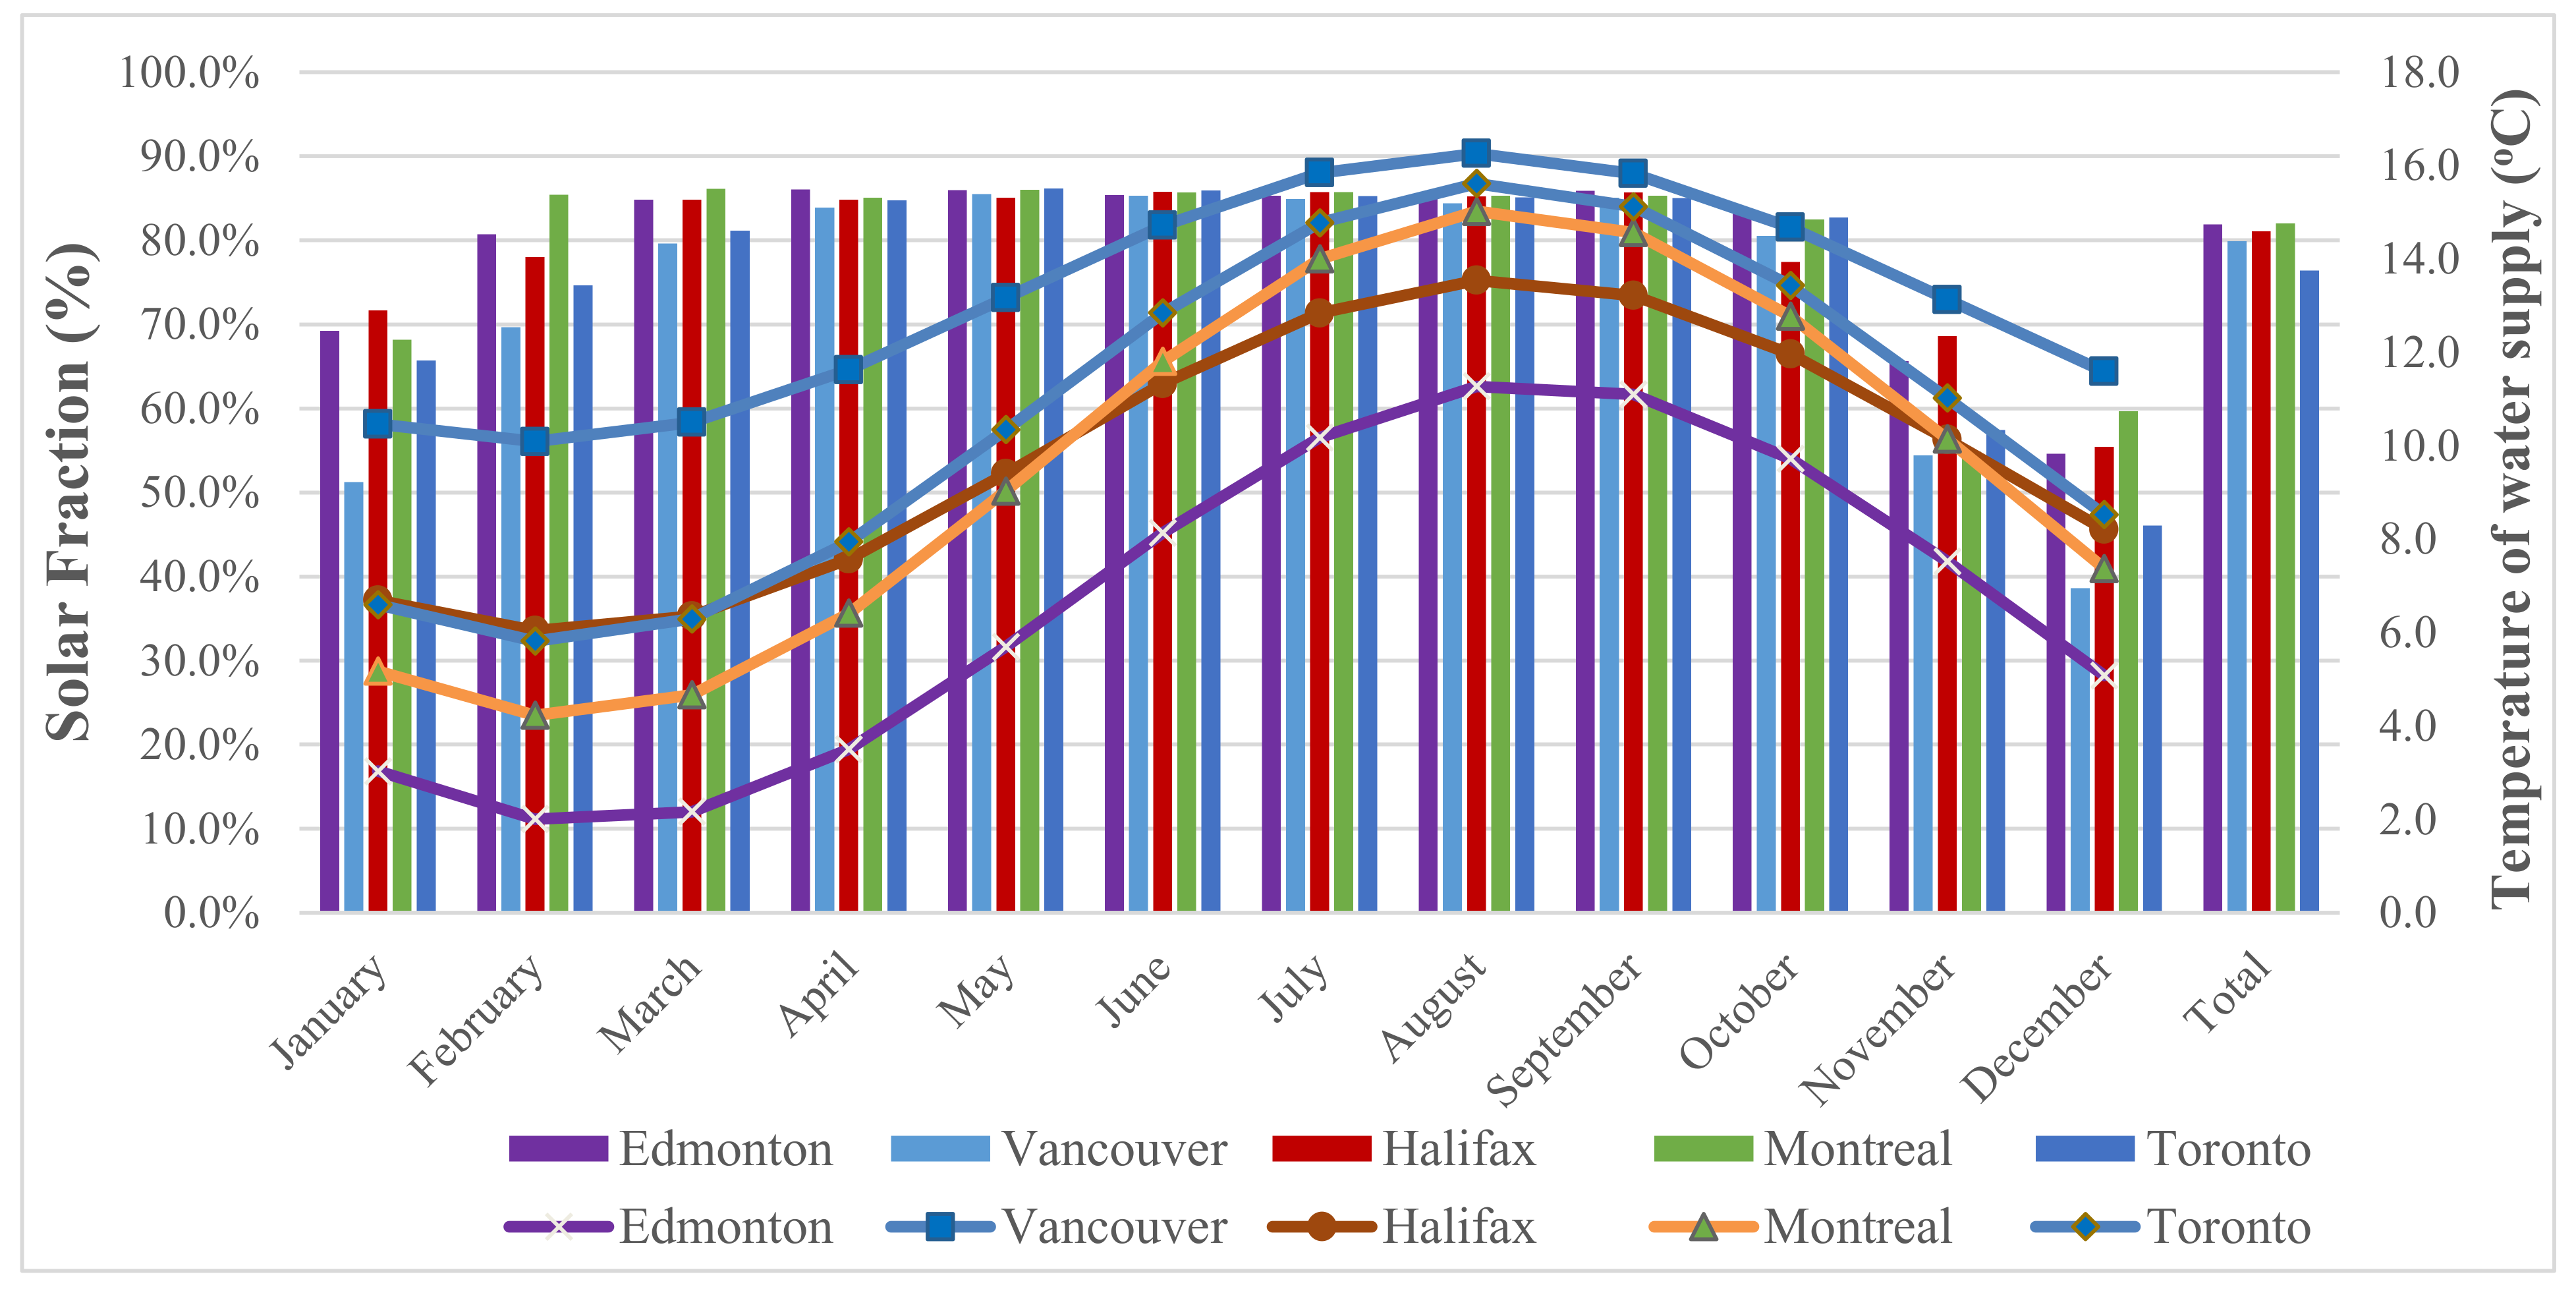
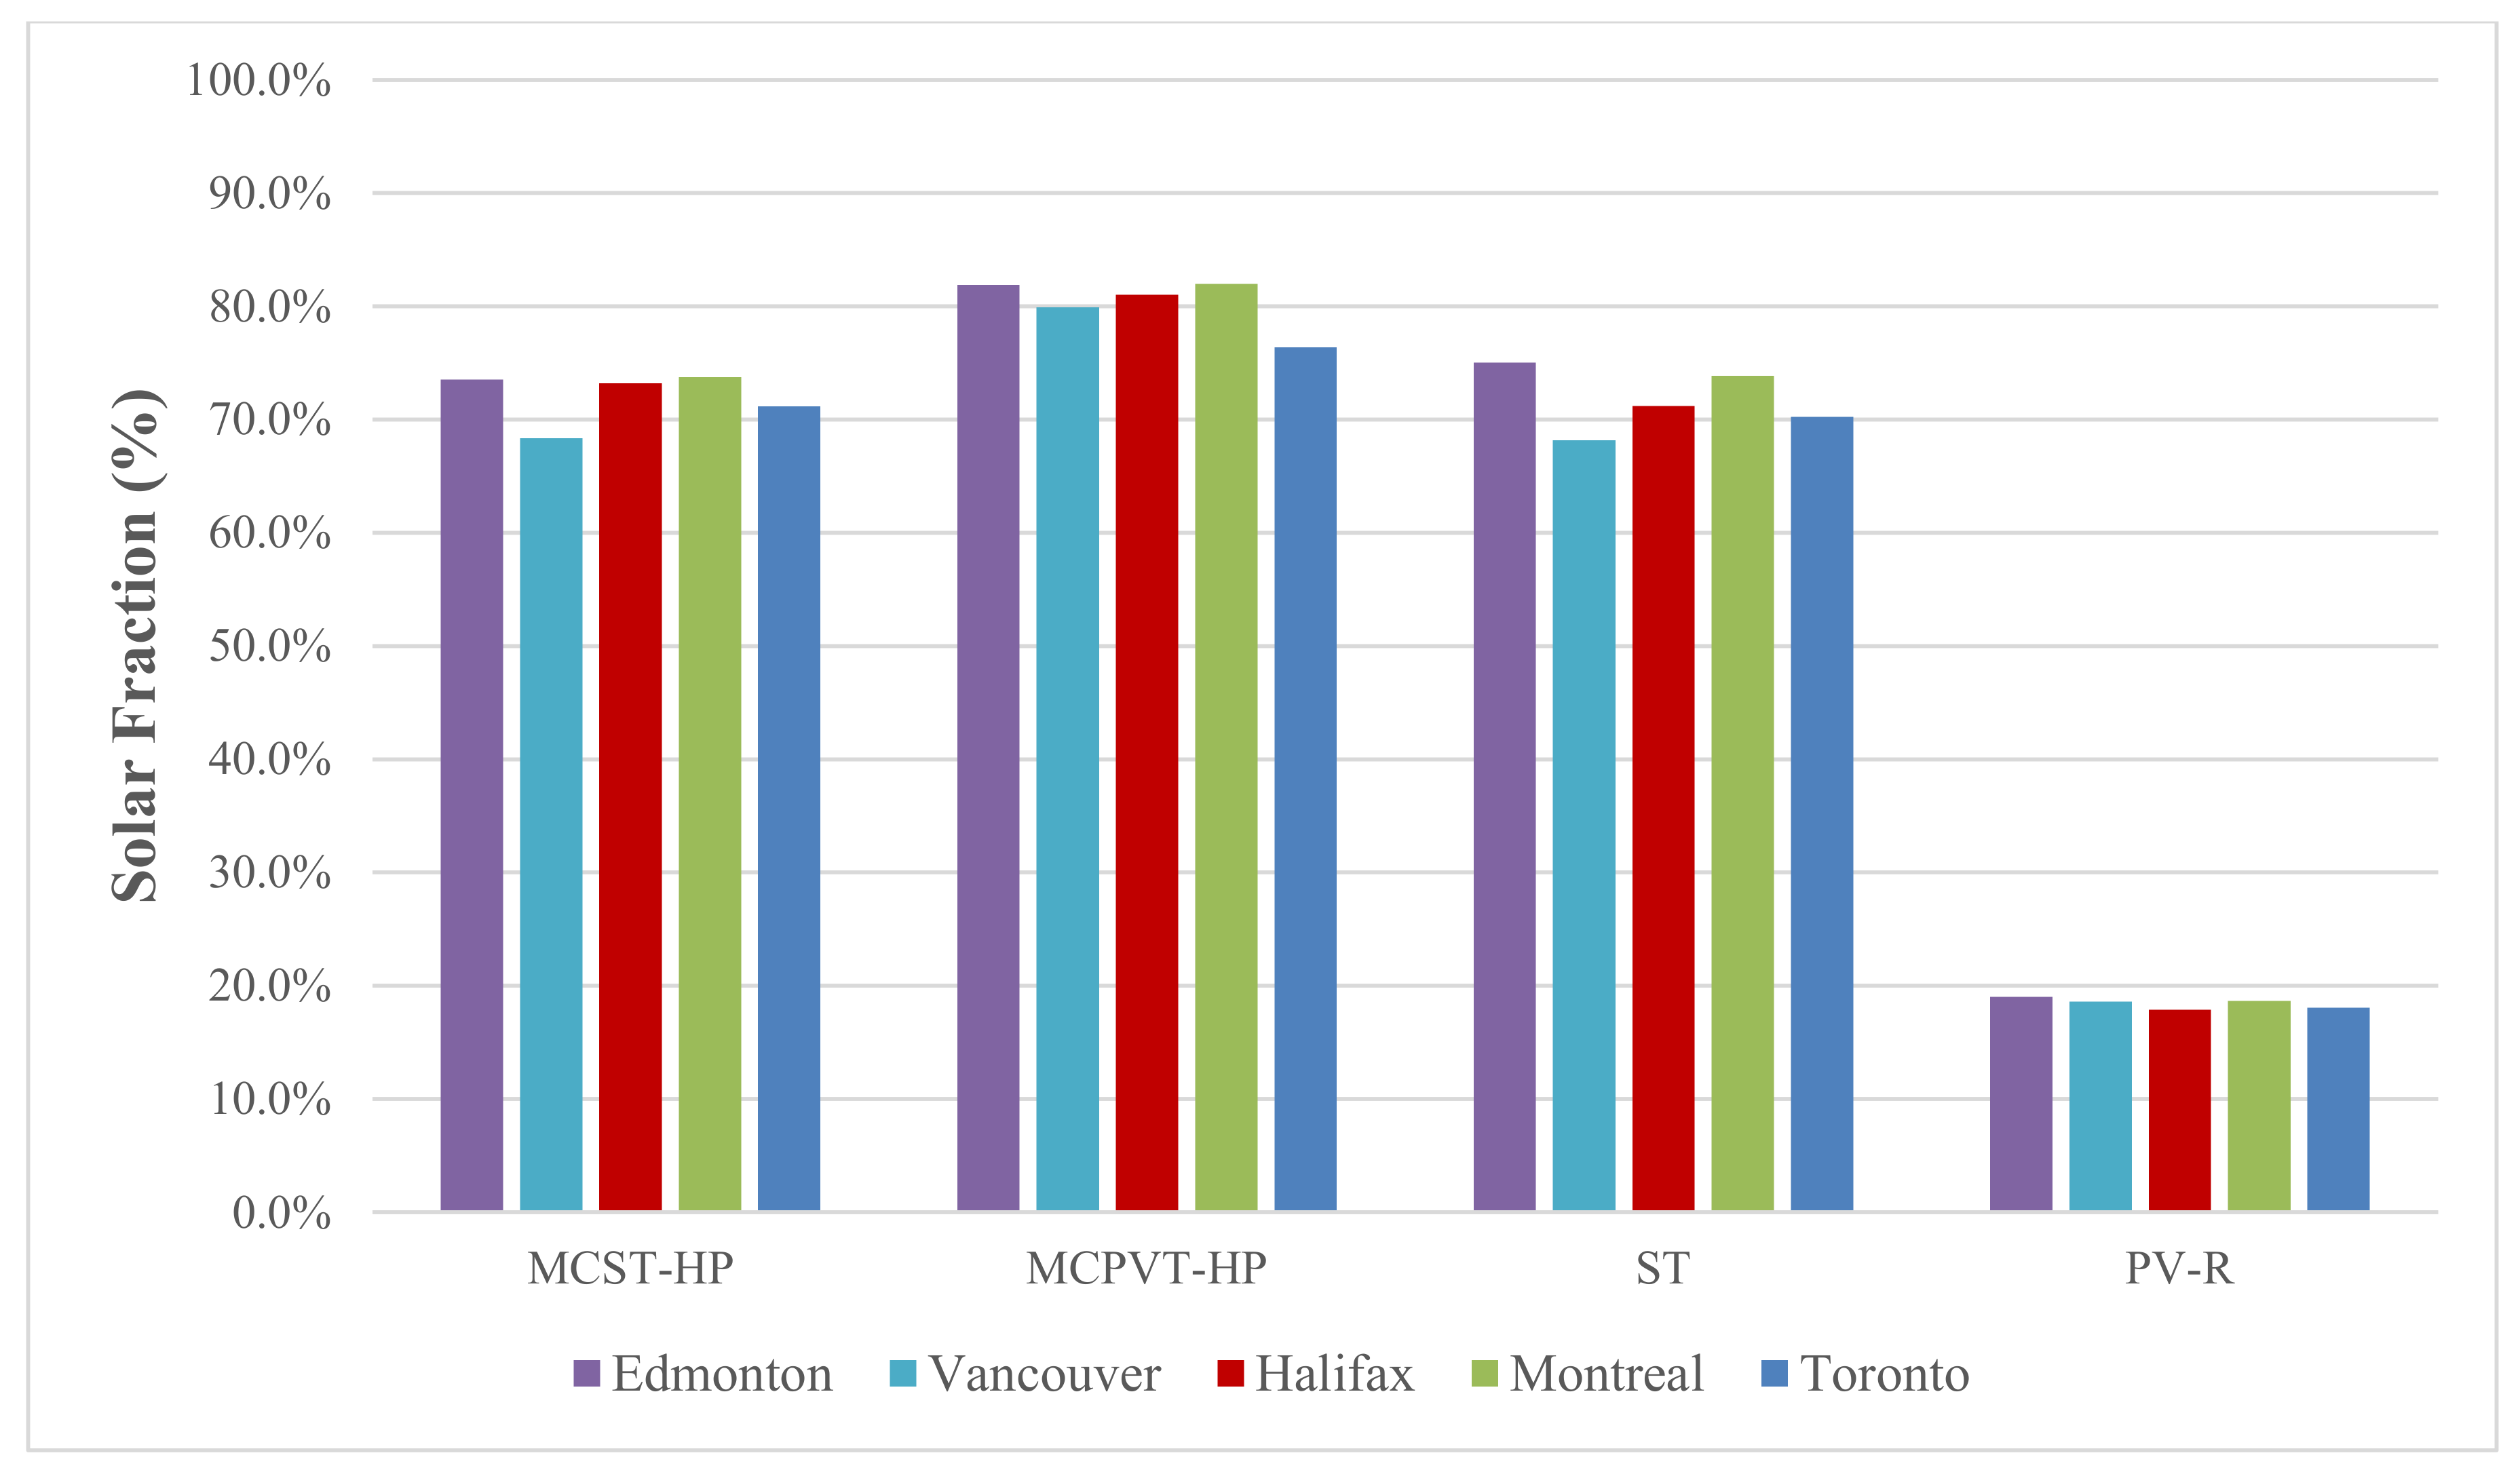
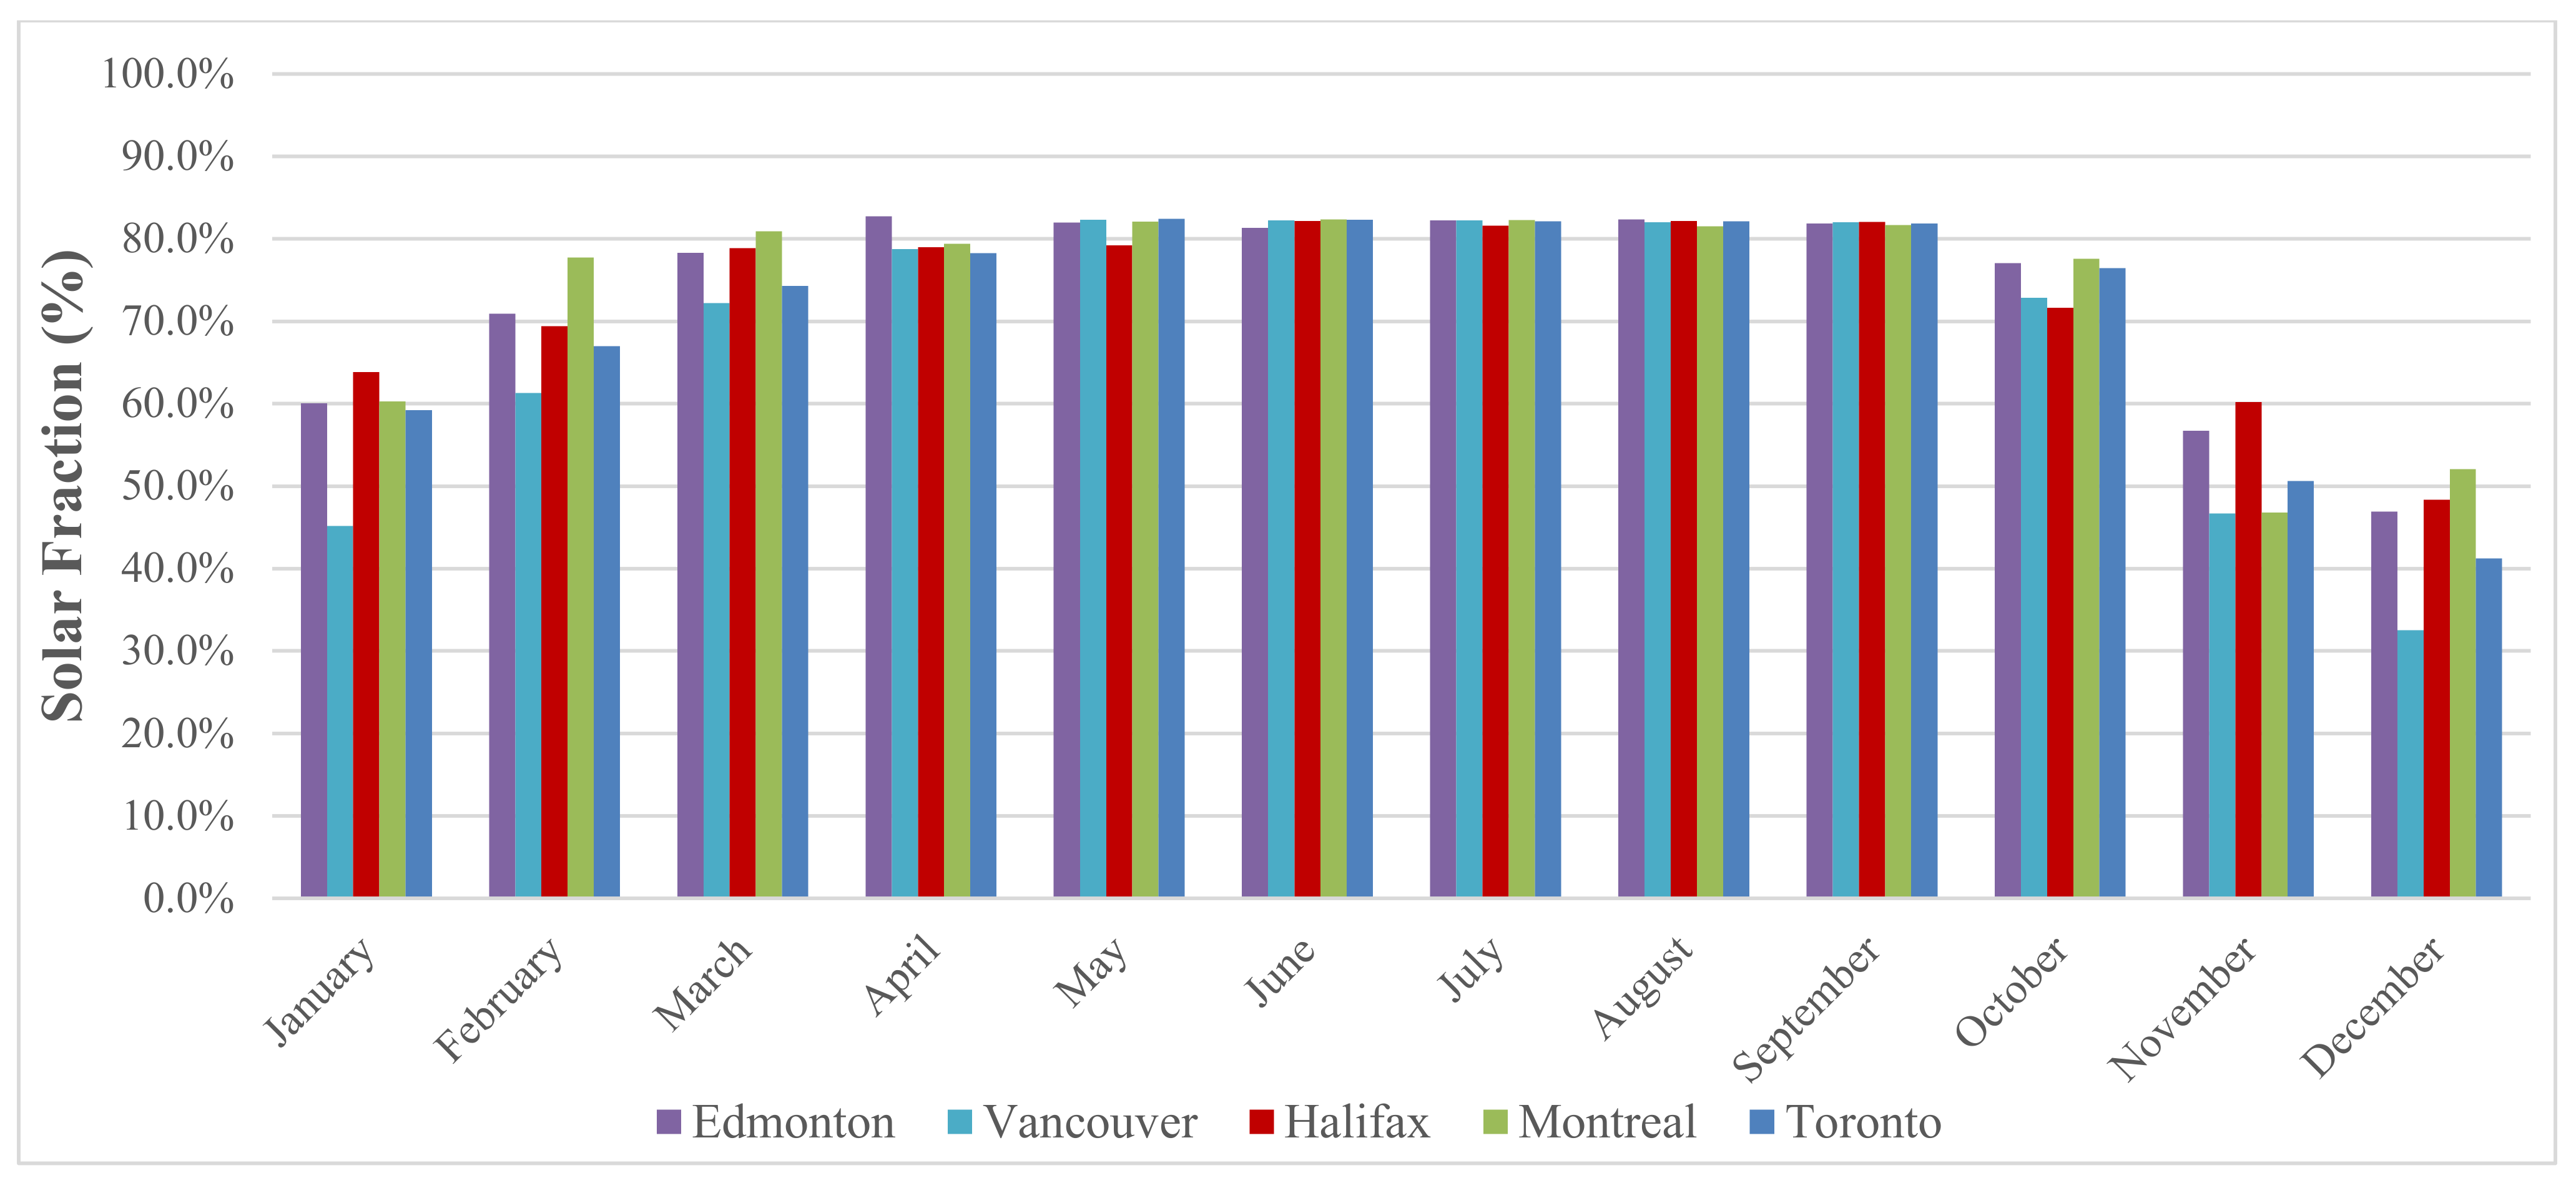
In Figure 17, the water main supply temperature and monthly SF of MCPVT-HP among the five Canadian cities are presented. Although Vancouver has the highest supply water temperature and warmest climate, it always has the lowest SF number. On the other hand, Edmonton has the lowest annual water main supply temperature, but its SF is greater than that of other warmer cities due to higher solar availability. Thus, no meaningful relationship between supply water temperature and SF number was found. One reason for this could be that, in cities such as Vancouver, direct solar irradiance is low due to cloud and long rainy seasons. The number of sunny days influences the total solar energy captured by the collectors. Direct irradiance is more beneficial for all types of collectors. Figure 16b illustrates monthly direct beam radiation on collectors. Although Edmonton has the lowest average water main supply temperature, it has the highest direct beam radiation. Overall, Edmonton has 44% higher beam radiation than Toronto and Vancouver, and this higher beam radiation leads to higher SF in Edmonton. Figure 18 shows annual SF of all systems in five cities. The MCPVT-HP system, with 82% solar fraction for both Montreal and Edmonton, is the most efficient system, that is 5.5% higher SF than Toronto. Overall, the MCPVT-HP system has the highest solar fraction in all cities. All four systems have better SF in Edmonton compared other cities, which has colder average ambient and water main supply temperatures, but with higher direct beam radiation. Based on all comparisons and sensitivity analyses, direct beam radiation has a great impact on the overall solar fraction of the MCPVT-HP and MCST-HP. Figure 19 and Figure 20 show that the MCPVT-HP and MCST-HP systems had higher SF in wintertime in cities such as Edmonton and Montreal, which have higher direct beam radiation.
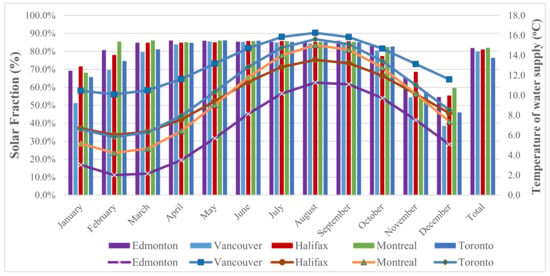
Figure 17.
Monthly SF of MCPVT-HP system in different cities as a function of water main supply temperature.
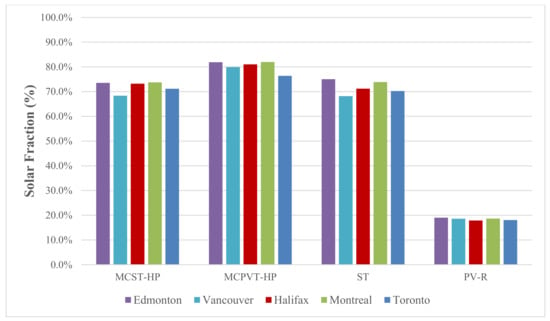
Figure 18.
Annual SF comparison of different solar-based DHW systems for five cities.
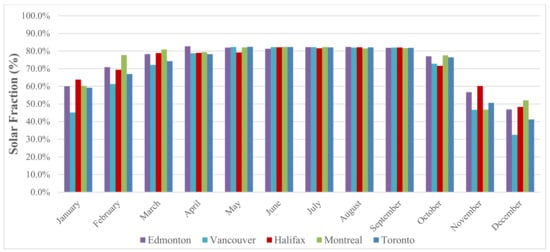
Figure 19.
Monthly SF of MCST-HP system in different cities.
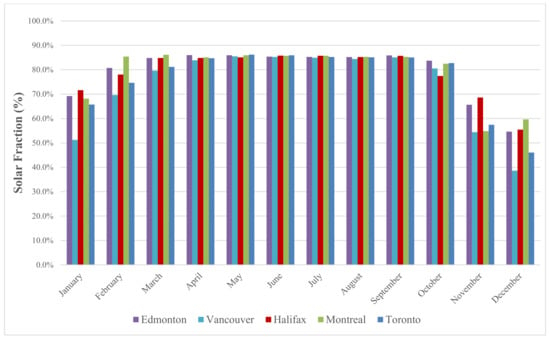
Figure 20.
Monthly SF of MCPVT-HP system in different cities.
5. Conclusions
In this work, four solar-based DHW systems were modeled, simulated, and then compared. A microchannel-based solar thermal collector and a microchannel-based PVT collector were designed and fabricated for future laboratory and field studies. To enhance the efficiency of the MCST and MCPVT collectors, an integrated dual-tank HP system was designed and compared with the PV-R and conventional single-tank solar-thermal-collector-based DHW systems. The hybrid microchannel PVT based system has the best overall annual performance and solar fraction. During wintertime in Toronto, the hybrid microchannel PVT system could achieve a 10–35% higher SF than the conventional single-tank solar-thermal-based system. The following can be summarized from this study:
- All results show that the PVT system has significantly higher overall efficiency than an individual PV-R system; thus, for limited-space applications, the PVT-based system has higher overall energy, as well as higher combined thermal and electrical generation efficiency.
- PV panels in the MCPVT-HP system have lower electrical PV efficiency than individual PV panels, particularly in the summer months, due to their higher surface temperatures.
- It was found that integration of the microchannel collector with a HP system led to a higher SF at high collector tilt angles as compared to conventional systems. This new finding may imply that the MCPVT-HP and MCST-HP systems could be more suitable than conventional systems for high-rise building applications, as MCPVT and MCST can be mounted vertically on south facing facades when rooftop area is limited. Future work should investigate the potential use of MCPVT-HP and MCST-HP systems for combined space and hot-water heating applications in high-rise buildings in a cold climate.
- Since the MCPVT-HP can work with higher tilt angles of 60–90° without significant SF reduction, PV panels will not be overheated during the summertime and will operate within a suitable working temperature range. Lower PV panel temperature increases the system lifetime and increases the overall power output of the PV panels.
- Having a higher tilt angle for MCPVT-HP and MCST-HP systems prevents overheating of the system during the summertime and reduces the preheat tank temperature significantly. Hence no bypass loop is needed when such systems are installed on vertical facades.
- The highest SF number for MCPVT-HP and MCST-HP can be achieved at 100 kg/h flow rate for a 4 m2 collector. However, it was shown that the flow rate does not significantly impact the maximum PV panel temperature of the PVT panel during the summertime when the system is used for DHW applications.
- The best configuration for the MCPVT-HP system is achieved with a collector tilt angle between 60° and 90° and a water/glycol flow rate of 250–300 kg/h. This configuration gives the highest SF number, prevents overheating of the preheat tank, and maintains the PV panel temperature in the working temperature range (to prevent PV cell degradation).
- All models were simulated for five different Canadian cities to study the effect of different regional climates on the systems’ performances. The MCPVT-HP system achieved 82% solar fraction in Edmonton, the highest SF number achieved in the study. This was 12% higher than the conventional single-tank ST system. It was shown that direct beam radiation has a greater impact on SF than do ambient temperature, water main supply temperature, and/or other climatic parameters.
For future works, it is recommended to increase the fill factor of the MCPVT collector to 95–100% to harvest more thermal and electrical energy for DHW provision. Making a better surface contact between the PV panel and microchannel heat exchanger is necessary to enhance the efficiency of the PVT collector. Furthermore, choosing a more suitable PV cell technology with a lower temperature derating coefficient on efficiency could minimize the loss of PV electricity generation, particularly in the summer months. Additionally, future works should include a proper bypass system directly connecting the preheat tank and DHW tank. This change may improve the SF of the HP-integrated systems.
This project is an initial work on MC-based PVT systems. The continuing development and testing of the MCPVT-HP for actual deployment is necessary.
Author Contributions
Conceptualization, M.E.K., A.S.F. and J.S.; methodology, M.E.K. and A.S.F.; software, M.E.K. validation, M.E.K. and A.S.F.; formal analysis, M.E.K.; investigation, M.E.K. and A.S.F.; resources, M.E.K., A.S.F. and J.S.; data curation, M.E.K. and A.S.F.; writing—original draft preparation, M.E.K.; writing—review and editing, M.E.K., A.S.F. and J.S.; visualization, M.E.K. and A.S.F.; supervision, A.S.F.; project administration, A.S.F. All authors have read and agreed to the published version of the manuscript.
Funding
This research was funded by Natural Sciences and Engineering Research Council (NCERC) of Canada Discovery Grant.
Acknowledgments
The authors would like to acknowledge the funding support from the Discovery Grant of the Natural Sciences and Engineering Research Council (NSERC) of Canada.
Conflicts of Interest
The authors declare no conflict of interest.
Appendix A

Table A1.
Water-to-water heat pump catalogue data.
Table A1.
Water-to-water heat pump catalogue data.
| Source | Load Flow = 0.189 L/s | Load Flow = 0.303 L/s | Load Flow = 0.379 L/s | ||||||||||||||
|---|---|---|---|---|---|---|---|---|---|---|---|---|---|---|---|---|---|
| EST | L/s Flow | ELT | LLT | HC | Power | COP | LST | LLT | HC | Power | COP | LST | LLT | HC | Power | COP | LST |
| °C | °C | °C | kW | kW | °C | °C | kW | kW | °C | °C | kW | kW | °C | ||||
| −3.9 | 0.189 | 15.6 | Operation not recommended. | Operation not recommended. | Operation not recommended. | ||||||||||||
| 26.7 | |||||||||||||||||
| 37.8 | |||||||||||||||||
| 48.9 | |||||||||||||||||
| 0.379 | 15.6 | 21.1 | 4.2485 | 0.97 | 4.38 | −6.4 | 19.8 | 4.3071 | 0.95 | 4.52 | −6.5 | 18.9 | 4.3364 | 0.93 | 4.66 | −6.6 | |
| 26.7 | 32.1 | 4.1313 | 1.3 | 3.19 | −6.1 | 30.8 | 4.1899 | 1.28 | 3.27 | −6.2 | 29.9 | 4.2192 | 1.26 | 3.36 | −6.2 | ||
| 37.8 | 43.1 | 4.0434 | 1.62 | 2.48 | −5.8 | 41.8 | 4.0727 | 1.6 | 2.54 | −5.8 | 41.0 | 4.102 | 1.58 | 2.59 | −5.8 | ||
| 48.9 | 54.0 | 3.9262 | 1.95 | 2.01 | −5.4 | 52.8 | 3.9555 | 1.93 | 2.05 | −5.5 | 52.0 | 3.9848 | 1.91 | 2.09 | −5.5 | ||
| −1.1 | 0.227 | 15.6 | 21.3 | 4.4536 | 0.97 | 4.59 | −5.7 | 20.2 | 4.5122 | 0.95 | 4.74 | −5.7 | 19.1 | 4.5415 | 0.93 | 4.88 | −5.8 |
| 26.7 | 32.3 | 4.3657 | 1.3 | 3.35 | −5.1 | 31.2 | 4.395 | 1.28 | 3.43 | −5.2 | 30.1 | 4.4243 | 1.26 | 3.52 | −5.2 | ||
| 37.8 | 43.3 | 4.2485 | 1.63 | 2.61 | −4.6 | 42.2 | 4.3071 | 1.61 | 2.67 | −4.6 | 41.2 | 4.3364 | 1.59 | 2.72 | −4.7 | ||
| 48.9 | 54.3 | 4.1606 | 1.96 | 2.12 | −4.0 | 53.2 | 4.1899 | 1.94 | 2.16 | −4.1 | 52.2 | 4.2192 | 1.92 | 2.2 | −4.1 | ||
| 0.3028 | 15.6 | 21.5 | 4.5708 | 0.97 | 4.71 | −4.8 | 20.3 | 4.6294 | 0.95 | 4.86 | −4.9 | 19.2 | 4.6587 | 0.93 | 5.01 | −4.9 | |
| 26.7 | 32.4 | 4.4536 | 1.3 | 3.43 | −4.4 | 31.3 | 4.4829 | 1.28 | 3.51 | −4.4 | 30.2 | 4.5415 | 1.26 | 3.6 | −4.5 | ||
| 37.8 | 43.4 | 4.3364 | 1.63 | 2.66 | −3.9 | 42.3 | 4.3657 | 1.61 | 2.71 | −3.9 | 41.2 | 4.395 | 1.59 | 2.77 | −4.0 | ||
| 48.9 | 54.4 | 4.2192 | 1.96 | 2.15 | −3.4 | 53.3 | 4.2485 | 1.94 | 2.19 | −3.5 | 52.2 | 4.2778 | 1.92 | 2.23 | −3.6 | ||
| 0.3785 | 15.6 | 21.7 | 4.688 | 0.97 | 4.83 | −4.0 | 20.5 | 4.7466 | 0.95 | 4.98 | −4.1 | 19.3 | 4.7759 | 0.93 | 5.14 | −4.1 | |
| 26.7 | 32.6 | 4.5415 | 1.3 | 3.5 | −3.7 | 31.4 | 4.6001 | 1.28 | 3.59 | −3.7 | 30.3 | 4.6294 | 1.26 | 3.68 | −3.7 | ||
| 37.8 | 43.6 | 4.4243 | 1.63 | 2.71 | −3.3 | 42.4 | 4.4536 | 1.61 | 2.76 | −3.3 | 41.3 | 4.4536 | 1.58 | 2.82 | −3.4 | ||
| 48.9 | 54.4 | 4.2778 | 1.96 | 2.18 | −2.9 | 53.3 | 4.3071 | 1.94 | 2.22 | −2.9 | 52.3 | 4.3071 | 1.91 | 2.26 | −3.0 | ||
| 10.0 | 0.2271 | 15.6 | 23.0 | 5.7428 | 0.98 | 5.87 | 3.8 | 21.6 | 5.8014 | 0.95 | 6.01 | 3.7 | 20.1 | 5.86 | 0.93 | 6.33 | 3.6 |
| 26.7 | 33.9 | 5.5377 | 1.31 | 4.23 | 4.5 | 32.5 | 5.5963 | 1.28 | 4.37 | 4.4 | 31.1 | 5.6549 | 1.25 | 4.51 | 4.3 | ||
| 37.8 | 44.7 | 5.3619 | 1.64 | 3.26 | 5.2 | 43.4 | 5.3912 | 1.61 | 3.35 | 5.1 | 42.0 | 5.4498 | 1.58 | 3.44 | 5.0 | ||
| 48.9 | 55.6 | 5.1568 | 1.97 | 2.62 | 5.8 | 54.3 | 5.1861 | 1.94 | 2.68 | 5.8 | 53.0 | 5.2447 | 1.91 | 2.74 | 5.7 | ||
| 0.3028 | 15.6 | 23.2 | 5.8893 | 0.98 | 6.03 | 4.9 | 21.7 | 5.9479 | 0.95 | 6.26 | 4.8 | 20.3 | 6.0065 | 0.93 | 6.49 | 4.7 | |
| 26.7 | 34.1 | 5.6842 | 1.31 | 4.34 | 5.5 | 32.6 | 5.7135 | 1.28 | 4.47 | 5.4 | 31.2 | 5.7721 | 1.25 | 4.61 | 5.3 | ||
| 37.8 | 44.9 | 5.4498 | 1.64 | 3.33 | 6.1 | 43.5 | 5.5084 | 1.61 | 3.41 | 6.0 | 42.1 | 5.5377 | 1.58 | 3.5 | 5.9 | ||
| 48.9 | 55.7 | 5.2447 | 1.97 | 2.66 | 6.6 | 54.4 | 5.274 | 1.94 | 2.72 | 6.6 | 53.1 | 5.3033 | 1.91 | 2.78 | 6.5 | ||
| 0.3785 | 15.6 | 23.4 | 6.0358 | 0.98 | 6.18 | 6.1 | 21.9 | 6.0944 | 0.95 | 6.43 | 5.9 | 20.4 | 6.1823 | 0.93 | 6.68 | 5.9 | |
| 26.7 | 34.2 | 5.8014 | 1.31 | 4.44 | 6.5 | 32.8 | 5.86 | 1.28 | 4.58 | 6.4 | 31.3 | 5.8893 | 1.25 | 4.72 | 6.4 | ||
| 37.8 | 45.1 | 5.567 | 1.64 | 3.39 | 6.9 | 43.6 | 5.5963 | 1.61 | 3.48 | 6.9 | 42.2 | 5.6256 | 1.58 | 3.57 | 6.8 | ||
| 48.9 | 55.8 | 5.3326 | 1.97 | 2.7 | 7.4 | 54.4 | 5.3619 | 1.94 | 2.76 | 7.3 | 53.1 | 5.3619 | 1.91 | 2.82 | 7.3 | ||
| 21.1 | 0.2271 | 15.6 | 24.7 | 7.0027 | 0.98 | 7.15 | 13.3 | 22.9 | 7.0906 | 0.95 | 7.46 | 13.1 | 21.2 | 7.1492 | 0.92 | 7.77 | 13.0 |
| 26.7 | 35.4 | 6.7097 | 1.31 | 5.12 | 14.1 | 33.7 | 6.7976 | 1.28 | 5.3 | 13.9 | 32.0 | 6.8562 | 1.25 | 5.49 | 13.8 | ||
| 37.8 | 46.2 | 6.446 | 1.65 | 3.91 | 14.9 | 44.6 | 6.5046 | 1.61 | 4.03 | 14.8 | 42.9 | 6.5339 | 1.57 | 4.16 | 14.6 | ||
| 48.9 | 56.9 | 6.153 | 1.98 | 3.11 | 15.7 | 55.3 | 6.2116 | 1.94 | 3.2 | 15.6 | 53.8 | 6.2409 | 1.9 | 3.28 | 15.4 | ||
| 0.303 | 15.6 | 24.9 | 7.2078 | 0.98 | 7.34 | 14.7 | 23.1 | 7.2664 | 0.95 | 7.66 | 14.6 | 21.3 | 7.3543 | 0.92 | 7.99 | 14.4 | |
| 26.7 | 35.7 | 6.8855 | 1.31 | 5.24 | 15.3 | 33.9 | 6.9441 | 1.28 | 5.43 | 15.2 | 32.2 | 7.0027 | 1.25 | 5.62 | 15.2 | ||
| 37.8 | 46.3 | 6.5925 | 1.65 | 3.99 | 16.0 | 44.7 | 6.6218 | 1.61 | 4.11 | 15.9 | 43.0 | 6.6804 | 1.57 | 4.24 | 15.8 | ||
| 48.9 | 57.1 | 6.2702 | 1.98 | 3.17 | 16.7 | 55.4 | 6.2995 | 1.94 | 3.25 | 16.6 | 53.8 | 6.3288 | 1.9 | 3.33 | 16.5 | ||
| 0.3785 | 15.6 | 25.2 | 7.3836 | 0.98 | 7.53 | 16.1 | 23.3 | 7.4715 | 0.95 | 7.88 | 16.0 | 21.4 | 7.5594 | 0.92 | 8.22 | 15.9 | |
| 26.7 | 35.8 | 7.0613 | 1.31 | 5.37 | 16.6 | 34.1 | 7.1199 | 1.28 | 5.56 | 16.6 | 32.3 | 7.1785 | 1.25 | 5.76 | 16.5 | ||
| 37.8 | 46.6 | 6.7097 | 1.65 | 4.08 | 17.2 | 44.8 | 6.7683 | 1.61 | 4.2 | 17.1 | 43.1 | 6.7976 | 1.57 | 4.32 | 17.0 | ||
| 48.9 | 57.2 | 6.3874 | 1.98 | 3.23 | 17.7 | 55.6 | 6.4167 | 1.94 | 3.3 | 17.6 | 53.9 | 6.4167 | 1.9 | 3.38 | 17.6 | ||
| 32.2 | 0.2271 | 15.6 | 26.2 | 8.204 | 0.98 | 8.37 | 22.8 | 26.3 | 8.2626 | 0.95 | 8.69 | 22.7 | 26.4 | 8.2919 | 0.92 | 9.01 | 22.6 |
| 26.7 | 36.8 | 7.7645 | 1.31 | 5.93 | 23.8 | 36.9 | 7.8231 | 1.27 | 6.16 | 23.7 | 36.9 | 7.911 | 1.24 | 6.39 | 23.6 | ||
References
- NRCan. Water Heaters. Available online: https://www.nrcan.gc.ca/energy-efficiency/energy-efficiency-products/product-information/water-heaters/13735 (accessed on 21 November 2020).
- Jia, Y.; Alva, G.; Fang, G. Development and applications of photovoltaic–thermal systems: A review. Renew. Sustain. Energy Rev. 2019, 102, 249–265. [Google Scholar] [CrossRef]
- Hailu, G.; Fung, A.S. Optimum Tilt Angle and Orientation of Photovoltaic Thermal System for Application in Greater Toronto Area, Canada. Sustainability 2019, 11, 6443. [Google Scholar] [CrossRef] [Green Version]
- Buker, M.S.; Riffat, S.B. Solar assisted heat pump systems for low temperature water heating applications: A systematic review. Renew. Sustain. Energy Rev. 2016, 55, 399–413. [Google Scholar] [CrossRef]
- Wang, Z.; Guo, P.; Zhang, H.; Yang, W.; Mei, S. Comprehensive review on the development of SAHP for domestic hot water. Renew. Sustain. Energy Rev. 2017, 72, 871–881. [Google Scholar] [CrossRef]
- Mohanraj, M.; Belyayev, Y.; Jayaraj, S.; Kaltayev, A. Research and developments on solar assisted compression heat pump. Renew. Sustain. Energy Rev. 2018, 83, 124–155. [Google Scholar] [CrossRef]
- Moreno-Rodríguez, A.; González-Gil, A.; Izquierdo, M.; Hernando, N.G. Theoretical model and experimental validation of a direct-expansion solar assisted heat pump for domestic hot water applications. Energy 2012, 45, 704–715. [Google Scholar] [CrossRef]
- Seara, J.F.; Piñeiro, C.; Dopazo, J.A.; Fernandes, F.; Sousa, P.X.B. Experimental analysis of a direct expansion solar assisted heat pump with integral storage tank for domestic water heating under zero solar radiation conditions. Energy Convers. Manag. 2012, 59, 1–8. [Google Scholar] [CrossRef]
- Apostolou, G.; Reinders, A. Overview of Design Issues in Product-Integrated Photovoltaics. Energy Technol. 2014, 2, 229–242. [Google Scholar] [CrossRef]
- Dupré, O.; Vaillon, R.; Green, M.A. Thermal Behavior of Photovoltaic Devices: Physics and Engineering; Springer: Berlin/Heidelberg, Germany, 2017. [Google Scholar]
- Brottier, R.B.L. Thermal performance analysis of 28 PVT solar domestic hot water installations in Western Europe. Renew. Energy 2020, 160, 196–210. [Google Scholar] [CrossRef]
- Herrando, M.; Markides, C.N.; Hellgardt, K. A UK-based assessment of hybrid PV and solar-thermal systems for domestic heating and power: System performance. Appl. Energy 2014, 122, 288–309. [Google Scholar] [CrossRef] [Green Version]
- Kalogirou, S.A.; Tripanagnostopoulos, Y. Hybrid PV/T solar systems for domestic hot water and electricity production. Energy Convers. Manag. 2006, 47, 3368–3382. [Google Scholar] [CrossRef]
- Fu, H.; Pei, G.; Ji, J.; Long, H.; Zhang, T.; Chow, T. Experimental study of a photovoltaic solar-assisted heat-pump/heat-pipe system. Appl. Therm. Eng. 2012, 40, 343–350. [Google Scholar] [CrossRef]
- Chow, T.T. A review on photovoltaic/thermal hybrid solar technology. Appl. Energy 2010, 87, 365–379. [Google Scholar] [CrossRef]
- Banister, C.J.; Wagar, W.R.; Collins, M.R. Solar-assisted Heat Pump Test Apparatus. Energy Procedia 2014, 48, 489–498. [Google Scholar] [CrossRef] [Green Version]
- Teo, H.; Lee, P.; Hawlader, M. An active cooling system for photovoltaic modules. Appl. Energy 2012, 90, 309–315. [Google Scholar] [CrossRef]
- Skoplaki, E.; Palyvos, J. On the temperature dependence of photovoltaic module electrical performance: A review of efficiency/power correlations. Sol. Energy 2009, 83, 614–624. [Google Scholar] [CrossRef]
- Popovici, C.G.; Hudişteanu, S.V.; Mateescu, T.D.; Cherecheş, N.-C. Efficiency Improvement of Photovoltaic Panels by Using Air Cooled Heat Sinks. Energy Procedia 2016, 85, 425–432. [Google Scholar] [CrossRef] [Green Version]
- Evans, D. Simplified method for predicting photovoltaic array output. Sol. Energy 1981, 27, 555–560. [Google Scholar] [CrossRef]
- Goodarzi, M.; Tlili, I.; Tian, Z.; Safaei, M.R. Efficiency assessment of using graphene nanoplatelets-silver/water nanofluids in microchannel heat sinks with different cross-sections for electronics cooling. Int. J. Numer. Methods Heat Fluid Flow 2019, 30, 347–372. [Google Scholar] [CrossRef]
- Pourmehran, O.; Rahimi-Gorji, M.; Hatami, M.; Sahebi, S.; Domairry, G. Numerical optimization of microchannel heat sink (MCHS) performance cooled by KKL based nanofluids in saturated porous medium. J. Taiwan Inst. Chem. Eng. 2015, 55, 49–68. [Google Scholar] [CrossRef]
- Azizi, Z.; Alamdari, A.; Malayeri, M. Convective heat transfer of Cu–water nanofluid in a cylindrical microchannel heat sink. Energy Convers. Manag. 2015, 101, 515–524. [Google Scholar] [CrossRef]
- Vinoth, R.; Kumar, D.S. Channel cross section effect on heat transfer performance of oblique finned microchannel heat sink. Int. Commun. Heat Mass Transf. 2017, 87, 270–276. [Google Scholar] [CrossRef]
- Anoop, K.; Sadr, R. nPIV velocity measurement of nanofluids in the near-wall region of a microchannel. Nanoscale Res. Lett. 2012, 7, 284. [Google Scholar] [CrossRef] [Green Version]
- Arani, A.A.A.; Akbari, O.A.; Safaei, M.R.; Marzban, A.; Alrashed, A.A.; Ahmadi, G.R.; Nguyen, T.K. Heat transfer improvement of water/single-wall carbon nanotubes (SWCNT) nanofluid in a novel design of a truncated double-layered microchannel heat sink. Int. J. Heat Mass Transf. 2017, 113, 780–795. [Google Scholar] [CrossRef]
- Behnampour, A.; Akbari, O.A.; Safaei, M.R.; Ghavami, M.; Marzban, A.; Shabani, G.A.S.; Zarringhalam, M.; Mashayekhi, R. Analysis of heat transfer and nanofluid fluid flow in microchannels with trapezoidal, rectangular and triangular shaped ribs. Phys. E Low-Dimens. Syst. Nanostruct. 2017, 91, 15–31. [Google Scholar] [CrossRef]
- Motamedi, M.; Chung, C.-Y.; Rafeie, M.; Hjerrild, N.; Jiang, F.; Qu, H.; Taylor, R.A. Experimental Testing of Hydrophobic Microchannels, with and without Nanofluids, for Solar PV/T Collectors. Energies 2019, 12, 3036. [Google Scholar] [CrossRef] [Green Version]
- Bagge, H.; Johnsson, D. Measurements of household electricity and domestic hot water use in dwellings and the effect of different monitoring time resolution. Energy 2011, 36, 2943–2951. [Google Scholar] [CrossRef]
- Knight, I.; Kreutzer, N.; Manning, M.; Swinton, M.; Ribberink, H. European and Canadian Non-HVAC Electric and DHW Load Profiles for Use in Simulating the Performance of Residential Cogeneration Systems; IEA Annex 42; International Energy Agency: Cardiff, UK, 2007. [Google Scholar]
- IEA SHC. Available online: https://www.iea-shc.org/ (accessed on 21 November 2020).
- TRNSYS 18, A TRaNsient SYstem Simulation Program; Mathematical Reference; TRNSYS; Volume 4; Solar Energy Laboratory, University of Wisconsin: Wisconsin, MA, USA, 2018.
- Comaklı, K.; Cakir, U.; Kaya, M.; Bakirci, K. The relation of collector and storage tank size in solar heating systems. Energy Convers. Manag. 2012, 63, 112–117. [Google Scholar] [CrossRef]
- Rodríguez-Hidalgo, M.; Rodríguez-Aumente, P.; Lecuona, A.; Legrand, M.; Ventas, R. Domestic hot water consumption vs. solar thermal energy storage: The optimum size of the storage tank. Appl. Energy 2012, 97, 897–906. [Google Scholar] [CrossRef] [Green Version]
- York Heat Pump. Available online: https://www.yorkgeothermal.com/residential/products/geothermal-heat-pumps/yaw-optiheat/ (accessed on 12 August 2020).
- Taco Pump. Taco Comfort Solution. Available online: https://www.tacocomfort.com/product/0034e-0034eplus-ecm-high-efficiency-circulators/ (accessed on 12 August 2020).
- Sunceco. Available online: http://sunceco.com/sep-335-345w/ (accessed on 12 August 2020).
- Kamyar, T.; Fung, A.S.; Kumar, R. Simulation and experimental investigation of two hybrid solar domestic water heaters with drain water heat recovery. Int. J. Energy Res. 2015, 39, 14. [Google Scholar]
Publisher’s Note: MDPI stays neutral with regard to jurisdictional claims in published maps and institutional affiliations. |
© 2021 by the authors. Licensee MDPI, Basel, Switzerland. This article is an open access article distributed under the terms and conditions of the Creative Commons Attribution (CC BY) license (https://creativecommons.org/licenses/by/4.0/).

