Article

Optimization of an Energy Storage System for Electric Bus Fast-Charging Station

1
National Engineering Laboratory for Electric Vehicles, Beijing Institute of Technology, Beijing 100081, China
2
Beijing Huashang Sanyou New Energy Technology Co., Ltd., Beijing 271000, China
3
School of Electrical Engineering, Beijing Jiaotong University, Beijing 100044, China
4
Sunwoda Electronic Co., Ltd., Shenzhen 518108, China
5
School of Electric Power, South China University of Technology, Tianhe District, Guangzhou 510641, China
*
Author to whom correspondence should be addressed.
Energies 2021, 14(14), 4143; https://doi.org/10.3390/en14144143
Submission received: 5 June 2021 / Revised: 28 June 2021 / Accepted: 29 June 2021 / Published: 9 July 2021

Abstract

:
To relieve the peak operating power of the electric grid for an electric bus fast-charging station, this paper proposes to install a stationary energy storage system and introduces an optimization problem for obtaining the optimal sizes of an energy buffer. The charging power demands of the fast-charging station are uncertain due to arrival time of the electric bus and returned state of charge of the onboard energy storage system can be affected by actual traffic conditions, ambient temperature and other factors. The introduced optimization is formulated as a stochastic program, where the power matching equality of the total charging demands of connected electric buses is described as a chance constraint by denoting a satisfaction probability, then a stochastic supremum for the operating power of the electric grid is defined by actual data and the problem finally can be solved by convex programming. A case study for an existing electric bus fast-charging station in Beijing, China was utilized to verify the optimization method. The result shows that the operation capacity cost and electricity cost of the electric grid can be decreased significantly by installing a 325 kWh energy storage system in the case of a 99% satisfaction probability.

1. Introduction

With the decrease of global fossil energy reserves and the increase of severe environmental pollution, new energy sources have been explored by countries [1]. Urban buses are one of the main demands of energy consumption and thus the electrification of urban buses can greatly alleviate the problem of urban pollution, especially the emissions of CO 2 and NO x [2,3,4]. Electric buses, which use electricity instead of traditional gasoline, have been widely used in cities around the world [5,6,7]. By the end of 2020, the electric bus is the main means of public transport in Beijing, where half of the city buses are electric buses [8].
The electric bus is powered by an onboard energy storage system (OESS). There are several energy storage technologies for the OESS, such as batteries, supercapacitors, fuel cells and even the hybrid between them [9]. Pure battery energy storage systems are generally used for the electric bus due to having high-density energy and low cost. Since the state of charge (SOC) of the battery system gradually decreases when the electric bus is operating, it is necessary to charge the electric bus in time to ensure its normal operation. Normally, the electric bus can be charged in two ways: centralized charging [10] and decentralized charging [11]. For the centralized charging, the electric bus can only be charged at a predetermined charging station (generally set at a terminal station), which means no charge along the bus route. The highlight of centralized charging is the high utilization rate of a charging station since the charging station can serve multiple electric bus routes. However, the charging power superposition can lead to a significant increase in peak operating power and operational cost on the electric grid, when several electric buses arrive and charge at the same time under the centralized charging. In addition, the OESS needs to be configured with high energy performance to ensure that the bus can run for at least one cycle and return to the charging station. On the contrary, the electric bus can be charged several times along the bus route under decentralized charging. Although the OESS can be downsized by this charging mode, installing several charging stations along the bus route can increase the investment cost, and the utilization rate of the charging station is far lower than that of centralized charging. Obviously, optimization for the number of charging stations and the size of OESS is coupled and thus many researchers have discussed a joint problem to obtain a reasonable solution [12,13].
Both centralized charging and decentralized charging are used in electric bus systems. This paper focuses on the optimization problems of centralized charging since it is widely utilized in the existing electric bus routes [12,14]. To improve the operation efficiency of the electric bus routes, fast charging is generally adopted for the terminal charging station, in which the output power of a single charging gun is up to 200 kW [15]. For this kind of fast-charging station, the peak operating power and the operational cost of the electric grid are directly determined by the arrival time of vehicles and the number of vehicles charging at the same time [16,17]. There are two main solutions to effectively reduce the load fluctuation and operational cost of electric bus fast-charging stations. The first solution is to optimize the charging strategy of the electric bus charging station, where initial charging time, charging power and charging energy of the OESS are taken into account. Based on the time-of-use electricity price, authors in [18] proposed a real-time charging scheduling model in order to reduce both the peak charging power and the operational cost of the electric bus fast-charging station. A convex model of charging optimization for electric bus fast-charging stations was deduced in [19], in which the decision variables are considered as the initial charging time and the charging power. Although the operational cost of the fast-charging station can be effectively reduced by adjusting the initial charging time, charging power and charging energy of the OESS, the penalty is that the charging time increases or the electric bus departures without high SOC.
Another solution to effectively decrease the load fluctuation and operational cost of an electric bus fast-charging station is to install a stationary energy storage system (SESS) [20,21,22]. The SESS can support the electric grid in the charging task when the electricity price is high or when several electric buses are docking at the same time to charge, while the electric grid recharges the SESS when the electricity price is low or no vehicles are charging at the charging station. This way, the peak operating power and the electricity cost of the electric grid can be reduced. The feasibility and economy of installing SESS in electric bus fast-charging stations have been investigated in many studies. A linear programming problem was proposed in [15] to obtain the optimal sizing of charging facilities (transformer, feeder) and SESS for the electric bus fast-charging station. This optimization model is verified by the actual operation data and the results show that the economic benefit can reach 22.85% after utilizing the SESS. Three topologies of installing the SESS to the electric grid of the electric bus fast-charging station are discussed in [23]. The researchers also considered the optimal sizing of the SESS and introduced a linear programming problem. For the city scale electric bus fast-charging station, the economy of installing SESS is analyzed in [24], where both the investment costs of SESS and charging equipment and the operational cost of the electric grid are involved. The conclusion of this study showed that the economic benefit of installing SESS can be 1.8% when the electrification of urban bus routes can reach 30%.
Similar to the fast-charging station for electric vehicles [25,26], the charging demands of an electric bus fast-charging station are uncertain since both the arrival time of vehicles and the returned SOC of OESSs are sensitive to external factors [27,28]. For example, the energy consumption of air conditioning is affected by ambient temperature, and the running time of vehicles is changed by traffic condition. To evaluate the charging demands of the fast-charging station, ref. [29] established an energy consumption model for the electric bus based on actual operation data. Results showed that the related error between the estimated model and the actual data is about 7%. In addition, ref. [29] established a robust scheduling timetable model to ensure that the electric bus can run a circle back to the charging station and prevent the problem of energy shortage on the way. Moreover, ref. [30] considered the uncertainties of the charging demands and proposed a joint problem of optimal siting of a charging station and the configuration of a bus fleet. The stochastic problem involved optimal sizing of SESS for the electric vehicle fast-charging station was investigated in [31], in which a scenario method was utilized to model the fluctuation of wind power and the charging demands of the electric bus. The problem in [31] was evaluated by a total cost of SESS and solved by the general algebraic modeling system. To the best of our knowledge, the problem of optimal sizing and operating strategy of the SESS for the electric bus fast-charging station, which involved the uncertainties of charging demands of vehicles, is not mentioned in existing studies.
To simultaneously guarantee that the OESS can be charged adequately and the electric bus can be departed in time, and the operational cost of the electric grid can be decreased, the effective solution is to install SESS for the fast-charging station. The problem that needs to be solved is how to quantitatively evaluate the effectiveness of installing SESS. To this end, an optimal sizing of SESS for the electric bus fast-charging station is introduced, where the uncertainties (arrival time of buses and returned SOC of OESSs) of charging demands are considered to improve the robustness of sizing solutions. Three contributions are made: (1) A stochastic program is derived by taking the uncertain charging demands into account for obtaining the optimal sizes of SESS. (2) By denoting a stochastic supremum for the operating power of the electric grid, the proposed stochastic problem then can be formulated as a deterministic problem by convex modeling and finally solved by convex programming. (3) The size of SESS and the satisfaction probability of matching charging demands can be quantitatively evaluated without dwell time increasing.
The remaining sections are organized as follows: Section 2 provides the modeling of an electric bus fast-charging station with SESS, including charging topology, uncertain charging demands and an energy buffer. The stochastic program for the SESS is formulated in Section 3 and the convex modeling for the introduced stochastic problem is described in Section 4. A case study on an actual charging station in Beijing, China is shown in Section 5 and the conclusions are presented in Section 6.

2. Modeling of the Electric Bus Fast-Charging Station with ESS

A systematic topology of the electric bus fast-charging station is introduced in this section, where the ESS is installed. Based on the actual measurement of the docked electric buses, uncertainties of the charging power demands are discussed. Further, a linear voltage model for the ESS is proposed in this section to preserver problem convexity.

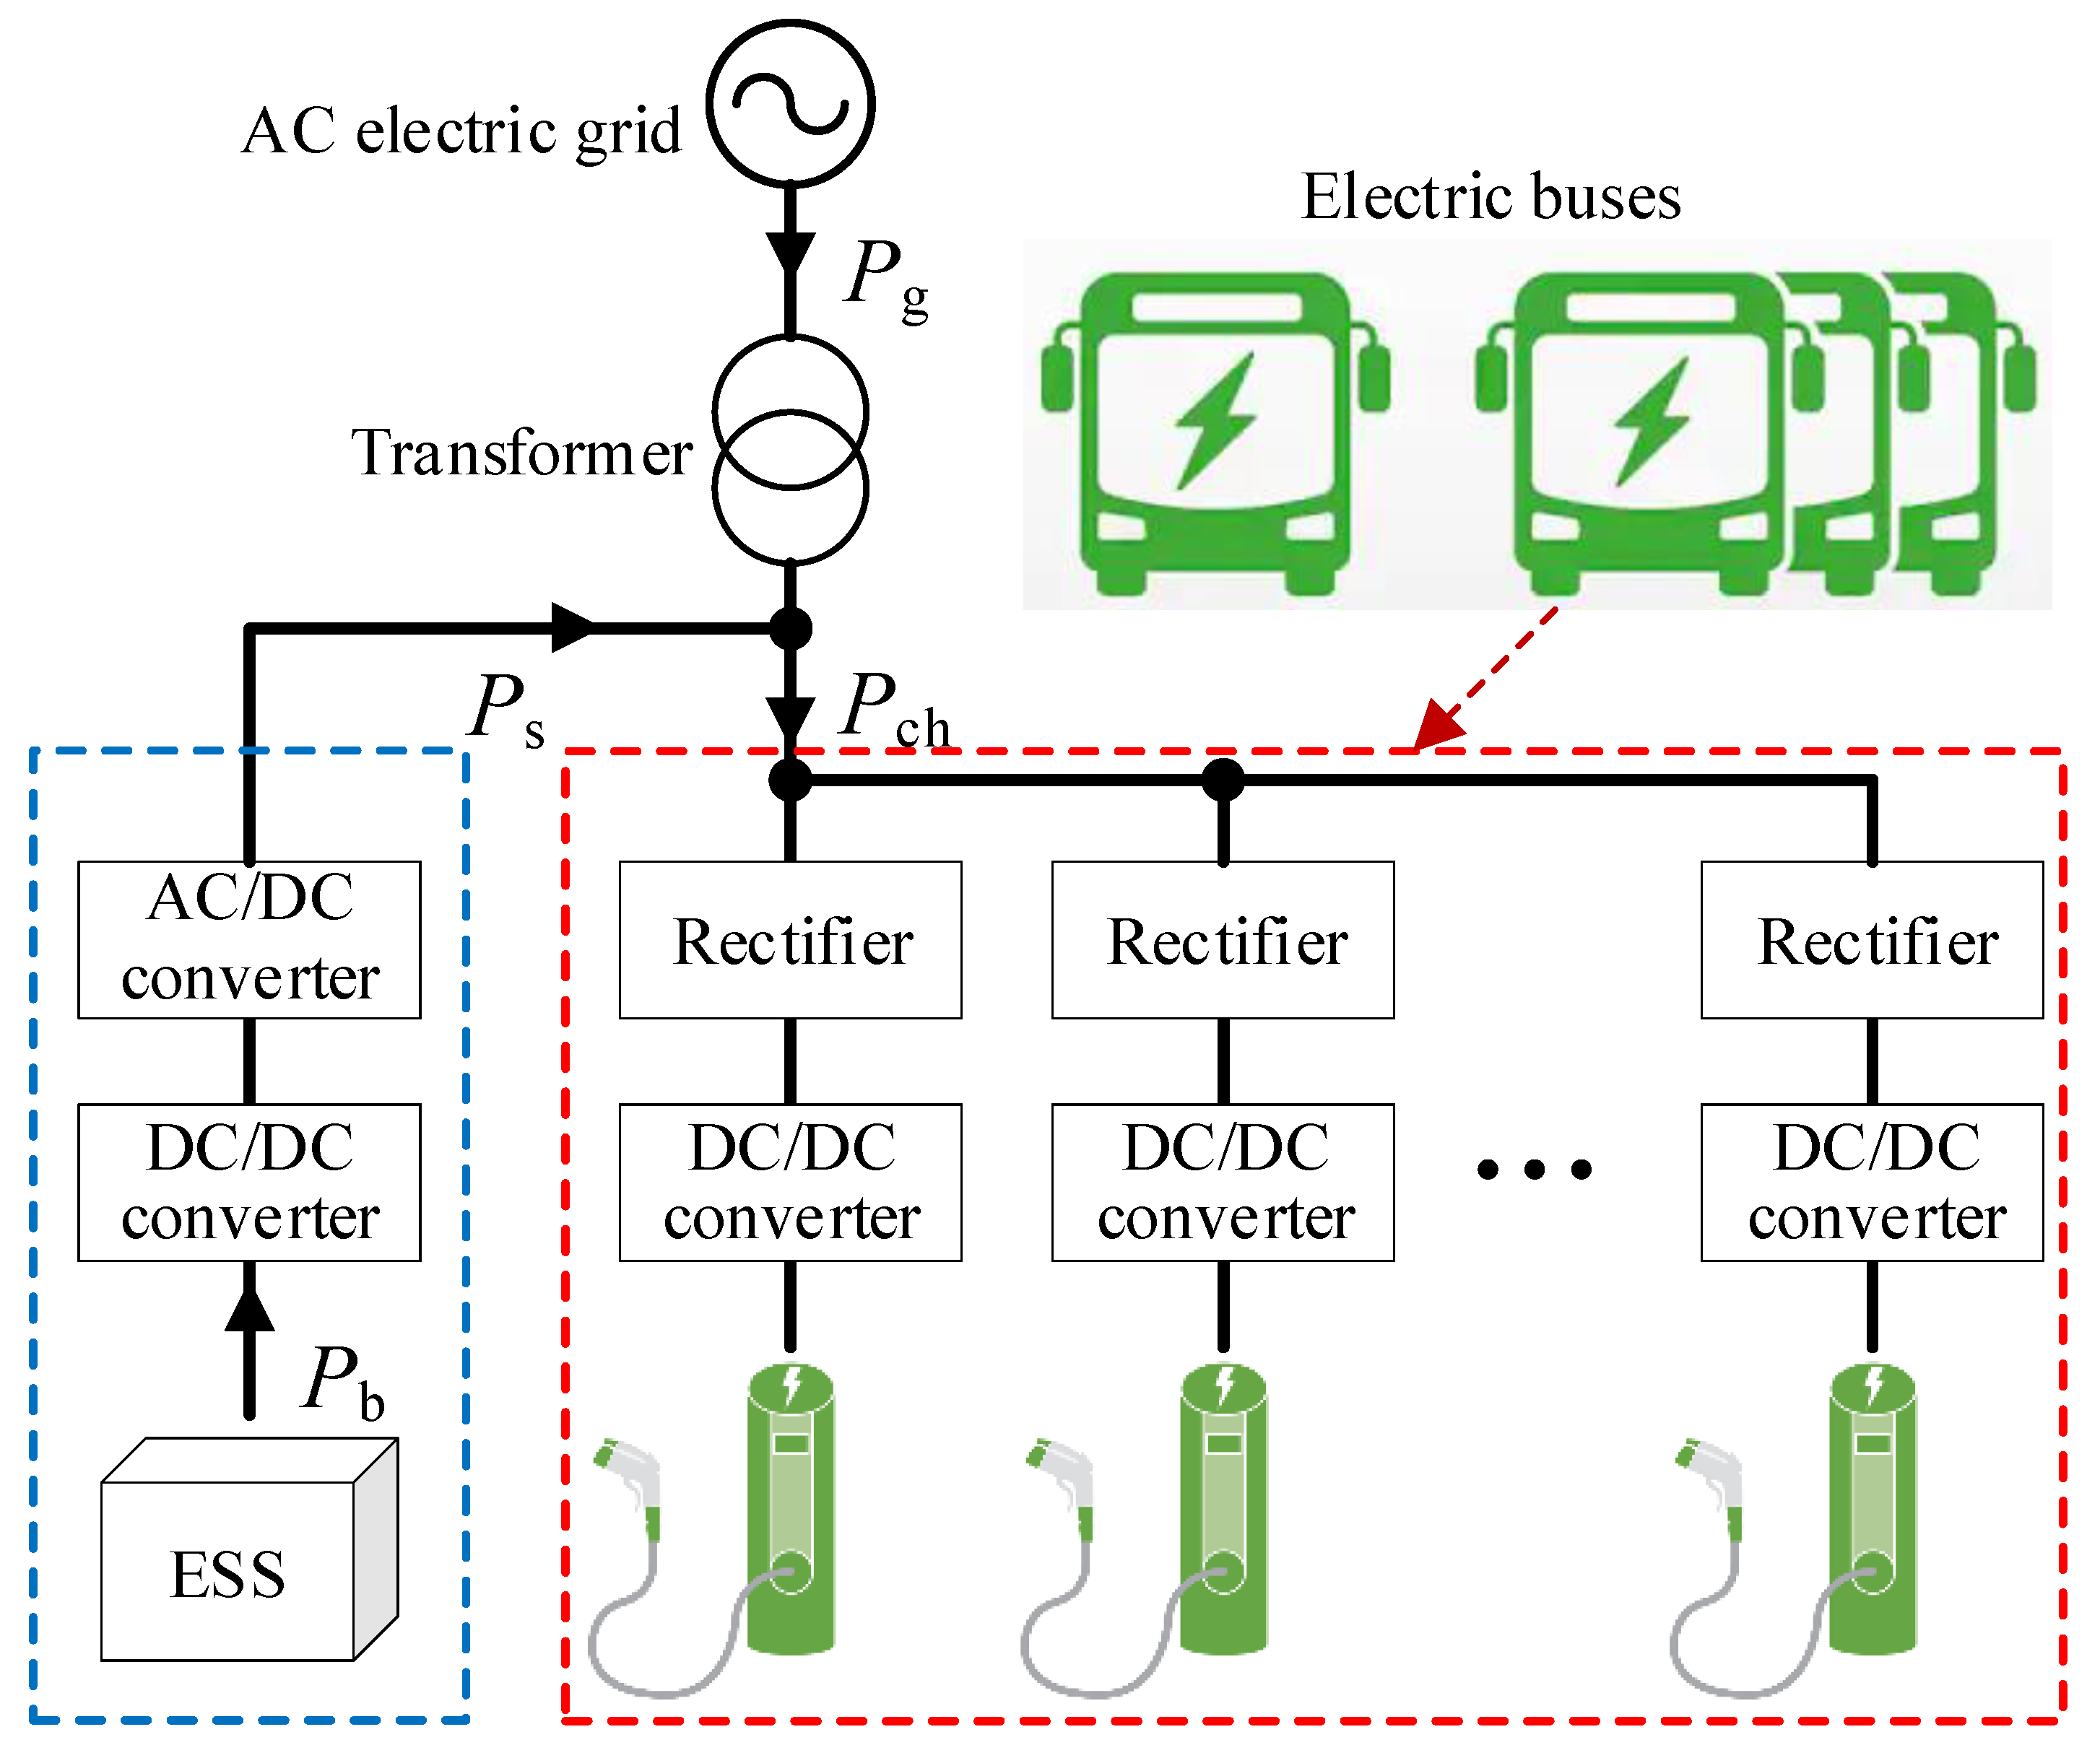
2.1. Topology of the Electric Bus Fast-Charging Station

The systematic topology of the electric bus fast-charging station in Beijing is sketched in Figure 1. The input source of the fast-charging station is an AC electric grid, for example an 10 kV AC voltage source. By utilizing a transformer, the AC voltage (e.g., 10 kV) is stepped-down to a low voltage level (e.g., 0.69 kV), then the stepped-down AC voltage is converted into several DC branches by different charging equipment (i.e., rectifier and DC/DC converter), and finally connecting to the onboard ESSs by DC interface, see the red dotted frame in Figure 1. Note that the DC interface for charging the electric bus can be different types, e.g., overhead DC catenary or stationary charging pile.
To alleviate the maximum operating power of the electric grid when several electric buses charging at the same time, this paper introduces to install an ESS to supporting the grid in charging electric buses, see the blue-dotted frame in Figure 1. Two charging equipment, i.e., AC/DC converter and DC/DC converter, are added for transferring the ESS energy to the electric buses or drawing energy from the electric grid to charge the ESS.

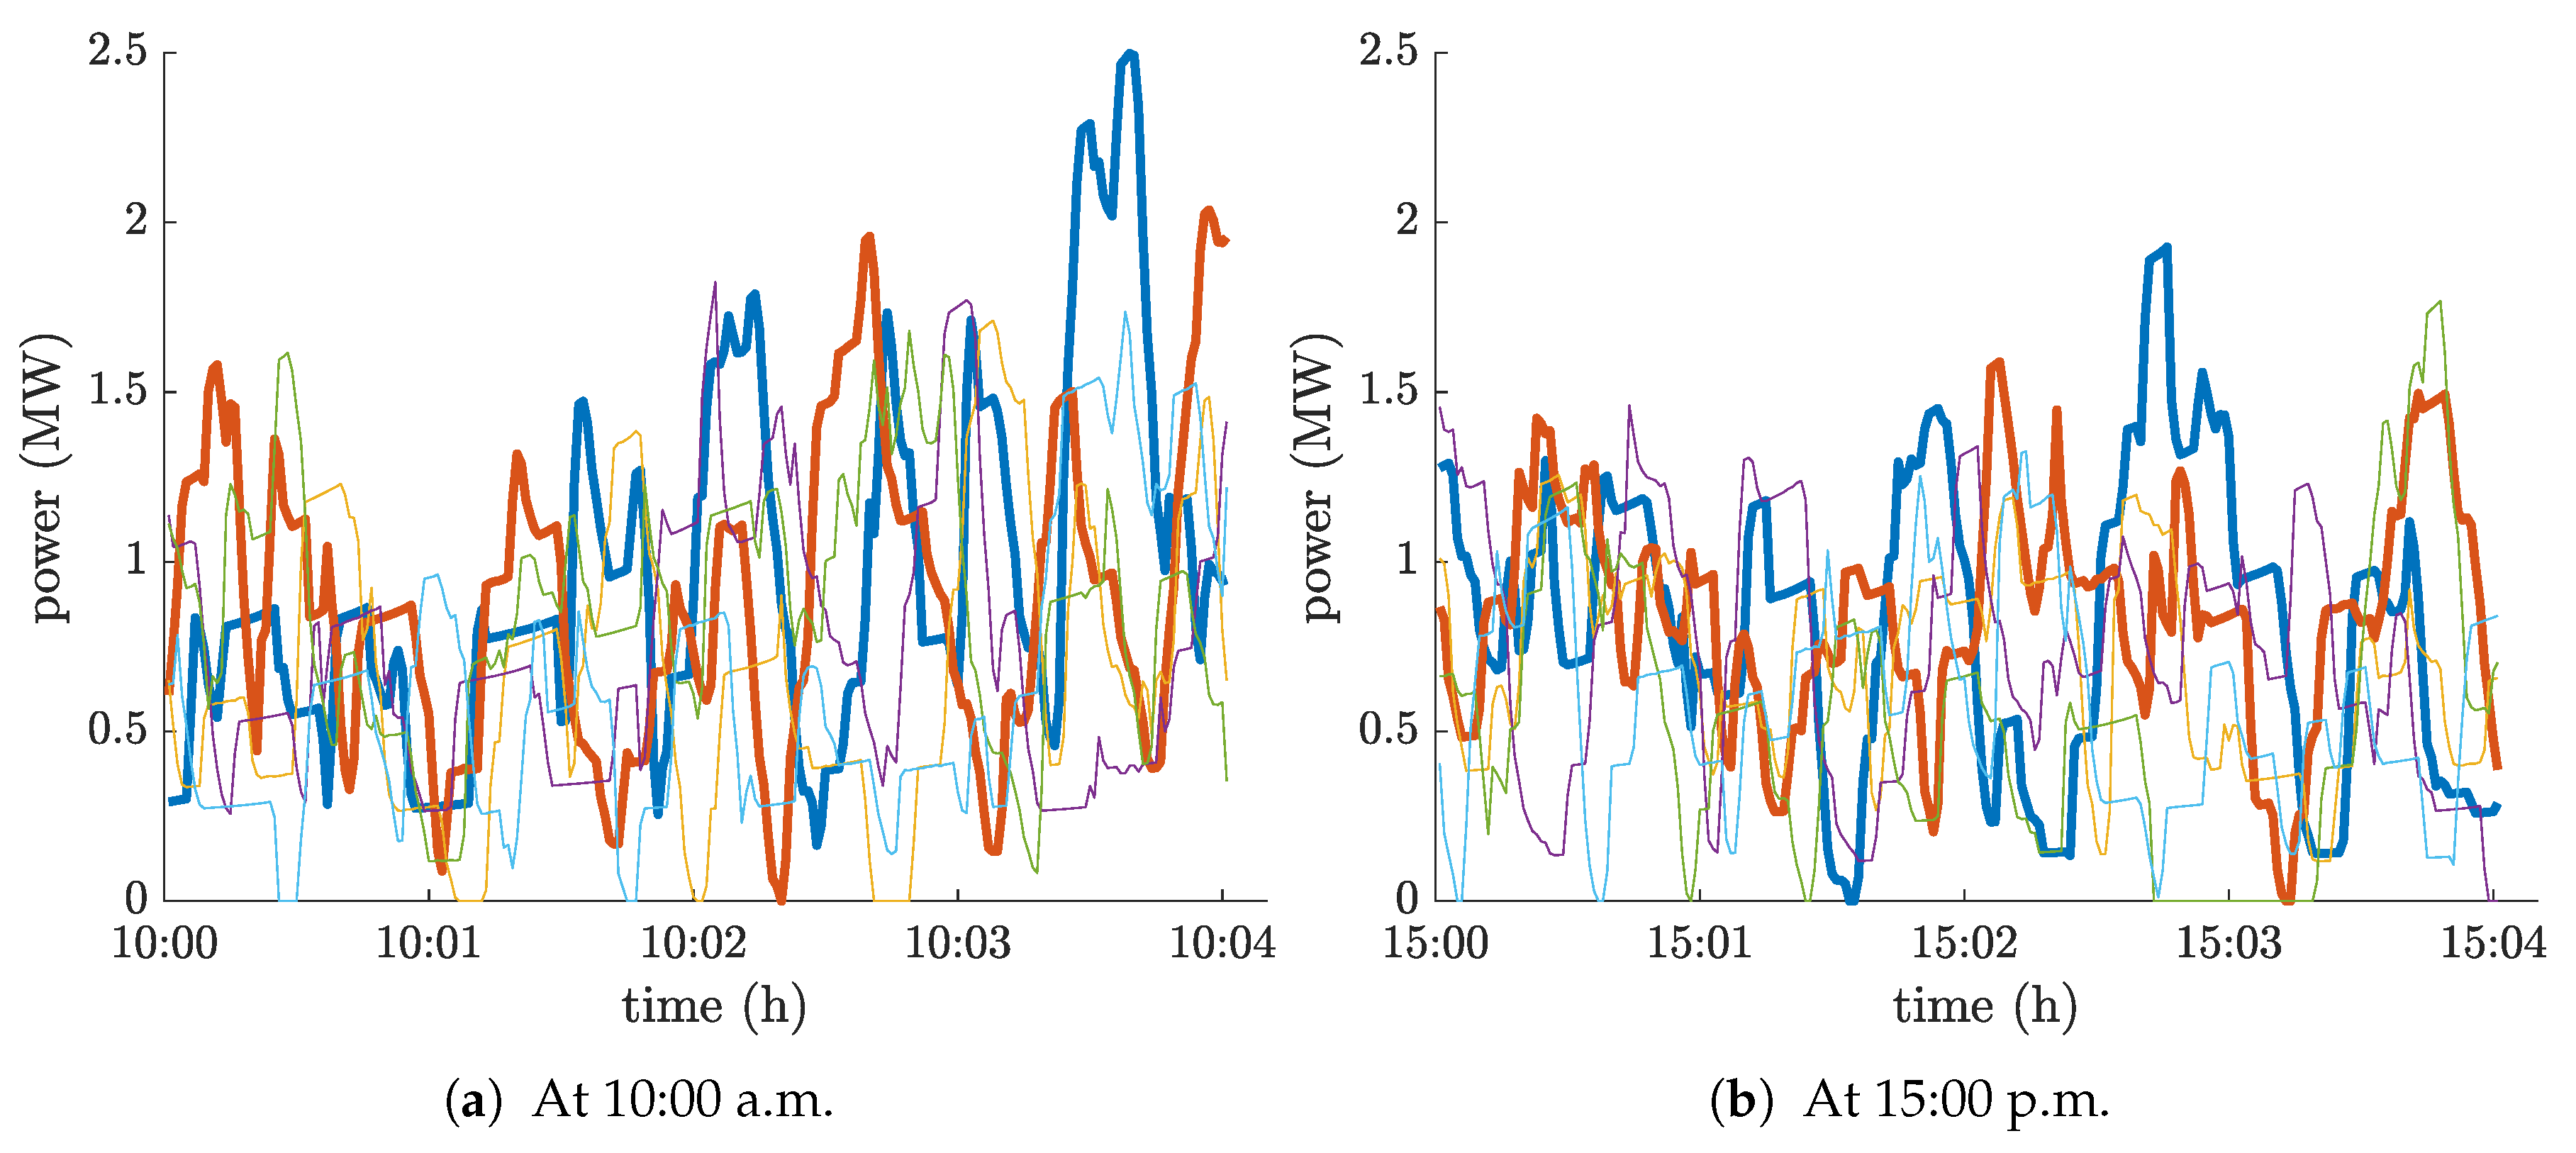
2.2. Charging Demands of the Electric Bus Fast-Charging Station

The electric buses are charged by a fast-charging regime when connecting to the charging interface. In this paper, we focus on decreasing the peak operating power and operational cost of the electric grid, and thus the total charging power demand of all connected electric buses is taken into account. In other words, the power delivering of each charging pile is not considered in this work (this part will be investigated in our future work).
An actual measurement of 30 days (from 14 September 2020 to 13 October 2020) for one electric bus fast-charging station in Beijing is the research object of this paper. The returned state of charge (SOC) of the onboard ESS and the arrival time of the electric bus vary from one vehicle to another, due to the different passenger capacity and time-varying traffic conditions for the electric bus. In this paper, the daily charging power demand of the fast-charging station is considered as a separated scenario and thus 30 scenarios are involved. To intuitively indicate the inconsistency of the charging demands of different scenarios, the measurement of the charging demands of six scenarios at 10:00 a.m. and 15:00 p.m. are respectively shown in Figure 2a,b. Comparing the two thick lines in Figure 2a,b, it can be seen that the charging time and power amplitude of each scenario are quite distinct.
The power balance equation of the fast-charging station for each scenario can be given as
P P g i ( t ) η t + P s i ( t ) P ch i ( t ) α , t { 0 , 1 , 2 , , T } , i { 1 , 2 , , n s }
where t { 0 , 1 , 2 , , T } is time and T (s) is a daily operating duration for the fast-charging station, superscript i { 1 , 2 , , n s } is an index number of the scenarios and n s is a total number of the scenario, η t is an efficiency of the transformer, P ( · ) is a probability function of the power satisfaction of charging demands, α ( 0 , 1 ] is a satisfaction probability and the operating power of the ESS branch, P s , is modeled in the following subsection. Note that the electric grid and the ESS need to meet all the charging power demands for each scenario when the satisfaction probability α is set to 100 % . Otherwise, the satisfaction probability α can be predetermined by the operator and thus the peak power of electric grid can be operated in a probabilistic sense. This way, the operational economy in the case of different satisfaction probabilities can be evaluated.
In addition, maximum operating capacity of the electric grid ( S g [VA]) can be calculated by
S g = max i , t P g i ( t ) λ
where i and t refer to t { 0 , 1 , 2 , , T } and i { 1 , 2 , , n s } , respectively, and λ is a power factor of the charging equipment.

2.3. ESS Modeling

It makes sense to utilize the lithium titanate oxide anode (LTO) battery to enhance an operational economy for the electric bus fast-charging station, owing to outstanding performances of the LTO battery in power density, lifecycle, safety, temperature adaptability, etc. An equivalent circuit model for the battery pack is presented in Figure 3a, where the battery cell is modeled as a structure consisting of a voltage source in series connection with an internal resistance. It is assumed that the battery pack is grouped by several series and parallel connections of the ideal cells, see Figure 3a.
The voltage source of each cell, namely open circuit voltage (OCV), can be linearly described as following equation when the battery SOC is operated within a predetermined range
u b ( t ) = Q b C b soc b ( t ) + u 0 , t
where u b (V), Q b (As), C b (F), soc b (%) and u 0 (V) are the OCV, capacitance in (As), capacitance in (F), SOC and initial voltage of the battery cell, respectively. The linear approximation of the cell OCV is given in Figure 3b. Results indicate that the OCV and SOC of the LTO battery cell show a strong linear relationship when its SOC lies in the range [ 30 % , 80 % ] , see the gray area in Figure 3b.
The dynamic energy of the battery pack can be formulated as following
E b ( t ) = n b Q b 0 soc b ( t ) u b ( τ ) d soc b ( τ ) = n b Q b 0 soc b ( t ) Q b C b soc b ( τ ) + u 0 d soc b ( τ ) = n b Q b Q b 2 C b soc b 2 ( t ) + u 0 soc b ( t ) = n b C b 2 ( u b 2 ( t ) u 0 2 ) .
where E b (Ws) and n b are the dynamic energy and total number of the battery cell, respectively. By denoting the internal power of the battery pack as a time derivative of its dynamic energy, i.e., E b ˙ ( t ) = P b ( t ) , the terminal power of the battery pack ( P bt (W)) can be expressed as
P bt ( t ) = P b ( t ) P b , loss ( t ) , t
where P b , loss (W) is a power loss by the internal resistance which can be determined as
P b , loss ( t ) = P b ( t ) n bs u b ( t ) 2 × n bs R b n bp = P b 2 ( t ) n b 2 E b ( t ) n b C b + u 0 2 R b = R b C b P b 2 ( t ) 2 E b ( t ) + n b C b u 0 2 ,
where R b is the internal resistance of the battery cell, n bs and n bp are series number and parallels number for the battery pack, respectively. Note that n s = n bs n bp . Moreover, both P b and P bt are positive as the battery pack is in discharging, otherwise, P b ( t ) 0 and P bt ( t ) 0 .
By defining the efficiency of the additional charging equipment as η ce , the operating power of the ESS branch is subject to following inequality
(7a) P b ( t ) η ce P b , loss ( t ) η ce + P s ( t ) , t (7b) P b ( t ) / η ce P b , loss ( t ) / η ce + P s ( t ) , t .
It is worth mentioning that constraints (7a) and (7b) should be equality, but here we relax them to inequality in order to preserve the problem convexity. The relax inequality (7a) and (7b) can still guarantee the optimality of the original problem. Similar relaxation was operated and proofed in [16]. The operating power of the ESS branch ( P s ) requires to satisfy both (7a) and (7b) at all time instants. Note that constraint (7a) is more rigorous than (7b) as P b ( t ) > 0 , otherwise, (7b) is more strict as P b ( t ) 0 . Therefore, constraint (7a) and (7b) limit P s under discharging and charging, respectively.

3. Problem Formulation

In this section, the introduced problem which involves optimal sizing and energy management of the ESS for the electric bus fast-charging station is described as a stochastic program. By satisfying the charging demands of the electric buses in a stochastic sense, cost–benefits of installing the ESS with different satisfaction probabilities can be evaluated.

3.1. Objective Function: A Daily Average Cost

To quantitatively analyze the benefit of installing the ESS for the electric bus fast-charging station, the introduced optimization is formulated in an economic term. The objective function, which is calculated as a daily average cost, includes an investment cost of the ESS and an operational cost of the electric grid.
The investment cost of the ESS C o s t lc (RMB/day) is considered as an initial cost of ESS and corresponding charging equipment, as following
C o s t ic ( n b , P b , b ) = CRF ¯ × c b n b E br + c ce Q ce ( P b ) + b c 0
where c b (RMB/kWh) and E br (kWh) are price and rated energy of the ESS, respectively, c ce (RMB/kVA) and Q ce (kVA) are price and rated capacity of the additional charging equipment, respectively, c 0 is a constant price for installing the ESS and b is an integer variable, which is equal to 1 only if the ESS is installed. Note that RMB is the abbreviation of Chinese currency renminbi. Further, a daily average capital recovery factor ( CRF ¯ ) in (8) is given as
CRF ¯ = 1 T a · r ( 1 + r ) T s ( 1 + r ) T s 1
where r (%) is an interest rate and T a (day) is annual operating days of the electric bus fast-charging station. The rated capacity of the additional charging equipment ( Q ce ) is determined by
Q ce ( P b i ) = max t , i P b i ( t )
An electricity cost ( C o s t ec (RMB/day)) is typically taken into account for an operational cost of the electric grid [16], as
C o s t ec ( P g i ) = E ( t 0 t 1 c e 1 P g i ( t ) d t + t 1 t 2 c e 2 P g i ( t ) d t + + t n ep 1 t n ep c e , n ep P g i ( t ) d t ) for i 1 , 2 , , n s
where C o s t ec (RMB/day) and C o s t cc (RMB/day) are the electricity cost and maximum operating capacity cost of the electric grid, respectively, superscript i represents an index number of the scenarios and n s is total number of the scenarios. In (11), the expectation function E ( · ) returns an average electricity cost of all scenarios, c e 1 , c e 1 , , c e , n ep (RMB/Ws) are time-of-use electricity prices at time ranges [ t 0 , t 1 ] , [ t 1 , t 2 ] , , [ t n ep 1 , t n ep ] , respectively.

3.2. Chance-Constrained Programming for ESS Optimization

By denoting the objective function as a sum of the investment cost of ESS C o s t ic and the electricity cost of electric grid C o s t ec , the introduced optimization problem can be summarized as follows
(12a) min C o s t ic ( n b , E b , b ) + C o s t ec ( P g i ) (12b) s . t . P P g i ( t ) η t + P s i ( t ) P ch i ( t ) α , t , i (12c) P b i ( t ) η ce P b , loss i ( t ) η ce + P s i ( t ) , t , i (12d) P b i ( t ) / η ce P b , loss i ( t ) / η ce + P s i ( t ) , t , i (12e) E ˙ b i ( t ) = P b i ( t ) , t , i (12f) E b i ( t ) u c 2 ( soc min ) u 0 2 , u c 2 ( soc max ) u 0 2 n b C b 2 , t , i (12g) P b i ( t ) i c , min , i c , max n b 2 E b i ( t ) C b + n b u 0 2 , t , j (12h) E b i ( 0 ) = E b i ( T ) , i (12i) P g i ( t ) 0 , t , i (12j) n b 0 (12k) b { 1 , 0 } .
where t and i correspond to t { 0 , 1 , , T } and i { 1 , 2 , , n s } , respectively, soc min and soc max are minimum and maximum SOC for the ESS, respectively, i c , min and i c , max are minimum and maximum current for the cell, respectively. The objective function (12a) is formulated in terms of the daily average cost for the electric bus fast-charging station. The decision variables for the introduce ESS optimization (12a)–(12k) are
X = n b , b , E b i ( t ) , P s i ( t ) , P b i ( t ) , P g i ( t ) for i , t
where the cell number n b is a scalar decision variable, the installation flag of ESS b is a binary decision variable, the operating power of ESS branch P s i ( t ) , the ESS power P b i ( t ) and the operating power of electric grid P g i ( t ) are control variables, and the ESS energy E b i ( t ) is state variable.
Constraint (12b) shows that the electric grid and the stationary ESS match the charging demands of the docked electric under the predetermined satisfaction probability α . In order to ensure the safe use of the ESS at least T s years, its soc range and operating current are limited by (12f) and (12g), respectively. Note that constraints for the soc range and operating current are formulated as convex function of energy and power, respectively. Further, the ESS energy at initial and final time instants should be equal, see constraint (12h).
The optimization (12a)–(12k) is a mixed-integer nonlinear program, as well as a chance-constrained program, in which the binary variable b { 0 , 1 } , quadratic function of ESS loss (6) and one probabilistic constraint (12b) are involved.

4. Convex Modeling

The introduced chance-constrained program, i.e., optimization (12a–12k), can be effectively solved by the method modeled in this section. Comparing to other methods proposed in the references, both of the charging power and charging energy demands of the electric buses can be satisfied without an increment of dwell time by our approach.
The actual measurement in Figure 2 indicates that the charging power demand is less than 1500 kW at most of the cases, but it can be up to a peak value (e.g., 2000 kW) at some instants. The cumulative probability distribution of the charging power demand is given in Figure 4, and corresponding cumulative density function can be expressed as following
cdf ( P ch i ) = P P ch p ch i : P ch i P ch α
where p ch i = { P ch i } , t is a data vector for the charging power demand of each scenario, and P ch α is a supremum of the demands, which is determined by the satisfaction probability α . To meet both of the charging power and charging energy demands without an increment of dwell time as the satisfaction probability α < 1 , the operating power of the ESS needs to match a power difference. To this end, the chance constraint (12b) can be reformulated by
(15) P g i ( t ) + P s i ( t ) = P ch i ( t ) , t , i (16) P g i ( t ) P ch α ( α ) , t , i (17) P ch α ( α ) = cdf 1 ( α ) , α ( 0 , 1 ] ,
where cdf 1 ( · ) is an inverse function of (14). The supremum P ch α can be determined with the given satisfaction probability α by the comprehensive distribution (the blue thick line in Figure 4), for example, P ch α ( 100 % ) = 2396   k W , P ch α ( 99 % ) = 1687   k W , P ch α ( 95 % ) = 1390   k W , P ch α ( 90 % ) = 1226   k W , see the red points in Figure 4. By rewriting the power balance as (15) to (17), the maximum operating power of the grid is limited to the supremum of charging demands. Consequently, the introduced chance-constrained program (12a)–(12k) can be solved by firstly transforming the probabilistic constraint (12b) into a deterministic form, i.e., (15) to (17), and the program then can be described and proofed as a disciplined mixed-integer convex program, which can be solved efficiently by a mixed-integer second order cone programming.
The deterministic modeling for the chance-constrained program (12a)–(12k) is formulated as following
(18a) min C o s t ic ( n b , E b , b ) + C o s t ec ( P g i ) (18b) s . t . supremum of the charging power demands ( 17 ) (18c) satisfaction of all charging demands ( 15 ) (18d) saturation of the grid power ( 12i ) and ( 16 ) (18e) limits for ESS ( 12c ) , ( 12d ) , ( 12e ) , ( 12f ) , ( 12g ) , ( 12h ) , ( 12j ) , ( 12k ) .
The optimization (18a)–(18e) is a mixed-integer convex program since the objective function, the inequality constraints and the equality constraints are convex. Proofs for the similar convex modeling can be referred to [16].

5. Case Study

This section presents a case study for verifying the effectiveness of the introduced optimization, where an existing electric bus fast-charging station in Beijing, China, is taken as an example.

5.1. Parameters Selection

The electric bus fast-charging station considered in this paper is the Beiyuanjiayuan station, locating in Chaoyang District, Beijing. This fast-charging station provides charging service for the electric buses on several lines, such as line 621, 628, 653, etc. Nine fast-charging piles are equipped in the Beiyuanjiayuan station. The charging power is up to 250 kW for each charging pile. Note that all the charging piles can be operated at the same time if nine (or more than nine) electric buses connect (arrive), and thus the total charging power demand is quite high (e.g., 2000 kW) at some time instants, see Figure 2.
A Toshiba LTO battery with a capacitance of 20 Ah was selected and its cell specifications is shown in Table 1 [32]. The SOC range and the maximum operating current for the cell are restricted to [ 30 % , 80 % ] and 100 A, respectively. The lifecycle number and the floating life of the LTO battery is 15,000 and 10 year respectively, referring to [33,34]. Further, the pack price and the fixed cost for installation of the LTO battery are 40 RMB/Wh and 40,000 RMB respectively, see Table 1.
The daily electricity price is provided in Table 2, where a time-of-use price of a 10 kV electric grid in Beijing is utilized. The price of the maximum operating capacity of this electric grid ( c c ) is 32 RMB / ( kVA × month ) [35]. The total operating time for the electric bus fast-charging station is set to 24 h with a sample interval of 30 s. For the additional charging equipment, its price is 1 RMB/VA and a constant efficiency is considered, i.e., η t = 0.90 [16]. The interest rate (r) and the annual operating days T a are 5% and 365, respectively.

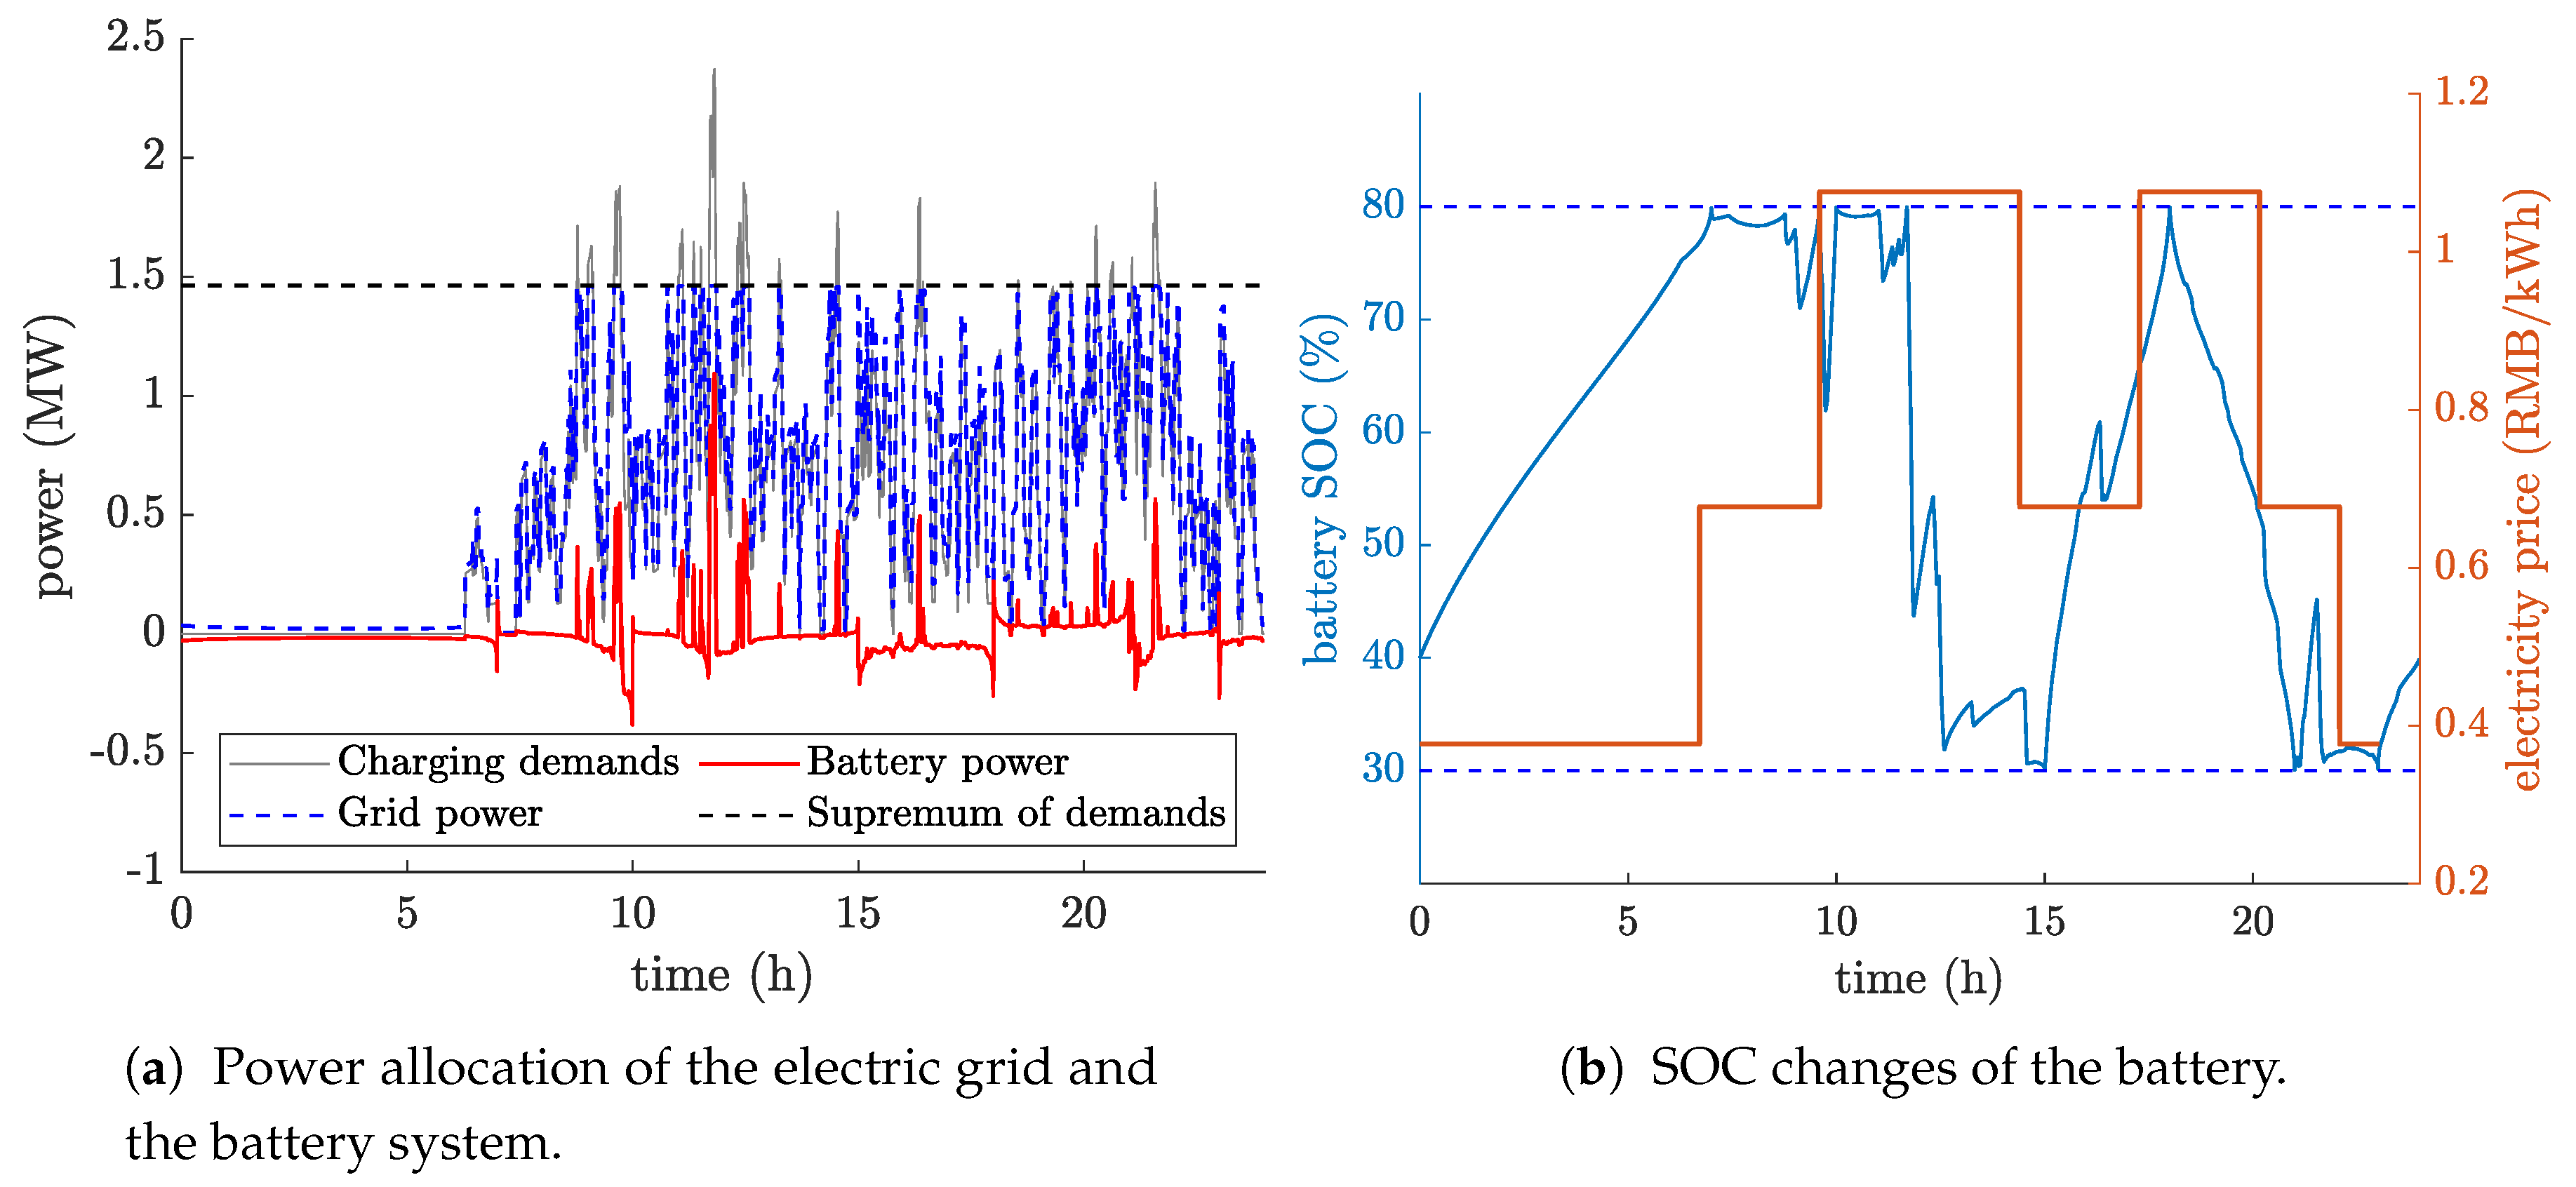
5.2. Optimization Results

The introduced optimization problem is a mixed-integer convex program and thus can be solved by the CVX/Mosek solver in Matlab [36]. Although the numbers of the constraints and the variables are both more than 1 million due to 30 actual scenarios, the optimization can be solved less than 15 min by a computer (Intel i5-2450 M, 2.5 GHz CPU and 8 GB RAM), see the results in Table 3.
The optimization results for different satisfaction probabilities are presented in Table 4, where three probabilities are considered as examples, i.e., α = 99 % , α = 95 % and α = 90 % . The results for α = 100 % in Table 4 correspond to the case that the charging demands of the electric bus fast-charging station are only powered by the electric grid without the ESS installation ( b = 0 ). In this case, the maximum operating capacity of the electric grid ( S g ) is up to 2629 kW.
It is noted that the original charging power demands can be satisfied without the increment of charging time as α < 100 % by the introduced scheme. This is because even though the operating power of the electric grid is limited by the stochastic supremum of the charging demands, the power difference can be met by the ESS, see the definition in (17). As indicated in Table 4, the maximum operating capacity of the electric grid can be decreased to 1540 kVA, 1233 kVA and 1067 kVA as α = 99 % , α = 95 % and α = 90 % , respectively. An optimal sizing of 325 kWh for the LTO battery is obtained when α = 99 % , resulting in a nearly 42% capacity reduction and an almost 0.8% electricity cost saving for the electric grid when comparing to the results for α = 100 % . The supremum decreases with the decreases of the satisfaction probability, but the reduction is not significant when comparing to the reduction from α = 100 % to α = 99 % , see the results for α = 95 % and α = 90 % in Table 4. Further, the power demand for the LTO battery increases with the decrease of the satisfaction probability, due to the operating power of the electric grid is limited by the supremum, which decreases with α as well. This way, the LTO battery needs to match more charging energy demands from the fast-charging station as α decreases, and thus the high capacitance for the ESS is optimized, e.g., sizes of 1214 kWh and 1889 kWh for the LTO battery as α = 95 % and α = 90 % , respectively.
The optimal operating points of the LTO battery under different satisfaction probabilities are shown in Figure 5. The ESS requires to meet the power difference of the charging demand of the fast-charging station as α < 100 % , which is resulting in high charging energy demand (an integration of power difference and time) for the ESS. The results in Figure 5 show that the LTO battery is appropriately sized for the energy requirement, especially under the low satisfaction probabilities (e.g., 90%). The reason is that the energy content of the ESS can be discharged to its limited SOC, but the charging and discharging power of the ESS are both far from the corresponding limits, see the points distribution in Figure 5a–c. Moreover, efficient operation for the LTO battery can be preserved due to the high capacitance ( 325 kWh, 1214 kWh, 1889 kWh), for instance, the efficiency of ESS is higher than 97%, 99% and 99% under the operation at α = 99 % , α = 95 % and α = 90 % respectively, see the contour lines in Figure 5a–c.
Dynamic simulation results of the power allocation between the electric grid and the ESS for one actual scenario under α = 99 % , α = 95 % and α = 90 % is given in Figure 6, Figure 7 and Figure 8, respectively. The operating power of the electric grid is bound by the supremum, and thus the power distribution of the electric grid is gradually compressed as α decreases, see the grey line (supremum) the blue line (grid power) in the left plot in Figure 6, Figure 7 and Figure 8. However, the power distribution of the ESS is expanded as α decreases, since the ESS needs to satisfy the power difference of the charging demands.
The SOC changes of ESS for the cases of α = 99 % , α = 95 % and α = 90 % are shown in the right plot in Figure 6, Figure 7 and Figure 8, respectively. It can be seen that the ESS is basically recharged to a high SOC at the time of low electricity price and discharged (or floated) to support the electric grid at the time of high electricity price. For example, the ESS can be charged to its maximum SOC overnight from 23 h to 7 h with the lowest electricity price, while the ESS continues to discharge to support the grid during the day from 10 h to 15 h with the highest electricity price, as shown in the right plots in Figure 6, Figure 7 and Figure 8. Owing to the optimal solution of the energy management for the ESS under the given time-of-use electricity price, the electricity cost of the grid can be reduced at all cases of α = 99 % , α = 95 % and α = 90 % when comparing to the original scheme α = 100 % , i.e., powering by the electric grid only (see Table 4).

5.3. Discussion

It can be seen in Table 4 that the peaking operating power of the electric grid can be relieved significantly under different satisfaction probabilities. Since the the reduction of the peaking operating power of the electric grid at the satisfaction probability of 99% is about 42%, there is not much space for the reduction of the peaking operating power even though the satisfaction probability decreases. As indicated in Table 4, the decrease in the peaking operating power of the electric grid becomes flat when the satisfaction probability changes from 99% to 90%. Further, the pointwise operating power of the electric grid can also be reduced by installing the stationary LTO battery system at the fast-charging station, especially during daily rush hours, i.e., the time of highest electricity price, see in Figure 6, Figure 7 and Figure 8. Although the total energy consumption from the electric grid is slightly increased by the power loss among the additional LTO battery system, the electricity cost of the electric grid can still be decreased at all the predetermined satisfaction probabilities by following the optimal power allocation.

6. Conclusions

The costs of operation capacity and electricity of electric grid for the electric bus fast-charging station can increase as the charging power demands increase, i.e., several electric buses are charged simultaneously. To this end, this paper introduces a stochastic problem to evaluate the cost-savings of installing a battery system at the electric bus fast-charging station to support the electric grid in charging. The investment costs of the ESS and additional charging equipment and the electricity cost of electric grid are included the formulated optimization. Moreover, the satisfaction of charging demands is described as a stochastic constraint since the uncertainties of the arrival time of the electric buses and the returned SOC of the onboard energy storage systems are considered for improving the problem robustness. To solve the proposed stochastic problem, a probabilistic supremum for the operating power of the electric grid is determined, and the problem can then be written as a deterministic problem by remodeling the satisfaction of charging demands. This way, the problem finally can be described as a convex optimization and solved by convex programming.
To verify the introduced optimization method, an existing electric bus fast-charging station in Beijing, China, is taken into account for the case study. The formulated convex optimization is solved by CVX in Matlab with quite less computational effort. The optimization results show that the peak operating power of the electric grid can be reduced significantly by installing the SESS, where the power reduction of the peak operating power is almost 41%, 53% and 59% when the satisfaction probability of electric grid is 99%, 95% and 90%, respectively. In addition, the operating power of the electric grid at rush time can be decreased since the partial charging demands of the connected electric buses can be delivered by the additional battery system. With the optimal power allocation of the stationary battery system and the electric grid, the electricity cost of the electric grid can be saved, regardless of the satisfaction probability.
The proposed optimization method may be utilized to solve a joint problem of onboard energy storage system and stationary energy supply for the electric buses.

Author Contributions

Conceptualization and investigation, X.D. and W.Z.; methodology and software, S.W.; validation, X.D. and Z.W.; formal analysis, X.D. and S.W.; resources and data curation, X.D. and W.Z.; writing—original draft preparation, X.D.; writing—review and editing, Z.W. and S.W.; supervision, W.Z. All authors have read and agreed to the published version of the manuscript.

Funding

This research received no external funding.

Conflicts of Interest

The authors declare no conflict of interest.

References

  1. García-Trivińo, P.; Torreglosa, J.P.; Fernández-Ramírez, L.M.; Jurado, F. Control and operation of power sources in a medium-voltage direct-current microgrid for an electric vehicle fast charging station with a photovoltaic and a battery energy storage system. Energy 2016, 115, 38–48. [Google Scholar] [CrossRef]
  2. Ayetor, G.K.; Mbonigaba, I.; Sunnu, A.K.; Nyantekyi-Kwakye, B. Impact of replacing ICE bus fleet with electric bus fleet in Africa: A lifetime assessment. Energy 2021, 221, 119852. [Google Scholar] [CrossRef]
  3. Cempírek, V.; Glock, C.H. Development of electromobility in terms of freight transport. LOGI-Sci. J. Transp. Logist. 2019, 10, 23–32. [Google Scholar] [CrossRef] [Green Version]
  4. Tomáš, S.; Martin, K.; Ondrej, S.; Saxsxa, M.; Tomasz, F.; Csaba, C. Impact of the electric mobility implementation on the greenhouse gases production in central european countries. Sustainability 2019, 11, 4948. [Google Scholar]
  5. Nyaki, P.S.; Bwire, H.; Mushule, N.K.; Nyaki, S. Travel time reliability of bus operation in heterogeneous traffic conditions of Dar es Salaam City, Tanzania. LOGI J. Transp. Logist. 2020, 11, 44–55. [Google Scholar] [CrossRef]
  6. Stopka, O.; Stopkova, M.; Lizbetin, J.; Soviar, J. Development trends of electric vehicles in the context of road passenger and freight transport. In Proceedings of the 12th International Science-Technical Conference Automotive Safety, Kielce, Poland, 21–23 October 2020. [Google Scholar]
  7. Małek, A.; Caban, J.; Wojciechowski, L. Charging electric cars as a way to increase the use of energy produced from RES. Open Eng. 2020, 10, 98–104. [Google Scholar] [CrossRef] [Green Version]
  8. Ma, X.; Miao, R.; Wu, X.; Liu, X. Examining influential factors on the energy consumption of electric and diesel buses: A data-driven analysis of large-scale public transit network in Beijing. Energy 2021, 216, 119196. [Google Scholar] [CrossRef]
  9. Weitzel, T.; Glock, C.H. Energy management for stationary electric energy storage systems: A systematic literature review. Eur. J. Oper. Res. 2018, 264, 831–845. [Google Scholar] [CrossRef]
  10. Chen, Z.; Yin, Y.; Song, Z. A cost-competitiveness analysis of charging infrastructure for electric bus operations. Transp. Res. Part C 2018, 93, 351–366. [Google Scholar] [CrossRef]
  11. Lymperopoulos, I.; Qureshi, F.A.; Bitlislioglu, A.; Poland, J.; Zanarini, A.; Mercangoez, M.; Jones, C. Ancillary services provision utilizing a network of fast-charging stations for electrical buses. IEEE Trans. Smart Grid 2020, 11, 665–672. [Google Scholar] [CrossRef]
  12. He, Y.; Song, Z.; Liu, Z. Fast-charging station deployment for battery electric bus systems considering electricity demand charges. Sustain. Cities Soc. 2019, 48, 101530. [Google Scholar] [CrossRef] [Green Version]
  13. Teichert, O.; Chang, F.; Ongel, A.; Lienkamp, M. Joint optimization of vehicle battery pack capacity and charging infrastructure for electrified public bus systems. IEEE Trans. Transp. Electrif. 2019, 5, 672–682. [Google Scholar] [CrossRef]
  14. Chen, H.; Hu, Z.; Zhang, H.; Luo, H. Coordinated Charging and Discharging Strategies for Plug-in Electric Bus Fast Charging Station with Energy Storage System. IET Gener. Transm. Distrib. 2018, 12, 2019–2028. [Google Scholar] [CrossRef] [Green Version]
  15. Ding, H.; Hu, Z.; Song, Y. Value of the energy storage system in an electric bus fast charging station. Appl. Energy 2015, 157, 630–639. [Google Scholar] [CrossRef]
  16. Wei, S.; Jiang, J.; Murgovski, N.; Sjöberg, J.; Zhang, W.; Zhang, C.; Hu, X. Optimisation of a catenary-free tramline equipped with stationary energy storage systems. IEEE Trans. Veh. Technol. 2020, 69, 2449–2462. [Google Scholar] [CrossRef]
  17. Uslu, T.; Kaya, O. Location and capacity decisions for electric bus charging stations considering waiting times. Transp. Res. Part D 2021, 90, 102645. [Google Scholar] [CrossRef]
  18. Ro, L.; Je, H. Optimal charging schedule planning and economic analysis for electric bus charging stations. Energies 2017, 10, 483. [Google Scholar]
  19. He, Y.; Liu, Z.; Song, Z. Optimal charging scheduling and management for a fast-charging battery electric bus system. Transp. Res. Part E 2020, 142, 102056. [Google Scholar] [CrossRef]
  20. Chen, L.; Qin, M.; Xia, Y.; Qian, K.; Xu, X. A configuration-control integrated strategy for electric bus charging station with echelon battery system. IEEE Trans. Ind. Appl. 2020, 56, 6019–6028. [Google Scholar] [CrossRef]
  21. Zhang, Y.; He, Y.; Wang, X.; Wang, Y.; Fang, C.; Xue, H.; Fang, C. Modeling of fast charging station equipped with energy storage. Glob. Energy Interconnect. 2018, 1, 145–152. [Google Scholar]
  22. Arif, S.M.; Lie, T.T.; Seet, B.C.; Ahsan, S.M.; Khan, H.A. Plug-in electric bus depot charging with PV and ESS and their impact on LV feeder. Energies 2020, 13, 2139. [Google Scholar] [CrossRef]
  23. Yan, Y.; Wang, H.; Jiang, J.; Zhang, W.; Bao, Y.; Huang, M. Research on configuration methods of battery energy storage system for pure electric bus fast charging station. Energies 2019, 12, 558. [Google Scholar] [CrossRef] [Green Version]
  24. Trocker, F.; Teichert, O.; Gallet, M.; Ongel, A.; Lienkamp, M. City-scale assessment of stationary energy storage supporting end-station fast charging for different bus-fleet electrification levels. J. Energy Storage 2020, 32, 101794. [Google Scholar] [CrossRef]
  25. Aghapour, R.; Sepasian, M.S.; Arasteh, H.; Vahidinasab, V.; Catalão, J.P. Probabilistic planning of electric vehicles charging stations in an integrated electricity-transport system. Electr. Power Syst. Res. 2020, 189, 106698. [Google Scholar] [CrossRef]
  26. Ebrahimi, J.; Abedini, M.; Rezaei, M.M.; Nasri, M. Optimum design of a multi-form energy in the presence of electric vehicle charging station and renewable resources considering uncertainty. Sustain. Energy Grids Netw. 2020, 23, 100375. [Google Scholar] [CrossRef]
  27. Yang, D.; Sarma, N.J.S.; Hyland, M.F.; Jayakrishnan, R. Dynamic modeling and real-time management of a system of EV fast-charging stations. Transp. Res. Part C Emerg. Technol. 2021, 128, 103186. [Google Scholar] [CrossRef]
  28. Wu, X.; Feng, Q.; Bai, C.; Lai, C.S.; Ji, Y.; Lai, L.L. A novel fast-charging stations locational planning model for electric bus transit system. Energy 2021, 224, 120106. [Google Scholar] [CrossRef]
  29. Pamuła, T.; Pamuła, W. Estimation of the energy consumption of battery electric buses for public transport networks using real-world data and deep learning. Energies 2020, 13, 2340. [Google Scholar] [CrossRef]
  30. An, K. Battery electric bus infrastructure planning under demand uncertainty. Transp. Res. Part C 2020, 111, 572–587. [Google Scholar] [CrossRef]
  31. Liu, X.; Feng, T. Energy-storage configuration for EV fast charging stations considering characteristics of charging load and wind-power fluctuation. Renew. Sustain. Energy Rev. 2021, 4, 48–57. [Google Scholar]
  32. Toshiba. Product Specification. Available online: https://www.scib.jp/en/product/cell.htm (accessed on 1 May 2021).
  33. Herrera, V.; Milo, A.; Gaztanaga, H.; Etxeberria-Otadui, I.; Villarreal, I.; Camblong, H. Adaptive energy management strategy and optimal sizing applied on a battery-supercapacitor based tramway. Appl. Energy 2016, 169, 831–845. [Google Scholar] [CrossRef]
  34. Takami, N.; Inagaki, H.; Tatebayashi, Y.; Saruwatari, H.; Honda, K.; Egusa, S. High-power and long-life lithium-ion batteries using lithium titanium oxide anode for automotive and stationary power applications. J. Power Sources 2013, 244, 469–475. [Google Scholar] [CrossRef]
  35. Beijing Municipal Commission of Development and Reform. Electricity Price List of Beijing. 2021. Available online: http://fgw.beijing.gov.cn/bmcx/djcx/jzldj/202003/P020200331428682714728.pdf (accessed on 1 May 2021).
  36. Grant, M.; Boyd, S. CVX: Matlab Software for Disciplined Convex Programming, Version 2.1. 2019. Available online: http://cvxr.com/cvx (accessed on 1 May 2021).
Figure 1. System architecture of the electric bus fast-charging station in Beijing, China, where P g (W) and P s (W) are operating power of the electric grid and the SESS branch, respectively, and P ch (W) is total charging power demand of all connected electric buses.
Energies 14 04143 g001
Figure 2. Charging power demands of one electric bus fast-charging station in Beijing, China, where each line represents the demands of each scenario. Note that the charging power demands of six actual scenarios at 10:00 a.m. (subplot (a)) and 15:00 p.m. (subplot (b)) are illustrated here for an intuitive exhibition. The charging demands corresponding to the two thick lines are used to indicate the differences between different scenarios.
Energies 14 04143 g002
Figure 3. Equivalent circuit and linear approximation for battery model.
Energies 14 04143 g003
Figure 4. Cumulative probability distribution of the charging demands of the fast-charging station, where the grey thin lines and the blue thick line correspond to the individual scenarios and a comprehensive distribution of all scenarios, respectively.
Energies 14 04143 g004
Figure 5. Optimal operating points of the battery system as α = 99 % , α = 95 % and α = 90 % .
Energies 14 04143 g005
Figure 6. Power allocation and SOC changes in the case of α = 99 % .
Energies 14 04143 g006
Figure 7. Power allocation and SOC changes in the case of α = 95 % .
Energies 14 04143 g007
Figure 8. Power allocation and SOC changes in the case of α = 90 % .
Energies 14 04143 g008
Table 1. Specifications of the LTO cell [16].
VariableSymbolValue
Rated voltage u br 2.3 V
Rated capacitance Q b 20 Ah
Rated energy E br 46 Wh
Maximum current i c , max 100 A
Minimum current i c , min −100 A
Internal resistance R b 0.00089   Ω
Maximum SOC soc max 80 %
Minimum SOC soc min 30 %
Pack price c b 40 RMB/Wh
Cost for ESS installation c 0 40,000 RMB
Table 2.  Daily electricity price of a 10 kV electric grid in Beijing [35].
Day Hour [h][10, 15], [18, 21][7, 10], [15, 18], [21, 23][23, 7]
c e ( RMB/kWh) 1.0761 0.6770 0.3766
Table 3. Computational time of CVX/Mosek solver for the introduced optimization problem.
Problem ParameterOptimization with Different α
α = 99 % α = 95 % α = 90 %
Number of constraint1,048,3771,048,3771,048,377
Number of scalar variable1,451,5811,451,5811,451,581
Number of integer variable111
Computational time683 s711 s829 s
Table 4. Optimization results under different satisfaction probabilities.
VariablesWithout ESS
( α = 100 % )
With ESS
α = 99 % α = 95 % α = 90 %
Supremum of demands, P ch α ( kW ) 2498146311711014
Maximum operating capacity of grid, S g ( kVA ) 2629154012331067
Installation flag, b0111
Rated energy of ESS, E b ( kWh ) 032512141889
Rated capacity of charging equipment, Q ce ( kVA ) 0119014981677
Initial cost of ESS, C o s t ic ( RMB/day)0503817,76527,408
Electricity cost of grid, C o s t ec ( RMB/day)10,69810,61710,31110,170
Maximum operating capacity cost, C o s t cc ( RMB/day)2805164313151138
Publisher’s Note: MDPI stays neutral with regard to jurisdictional claims in published maps and institutional affiliations.

