Article

Driving Factors for the Spatiotemporal Heterogeneity in Technical Efficiency of China’s New Energy Industry

1
School of Earth Resources, China University of Geosciences, Wuhan 430074, China
2
Environment and Sustainability Institute, University of Exeter, Penryn TR10 9FE, Cornwall, UK
3
School of Economics and Management, China University of Geosciences, Wuhan 430074, China
4
School of Economics and Management, Dalian University of Technology, Dalian 116024, China
*
Author to whom correspondence should be addressed.
Energies 2021, 14(14), 4151; https://doi.org/10.3390/en14144151
Submission received: 11 June 2021 / Revised: 6 July 2021 / Accepted: 7 July 2021 / Published: 9 July 2021

Abstract

:
The new energy industry (NEI) is key to achieving a clean and low-carbon economy. Improving its technical efficiency, a factor reflecting the ability of an enterprise or industry to produce maximum economic outputs from a given set of inputs and production technologies, is vital for the healthy development of the NEI. Nevertheless, due to the fragmentation of industry data, it is still difficult to accurately measure the technical efficiency of China’s NEI and understand the driving factors behind it. Based on the panel data derived from 17,457 observations on new energy enterprises in 29 Chinese provinces during 1998 and 2013 (latest data available), this paper uses data envelopment analysis (DEA) and geographically and temporally weighted regression (GTWR) for the first time to investigate the spatiotemporal characteristics and driving factors of the technical efficiency of China’s NEI. The results show that the technical efficiency of China’s NEI was relatively low and increased modestly from 0.44 in 1998 to 0.52 in 2013. Exploring the reasons from the perspective of spatiotemporal heterogeneity, we find that enterprise scale and technological progress are the major driving factors for increasing NEI’s technical efficiency. However, the role of economic development in improving efficiency has gradually disappeared. Moreover, the negative effect of state-owned enterprises on efficiency becomes increasingly obvious. The effect of new energy resources is negligible. Our main contribution is the technical efficiency of China’s NEI which is measured at the provincial level and its main driving factors are explored by considering spatiotemporal heterogeneity. Accordingly, we put forward some specific recommendations to improve the technical efficiency of China’s NEI.

1. Introduction

Climate change and global warming are prompting all countries to transition towards a clean and low-carbon development path [1,2,3]. As the largest emitter, China has formally pledged to achieve carbon peak by 2030 and carbon neutrality by 2060 [4,5]. However, China’s primary energy reserve is dominated by coal [6], with less oil and little gas, which makes it extremely difficult and challenging for China to achieve this ambitious goal [7,8]. Consequently, it is imperative and urgent for China to accelerate the development and deployment of low carbon energy technologies.
The new energy industry (NEI) is an industry engaged in the research, development, promotion, application and production of new energy technologies and systems, mainly including nuclear, wind, solar, biomass, geothermal and ocean energy industries [9]. Since the implementation of the Renewable Energy Law of the People’s Republic of China in 2006, the Chinese government has vigorously supported the development of NEI [10,11]. In 2019, China’s cumulative installed solar and wind power capacity (205 and 210 GW, respectively) and new energy power generation (732.3 TWh) both ranked first globally [12].
However, there are hidden problems behind these optimistic data on China’s NEI. On the one hand, the Chinese government has implemented many financial support measures such as feed-in tariffs, tax incentives and direct subsidies to encourage the development of NEI [11,13,14,15]. Unfortunately, the government is under significant subsidy burden and pressure with the rapid expansion of new energy deployment, leading to a subsidy shortage exceeding 140 billion RMB in 2018. Due to the subsidy shortage, many new energy enterprises have shortages of funds, which has led to difficulties in production and operation. On the other hand, the scale of the NEI is still small compared with the large scale of traditional energy [16]. Moreover, the Chinese government requires new energy power generation to reach grid parity as soon as possible [17,18]. However, the cost of new energy power generation is still higher than that of thermal power [19], which results in the lack of competitiveness of new energy power generation in the market. Therefore, facing the dual pressure of subsidy shortage and grid parity, new energy enterprises must make full use of existing production resources to reduce costs and improve their technical efficiency to achieve a win-win situation in economic performance.
Technical efficiency reflects the ability of an enterprise or industry to obtain maximum economic outputs from a given set of inputs and production technology [20,21]. Nevertheless, due to the fragmentation of industry data, it is still difficult to accurately estimate the technical efficiency of China’s NEI, let alone understand the driving factors behind it. This knowledge gap makes it difficult for policy makers to plan and facilitate the development of the NEI based on its technical efficiency and driving factors.
Hitherto, a large number of research reports and seminal publications have been documented on the efficiency of China’s NEI (see Table 1). From the enterprise or industry perspectives, these studies use data envelopment analysis (DEA) or stochastic frontier analysis (SFA) to evaluate the efficiency and the fixed coefficient method to investigate the driving factors. From the enterprise perspective, scholars have studied the technical efficiency, investment efficiency or innovation efficiency of wind energy enterprises [14,22], solar energy enterprises [13,23], and other new energy enterprises [24,25] based on data about listed new energy enterprises. From the industry perspective, research on the efficiency of the NEI mainly focuses on one specific new energy industry or uses data on proxy industries. For instance, Xu et al. [26] evaluated the technical efficiency of the biomass energy industry in 20 Chinese provinces using evidence from the recycling industry. Based on China’s wind power installed capacity data, Liu et al. [27] estimated the efficiency of China’s wind power industry. DEA and SFA are the two most common models used to measure the NEI’s efficiency. SFA is an econometric model, which requires a production function to be set based on strict economic assumptions [28,29,30]. Therefore, the method is rigid and cumbersome to use. DEA is a linear programming method that uses the characteristics of the value itself to construct the production front without constructing a production function, making it more convenient to operate and more popular [31,32,33]. In addition, after measuring the NEI’s efficiency, it is also essential to explore its driving factors. Existing studies mainly use the Tobit model and multiple linear regression to estimate these driving factors, which are not able to determine the spatial and temporal heterogeneous effects on the efficiency. For example, Lin et al. [13] used the DEA model to calculate the innovation efficiency of 44 listed solar photovoltaic enterprises and used the Tobit model to analyze its influencing factors. However, China is a vast country and there are obvious regional differences in the development of NEI. Moreover, the Chinese government has issued different policies at different stages to support the NEI. As a result, China’s NEI not only shows regional differences but also stage differences. Therefore, this paper adopts a geographically and temporally weighted regression (GTWR) model to explore the driving factors for technical efficiency of China’s NEI by considering the spatiotemporal heterogeneity.
In summary, the existing studies on NEI’s efficiency are mainly conducted at an enterprise level, focus on one specific new energy industry and/or use data on proxy industries. However, study on the efficiency of the entire NEI at a macro level using data specific for NEI is still very limited. This knowledge gap hinders effective decision-making by policy makers to support the development of China’s NEI at the national and regional levels.
To fill this knowledge gap in the technical efficiency of China’s NEI at the macro level, this paper uses the DEA and GTWR model for the first time to explore the technical efficiency of China’s NEI and its driving factors from the perspective of spatiotemporal heterogeneity, based on a panel dataset of the NEI in 29 provinces in China from 1998 to 2013. Our main contribution is that we assessed the technical efficiency of China’s NEI at a provincial level and investigated the heterogeneous influence of the driving factors on the efficiency from spatial and temporal perspectives. The findings from our study are expected to enrich the empirical evidence for the technical efficiency of China’s NEI and support policy-making in promoting the sustainable development of China’s NEI at a macro level.
The rest of the paper is organized as follows: Section 2 introduces the methodology, data sources and variables. Section 3 presents the empirical results, discussion and policy implications. Section 4 presents the conclusions.
The abbreviations in this study are provided in Abbreviations.

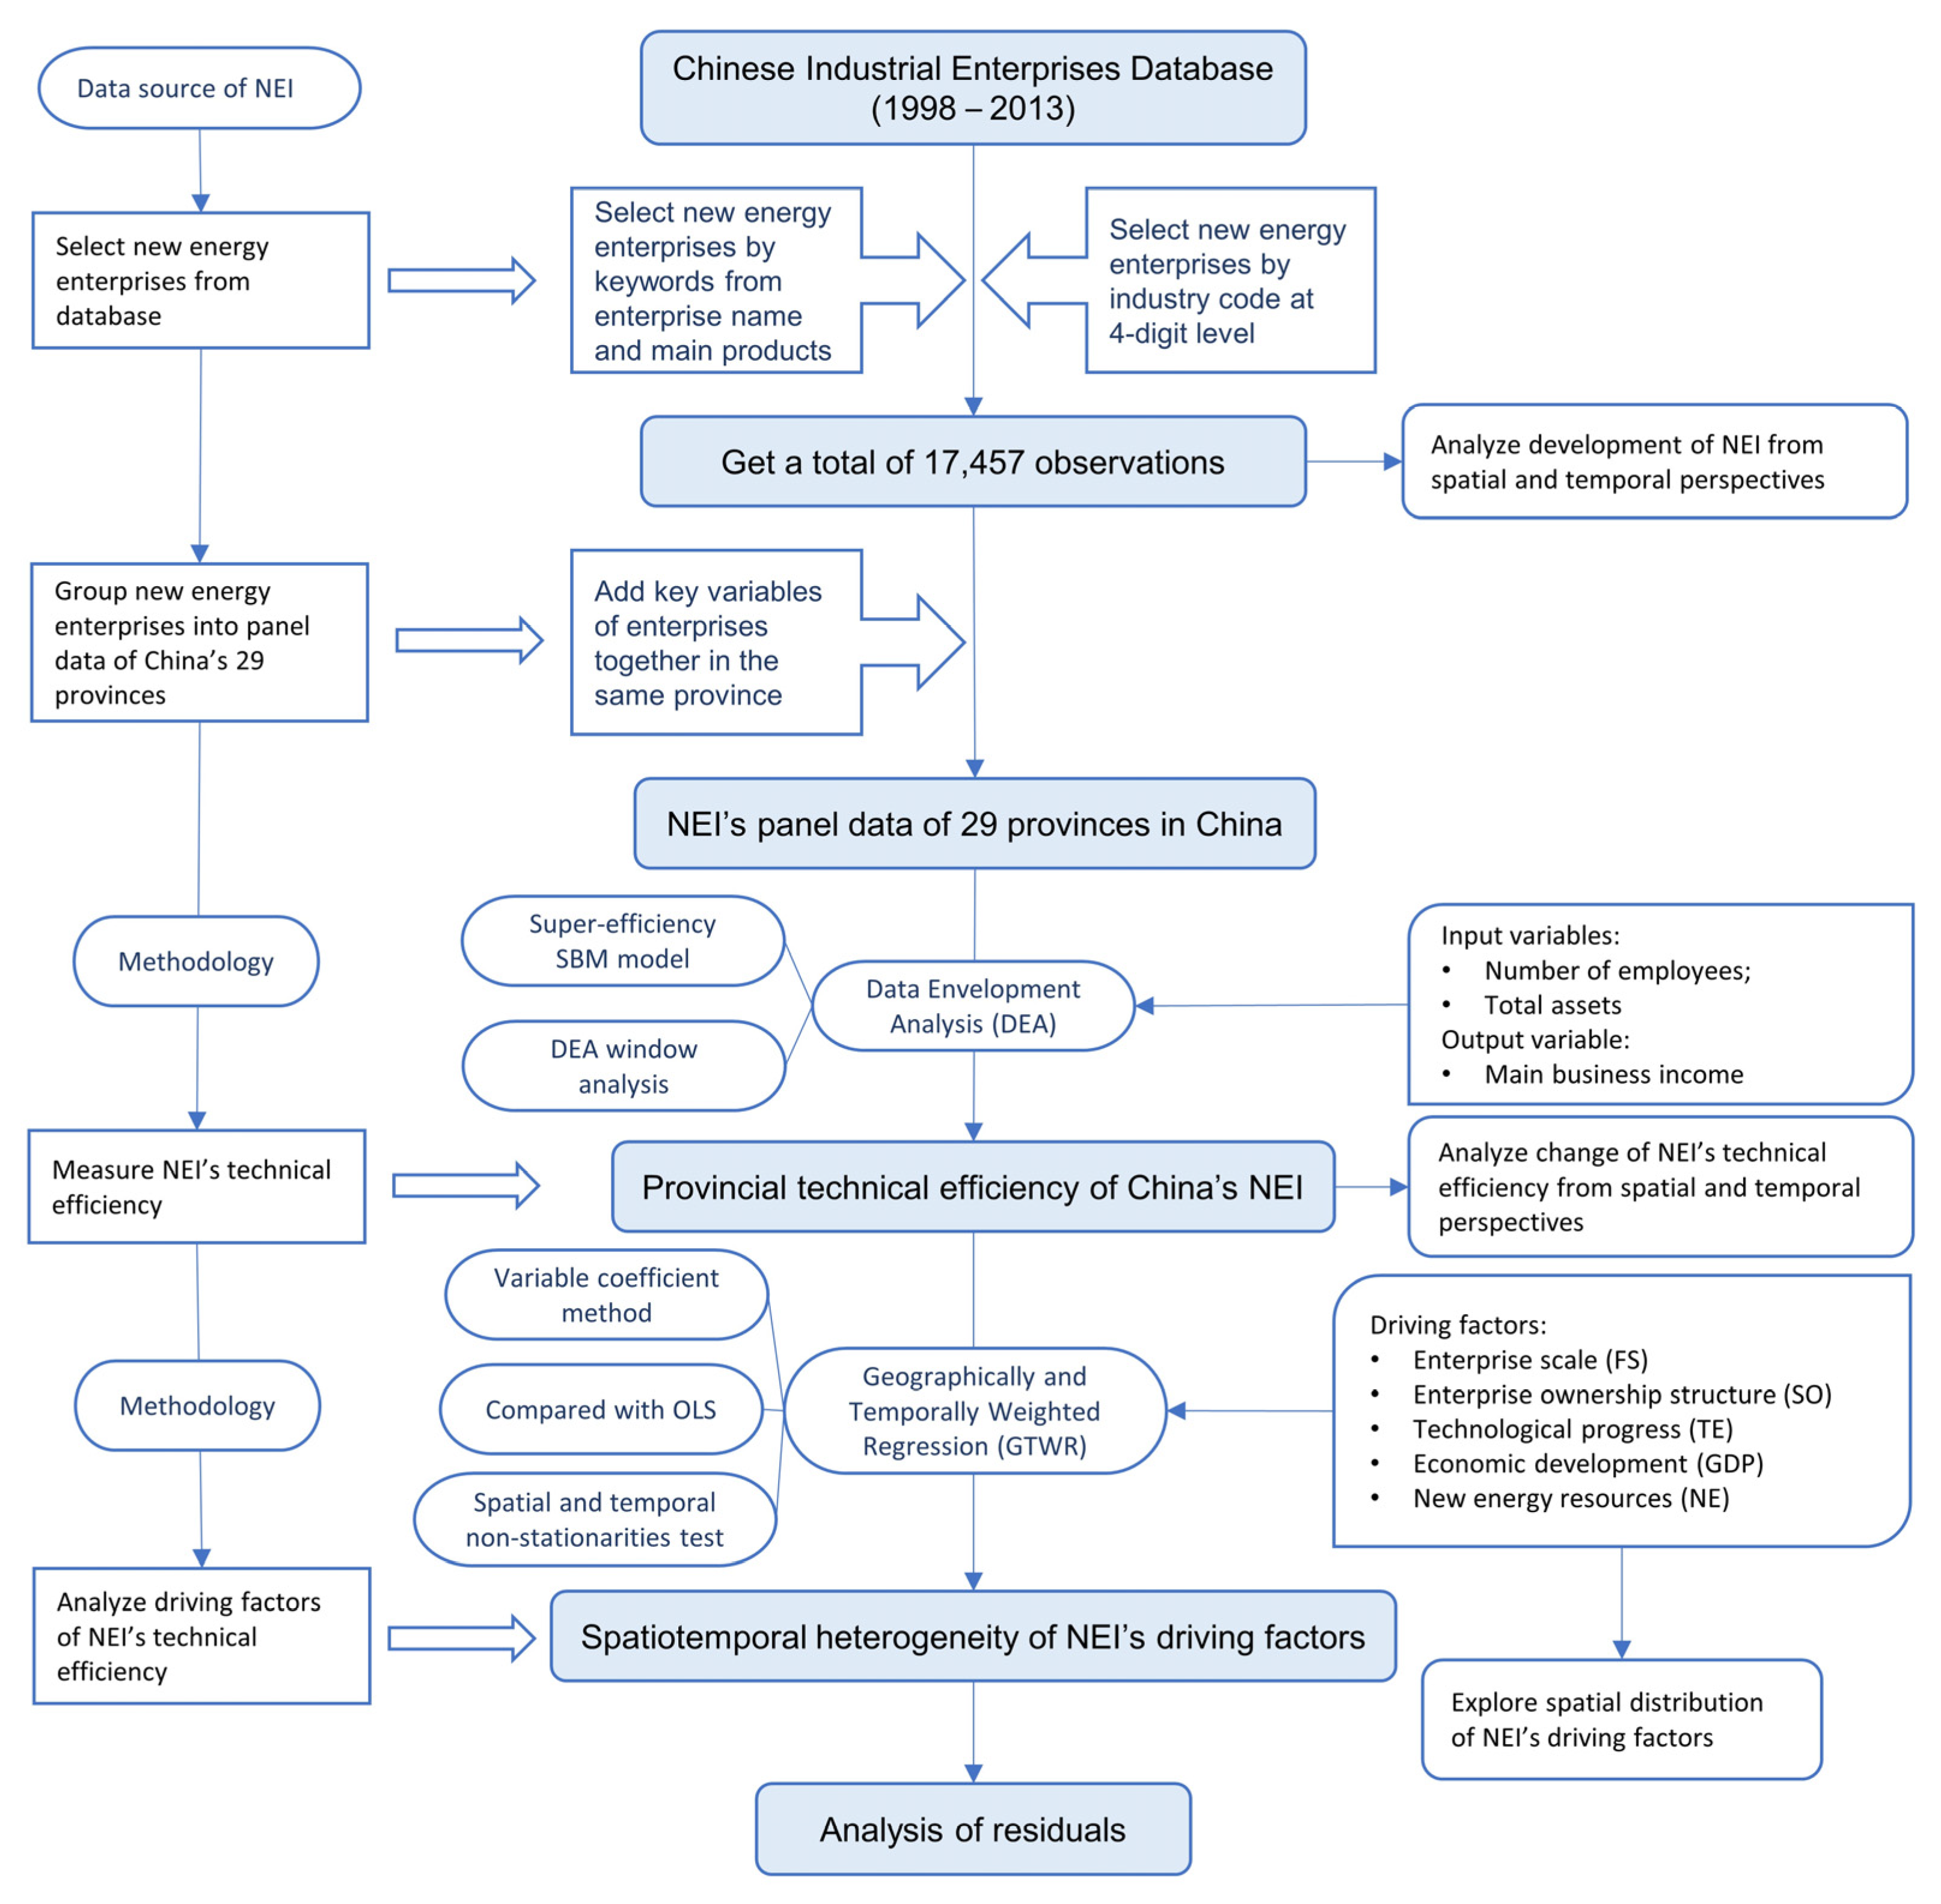
2. Methodology and Data

2.1. Methodology

Figure 1 shows the overall research methodology of this paper. The main steps are as follows: First, we extracted 17,457 observations on new energy enterprises from the Chinese Industrial Enterprises Database [34]. Through the processing of these observations, we obtained panel data of the NEI in 29 Chinese provinces from 1998 to 2013. These panel data are an effective record of the status of the NEI in each province, which is different from the data of listed enterprises or data on proxy industries used in previous studies. Second, we used the super-efficiency slacks-based measure (SBM) model combined with DEA window analysis to measure the technical efficiency of China’s NEI and capture its dynamic change over time. Finally, GTWR method was employed to conduct an in-depth study on the influencing factors for the technical efficiency of China’s NEI. Different from the fixed coefficient method, the GTWR model shows the elasticity of all provinces at each time, which can more thoroughly show the spatiotemporal heterogeneity of the technical efficiency.

2.1.1. Super-Efficiency SBM Model

Data envelopment analysis (DEA) is a non-parametric linear programming methodology for assessing relative efficiency for each member of a set of peer decision-making units (DMUs) with multiple inputs and multiple outputs [35]. The traditional DEA models are the CCR model and the BCC model, which consider the proportion of reduction (increase) of inputs (outputs) and ignore the slacks in variables. Tone (2001) proposed the method of the SBM model, which can deal with input excess and output shortfall [36]. However, the maximum efficiency (value = 1) makes it impossible to further distinguish efficient DMUs in the traditional DEA, including SBM model. Therefore, Tone (2002) [37] proposed a super-efficiency SBM model that can solve the incomparability problem between efficient DMUs, which is also more suitable for calculating the NEI’s technical efficiency.
Assume there are n DMUj    ( j = 1 ,   2 ,   , n ) , each DMU has m inputs and q outputs, then the input and output matrices are X = ( x i j ) m × n , Y = ( y r j ) q × n , respectively.
The production possibility excluding DMUk is set as
{ ( x ,   y ) |   x j = 1 ,   j k n x i j λ j ,   y j = 1 ,   j k n y r j λ j ,   λ j 0 }
where λ j is the non-negative weight.
The input-oriented super-efficiency SBM under constant returns to scale (CRS) assumption can be described as follows:
ρ * = min ρ = 1 + 1 m i = 1 m s i x i k s .   t .   j = 1 , j k n x i j λ j s i   x i k j = 1 , j k n y r j λ j     y r k λ ,   s i   0 i = 1 ,   2 ,   ,   m ;   r = 1 ,   2 ,   ,   q ;   j = 1 ,   2 ,   ,   n   ( j k )
where s i is the input excess; ρ * is the relative efficiency value. If ρ * 1 , the DMU is technical efficient, otherwise it is technical inefficient. This study uses variable returns to scale (VRS) super-efficiency SBM model by adding constraints j = 1 , j k n λ j = 1 . The VRS assumption is adopted because it is consistent with actual production situation. As for the orientation, it seems to be more logical to conserve inputs for given outputs [38], and there is only one good output in this study, so the super-efficiency SBM model used is input-oriented and under VRS assumption.
DEA window analysis is a variation of the traditional DEA that can handle panel data to capture dynamic effects [39]. The data used in this paper are panel data. Hence DEA window analysis is used to be combined with super-efficiency SBM model to measure NEI’s technical efficiency (detailed descriptions in Supplementary Note S1 and Supplementary Table S1).

2.1.2. GTWR Model

To fully understand the driving factors of NEI’s technical efficiency, this paper constructs the panel regression model as follows:
l n E i t = β 0 + β 1 l n F S i t + β 2 l n S O i t + β 3 l n T E i t + β 4 l n P G D P i t + β 5 l n N E i t + u i t
where β 0   is the constant term;   β 1 , β 2 , β 3 , β 4   and β 5   are the estimated coefficients of each explanatory variable; E represents NEI’s technical efficiency calculated by super-efficiency SBM model; FS is enterprise scale (103 RMB); SO denotes enterprise ownership structure (%); TE indicates technological progress (%); PGDP means economic development measured by per capita GDP (RMB); NE stands for new energy resources, which is measured by new energy power generation (108 kWh). Detailed explanations of these variables are in Section 2.2.2. The i and t represent the number of provinces and the year respectively and u is the random error term. To eliminate heteroscedasticity, all variables are converted to natural logarithms. Since there are some zero values in the SO and NE data, we added 0.0001 to zero value to take the natural logarithm.
China is a vast country, and there is a significant difference in economic development, new energy availability, and technology level among provinces. In fact, spatial effect is quite common in socio-economic phenomena. Existing research shows that China’s NEI has significant spatial disparities [40,41,42]. To further reveal the spatiotemporal heterogeneity influence of driving factors on NEI’s technical efficiency, it is appropriate to use a variable-coefficient model to reflect the difference in coefficients across time and space. Thus, a GTWR model is applied in this paper. Compared with traditional ordinary least squares (OLS) method, GTWR can overcome the shortcomings that the coefficients estimated are average effect, which cannot reveal the spatiotemporal heterogeneity of driving factors.
GTWR model is expanded from the traditional GWR model. Geographically weighted regression (GWR) proposed by Fotheringham et al. can reveal spatial heterogeneity by allowing the variation of parameters with different locations [43]. However, the GWR model only considers the variation from spatial dimension and ignores the temporal dimension, so the GTWR model was developed by Huang et al. to capture both spatial and temporal heterogeneity [44]:
Y i = β 0 ( u i ,   v i ,   t i ) + k β k   ( u i ,   v i ,   t i )   X i k + ε i                 i = 1 ,   2 ,   ,   n
where ( u i ,   v i ,   t i ) is the time-space coordinates at observation i . β 0 ( u i ,   v i ,   t i ) represents the estimated intercept value for i t h observation. β k ( u i ,   v i ,   t i ) denotes coefficient estimated of k t h independent variable for i t h observation. The estimation of β k ( u i ,   v i ,   t i ) can be given:
β ^ ( u i , v i , t i ) = [ X T W ( u i , v i , t i ) X ] 1 X T W ( u i , v i , t i ) Y
where W ( u i , v i , t i ) = diag ( α i 1 ,   α i 2 ,   ,   α i n ) and n is the number of observations. The diagonal elements α i j ( 1 j n )   are time-space distance functions, which can be expressed as follows:
α i j = exp { ( d i j S ) 2 h S 2 } × exp { ( d i j T ) 2 h T 2 }
where d i j S = ( u i u j ) 2 + ( v i v j ) 2 , d i j T = ( t i t j ) 2 are spatial distance and temporal distance, respectively. h S and h T stand for spatial and temporal bandwidths, respectively. In this study, Gaussian function is used as a spatial kernel function [45] and Akaike information criterion (AIC) is adopted to select bandwidth [46].

2.2. Variables

2.2.1. Input-Output Variables of Technical Efficiency Measurement

This paper uses super-efficiency SBM model to estimate the technical efficiency of China’s NEI. When using this model, it is essential to select the input and output variables. Two inputs (total assets and number of employees) and one output (main business income) are selected as input-output variables according to the existing literature [22].

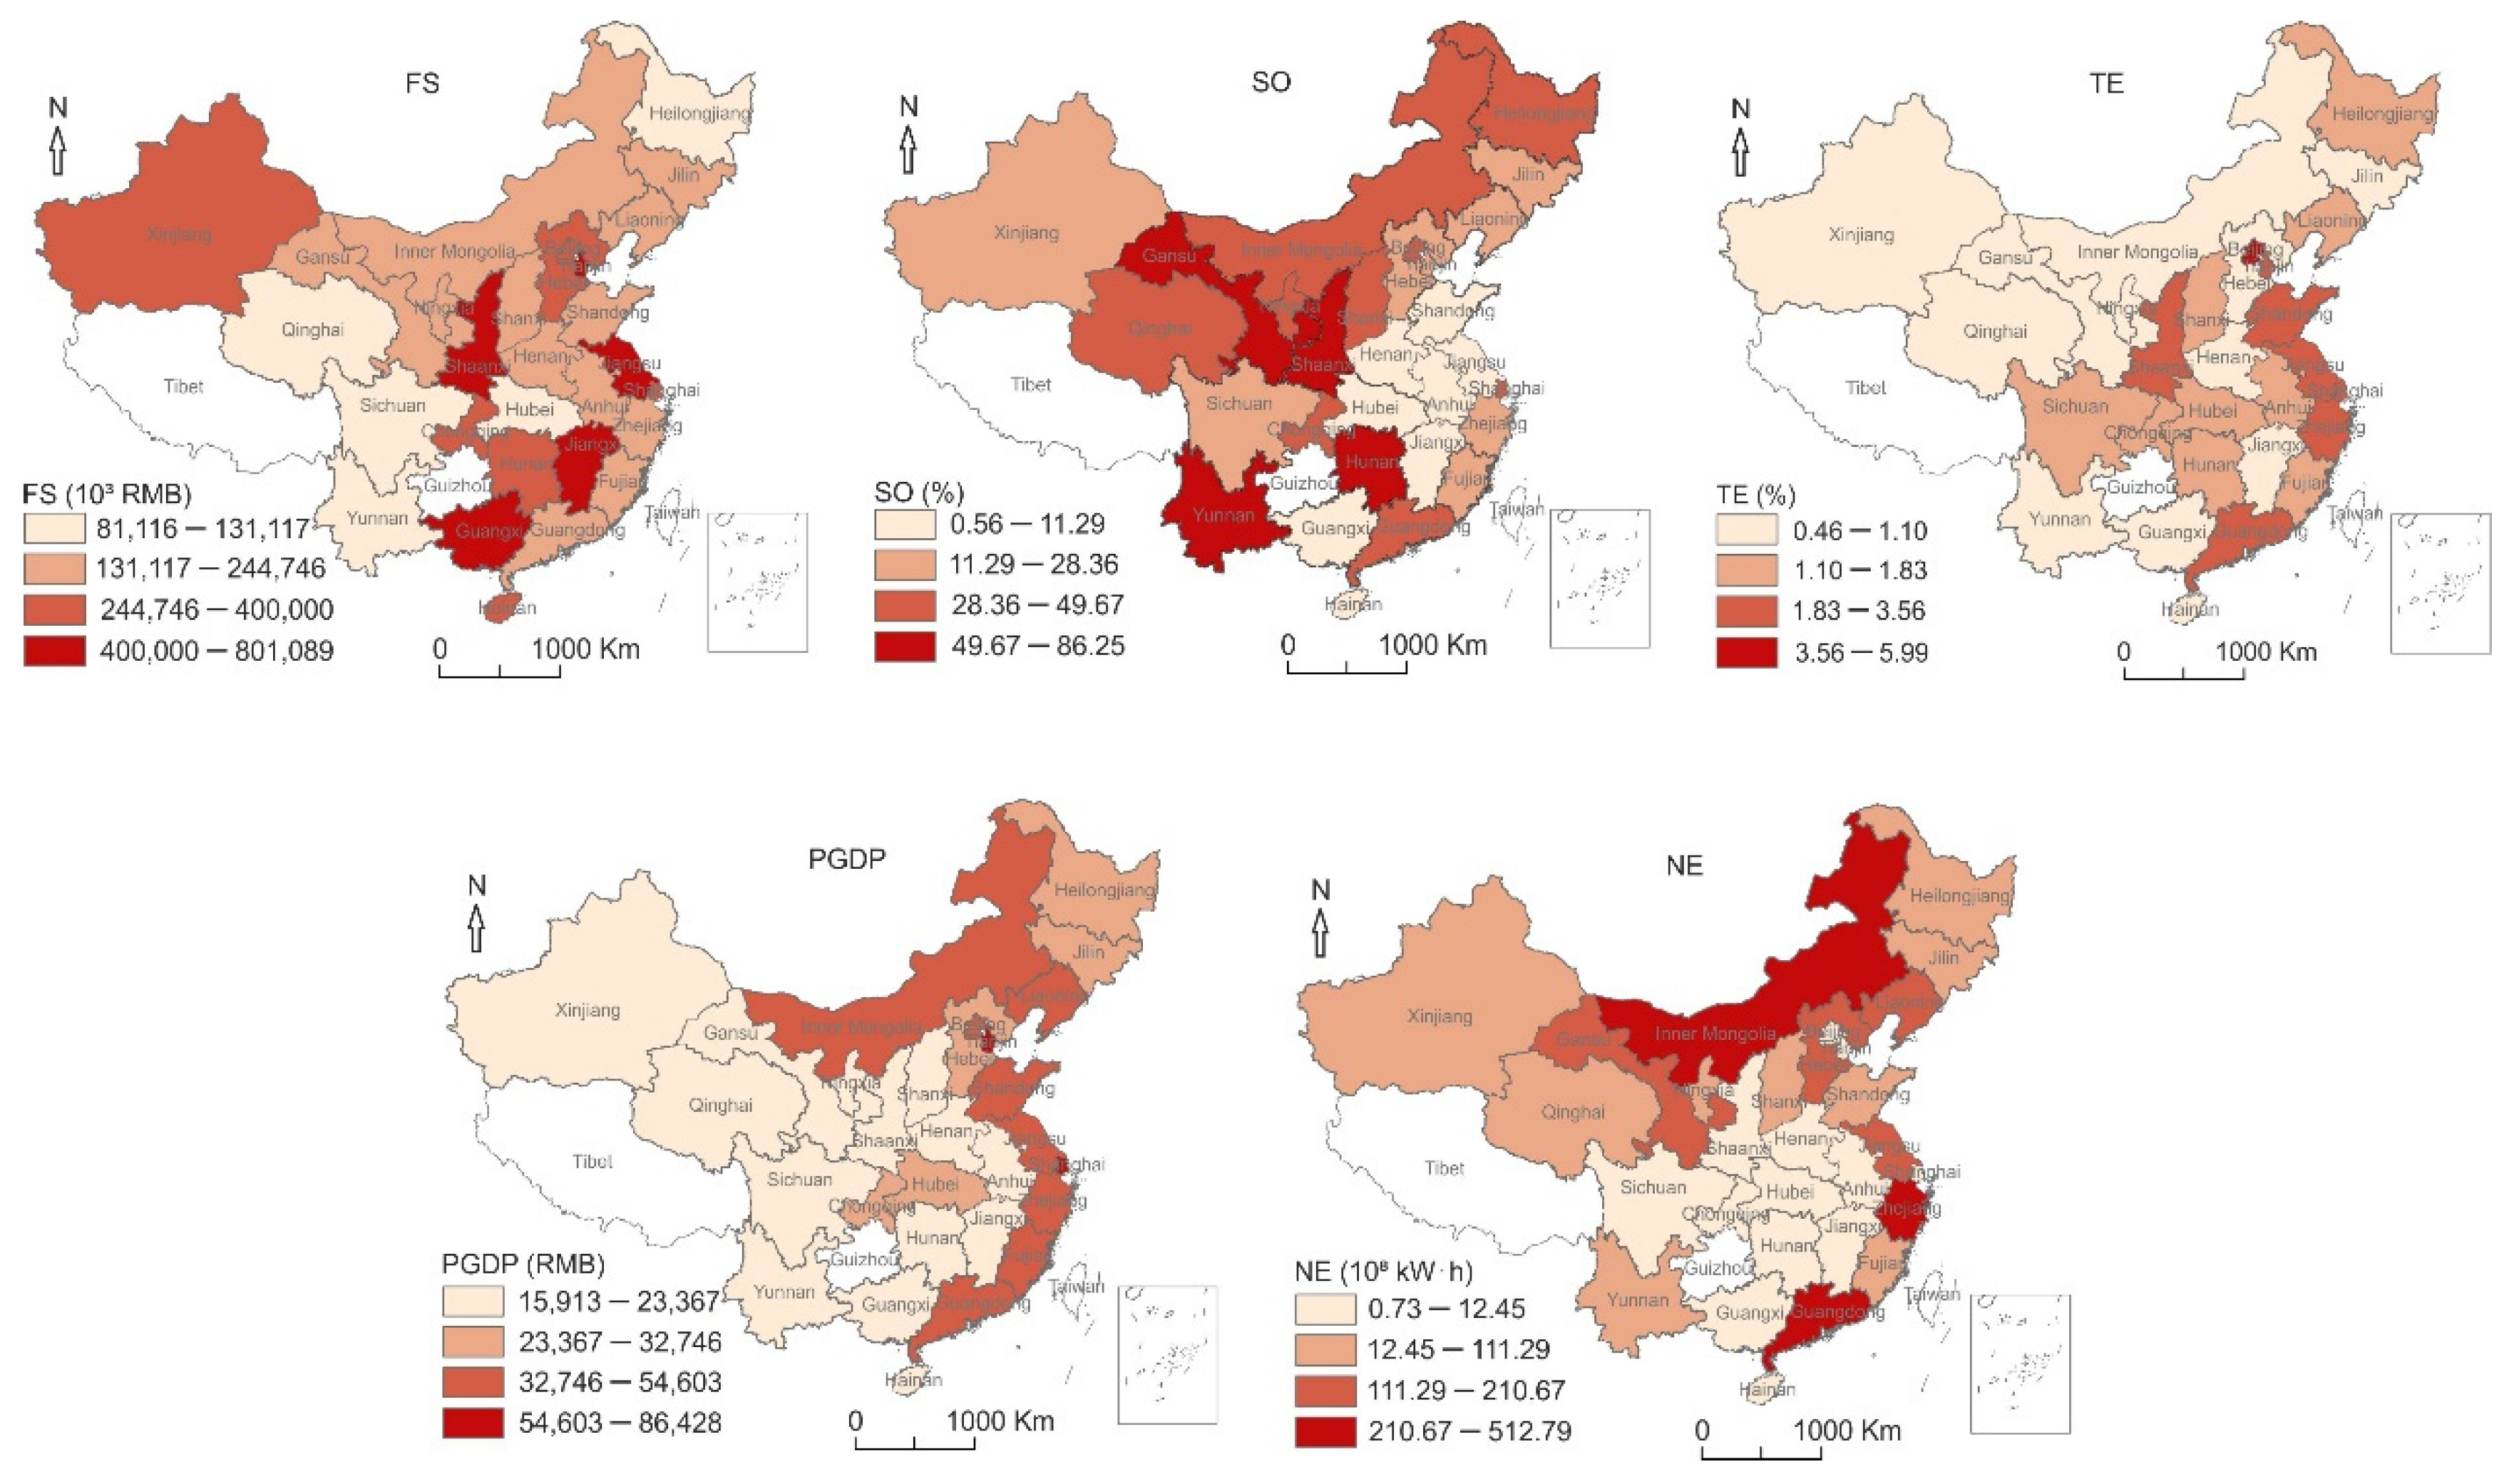
2.2.2. Driving Factors of Technical Efficiency

The development of NEI is affected by many factors, including macroeconomic and policy factors, micro-enterprise factors and regional resource availability factors. Based on the theoretical relationship between relevant economic variables and the development of NEI, five main driving factors are chosen, including enterprise scale, enterprise ownership structure, technological progress, economic development, and new energy resources.
Enterprise scale (FS): Enterprise scale has an important impact on the development of enterprises as well as the industry. Zhao et al. found that the average efficiency of large enterprises in the wind power industry was higher than that of small enterprises [22]. Large enterprises have sufficient resources to buy advanced equipment and carry out research and development activities. Therefore, they can improve the technical efficiency by reducing costs through technological progress. The development of NEI especially requires capital and technological support. Therefore, this study incorporates enterprise scale into the analytical framework. This factor is measured by the average main business income, which is calculated as the ratio of total main business income to the number of enterprises in each province.
Enterprise ownership structure (SO): Previous studies have investigated the relationship between enterprise ownership and technical efficiency among different industries, but the results are mixed. Many hold the view that private ownership outperforms state ownership [47,48,49]. In terms of China’s state-owned enterprises, they are controlled and supported by the Chinese government, resulting in a lack of innovation and competitiveness. Some studies have also shown that private-owned enterprises are more efficient than state-owned ones in China’s manufacturing [48] and wind power industries [22]. The NEI is no exception. Therefore, the influence of enterprise ownership on the technical efficiency of NEI should also be considered. This study uses the proportion of state-owned enterprises in the total main business income to represent the ownership structure in each province.
Technological progress (TE): NEI is a technology-intensive emerging industry, and its development highly relies on advanced technologies [50]. Improved new energy technologies may reduce the production cost of new energy products and increase economic output. It is believed that higher technology level results in higher efficiency of NEI. Technological progress is thus considered in this study to reveal the impact on NEI. Research and development (R&D) expenditure intensity (RDI) has been used in previous studies to measure technological progress [25]. In general, the higher RDI, the more emphasis the region puts on technological innovation and the greater technological progress it can make. Thus, RDI was also selected to indicate the provincial technological progress. However, the data of R&D expenditure in the field of new energy at the provincial level was not available. Lin and Chen [11] showed that the R&D expenditure in new energy sector has the same trend with the total R&D investment. Therefore, the RDI is proxied by the ratio of R&D expenditure to GDP in each province in this study.
Economic development (PGDP): In the early stages, economic growth in China greatly promoted the consumption of fossil energy, which caused serious environmental pollution. To achieve sustainable economic development, the Chinese government significantly expanded the use of clean energy, thus encouraging the development of NEI [51]. Moreover, NEI is a capital-intensive industry, which requires a lot of investment in the early stages. In general, the more developed the region, the more it can promote the development of NEI. Therefore, economic development is an important factor affecting the development of NEI. Economic development is generally measured by two variables, namely GDP and per capita GDP. Per capita GDP can better reflect the real level of economic development in a region or a country [9]. Therefore, this study uses per capita GDP to measure the economic development in each province.
New energy resources (NE): The NEI is mainly derived from the discovery and application of new energy. New energy resources therefore play an important role in the development of NEI. China is rich in new energy resources. Wind and solar power, in particular, are the most popular emerging new energy in China. As of 2019, the cumulative installed solar and wind capacity in China increased to 205 GW and 210 GW, respectively [12]. However, China’s new energy resources are unevenly distributed, with most new energy resources mainly distributed in western regions. In this study, new energy resources are measured by new energy power generation and obtained by total power generation minus thermal and hydropower generation in each province.

2.3. Data Source and Processing

Public data on the NEI is limited as NEI is a strategic emerging and pilot industry in China [9]. The main data used in this study is derived from the Chinese Industrial Enterprises Database released by the National Bureau of Statistics for the period of 1998 to 2013 [34]. The database covers all state-owned enterprises and non-state enterprises with annual sales greater than 5 million RMB (changed to 20 million RMB in 2011) in the following three industries: (1) manufacturing, (2) mining, (3) production and distribution of electricity, gas and water. Therefore, we mainly focused on NEI involved in the above three industries without considering new energy engineering construction and new energy-related tertiary industry. It is estimated that the enterprises covered in the database account for about 90% of the total industrial output [52]. According to the Classification of Strategic Emerging Industries of China (2018), 76% of NEI at the 4-digit level are included in this database. We also believe that the database covers most new energy enterprises. Since the database does not include small non-state enterprises, the calculation of technical efficiency could be biased. Based on previous research, the efficiency of small enterprises is generally low [22], so this study could potentially overestimate the technical efficiency of China’s NEI. Nevertheless, the database would still be appropriate for covering new energy enterprises.
Firstly, we selected those new energy-related enterprises. For each enterprise in the database, there are three industry codes at 2-digit, 3-digit and 4-digit level indicating which industry each enterprise belongs to, and these three codes correspond to the Industrial Classification for National Economic Activities. According to the Classification of Strategic Emerging Industries of China (2018), we kept industries (at 4-digit level) that all belong to the NEI (as shown in Supplementary Table S2A) and selected other new energy enterprises by keywords from enterprise names and main products (as shown in Supplementary Table S2B). As three versions of the Industrial Classification for National Economic Activities were used during the sample period, different industry codes were retained for different versions. Secondly, we removed observations that satisfy the following conditions: (1) missing, negative or zero value in any of the input-output variables (i.e., total assets, number of employees and main business income); (2) enterprises with less than 10 employees (small enterprises usually lack reliable accounting systems [53]). After these procedures, we finally got a total of 17,457 observations for the period of 1998–2013. Finally, we grouped these observations as panel data of 29 Chinese provinces from 1998 to 2013 (Guizhou, Tibet, Taiwan, Hong Kong and Macao are not included due to data missing or not available).
To estimate the technical efficiency of NEI, two inputs and one output were calculated based on those enterprises selected above. These three variables of each enterprise in the same province were added together to obtain the total assets, number of employees and main business income of each province. When there were no new energy enterprises in a certain province of a certain year, we used interpolation to process missing data after getting the unbalanced panel data. Regarding the panel data, missing values in the middle of the time series were estimated by interpolation and missing values in the previous stages of the time series were assumed to be the same as their nearest values. To eliminate the impacts of prices, price indices for investment in fixed assets and producer price indices for industrial products were used to transform nominal total assets into real total assets and to convert the nominal main business income into actual main business income (1998 = 100), respectively.
Among the above five driving factors, enterprise scale (FS) and enterprise ownership structure (SO) were also calculated based on those selected enterprises. The panel data of technological progress (TE) were from the China Statistical Yearbook on Science and Technology (1998–2013) [54]. Economic development (PGDP) was obtained from China Statistical Yearbook (1998–2013) [55]. However, the raw data of new energy resources (NE) were from China Energy Statistical Yearbook (1998–2013) [56]. To eliminate the impact of prices, we converted nominal per capita GDP into real per capita GDP (1998 = 100).

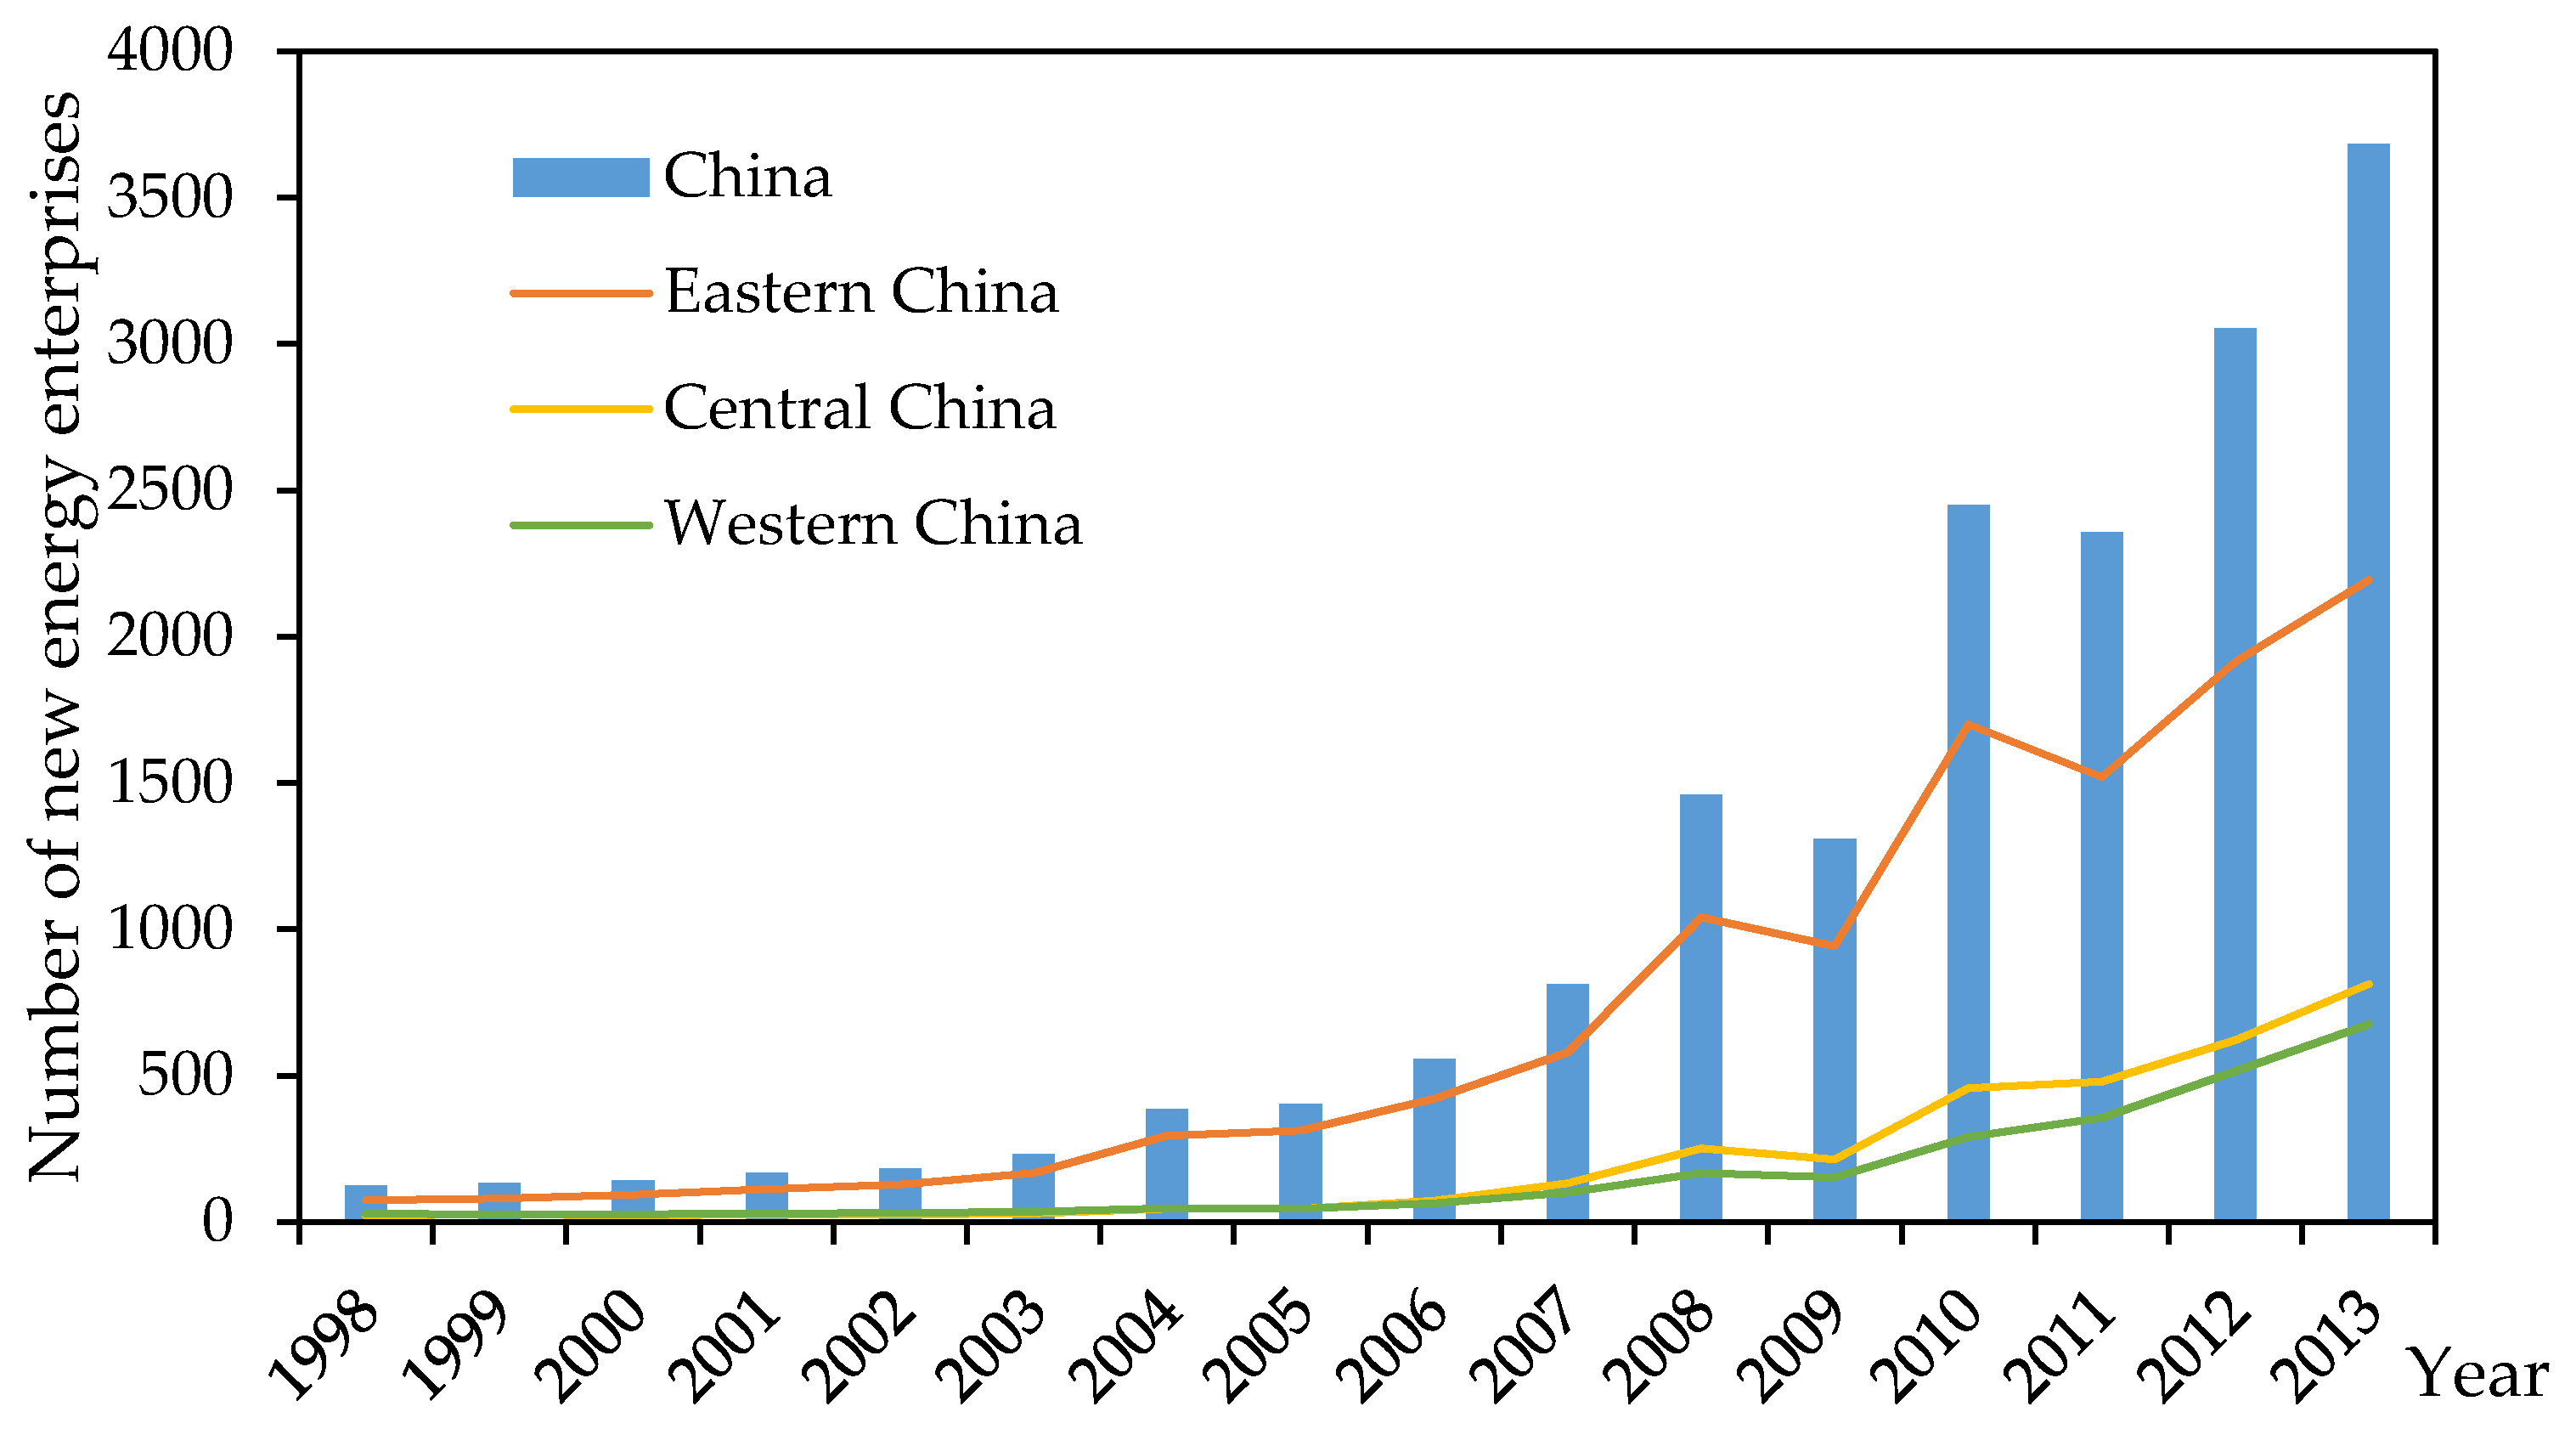
2.4. Data Description

To investigate the development disparities of NEI between regions, this paper divides the 29 provinces, autonomous regions and municipalities into eastern, central and western regions based on their uneven resource access and economic development.
The NEI showed a rapid upward trend during the sample period (see Figure 2). The number of new energy enterprises increased from 125 in 1998 to 3684 in 2013, with an average annual growth rate of 23.5%. The development of NEI was very slow before 2004 but has grown rapidly since 2006 due to the implementation of the “Renewable Energy Law of the People’s Republic of China” that year. In addition, the NEI was promoted as a strategic emerging industry in 2009, which further facilitated the growth of NEI. With the support of the Chinese government, all provinces are committed to developing the NEI. Nevertheless, China has obvious regional variation during the development of NEI. As shown in Figure 2, the distribution of NEI was even among these three regions before 2003. However, the number of new energy enterprises increased dramatically in Eastern China since 2003, whereas that in the Central and Western China increased noticeably in 2007.
Based on sample data, we explored the spatial distribution characteristics of the five driving factors across China in 2013 (see Figure 3). There are significant regional disparities in these factors. (1) Enterprise scale (FS). According to the Statistical Standards for the Classification of Large, Medium, Small and Micro Enterprises, industrial enterprises with employees between 300 and 1000, and revenue between 20 and 400 million RMB belong to medium-sized enterprises. However, this paper only used the average main business income to indicate enterprise scale. Figure 3 shows that the average size of enterprises in most provinces is medium-sized, except for Tianjin, Jiangsu, Shaanxi, Jiangxi and Guangxi, where the average main business income is over 400 million RMB. Although these enterprises are large- and medium-sized according to the standards, the enterprise scale in different provinces still varies greatly. (2) Enterprise ownership structure (SO). The proportion of state-owned economic components in the NEI varies significantly among provinces. The provinces with a relatively low proportion of state-owned economy are mainly concentrated in the eastern coastal region and several provinces in the central region. The provinces with more than 50% of state-owned content are Gansu, Hunan, Shaanxi, and Yunnan. (3) Technological progress (TE). China’s R&D investment increased from 48.57 billion RMB in 1998 to 880.59 billion RMB in 2013, with an average annual growth rate of 21.3%. However, compared with developed countries, China’s R&D investment is still very low. In 2013, the RDI was very low for all provinces (less than 3.56%), except for Beijing (5.98%). Moreover, the provinces with higher RDI are mainly concentrated in the southeast coast and some provinces of the central region. (4) Economic development (PGDP). Regional disparity is a specific feature of China’s rapid economic development over the last few decades. The eastern region is the most developed, and the degree of development decreases from east to west. (5) New energy resources (NE). China is a vast country and rich in new energy resources. According to China Electric Power Yearbook [57], China’s total new energy power generation was 258.5 billion kWh in 2013, of which 111.5 billion kWh was from nuclear power, 138.3 billion kWh from wind power, and 8.4 billion kWh from solar power. However, the distribution of new energy resources in China is uneven with obvious spatial disparity. The three northern regions, including northwest (Xinjiang, Ningxia, Qinghai, and Gansu), northeast (Heilongjiang, Jilin and Liaoning) and north China (Inner Mongolia, Hebei and Shanxi), have the most abundant onshore wind energy resources. For offshore wind, the coastal areas (Shandong, Jiangsu, Zhejiang, Fujian and Guangdong) have the most potential [58]. Solar energy resources are also mainly concentrated in the northwest provinces, topped by Inner Mongolia, Xinjiang and Gansu [59].

3. Results and Discussion

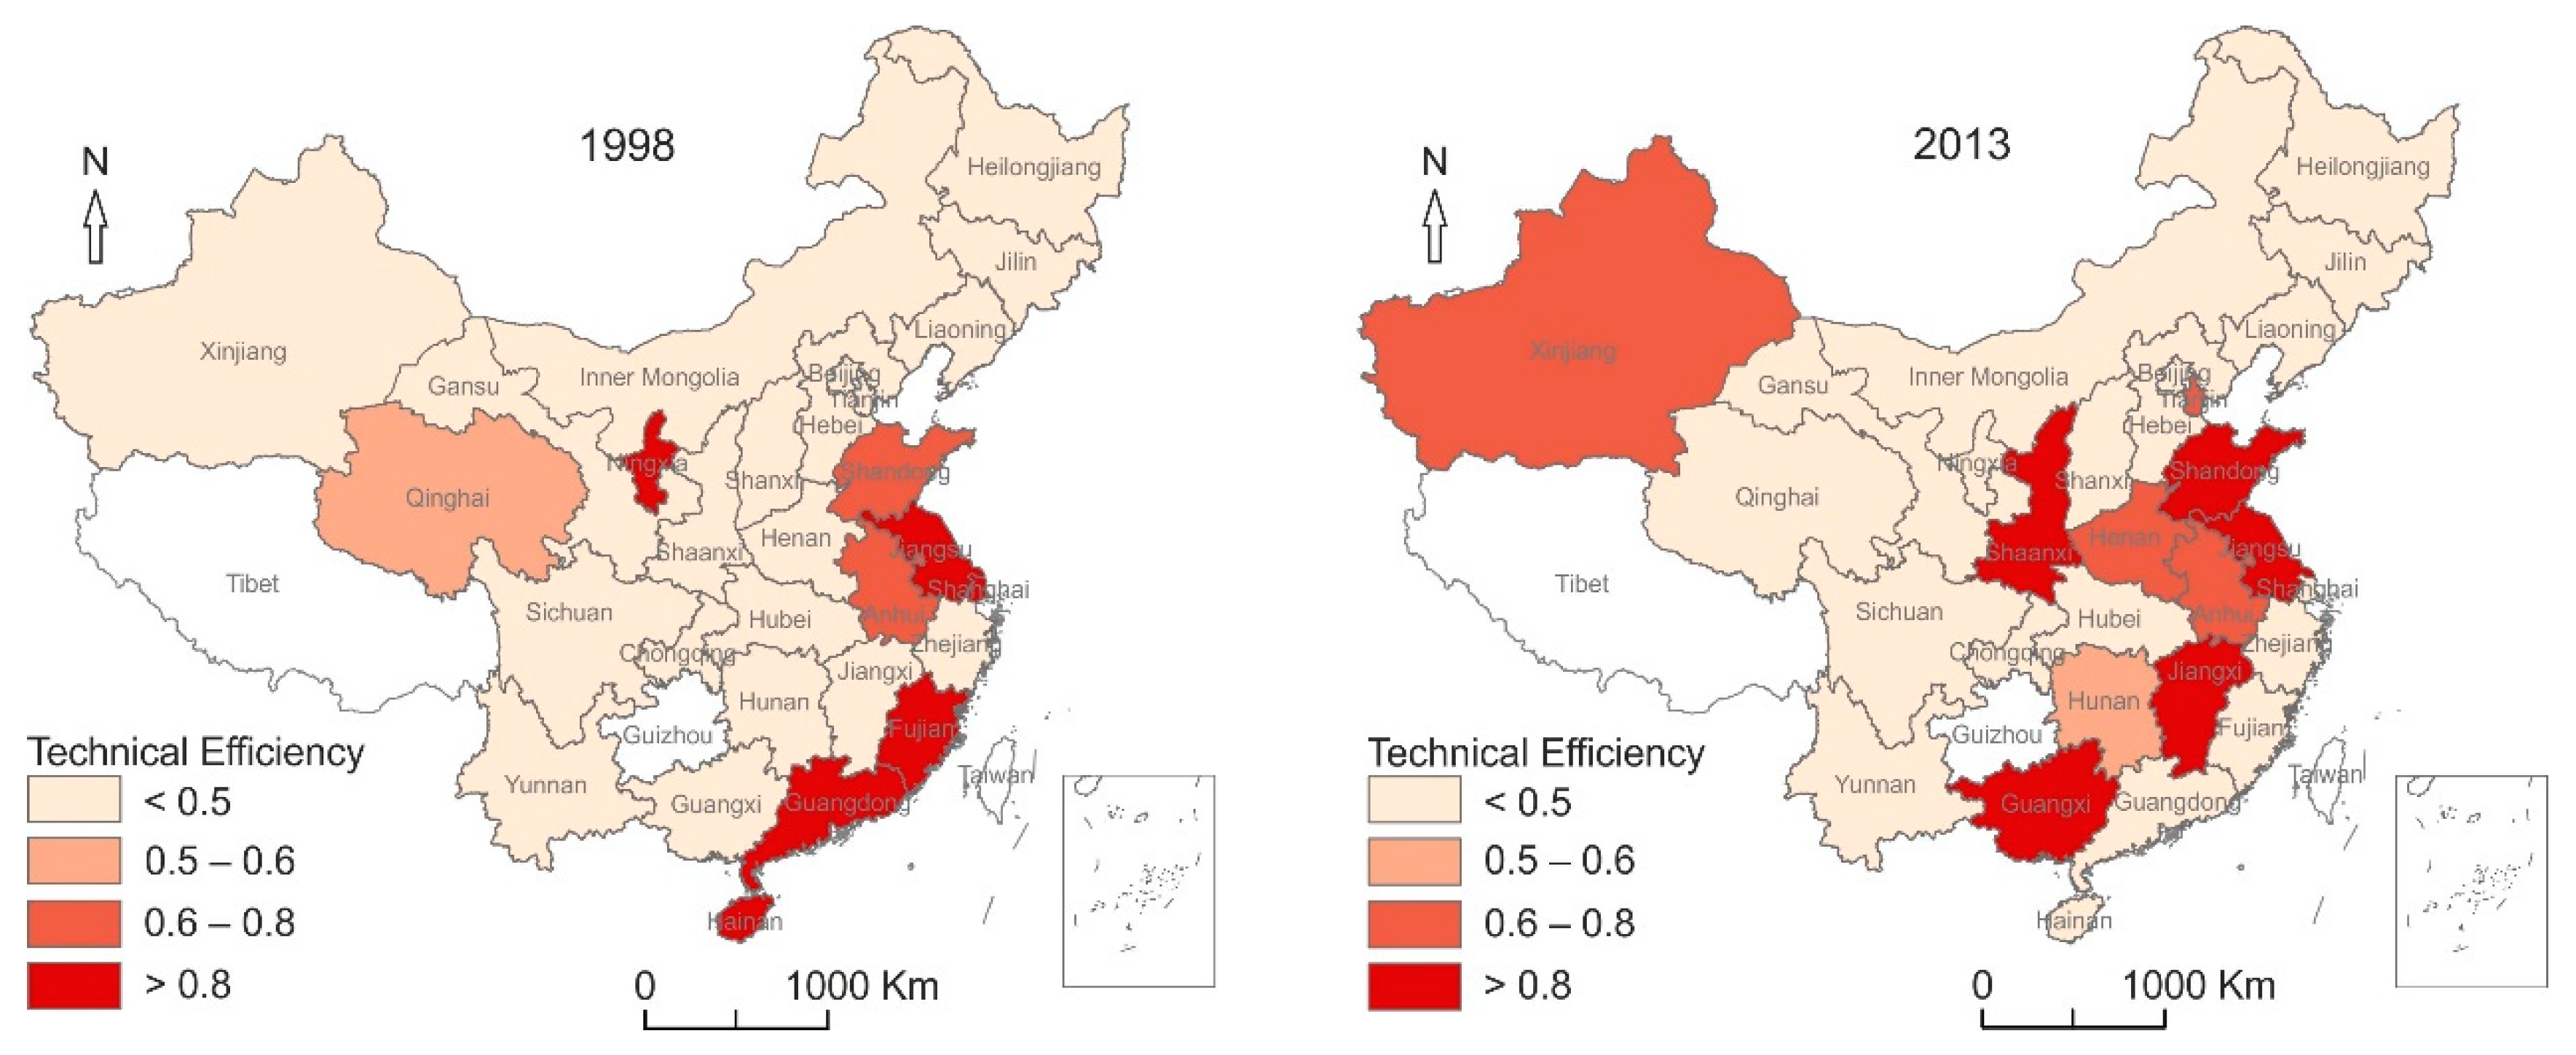
3.1. The Spatiotemporal Analysis of NEI’s Technical Efficiency

The technical efficiency of China’s NEI during 1998–2013 is shown in Table 2. Figure 4 presents the average efficiency of three regions and the whole country during 1998–2013. The national average efficiency increased modestly by 18.37% during the period, from 0.44 in 1998 to 0.52 in 2013. It is relatively low compared with other industries in China, e.g., the national average technical efficiency of biomass energy from the recycling industry is 0.60–0.75 between 2006 and 2015 [26]. Moreover, there are significant spatial differences in the efficiency of the three regions (see Figure 5). Eastern China has the highest average efficiency over the period (0.67), significantly higher than the other two regions. The difference between the average efficiency of Central China (0.46) and Western China (0.47) is small. Overall, the gaps between the efficiency of these three regions have decreased over time. From a provincial perspective, the significant variations in efficiency indicate that inefficient enterprises have the potential to catch up by benchmarking best-performing enterprises, thereby improving the NEI’s efficiency [25].
As can be seen from Figure 5, there are obvious regional differences in NEI’s efficiency. Eastern China is the most developed area in terms of industry, especially some high-tech industries. At the same time, the quality of human resources is very high due to the highest per capita wages. Compared to Eastern China, Western China is underdeveloped, but rich in new energy resources. In 2017, 50% and 49% of the nation’s wind power and solar power generation came from Western China. On the contrary, Eastern and Central China have less new energy power generation but consume the most energy. Therefore, in terms of industrial chain of NEI, Eastern China is more likely to form R&D and high value-added parts manufacturing. Based on our calculations, 67% of national new energy manufacturing enterprises were located in Eastern China in 2013. Instead, Central and Western China are new energy resources supply regions [40]. In the development of NEI, different regions play different roles, which also leads to differences in efficiency between regions.

3.2. Performance of GTWR Model

Before using the GTWR model, the first consideration is whether the GTWR model can describe the dataset better than the OLS model. Therefore, we compared the results of the OLS regression and GTWR model. As shown in Table 3, the adjusted R2 (0.623) of GTWR model is far greater than that of OLS model (0.249). Furthermore, the AIC value and the residuals sum of squares from GTWR model are both much smaller than those in OLS regression. These results show that the GTWR model performs better in fitting the data, indicating that there is a noticeable spatiotemporal heterogeneity of NEI. Thus, this paper uses the GTWR model to estimate the parameters.
In addition, this study also assesses the spatial and temporal non-stationarities of parameters estimated from GTWR model. If there are spatial and temporal non-stationarities, it suggests that the OLS is not adequate to describe the data and the GTWR model should be applied. An easy way to examine spatial non-stationarity is to compare twice the standard errors (SE) of the OLS estimates with the interquartile of parameters estimated from GTWR, with larger values of the latter indicating significant spatial non-stationarity [46]. This study selects the years 1998, 2006 and 2013 as examples and the results are summarized in Table 4. The interquartile of all estimated parameters in GTWR is greater than the doubled standard errors of OLS, indicating that the data has significant spatial non-stationarity. As for the temporal non-stationarity, the parameters estimated from GTWR model for all regions show a trend of change over time from Figure 6 (more details are discussed in Section 3.3). Therefore, it is appropriate to apply the GTWR model to explore the driving factors of NEI.
Moreover, because of the extensive number of outputs for the estimated coefficients from GTWR model, Supplementary Table S3 lists several characteristic values of estimated coefficients as an illustration of the extent of the variability. The residuals from GTWR are analyzed (see Supplementary Note S2 and Supplementary Figure S1). The mean of residuals is approximately zero (0.0028) and provinces with standardized residual value within (−2, 2) account for 95% of the whole observations, indicating it is reliable to adopt the GTWR model.

3.3. Driving Factors for the Spatiotemporal Heterogeneity in Technical Efficiency

This study analyzes the estimation results of the GTWR model in detail. This model presents the results of the effects of the driving factors on NEI’s technical efficiency in different provinces across 1998–2013. Since the output of the GTWR model is enormous, this study evaluates the effects of these driving factors in different regions and discusses the effects from temporal and spatial perspectives (see Figure 6).

3.3.1. Enterprise Scale Effect

As shown in Figure 6a, enterprise scale has a significant positive effect (0.21) on NEI’s technical efficiency, indicating that large enterprises are conducive to the development of NEI. This result is consistent with previous research [22]. There are two reasons for this. Firstly, this relationship reflects the internal economies of scale in the NEI. This means that with the expansion of the production scale and the increase of output of the enterprises, the fixed cost allocated to the unit product will become less and less, leading to reduced average cost of the product and improved efficiency. Secondly, compared with small enterprises, large enterprises have strong financial strength and the ability to carry out research and development activities, thereby reducing costs and improving the efficiency.
From a temporal perspective, the average elasticity of enterprise scale increased from 0.13 in 1998 to 0.42 in 2013, indicating the positive effect gradually increases over time. The possible reason is as follows: In the early stages, the enterprise scale of China’s NEI was generally small. However, deep integration has taken place in the industry over time [50] and there are increasingly more medium- and large-sized enterprises. From the data we calculated, the average main business income of the new energy enterprises across the country has increased year by year. During the sample period, this value increased from 71.5 million RMB to 268.1 million RMB. Moreover, as the NEI gradually enters rational development, economies of scale and management efficiency within enterprises are getting higher and higher, leading to an increase in the efficiency over time. The difference between the influence of enterprise scale in the three regions is not obvious, suggesting that the heterogeneous influence of enterprise scale on the efficiency is mainly reflected in the time dimension but not the space dimension.

3.3.2. Enterprise Ownership Structure Effect

The average effect (−0.04) of enterprise ownership structure on NEI’s technical efficiency is negative and small except for that of Western China in 2013 (see Figure 6b), which was positive mainly because the elasticity of Xinjiang was unusually high at 1.49. This suggests that state-owned enterprises are less efficient in NEI though the average effect is small. The results are consistent with the literature that reports state-owned enterprises generally perform poorly [22]. Bai et al. pointed out that in addition to meeting profit objectives, Chinese state-owned enterprises must adopt multiple social responsibilities [60], such as employment, and consequently their financial performance must be poor. This is especially important in the NEI. In this industry, state-owned enterprises are responsible for energy conservation and emission reduction, optimizing the energy structure, and promoting technological innovation in the new energy field. Therefore, their financial performance is expected to be poorer than that of non-state enterprises.
From a temporal perspective, the negative effect of enterprise ownership structure on NEI’s technical efficiency is stable during 1998–2008. After 2008, the effect gradually increases as the absolute value of its coefficients increases over time. However, according to the data we calculated, the proportion of state-owned enterprises in the NEI decreased from 84% in 1998 to 20% in 2013. Although the proportion of state-owned enterprises has decreased, the effect on efficiency increased, showing that state-owned enterprises are very important and the main force in the development of the NEI. From a spatial perspective, the influence of enterprise ownership structure on NEI’s efficiency in Western China is basically stable (except in 2013). In Eastern and Central China, the effects are also relatively stable during 1998–2008, although the absolute value of their coefficients increased after 2008, indicating that this negative effect increased.

3.3.3. Technological Progress Effect

The average effect (−0.08) of technological progress on NEI’s technical efficiency is negative with an upward trend from negative to positive during the sample period (see Figure 6c). From a temporal perspective, technological progress is significantly and negatively correlated with nationwide NEI’s efficiency during 1998–2007. After 2007, the relationship becomes positive. The effects in Eastern and Central China become positive after 2005 and 2006, respectively, whereas the effect in Western China is positive only in 2012. This means that R&D investment did not play any role in improving the efficiency in the early stages. The NEI is one of the technology- and capital-intensive industries and its development depends on R&D investment [61]. In the early stages, the development of NEI was still in its infancy and the initial level of new energy technology was rather low [50]. Due to inadequate R&D funding, many technical problems had not been solved, which seriously restricted the rapid expansion of NEI [51]. According to China Statistical Yearbook on Science and Technology [54], the average annual R&D investment from 1998 to 2005 was 125 billion RMB (1998 = 100). The lack of R&D investment hinders the progress of new energy technologies. Low technology level cannot reduce production costs, thus hindering the improvement of the efficiency. With economic growth, the government has paid more and more attention to the development of NEI. In particular, the implementation of the Renewable Energy Law in 2006 stimulated significant development of NEI in China at all levels. China expanded R&D investment in NEI in the later stages. According to China Statistical Yearbook on Science and Technology [54], the average annual R&D investment over the period 2006–2013 was 551 billion RMB. The continuous R&D investment in NEI has promoted basic research in new energy, thus obtaining more advanced technologies. This not only solves technical problems, but also reduces the cost of new energy products and increases revenue, resulting in the increase of the efficiency. Therefore, the role of R&D investment in promoting NEI’s efficiency gradually emerges in the later periods.
From a spatial perspective, the negative effect of technological progress on NEI’s efficiency in Western China is the largest, and the time for the effect changing from negative to positive lags behind Eastern and Central China. The difference is mainly caused by the different R&D investment between regions. Currently, China’s new energy technologies still lag behind developed countries and most core technologies rely on imports [50]. In general, the more R&D investment, the more advanced technologies can be obtained. The regional difference of R&D investment leads to the regional difference of technological progress. Data from China Statistical Yearbook on Science and Technology shows that the R&D investment intensity during 2006 to 2013 in Eastern, Central and Western China was 1.95%, 1.09% and 1.04%, respectively [54]. Therefore, technological progress in Western China is relatively lagging.

3.3.4. Economic Development Effect

On the whole, the average effect (0.29) of economic development on NEI’s technical efficiency is positive and the largest among the five driving factors but decreasing. The positive relationship between economic development and NEI’s efficiency indicates that economic growth has a promotion effect on technical efficiency. The result is the same as other literature [22,62]. However, from a temporal perspective, the coefficients of economic development are decreasing over time (see Figure 6d), showing that economic development has not played a long-term role in promoting NEI’s efficiency. This is mainly because economic growth will not directly lead to the increase in technical efficiency [63]. Provinces with a higher degree of economic development may also lead to a low level of technical efficiency resulting from not making full use of production resources. Therefore, the economic growth of a province will not directly lead to the improvement of its efficiency. With the economic growth, NEI has made great progress, but there is still a huge waste within the industry due to overcapacity and wind and solar power curtailment, resulting in a low level of technical efficiency.
There could be several specific reasons for this decreasing relationship between economic development and efficiency. In the early stages, China’s economic structure was irrational and economic growth mainly depended on the energy-intensive industry with high greenhouse gas emissions [64]. With environmental degradation and energy crisis, China gradually began to develop clean energy, including new energy. As a strategic emerging industry, the development of NEI received a lot of policy and financial support from the Chinese government. However, there were many gaps in new energy technologies initially. Economic development was just able to provide capital support for the development of NEI, thus promoting the progress of new energy technologies. Therefore, in the early stages, economic growth plays a greater role in promoting NEI’s efficiency. As time goes by, technological progress entered a certain bottleneck period and the influence of capital investment on technological progress became smaller, limiting further improvement in the efficiency.
From a spatial perspective, the mean of the absolute coefficients of economic development on the efficiency in Western China (0.68) is higher than that in Central China (0.31) and Eastern China (0.29). This is mainly because of the uneven development between regions. The economic development of Western China lags behind that of Eastern and Central China, as does the NEI. In the national supply chain of NEI, Eastern China is more likely to form R&D and high value-added parts manufacturing because of capital and labor intensity, while Western China performs as a resource supply area and its high-tech industry is not well developed due to lower degree of economic development and less human resources [40]. Therefore, in Eastern China, due to a higher degree of industrial development and limited room for improvement in efficiency, the effect of economic development on NEI’s efficiency is much less than that in Western China.

3.3.5. New Energy Resources Effect

The average elasticity (−0.01) of new energy resources is negative and small, showing that the relationship between new energy resources and NEI’s technical efficiency is generally weak during the whole period (see Figure 6e). This result is different from that of Zhao et al. (2019) [22], which shows that the technical efficiency of wind power enterprises, located in three northern areas with abundant wind energy resources, are more efficient. The difference is mainly because our research focuses on the entire NEI, including both new energy power and manufacturing industries, while the research of Zhan et al. (2019) only focuses on wind power industry. From a temporal perspective, the influence of new energy resources on nationwide NEI’s efficiency is negative during 1998–2010 with the negative effect decreasing. From 2011, the relationship becomes positive. In addition, the effects in Eastern and Central China change from negative to positive in 2008 and 2010, respectively, while the effect in Western China is negative during the whole period. This indicates that new energy resources did not promote the development of NEI in the early stages. There may be two reasons for this. Firstly, new energy is mainly introduced into the supply mix of electricity generation [11]. However, the overall supply of China’s power industry exceeds demand, resulting in significant wind and solar power curtailment. According to China Electric Power Yearbook [57], China’s cumulative installed new energy capacity surged from 2.3 GW in 1998 to 107.2 GW by 2013, with an average annual growth rate of 29%. However, the average annual growth rate of China’s electricity consumption was only 12% during the same period. This was partly the reason for wind and solar power curtailment, resulting in energy waste and contributing to the low efficiency of NEI. Secondly, with the continuous expansion of new energy, China’s new energy manufacturing industry also achieved rapid development. New energy manufacturing accounts for a large proportion of NEI. Based on our calculations, in 2013, 73% of new energy enterprises belonged to the manufacturing industry while new energy power generation industry accounted for 26%. Since the manufacturing industry accounts for a larger proportion of NEI than the power generation industry, the relationship between new energy resources and the development of NEI is weak.
From a spatial perspective, the trend of the relationship between new energy resources and the efficiency in Eastern and Central China is the same, with a gradual change from negative to positive. However, the effect of new energy resources in Western China presents a “U” shape, indicating the negative effect first increases and then gradually decreases over time. The possible reason for the different effects in different regions is mainly the different utilization rates of new energy resources. There are abundant wind and solar energy resources in Northern China [58,59] but its grid infrastructure is inadequate in some areas and power transmission is also limited due to insufficient load, making wind and solar power curtailment most significant in the northwest region. This can cause great economic loss and energy waste, hindering rapid and effective development of NEI. Based on data from the National Energy Administration, the average wind curtailment rate of China was 11% in 2013. Two western provinces (Inner Mongolia and Gansu) had the most significant wind curtailment, accounting for 58.5% of the total. On the contrary, wind and solar power curtailment is relatively minor in the central and eastern regions because of the large demand for electricity. However, with the optimization of the power system, the curtailment gradually eased. By 2019, the average rate of wind and solar power curtailment in the whole country was only 4% and 2%, respectively.

3.4. Policy Implications

The overall technical efficiency of China’s NEI is at a low level, meaning that there is great potential to improve the economic performance of NEI. Based on the above analysis, we put forward the following recommendations to improve the technical efficiency of China’s NEI.
Firstly, enterprise scale has a positive effect on NEI’s technical efficiency, and the positive effect increases over time, indicating that enterprise scale will drive the increase of NEI’s efficiency in the future. Therefore, the government should encourage enterprise integration and mergers in NEI. Rational enterprise integration and mergers can not only improve the economies of scale, but also optimize the allocation of resources and reduce new energy resources waste [22]. In addition, state-owned enterprises occupy an important position in the NEI, but their technical efficiency is generally low. Therefore, the reform of state-owned power enterprises should be accelerated to improve management efficiency. At the same time, the government should reduce the entry barriers of NEI and encourage private- and foreign-owned capital to enter the industry.
Secondly, the government should implement policies such as technology subsidies and tax reductions to encourage large-scale and state-owned enterprises to innovate technologically. As small businesses lack technology and competitive advantages, the government should also provide technical support for them to protect their development. In addition, the government should encourage capable small- and medium-sized enterprises to innovate technologically and produce high value-added products, leaving room for low value-added products to less capable enterprises, to further optimize the new energy industry market.
Thirdly, regression results show that the promotion effect of technological progress on the improvement of NEI’s efficiency emerges in the later stages and gradually increases. The promotion of technology level plays a significant role in improving NEI’s efficiency. Therefore, the government should increase R&D investment in NEI at all levels, especially in less developed Western China. Advanced technologies can promote the development of NEI, as well as the improvement of technical efficiency. In the early stages, the level of China’s new energy technologies is low mainly due to insufficient R&D investment. Therefore, the government and enterprises should expand R&D investment and increase the intensity of R&D investment to facilitate the development of NEI. Moreover, local governments, especially those in areas with low level of efficiency, should strengthen cooperation between provinces in the field of new energy and introduce advanced new energy technologies.
Finally, significant wind and solar power curtailment is found during the development of NEI, resulting in waste of new energy resources and low level of technical efficiency. One of the main reasons is overcapacity of new energy generation [65]. Therefore, the government should further optimize the layout and development of new energy power generation. In provinces where wind and solar power curtailment is significant, the government should promote local consumption of new energy power and increase the power transmission capacity to deliver power to high consumption areas. The government should also improve the level of new energy dispatch across the country, promote cross-regional power delivery and optimize the energy structure. At the same time, according to local capacity of new energy power, government intervention should be designed properly to guide enterprises to invest and construct new energy generation projects.

4. Conclusions

Developing NEI is the most important measure for China during the path to low-carbon development. However, due to the poor economic performance, China’s NEI is highly dependent on financial support from the government. Faced with the dual pressure of subsidy shortage and grid parity, China’s NEI should improve their own economic performance by improving technical efficiency.
Based on a large enterprise level dataset from 1998 to 2013, this paper uses super-efficiency SBM model combined with DEA window analysis to measure the technical efficiency of China’s NEI at a provincial level. The results show that the efficiency of China’s NEI is relatively low, which means that the development of NEI is mainly driven by increases in resources and investment, not by an increase in efficiency. Moreover, significant spatial differences in efficiency were found. Eastern China has the highest efficiency level with the gap between regions narrowing over time. Meanwhile, this paper applies the GTWR model to explore the spatiotemporal heterogeneity of the main driving factors of NEI’s efficiency. The results show that the effects of driving factors on efficiency vary across regions and time. Enterprise scale and technological progress are the main driving factors for NEI’s increasing efficiency. However, the role of economic development for increasing the efficiency gradually disappears. In addition, state-owned enterprises are not effective for the improvement of efficiency and the negative effect of the proportion of state-owned enterprises is increasing at the end of sample period. Due to the large proportion of manufacturing enterprises in NEI, the effect of new energy resources on efficiency is small. Moreover, different utilization rates of new energy resources in different regions lead to a U-shaped effect in Western China and a gradually increasing effect in Eastern and Central China.
Here, we point out some limitations of this study and further research directions. First, given the data available at the time of our study, this paper can only assess the period from 1998 to 2013. When the database used is updated in the future, it is necessary to re-assess the development of China’s NEI using more recent data. Second, this study does not divide the NEI into sub-industries. It could be useful to assess the efficiency of sub-industries within the NEI such as equipment manufacturing and power generation. Third, this study does not account for the carbon emissions when measuring the efficiency. Future research needs to take carbon emissions into account to evaluate the efficiency of NEI in the context of reducing carbon emissions.

Supplementary Materials

The following are available online at https://www.mdpi.com/article/10.3390/en14144151/s1, Supplementary Note S1: DEA window analysis, Supplementary Table S1: A three-year window analysis of NEI’s technical efficiency of Beijing, Supplementary Table S2A: Industries retained for different periods, Supplementary Table S2B: Keywords used to search from enterprise names and main products, Supplementary Table S3: Summary of GTWR parameter estimates, Supplementary Note S2: Analysis of residuals, Supplementary Figure S1: Plot of standardized residuals from GTWR.

Author Contributions

Conceptualization, H.L., X.Y. and J.C.; methodology, H.L. and Y.B.; software, H.L. and Y.B.; validation, H.L. and Y.B.; formal analysis, H.L.; investigation, Y.B.; resources, X.Y.; data curation, Y.B.; writing—original draft preparation, H.L.; writing—review and editing, X.Y. and Y.B.; visualization, Y.B.; supervision, J.Z., J.C. and X.Y.; project administration, J.C. All authors have read and agreed to the published version of the manuscript.

Funding

This research received no external funding.

Data Availability Statement

Chinese Industrial Enterprises Database (1998–2013) is released by the National Bureau of Statistics.

Acknowledgments

The first author would like to thank the scholarship from the China University of Geosciences (Wuhan) to study at the University of Exeter.

Conflicts of Interest

The authors declare no conflict of interest.

Abbreviations

NEINew energy industry
DEAData envelopment analysis
GTWRGeographically and temporally weighted regression
SFAStochastic frontier analysis
SBMSlacks-based measure
DMUsDecision making units
CRSConstant returns to scale
VRSVariable returns to scale
ETechnical efficiency
FSEnterprise scale
SOEnterprise ownership structure
TETechnological progress
PGDPEconomic development (per capita GDP)
NENew energy resources
GWRGeographically weighted regression
AICAkaike information criterion
R&DResearch and development
RDIR&D expenditure intensity
OLSOrdinary least squares
SEStandard error

References

  1. Engels, A. Understanding how China is championing climate change mitigation. Palgrave Commun. 2018, 4, 101. [Google Scholar] [CrossRef]
  2. Gi, K.; Sano, F.; Akimoto, K.; Hiwatari, R.; Tobita, K. Potential contribution of fusion power generation to low-carbon development under the Paris Agreement and associated uncertainties. Energy Strategy Rev. 2020, 27, 100432. [Google Scholar] [CrossRef]
  3. Gielen, D.; Boshell, F.; Saygin, D.; Bazilian, M.D.; Wagner, N.; Gorini, R. The role of renewable energy in the global energy transformation. Energy Strategy Rev. 2019, 24, 38–50. [Google Scholar] [CrossRef]
  4. Cui, R.Y.; Hultman, N.; Cui, D.; McJeon, H.; Yu, S.; Edwards, M.R.; Sen, A.; Song, K.; Bowman, C.; Clarke, L.; et al. A plant-by-plant strategy for high-ambition coal power phaseout in China. Nat. Commun. 2021, 12, 1–10. [Google Scholar] [CrossRef]
  5. Duan, H.; Zhou, S.; Jiang, K.; Bertram, C.; Harmsen, M.; Kriegler, E.; van Vuuren, D.P.; Wang, S.; Fujimori, S.; Tavoni, M. Assessing China’s efforts to pursue the 1.5 °C warming limit. Science 2021, 372, 378–385. [Google Scholar] [CrossRef]
  6. Liu, J.; Li, J.; Yao, X. The Economic Effects of the Development of the Renewable Energy Industry in China. Energies 2019, 12, 1808. [Google Scholar] [CrossRef] [Green Version]
  7. Bu, Y.; Wang, E.; Bai, J.; Shi, Q. Spatial pattern and driving factors for interprovincial natural gas consumption in China: Based on SNA and LMDI. J. Clean. Prod. 2020, 263, 121392. [Google Scholar] [CrossRef]
  8. Guo, M.; Bu, Y.; Cheng, J.; Jiang, Z. Natural Gas Security in China: A Simulation of Evolutionary Trajectory and Obstacle Degree Analysis. Sustainability 2019, 11, 96. [Google Scholar] [CrossRef] [Green Version]
  9. Lin, B.Q.; Bin, X. How to promote the growth of new energy industry at different stages? Energy Policy 2018, 118, 390–403. [Google Scholar] [CrossRef]
  10. Lin, B.Q.; Moubarak, M. Renewable energy consumption—Economic growth nexus for China. Renew. Sustain. Energy Rev. 2014, 40, 111–117. [Google Scholar] [CrossRef]
  11. Lin, B.Q.; Chen, Y.F. Does electricity price matter for innovation in renewable energy technologies in China? Energy Econ. 2019, 78, 259–266. [Google Scholar] [CrossRef]
  12. BP, Statistical Review of World Energy. 2020. Available online: https://www.bp.com/content/dam/bp/business-sites/en/global/corporate/pdfs/energy-economics/statistical-review/bp-stats-review-2020-full-report.pdf (accessed on 6 June 2021).
  13. Lin, B.; Luan, R. Do government subsidies promote efficiency in technological innovation of China’s photovoltaic enterprises? J. Clean. Prod. 2020, 254, 120108. [Google Scholar] [CrossRef]
  14. Lin, B.Q.; Luan, R.R. Are government subsidies effective in improving innovation efficiency? Based on the research of China’s wind power industry. Sci. Total Environ. 2020, 710, 136339. [Google Scholar] [CrossRef] [PubMed]
  15. Yan, J.; Yang, Y.; Campana, P.E.; He, J. City-level analysis of subsidy-free solar photovoltaic electricity price, profits and grid parity in China. Nat. Energy 2019, 4, 709–717. [Google Scholar] [CrossRef]
  16. Shen, W. Who drives China’s renewable energy policies? Understanding the role of industrial corporations. Environ. Dev. 2017, 21, 87–97. [Google Scholar] [CrossRef] [Green Version]
  17. Zhao, X.-G.; Li, P.-L.; Zhou, Y. Which policy can promote renewable energy to achieve grid parity? Feed-in tariff vs. renewable portfolio standards. Renew. Energy 2020, 162, 322–333. [Google Scholar]
  18. Zou, H.; Du, H.; Brown, M.A.; Mao, G. Large-scale PV power generation in China: A grid parity and techno-economic analysis. Energy 2017, 134, 256–268. [Google Scholar] [CrossRef]
  19. Clack, C.T.M.; Qvist, S.A.; Apt, J.; Bazilian, M.; Brandt, A.R.; Caldeira, K.; Davis, S.J.; Diakov, V.; Handschy, M.A.; Hines, P.D.H.; et al. Evaluation of a proposal for reliable low-cost grid power with 100% wind, water, and solar. Proc. Natl. Acad. Sci. USA 2017, 114, 6722–6727. [Google Scholar] [CrossRef] [Green Version]
  20. Farrell, M.J. The Measurement of Productive Efficiency. J. R. Stat. Soc. Ser. A 1957, 120, 253–290. [Google Scholar] [CrossRef]
  21. Coelli, T.J.; Rao, D.S.P.; Battese, G.E. An Introduction to Efficiency and Productivity Analysis; Springer Science and Business Media LLC: New York, NY, USA, 1998. [Google Scholar]
  22. Zhao, X.G.; Zhen, W. The technical efficiency of China’s wind power list enterprises: An estimation based on DEA method and micro-data. Renew. Energy 2019, 133, 470–479. [Google Scholar]
  23. Zhang, L.; Wang, J.; Wen, H.; Fu, Z.; Li, X. Operating performance, industry agglomeration and its spatial characteristics of Chinese photovoltaic industry. Renew. Sustain. Energy Rev. 2016, 65, 373–386. [Google Scholar] [CrossRef]
  24. Wang, Q.; Hang, Y.; Sun, L.; Zhao, Z. Two-stage innovation efficiency of new energy enterprises in China: A non-radial DEA approach. Technol. Forecast. Soc. Chang. 2016, 112, 254–261. [Google Scholar] [CrossRef]
  25. Zeng, S.; Jiang, C.; Ma, C.; Su, B. Investment efficiency of the new energy industry in China. Energy Econ. 2018, 70, 536–544. [Google Scholar] [CrossRef]
  26. Xu, X.-L.; Chen, H.H. Examining the efficiency of biomass energy: Evidence from the Chinese recycling industry. Energy Policy 2018, 119, 77–86. [Google Scholar] [CrossRef]
  27. Liu, Y.; Ren, L.; Li, Y.; Zhao, X.-G. The industrial performance of wind power industry in China. Renew. Sustain. Energy Rev. 2015, 43, 644–655. [Google Scholar] [CrossRef]
  28. Adom, P.K.; Amakye, K.; Abrokwa, K.K.; Quaidoo, C. Estimate of transient and persistent energy efficiency in Africa: A stochastic frontier approach. Energy Convers. Manag. 2018, 166, 556–568. [Google Scholar] [CrossRef]
  29. Banker, R.; Natarajan, R.; Zhang, D. Two-stage estimation of the impact of contextual variables in stochastic frontier production function models using Data Envelopment Analysis: Second stage OLS versus bootstrap approaches. Eur. J. Oper. Res. 2019, 278, 368–384. [Google Scholar] [CrossRef]
  30. Llorca, M.; Baños, J.; Somoza, J.; Arbués, P. A Stochastic Frontier Analysis Approach for Estimating Energy Demand and Efficiency in the Transport Sector of Latin America and the Caribbean. Energy J. 2017, 38, 153–174. [Google Scholar] [CrossRef]
  31. Mardani, A.; Zavadskas, E.K.; Streimikiene, D.; Jusoh, A.; Khoshnoudi, M. A comprehensive review of data envelopment analysis (DEA) approach in energy efficiency. Renew. Sustain. Energy Rev. 2017, 70, 1298–1322. [Google Scholar] [CrossRef]
  32. Sueyoshi, T.; Yuan, Y.; Goto, M. A literature study for DEA applied to energy and environment. Energy Econ. 2017, 62, 104–124. [Google Scholar] [CrossRef]
  33. Zhou, H.; Yang, Y.; Chen, Y.; Zhu, J. Data envelopment analysis application in sustainability: The origins, development and future directions. Eur. J. Oper. Res. 2018, 264, 1–16. [Google Scholar] [CrossRef]
  34. Statistics, N.B.o. Chinese Industrial Enterprises Database 1998–2013. In Beijing, 2018.
  35. Charnes, A.; Cooper, W.W.; Rhodes, E. Measuring efficiency of decision-making units. Eur. J. Oper. Res. 1978, 2, 429–444. [Google Scholar] [CrossRef]
  36. Tone, K. A slacks-based measure of efficiency in data envelopment analysis. Eur. J. Oper. Res. 2001, 130, 498–509. [Google Scholar] [CrossRef] [Green Version]
  37. Tone, K. A slacks-based measure of super-efficiency in data envelopment analysis. Eur. J. Oper. Res. 2002, 143, 32–41. [Google Scholar] [CrossRef] [Green Version]
  38. Zhou, P.; Ang, B.; Poh, K. A survey of data envelopment analysis in energy and environmental studies. Eur. J. Oper. Res. 2008, 189, 1–18. [Google Scholar] [CrossRef]
  39. Pulina, M.; Detotto, C.; Paba, A. An investigation into the relationship between size and efficiency of the Italian hospitality sector: A window DEA approach. Eur. J. Oper. Res. 2010, 204, 613–620. [Google Scholar] [CrossRef]
  40. Dong, L.; Liang, H.; Gao, Z.; Luo, X.; Ren, J. Spatial distribution of China’s renewable energy industry: Regional features and implications for a harmonious development future. Renew. Sustain. Energy Rev. 2016, 58, 1521–1531. [Google Scholar] [CrossRef]
  41. Xu, B.; Lin, B.Q. Do we really understand the development of China’s new energy industry? Energy Econ. 2018, 74, 733–745. [Google Scholar] [CrossRef]
  42. Yan, Q.; Wan, Y.; Yuan, J.; Yin, J.; Baležentis, T.; Streimikiene, D. Economic and Technical Efficiency of the Biomass Industry in China: A Network Data Envelopment Analysis Model Involving Externalities. Energies 2017, 10, 1418. [Google Scholar] [CrossRef] [Green Version]
  43. Fotheringham, A.S.; Charlton, M.; Brunsdon, C. The geography of parameter space: An investigation of spatial non-stationarity. Int. J. Geogr. Inf. Syst. 1996, 10, 605–627. [Google Scholar] [CrossRef]
  44. Huang, B.; Wu, B.; Barry, M. Geographically and temporally weighted regression for modeling spatio-temporal variation in house prices. Int. J. Geogr. Inf. Sci. 2010, 24, 383–401. [Google Scholar] [CrossRef]
  45. McMillen, D.P. Geographically Weighted Regression: The Analysis of Spatially Varying Relationships. Am. J. Agric. Econ. 2004, 86, 554–556. [Google Scholar] [CrossRef]
  46. Fotheringham, A.S.; Crespo, R.; Yao, J. Geographical and Temporal Weighted Regression (GTWR). Geogr. Anal. 2015, 47, 431–452. [Google Scholar] [CrossRef] [Green Version]
  47. Roy, W.; Yvrande-Billon, A. Ownership, contractual practices and technical efficiency: The case of urban public transport in France. J. Transp. Econ. Policy 2007, 41, 257–282. [Google Scholar]
  48. Walheer, B.; He, M. Technical efficiency and technology gap of the manufacturing industry in China: Does firm ownership matter? World Dev. 2020, 127, 104769. [Google Scholar] [CrossRef]
  49. Zhang, A.; Zhang, Y.; Zhao, R. A study of the R&D efficiency and productivity of Chinese firms. J. Comp. Econ. 2003, 31, 444–464. [Google Scholar] [CrossRef]
  50. Geng, W.; Ming, Z.; Peng, L.; Liu, X.; Bo, L.; Duan, J. China’s new energy development: Status, constraints and reforms. Renew. Sustain. Energy Rev. 2016, 53, 885–896. [Google Scholar] [CrossRef]
  51. Xu, B.; Lin, B.Q. Assessing the development of China’s new energy industry. Energy Econ. 2018, 70, 116–131. [Google Scholar] [CrossRef]
  52. Xu, X.; Sheng, Y. Productivity Spillovers from Foreign Direct Investment: Firm-Level Evidence from China. World Dev. 2012, 40, 62–74. [Google Scholar] [CrossRef]
  53. Jefferson, G.H.; Rawski, T.G.; Zhang, Y. Productivity growth and convergence across China’s industrial economy. J. Chin. Econ. Bus. Stud. 2008, 6, 121–140. [Google Scholar] [CrossRef]
  54. Statistics, N.B.o. China Statistical Yearbook on Science and Technology; China Statistics Press: Beijing, China, 2016.
  55. Statistics, N.B.o. China Statistical Yearbook; China Statistics Press: Beijing, China, 2020.
  56. Statistics, N.B.o. China Energy Statistical Yearbook; China Statistics Press: Beijing, China, 2016.
  57. Board, C.E.P.Y.E. China Electric Power Yearbook; China Electric Power Press: Beijing, China, 2014. [Google Scholar]
  58. He, G.; Kammen, D.M. Where, when and how much wind is available? A provincial-scale wind resource assessment for China. Energy Policy 2014, 74, 116–122. [Google Scholar] [CrossRef]
  59. He, G.; Kammen, D.M. Where, when and how much solar is available? A provincial-scale solar resource assessment for China. Renew. Energy 2016, 85, 74–82. [Google Scholar] [CrossRef] [Green Version]
  60. Bai, C.-E.; Li, D.D.; Tao, Z.; Wang, Y. A Multitask Theory of State Enterprise Reform. J. Comp. Econ. 2000, 28, 716–738. [Google Scholar] [CrossRef] [Green Version]
  61. Shayegh, S.; Sanchez, D.L.; Caldeira, K. Evaluating relative benefits of different types of R&D for clean energy technologies. Energy Policy 2017, 107, 532–538. [Google Scholar] [CrossRef]
  62. Alsaleh, M.; Abdul-Rahim, A.; Mohd-Shahwahid, H. Determinants of technical efficiency in the bioenergy industry in the EU28 region. Renew. Sustain. Energy Rev. 2017, 78, 1331–1349. [Google Scholar] [CrossRef]
  63. Kumar, S.; Russell, R.R. Technological change, technological catch-up, and capital deepening: Relative contributions to growth and convergence. Am. Econ. Rev. 2002, 92, 527–548. [Google Scholar] [CrossRef]
  64. Hou, J.; Teo, T.S.H.; Zhou, F.; Lim, M.K.; Chen, H. Does industrial green transformation successfully facilitate a decrease in carbon intensity in China? An environmental regulation perspective. J. Clean. Prod. 2018, 184, 1060–1071. [Google Scholar] [CrossRef]
  65. Zhang, S.; Andrews-Speed, P.; Zhao, X.; He, Y. Interactions between renewable energy policy and renewable energy industrial policy: A critical analysis of China’s policy approach to renewable energies. Energy Policy 2013, 62, 342–353. [Google Scholar] [CrossRef]
Figure 1. Overall research methodology of this study.
Energies 14 04151 g001
Figure 2. Number of new energy enterprises in China from 1998 to 2013.
Energies 14 04151 g002
Figure 3. The spatial distribution of the driving factors across China in 2013.
Energies 14 04151 g003
Figure 4. NEI’s technical efficiency in China from 1998 to 2013.
Energies 14 04151 g004
Figure 5. The spatial distribution of NEI’s provincial technical efficiency across China in 1998 and 2013.
Energies 14 04151 g005
Figure 6. Coefficients estimated of FS (a), SO (b), TE (c), PGDP (d), and NE (e) in each region through GTWR.
Energies 14 04151 g006
Table 1. Previous research on the efficiency of China’s new energy industry.
ObjectiveIndustryScaleData SourcesMethodology
Zhao et al. [22]Delineate the technical efficiency of China’s wind power industryWind power industryEnterprise-level28 wind power listed enterpriseFour-stage DEA method
Lin et al. [14]Analyze the impact of government subsidies on innovation efficiency of China’s wind power industryWind power industryEnterprise-level40 wind power listed enterprisesStochastic frontier analysis
Lin et al. [13]Analyze the impact of government subsidies on innovation efficiency of China’s photovoltaic industryPhotovoltaic industryEnterprise-level44 photovoltaic listed enterprisesDEA method; Tobit model
Zhang et al. [23]Analyze the operating performance, industry agglomeration and spatial characteristics of China’s photovoltaic industryPhotovoltaic industryEnterprise-level58 photovoltaic listed enterprisesDEA method; spatial autocorrelation analysis
Wang et al. [24]Evaluate the innovation efficiency of China’s new energy industrySolar, wind and nuclear power industriesEnterprise-level38 listed enterprisesDEA method
Zeng et al. [25]Evaluate the investment efficiency of China’s new energy industry and investigates driving factorsNew energy industryEnterprise-level74 listed enterprisesFour-stage DEA method
Xu et al. [26]Conduct an empirical analysis for the technical efficiency of biomass energy in ChinaBiomass energyIndustry-level; Provincial levelData from recycling industryStochastic frontier analysis
Table 2. NEI’s provincial technical efficiency from 1998 to 2013 in China.
RegionProvince1998199920002001200220032004200520062007200820092010201120122013
Eastern ChinaBeijing0.4120.5960.7820.6530.5130.6370.4990.4020.3450.3190.3310.6521.2480.5200.3150.292
Tianjin0.4580.4580.5500.8190.5780.3680.7981.1030.9300.9661.1660.9721.0020.7150.6700.769
Hebei0.3880.7260.7190.7690.9091.1920.7540.7280.7970.7430.7310.7670.7970.6340.4640.437
Shanghai1.2600.3610.3110.4490.4380.3800.4550.4800.6920.4560.9620.5930.9220.7320.5510.437
Jiangsu0.8361.0670.6150.7200.7730.6831.3011.1151.2000.7900.9130.9940.9561.0500.8711.000
Zhejiang0.3400.2800.5500.5970.4600.5030.6650.6250.5440.4460.5670.5060.6900.5440.4660.409
Fujian0.8711.0370.5090.4030.2490.2880.2310.1850.3860.2410.2530.4180.3190.5230.5120.334
Shandong0.6601.0731.1341.0551.3491.0000.5520.8070.7140.7290.9181.1740.8750.9831.0101.035
Guangdong0.8931.2320.9161.0960.8261.7231.0090.8420.6710.5020.3860.5110.5270.4780.4050.368
Hainan1.0551.0090.9760.9610.8700.8601.1530.6380.8370.9070.8691.7940.2620.4520.4420.486
Liaoning0.1510.1450.1550.1950.1870.1660.2280.2800.4880.6310.3220.4360.6500.5430.5640.417
Average0.6660.7260.6560.7010.6500.7090.6950.6550.6910.6120.6740.8020.7500.6520.5700.544
Central ChinaShanxi0.0860.0860.0830.4530.7000.1940.5230.7290.2620.6871.1980.9400.4280.5030.4620.249
Anhui0.6010.2691.6020.2370.3030.1270.1580.1380.5490.5110.4790.5160.6130.6480.6350.601
Jiangxi0.1890.1892.0060.7791.6530.4580.2250.2960.4890.3270.5980.4980.6141.1150.8760.957
Henan0.1660.1890.2720.2210.2020.2100.2760.3000.3660.6390.5700.5680.6660.6800.6800.705
Hubei0.0860.1020.3620.4180.5420.4490.9060.3120.8600.3670.3760.3400.2970.3930.3490.415
Hunan0.4060.2460.1850.1980.2470.7731.2780.5770.6170.4530.6121.0910.7580.6850.6370.588
Jilin0.1660.1910.1970.3120.2580.8590.4080.3240.1240.1420.1460.4280.3610.5160.4970.419
Heilongjiang0.3810.1340.2280.1810.3030.2910.1390.2090.1770.1620.1890.2140.2270.2360.3330.303
Average0.2600.1760.6170.3500.5260.4200.4890.3610.4310.4110.5210.5740.4960.5970.5590.530
Western ChinaInner Mongolia0.1760.4660.3060.3380.3800.2780.2620.2930.1560.2020.2730.3540.3510.4990.4510.399
Guangxi0.2100.4230.3760.4630.5030.8940.6521.3750.8620.4150.4110.5460.6000.5961.2341.027
Chongqing0.2000.1770.1480.3740.5190.6370.1940.3120.2750.4080.3870.6930.7150.7950.6960.498
Sichuan0.2480.2570.2380.1610.1910.2710.3550.4200.3550.2690.2520.2730.3360.4710.3990.218
Yunnan0.2340.2500.3690.3000.8550.2840.2950.3420.3440.3760.3830.2520.3280.3710.2920.267
Shaanxi0.2040.1820.2290.1680.1670.2810.2400.2530.3180.4310.4190.5070.4470.4300.5671.036
Gansu0.2160.2160.2770.1650.1380.3420.2190.1470.1310.1600.1320.0900.4090.5240.5260.306
Qinghai0.5690.5690.5690.5690.5600.3980.6830.7620.7510.9621.1560.6431.0000.8250.4420.259
Ningxia1.0001.0001.0001.0001.0001.0001.2370.0750.5930.4710.5070.8210.4770.3660.2370.237
Xinjiang0.3280.2440.2620.2810.2550.5290.7790.7021.0300.8930.7951.8840.7810.8430.7340.684
Average0.3380.3780.3770.3820.4570.4910.4920.4680.4820.4590.4720.6060.5440.5720.5580.493
ChinaAverage0.4410.4540.5490.4940.5490.5540.5680.5090.5470.5040.5620.6720.6090.6090.5630.522
Table 3. Comparison result of OLS and GTWR.
R2Adjusted R2AICcResidual Squares
OLS0.2570.249751.687133.775
GTWR0.6270.623636.75167.297
Table 4. Spatial non-stationarity tests of variables for year 1998, 2006 and 2013.
Variables2 × SE (OLS)Interquartile
(1998)
Interquartile
(2006)
Interquartile
(2013)
lnFS0.0460.1360.1870.127
lnSO0.0120.0190.0640.080
lnTE0.0920.1280.2870.215
lnPGDP0.1170.2310.3390.378
lnNE0.0130.0340.0200.041
Publisher’s Note: MDPI stays neutral with regard to jurisdictional claims in published maps and institutional affiliations.

