Article

Wide Bandwidth and Inexpensive Current Sensor for Power Electronics—An Augmented LEM Current Sensor

Department of Power Electronics and Energy Control Systems, Faculty of Electrical Engineering, Automatics, Computer Science and Biomedical Engineering, AGH University of Science and Technology, al. Mickiewicza 30, 30-059 Krakow, Poland
*
Author to whom correspondence should be addressed.
Energies 2021, 14(14), 4194; https://doi.org/10.3390/en14144194
Submission received: 31 May 2021 / Revised: 1 July 2021 / Accepted: 9 July 2021 / Published: 12 July 2021

Abstract

:
This paper presents the overall concept of a wideband and cost-effective current sensor. The sensor consists of a paralleled Hall-based current sensor (LEM) and a wideband current transformer (CT). A significant improvement of the band range and the moderate cost of the proposed sensor enable it to be used both to measure the instantaneous value in order to precisely plot the current and to obtain signals for a closed-loop control system of high-frequency power electronic converters. The sensor should be considered as an Augmented LEM Current Sensor (ALCS), which allows it to measure low- and high-frequency current signals. Finally, it allows for the measurement of a bipolar current up to 40 A. The overall cost of the sensor, along with the previously mentioned benefits, is an important feature of the proposed sensor. The present paper presents the analytical concept of the sensor (ALCS), a theoretical approach using simulation analysis, and the experimental results, which clearly demonstrate the wide range of the sensor in dynamic and static measurements.

1. Introduction

Power electronic converters are used more and more often in industry and in households. Their advanced control algorithms usually require a current sensor to ensure appropriate working conditions [1]. Resistive sensors, with the largest band of 1 GHz, are called Current shunt resistors (CSR). The CSR [2] can also be designed for high currents [3] or, in some cases, to provide a band higher than 1 GHz [4]. Unfortunately, these types of sensors introduce resistance (losses) into the measuring circuit and do not ensure galvanic isolation of the measuring circuit from the power circuit. Therefore, there is a need to develop a sensor that will allow for non-invasive measurements with a wide band and current range. To ensure a wide bandwidth, a current transformer (CT) can be used, which provides galvanic isolation [5,6,7]. The CT cannot transfer the DC components of a measured current signal, which eliminates this type of sensor in many power electronics applications. The transformers designed especially for measuring signals at a large frequency range (above MHz) [8] are named High-Frequency Current Transformers (HFCTs). Comparing the current transformers and current shunt resistors, it can be concluded that both CSR and HFCT have wide transmission bands, which allow them to be used to measure the currents in power electronic systems [9]. The Rogowski Coil (RC) [9] is also worth mentioning, which, due to its small size, allows for easy application in power electronic devices: Due to its size, the coil can be placed, e.g., on the lead of the THT TO-220 or SMD TO-263 (and similar) package. The disadvantage of RC is its low-frequency response [10]. Galvanic isolation and the transfer of both the DC component and higher frequencies are ensured by Hall effect sensors [11,12,13,14,15,16]. The main advantages of Hall sensors is their frequency band, which is from 0DC to approx. 500 kHz (for −3 dB), small temperature drift, very good linearity (0.1%), and non-invasive measurement (no additional losses introduced).
The authors in [15,16,17,18] show a way to significantly increase the bandwidth of the Hall sensor. The described method allows for the addition of an HFCT that will be designed to carry signals with a much higher frequency than the Hall sensor. Such a procedure will include the full use of the low-pass characteristics of the Hall sensor and the high-pass characteristics of the current transformer [15]. The frequency characteristic of the current transformer in fact does not allow for the transfer of the highest frequencies [5,6,7], but these frequencies are above the target range of frequencies of the proposed sensor. The change in the core permeability and the inter-winding capacitance will limit the upper frequency of the transformer band. Additionally, there is also the problem of mismatching the amplification characteristics of both sensors [15], which is related to the resistances of the current transformer. An example of the application of tunnel magnetoresistance (TMR) sensors with RC is described in [17]. The high-bandwidth probe up to 315 MHz is described there too. The current surface probe (CSP), with a bandwidth up to 450 MHz, is presented in [18]. The CSP was verified in comparison to two different commercial current sensors. One of the examples is the Hall sensor by Allegro MicroSystems [19]. Such a system makes it possible to perform a current measurement, and it produces an equivalent voltage signal representing the tested current. Another method of isolated measurement is to use an isolated and a wideband—e.g., 1 MHz [20]—amplifier with a measuring resistor (CSR).
In comparison to the existing concepts [15,16,17,18], the novelty of the proposed Augmented LEM Current Sensor (ALCS) is the application of a commercial LEM-type sensor [21] with a current transformer. The proposed sensor can be easily developed with a small budget (less than 50$) and used to measure rapidly changing signals. For an overall comparison of the proposed current sensor, the relevant properties of the commercial current sensors have been compared in order to determine the advantages of each sensor type. As a result, Table 1 was developed for selected commercially available sensors and those described in the paper. From the comparison of the HALL + CT sensors and those described in the cited papers, it can be seen that the bandwidth of the proposed ALCS is much higher than that of competing solutions. Only the commercial Tektronix sensor has a bandwidth that is approximately 4 times higher [22]. However, the price of the sensor is the highest of all the sensors (≈ 4500$). The circuit described in [15] has the closest measurement parameters (a bandwidth that is a few MHz smaller and a current that is 10 A lower). The major disadvantage of this system is the need for a galvanic connection with the test lead, and the final price of the sensor is hard to estimate. The solution provided in [16] is similar to the proposed ALCS, because it uses commercially available components (Hall sensor and CT), but it is susceptible to noise in switching converters. Neither sensor has a current-type output signal, unlike the proposed ALCS. The ALCS consists of LEM and a CT, which are already optimized by the manufacturers. Both output signals from the elements are the current-type signals, which make them immune to interference. Current-type signals make it possible to mount sensor elements at a certain distance from the summing part of the system, which is also the novelty of the proposed system and a significant advantage.

2. Analytical Description of the Proposed Sensor

2.1. Principle of Operation

The LEM sensors provide galvanic isolation and allow for the measurement of bipolar currents. The problem of commercial sensors based on the Hall effect is the high-frequency response. The proposed sensor will allow all the advantages of the LEM sensor to be achieved but significantly increase the frequency band (response of fast-changing signals). The proposed solution can be considered as an inexpensive, expansive system for the LEM sensor (Figure 1).
In the proposed solution, a current transformer has been added to the LEM sensor in order to transfer fast-changing current components. The entire measuring system will consist of two sensors (LEM + CT) and provide two current measurement signals. The output signals will be summed in an analog circuit to produce a bipolar voltage signal representing the measured current (1). The sensor transmittance H s e n s o r ( s ) will consist of the sum of the LEM H L E M ( s ) and the current transformer H C T ( s ) transmittances:
H s e n s o r ( s ) = H L E M ( s ) + H C T ( s ) ,
Before the summation operation of the measurement signals, the gains of the measurement signals in an analog circuit were adjusted (Figure 1).

2.2. Hall-Based Sensor Model

Hall sensor transmittance can be presented as the quotient of the sensor output voltage U L E M ( s )   and the measured current I ( s ) :
H L E M ( s ) = U L E M ( s ) I ( s ) = K L E M 1 T L E M s + 1 ,
The values of the time constant ( T L E M ) and the gain ( K L E M ) can be determined based on the technical documentation of the LEM sensor. In the case of the track of the tested sensor, an RC low-pass filter ( H R C ( s ) ) was additionally introduced (Figure 1), whose gain and shift characteristics will be significant:
H R C ( s ) = U R C ( s ) U L E M ( s ) = K R C ( R C ) s + 1 ,
The cut-off frequency ( f H F R C ) of the RC filter system shown is:
f H F R C = 1 2 π R C ,

2.3. Current Transformer Model

The transmittance of a current transformer H C T ( s ) can be represented as a trans-resistance R T ( s ) :
H C T ( s ) = U C T ( s ) I ( s ) = R T ( s ) ,
Then, depending on the frequency band, the low-frequency response and the high-frequency response can be determined. For low frequencies, the CT behaves like a high-pass filter; therefore [5]:
R T   L F ( s ) = R m n · ( R F e ( R F e + R m + R C u ) ) · ( s s + ω L F ) ,
where n is the number of turns, R F e is the resistance representing the losses in the core, R C u is the resistance representing the losses in copper, and R m is the measuring resistor. The angular frequency can be expressed as:
ω L F = R F e · ( R m + R C u ) L · ( R F e + R m + R C u ) ,
where L is the magnetizing inductance. Assuming a small influence of the core losses and the transformer winding resistance, we obtain the simplified Formulas (8) and (9):
R T   L F ( s ) = R m n · ( s s + ω L F ) ,
ω L F = R m L ,
Finally, the lower cut-off frequency f L F for the high-pass filter representing the low-frequency CT is:
f L F = R m 2 π L
For the highest frequencies, CT behaves like a low-pass filter, therefore taking into account the inter-turn capacitance C p :
R T   H F ( s ) = R F e n L C p s 2 + ( R F e L + 1 R m C p ) s + 1 L C p · ( R F e R m + 1 )
Assuming a small influence of the core resistance and the winding resistance R F e of the transformer, we obtain the simplified Formula [5]:
R T   H F ( s ) = 1 n C p · 1 s + ( 1 R m C p )
The high cut-off frequency f H F depends on the parasitic capacity of the filter and can be determined from the formula:
f H F = 1 2 π R m C p
The presented analysis of the transformer model allows for determining the key parameters of the sensor.

3. Practical Realization of the Probe and Simulation Results

3.1. Practical Realization

The practical ALCS system based on the concept presented in Figure 2 was prepared on a PCB. The PCB was designed based on the schematic (Figure 3). The Hall sensor LA-55-P [21] was supplied with following voltages: +15 V/−15 V. The supply voltage was filtered by a common mode choke (CMC) with an inductance of 3 × 640 μH. The power supply for the AD8000TRDZ operational amplifier circuit [27] was provided by linear stabilizers (Zener diode—TZMB6V2-GS08). The current transformer, with a ratio of 100:1, was made of Mn-Zn ferrite core (magnetizing inductance L = 630 μH). The system uses a variable resistor for manual probe zeroing.

3.2. Simulation Analysis

The schematic diagram of the measurement system was simulated in the LTspice program. In the performed simulation, the model of the AD8000TRDZ operational amplifier model was used [27]. The parameters of the LEM with the filter and the current transformer were determined based on the measurement using an impedance analyzer (HM8118 LCR Bridge/Meter).
The frequency domain responses were recorded and are shown in Figure 4—the results of the sensor’s gain. Table 2 contains a comparison of the limit frequencies for the tested CT. For applications such as fast slope measurement, bandwidth may be the most important figure of merit, and ALCS can be used. Based on Figure 4, the bandwidth of ALCS for −3 dB is 144.54 MHz).

4. Experimental Results

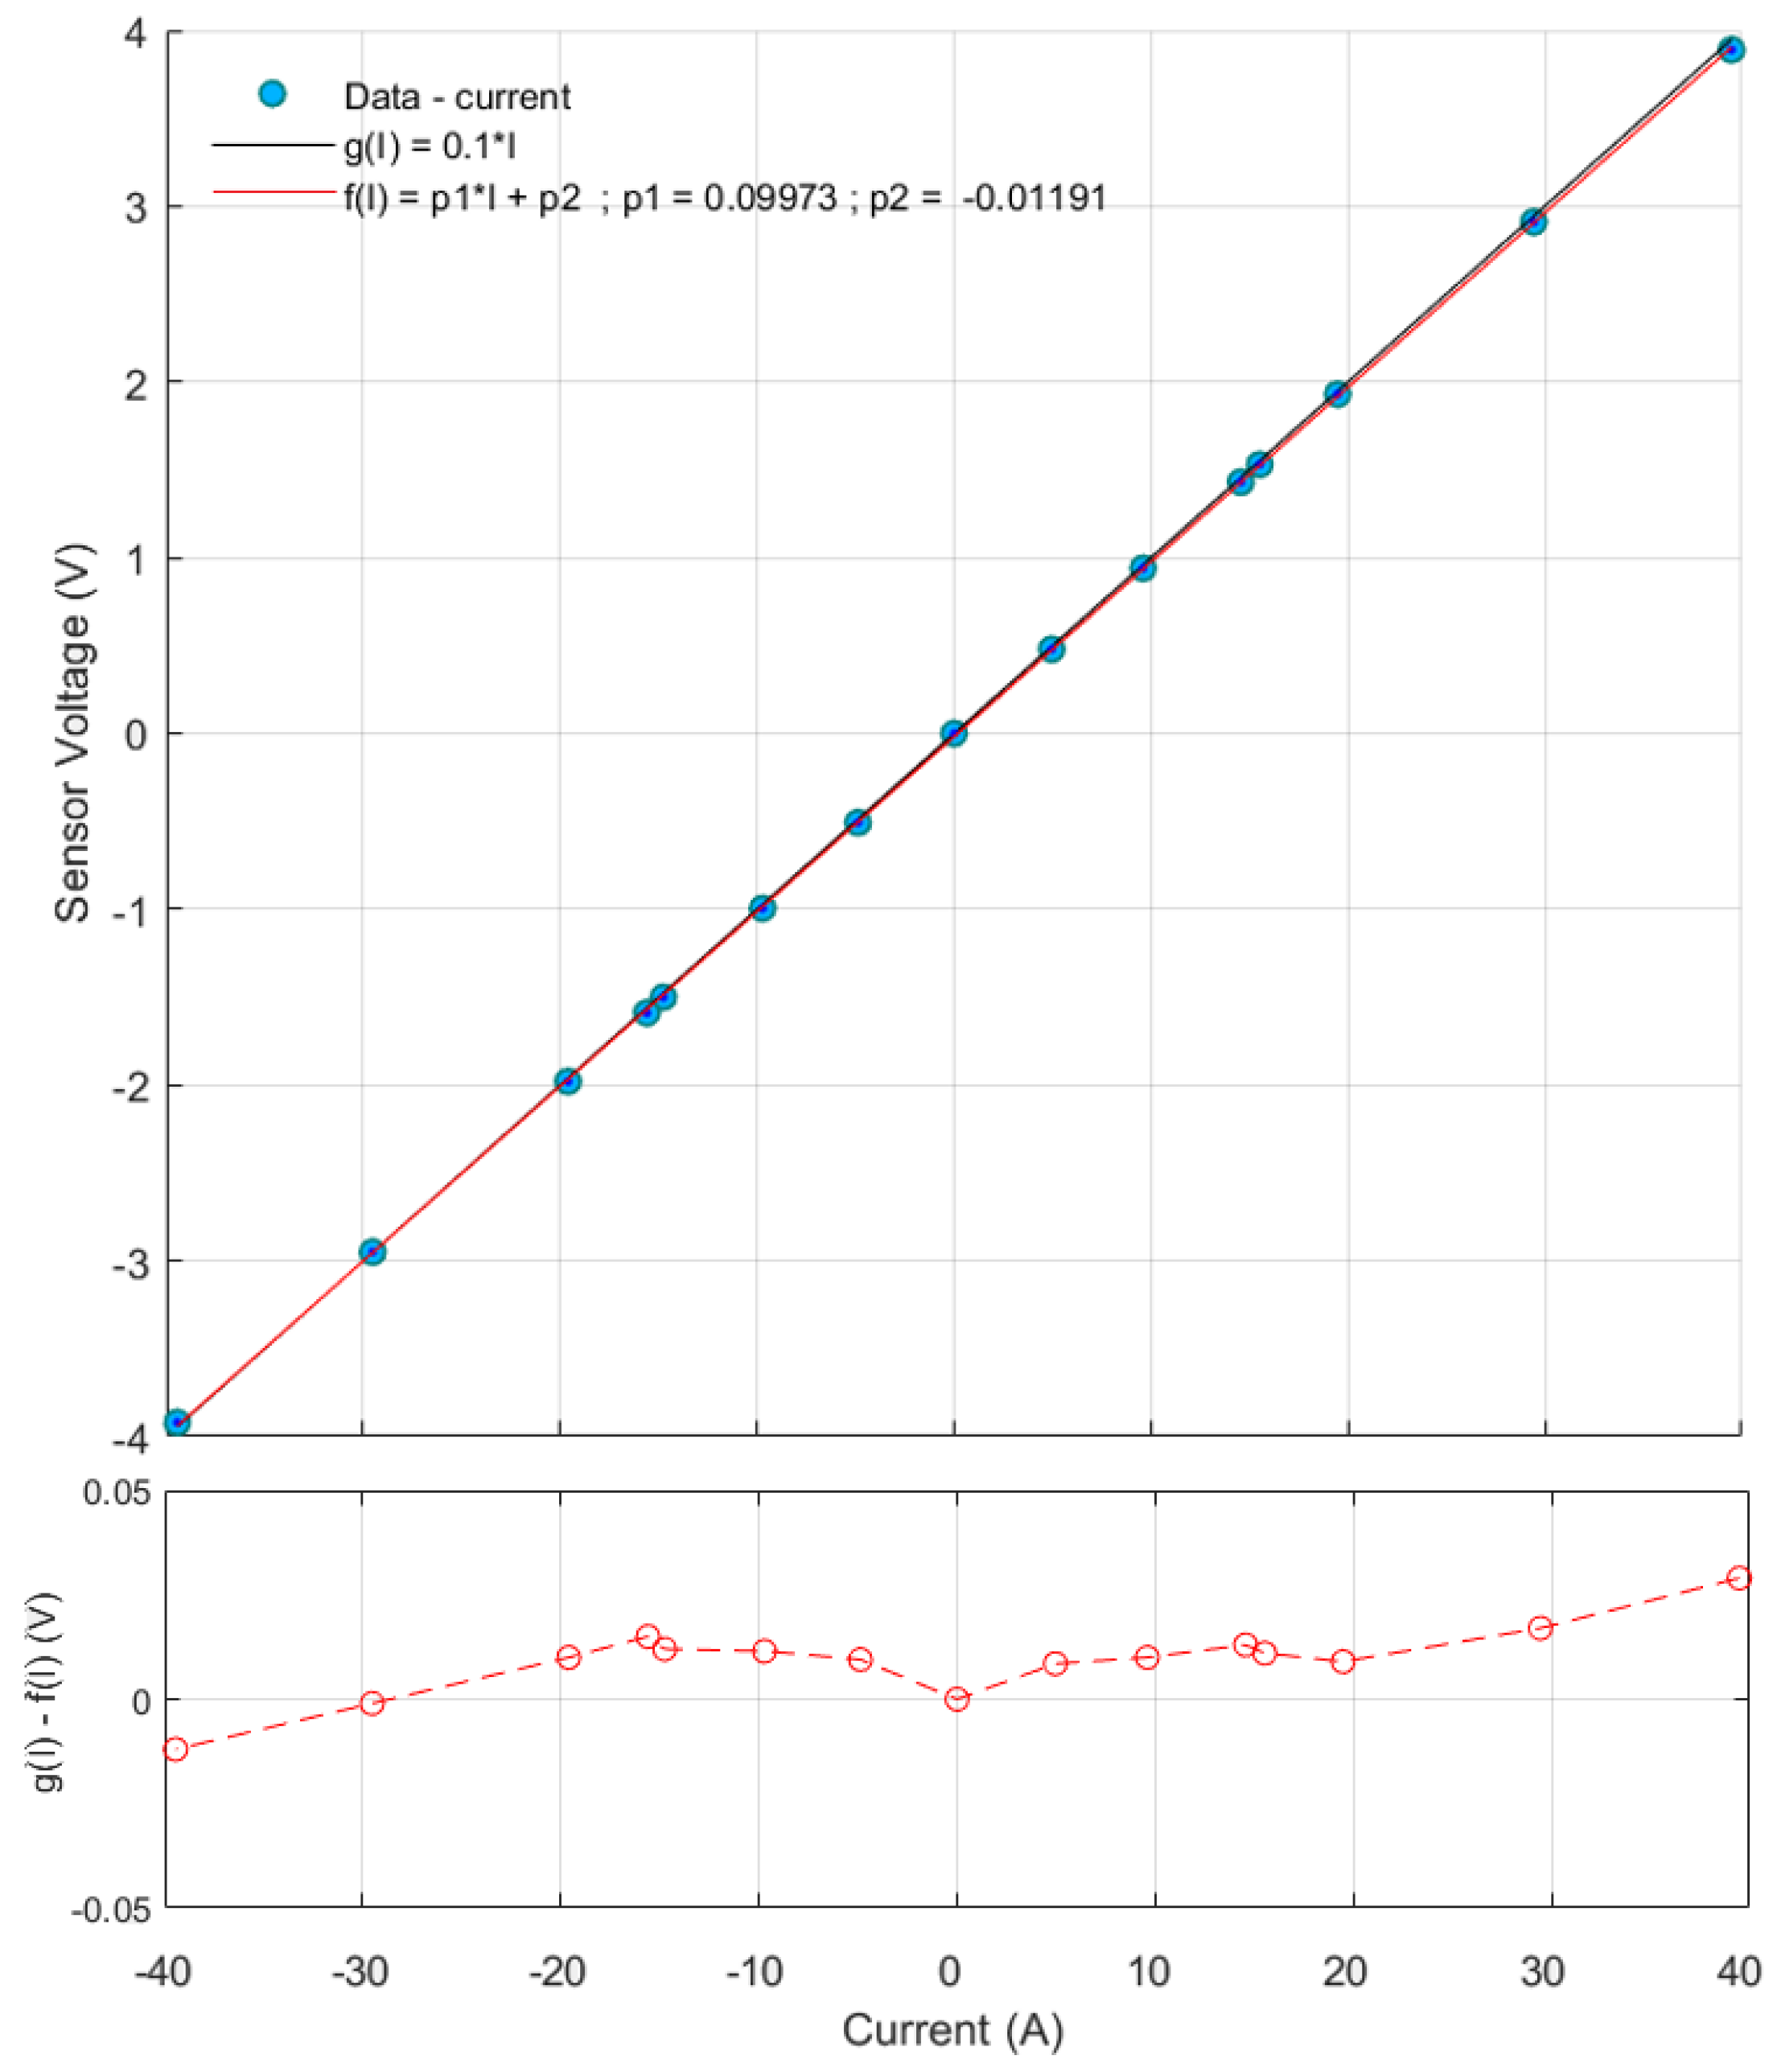
4.1. Static Characteristic

The first test of the proposed sensor was performed to identify the output voltage characteristics as a function of the measured current. The test was carried out using a DC voltage source and a 4.7 Ω (1000 W) load resistor. The measured characteristics are presented in Figure 5.
The measurement data were approximated by the function f(I) and the theoretical curve g(I). The maximum relative percentage error for the measurement of the static characteristic with respect to the theoretical curve was 1.87%. The most significant error can be obtained during the measurement of small currents in the range from 0 to 5 A. The static characteristic is mainly dependent on the parameters of the Hall sensor, which is responsible for the transfer of DC components in the ALCS sensor.

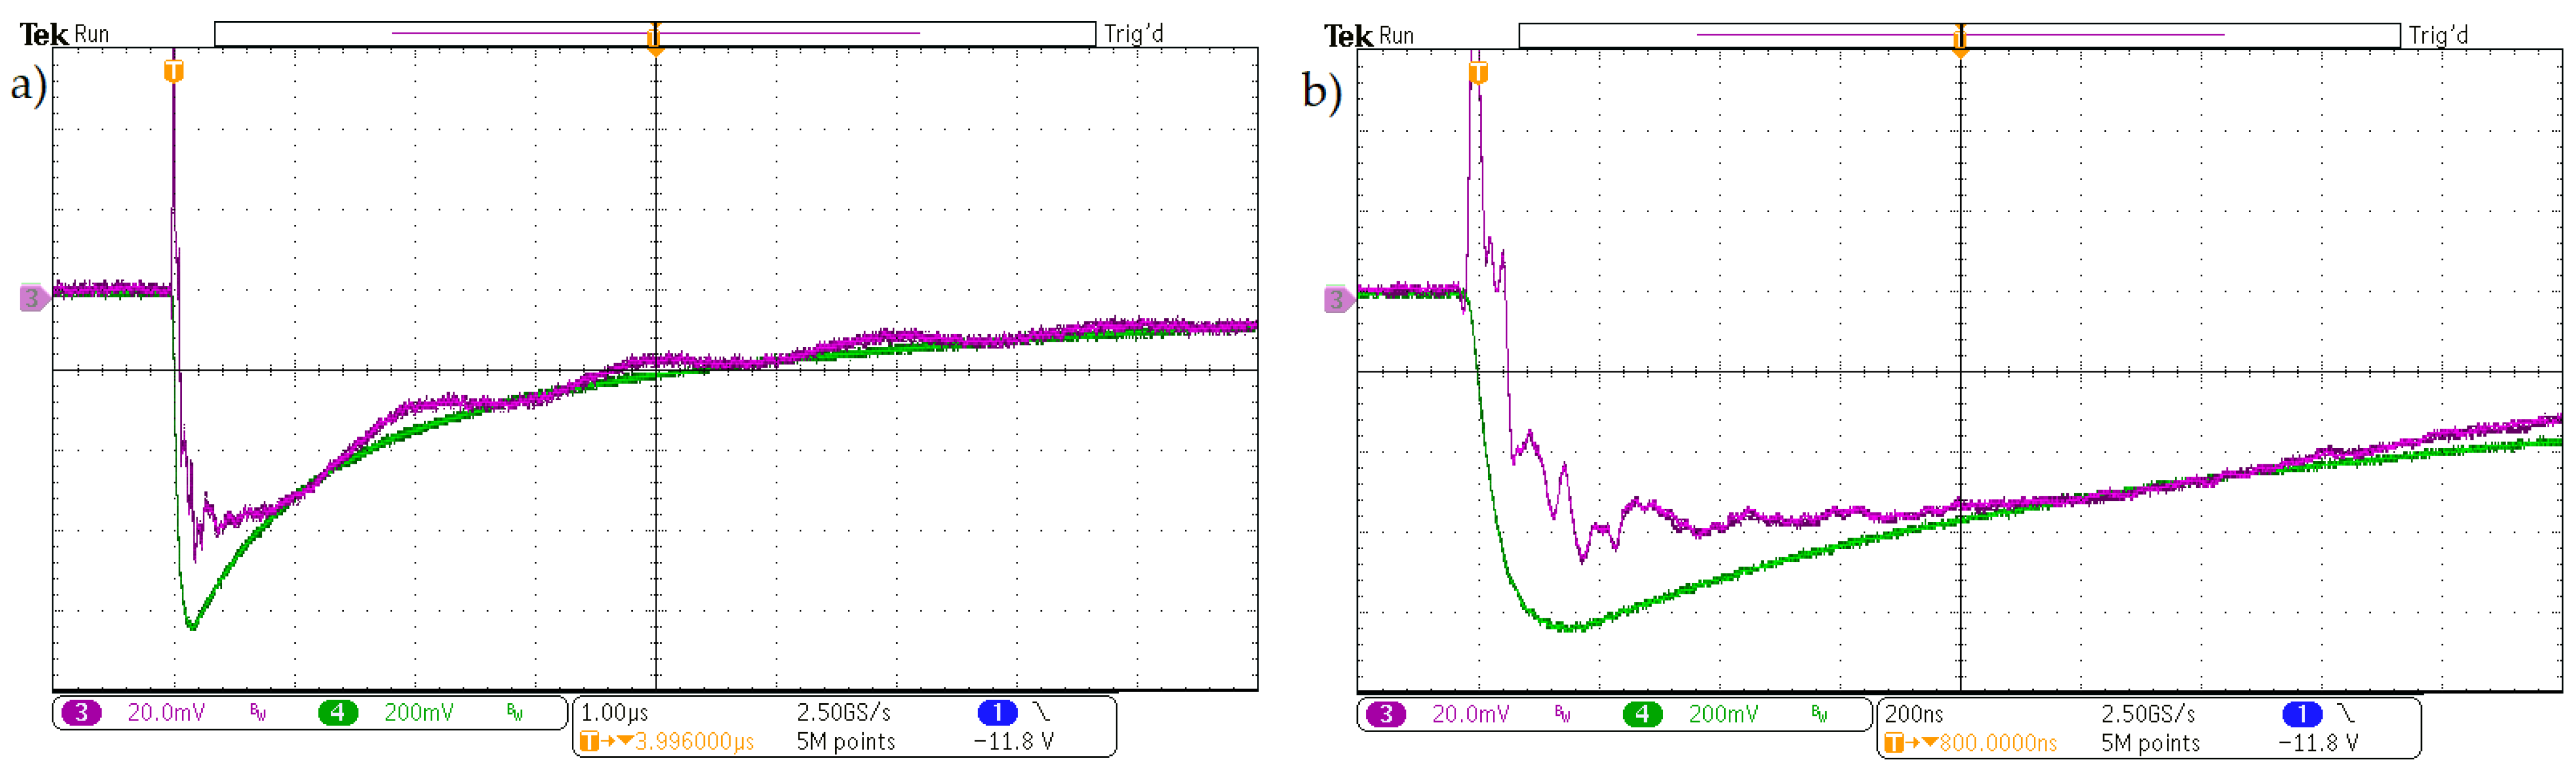
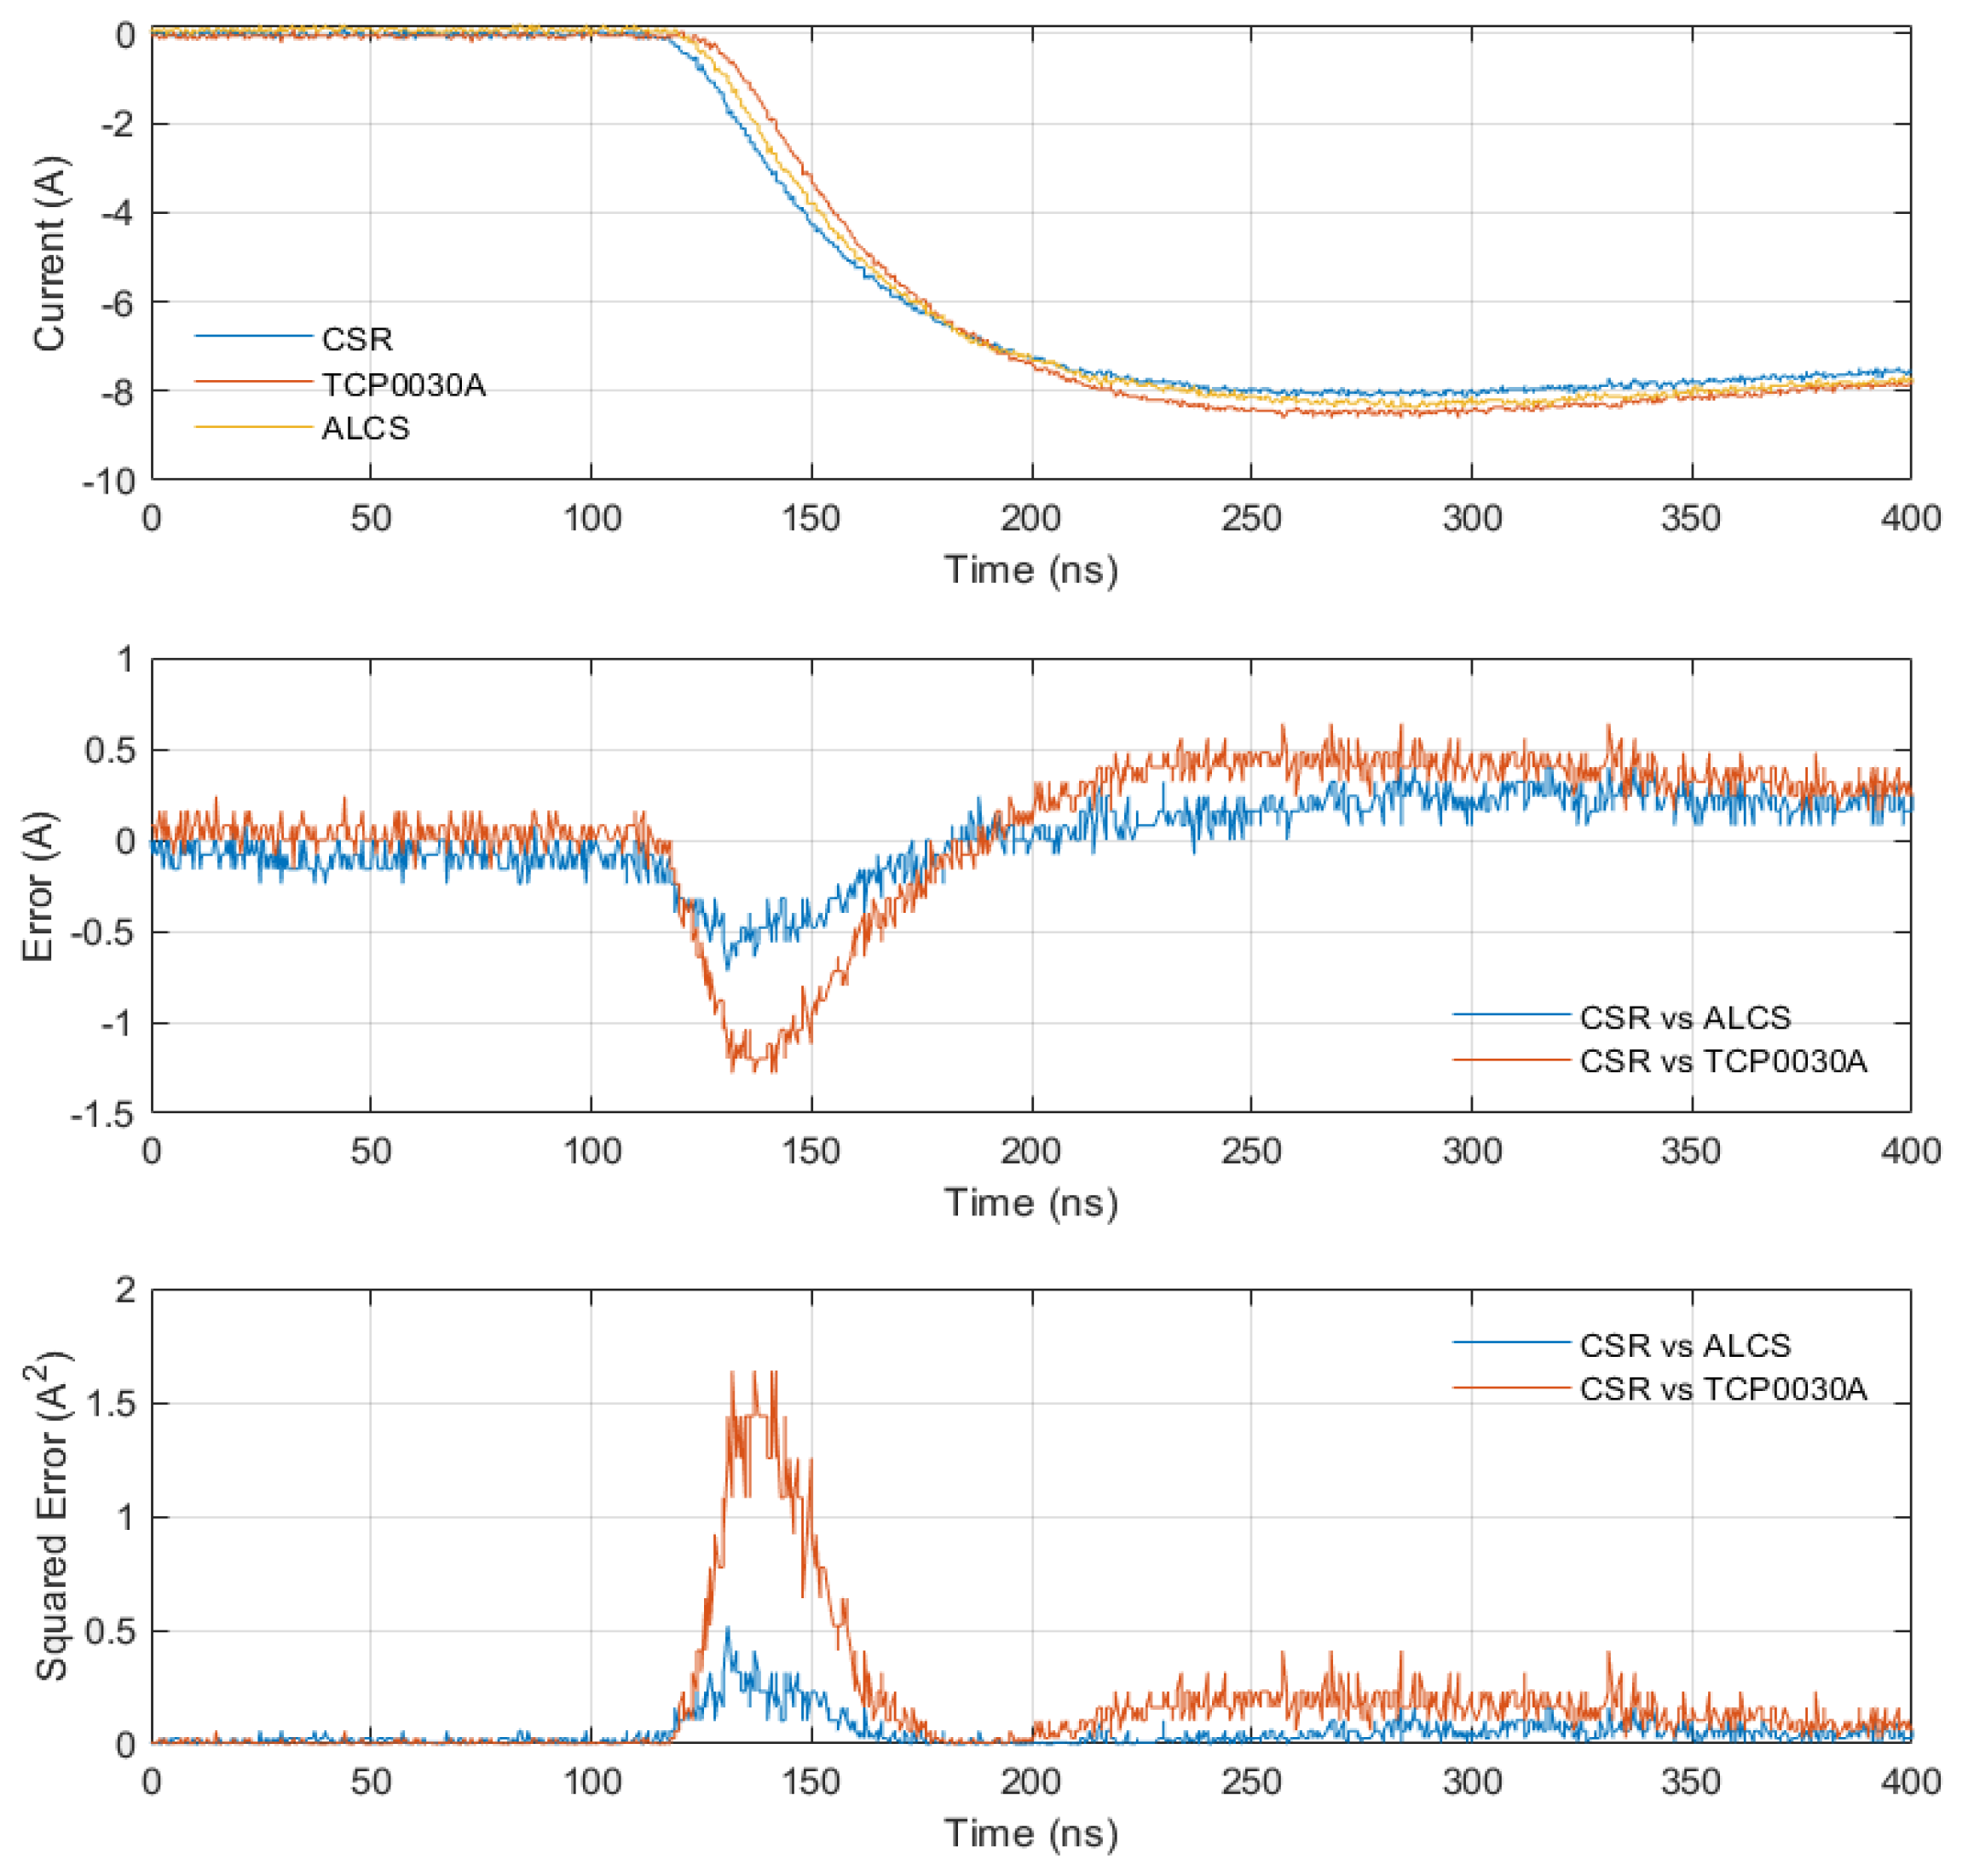
4.2. Dynamic Characteristic

The sensor was tested by a simple current pulse generator to obtain the dynamic response. Figure 6 presents the test circuit. The electrolytic capacitor (1 μF) was charged by a constant voltage source vz and subsequently impulse-discharged through the MOSFET. Such a simple procedure will allow for the generation of a current pulse and to check the dynamics of the proposed current sensor by comparing it with other commercially available, high-quality sensors (CSR, LA 55-P, TCP0030A [22]).
Figure 7 shows the measurement results of the current probe with the commercial sensor, LA 55-P. Based on the results (Figure 7), a significant difference could be noticed. The measurements were made using a Tektronix MDO3104 [28] oscilloscope (1 GHz and 5 GS/s). The ALCS sensor responds faster than the LA 55-P and concurrently eliminates the high-frequency oscillations seen in the LEM sensor output. Therefore, the improved dynamics of the ALCS allows for a comparison with professional measuring probes (Figure 6), such as TCP0030A and the CSR (the measurement of the vR voltage on the CSR was performed with a compensated passive probe, TPP1000 [29]).
All the current sensors have been used to measure the same current (Figure 8). The TCP0030A probe can work with a maximum bandwidth of 120 MHz (CH2), while the TPP1000 probe (CH1) and the proposed ALCS (CH4) have a bandwidth of 1 GHz, which corresponds to the full bandwidth of the oscilloscope. Due to numerous measurement noises, the LA 55-P sensor was limited to 20 MHz, which is still significantly beyond the bandwidth declared by the manufacturer [21].
The results of the falling edge comparison for the TPP1000 probe, CSR, and the proposed ALCS probe were analyzed in the MATLAB program. The results were collected for one frequency range by limiting the bandwidth of all oscilloscope channels to 20 MHz, which allowed for a comparison of the delay for all the sensors under similar operating conditions. The current measured by CSR with a passive voltage probe was defined as the reference current signal. Two differences (CSR—ALCS and CSR—TCP), as functions of time, were calculated (Figure 9), and the analyses are collected in Table 3. The results clearly allow for defining the advantages of the proposed sensor (Figure 9 and Table 3).
The proposed sensor (ALCS) allows a faster response (RD—Table 3) to be achieved, compared to the TCP0030A, and a smaller step response error (PVD—Table 3). The faster response of the ALCS sensor is a big advantage, compared to a commercial sensor (TCP0030A). The ALCS circuit does not have an output filter, but a filter can be used in the event of large overshoots or oscillations in faster slopes, which will eliminate the overshoots and oscillations but reduce the rise time of the measured current. The delay (RD) in the Tektronix system is most likely due to the use of filters in the system (the probe bandwidth is limited to 120 MHz), but after a short delay, the TCP0030A probe rises rapidly from 10% to 90%. Tektronix TCP0030A has a better TDRPV value than ALCS. The analysis shows that the matching error is smaller for the proposed ALCS sensor, which in the case of calculating the instantaneous current will result in a smaller error. The overall time response is in favor of ALCS (based o the n RMSE value from Table 3 and Figure 9).

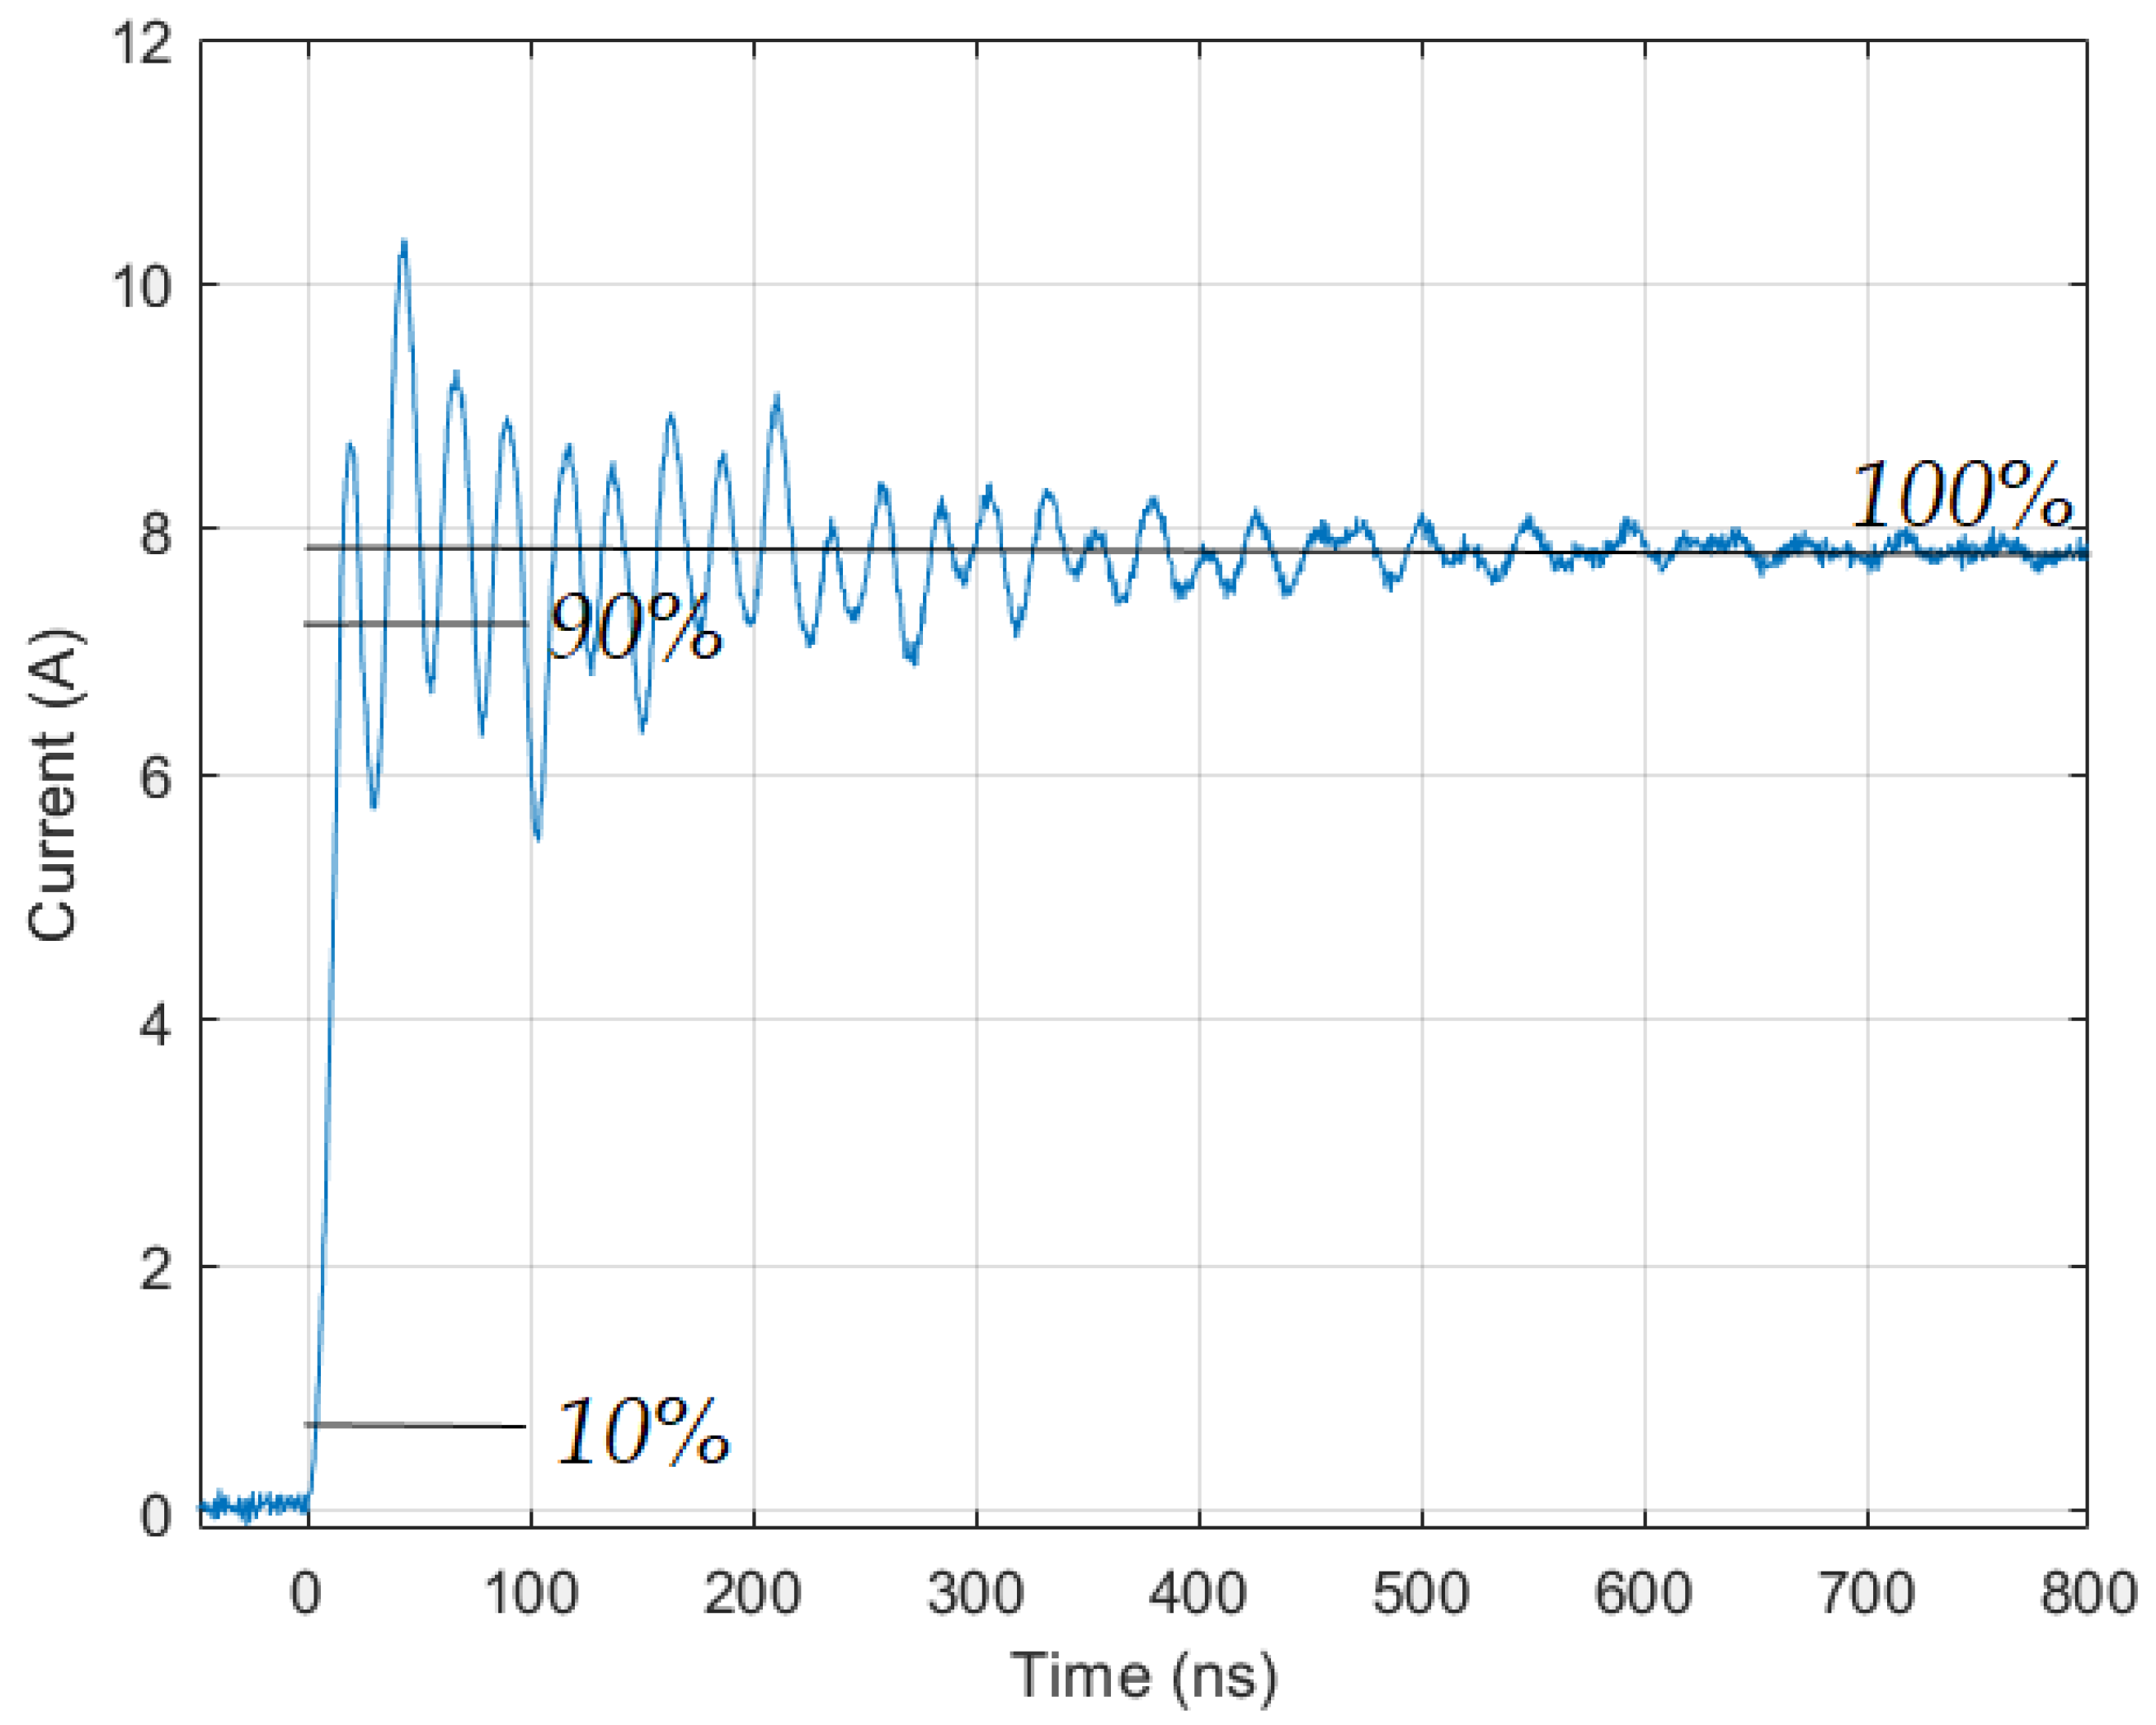
4.3. Time-Domain Bandwidth Investigation

The identified rising and falling slopes can be used to determine the sensor band. Most often, the rise and fall times are measured between 10% and 90% of the set value. Several patterns can be distinguished to approximate the required bandwidth [30,31]. In all cases, they are based on a time-domain analysis. The GaN-based Half bridge GS66508T/GS66516T-EVBDB [32], with a low inductance resistor, has been used to obtain a fast-rising current slope (Figure 10).
The bandwidth has been calculated based on Equation (14) [30,31]:
f B W U F 0.35 min ( t r i s e , t f a l l )
Based on the calculated value of the ALCS sensor bandwidth, the calculated bandwidth is equal to 38.33 MHz. In some publications [17,30], a different constant value in Equation (14) is used. The value changes up to 1.35, and the final bandwidth is significantly increased. The simulated bandwidth was equal to 144.54 MHz, which is close to the result of (14), with a constant value equal to 1.35 (147.86 MHz). The difference between the simulation value and the actual value of (14) may be due to the impedance analysis accuracy in the measured CT parameters region.

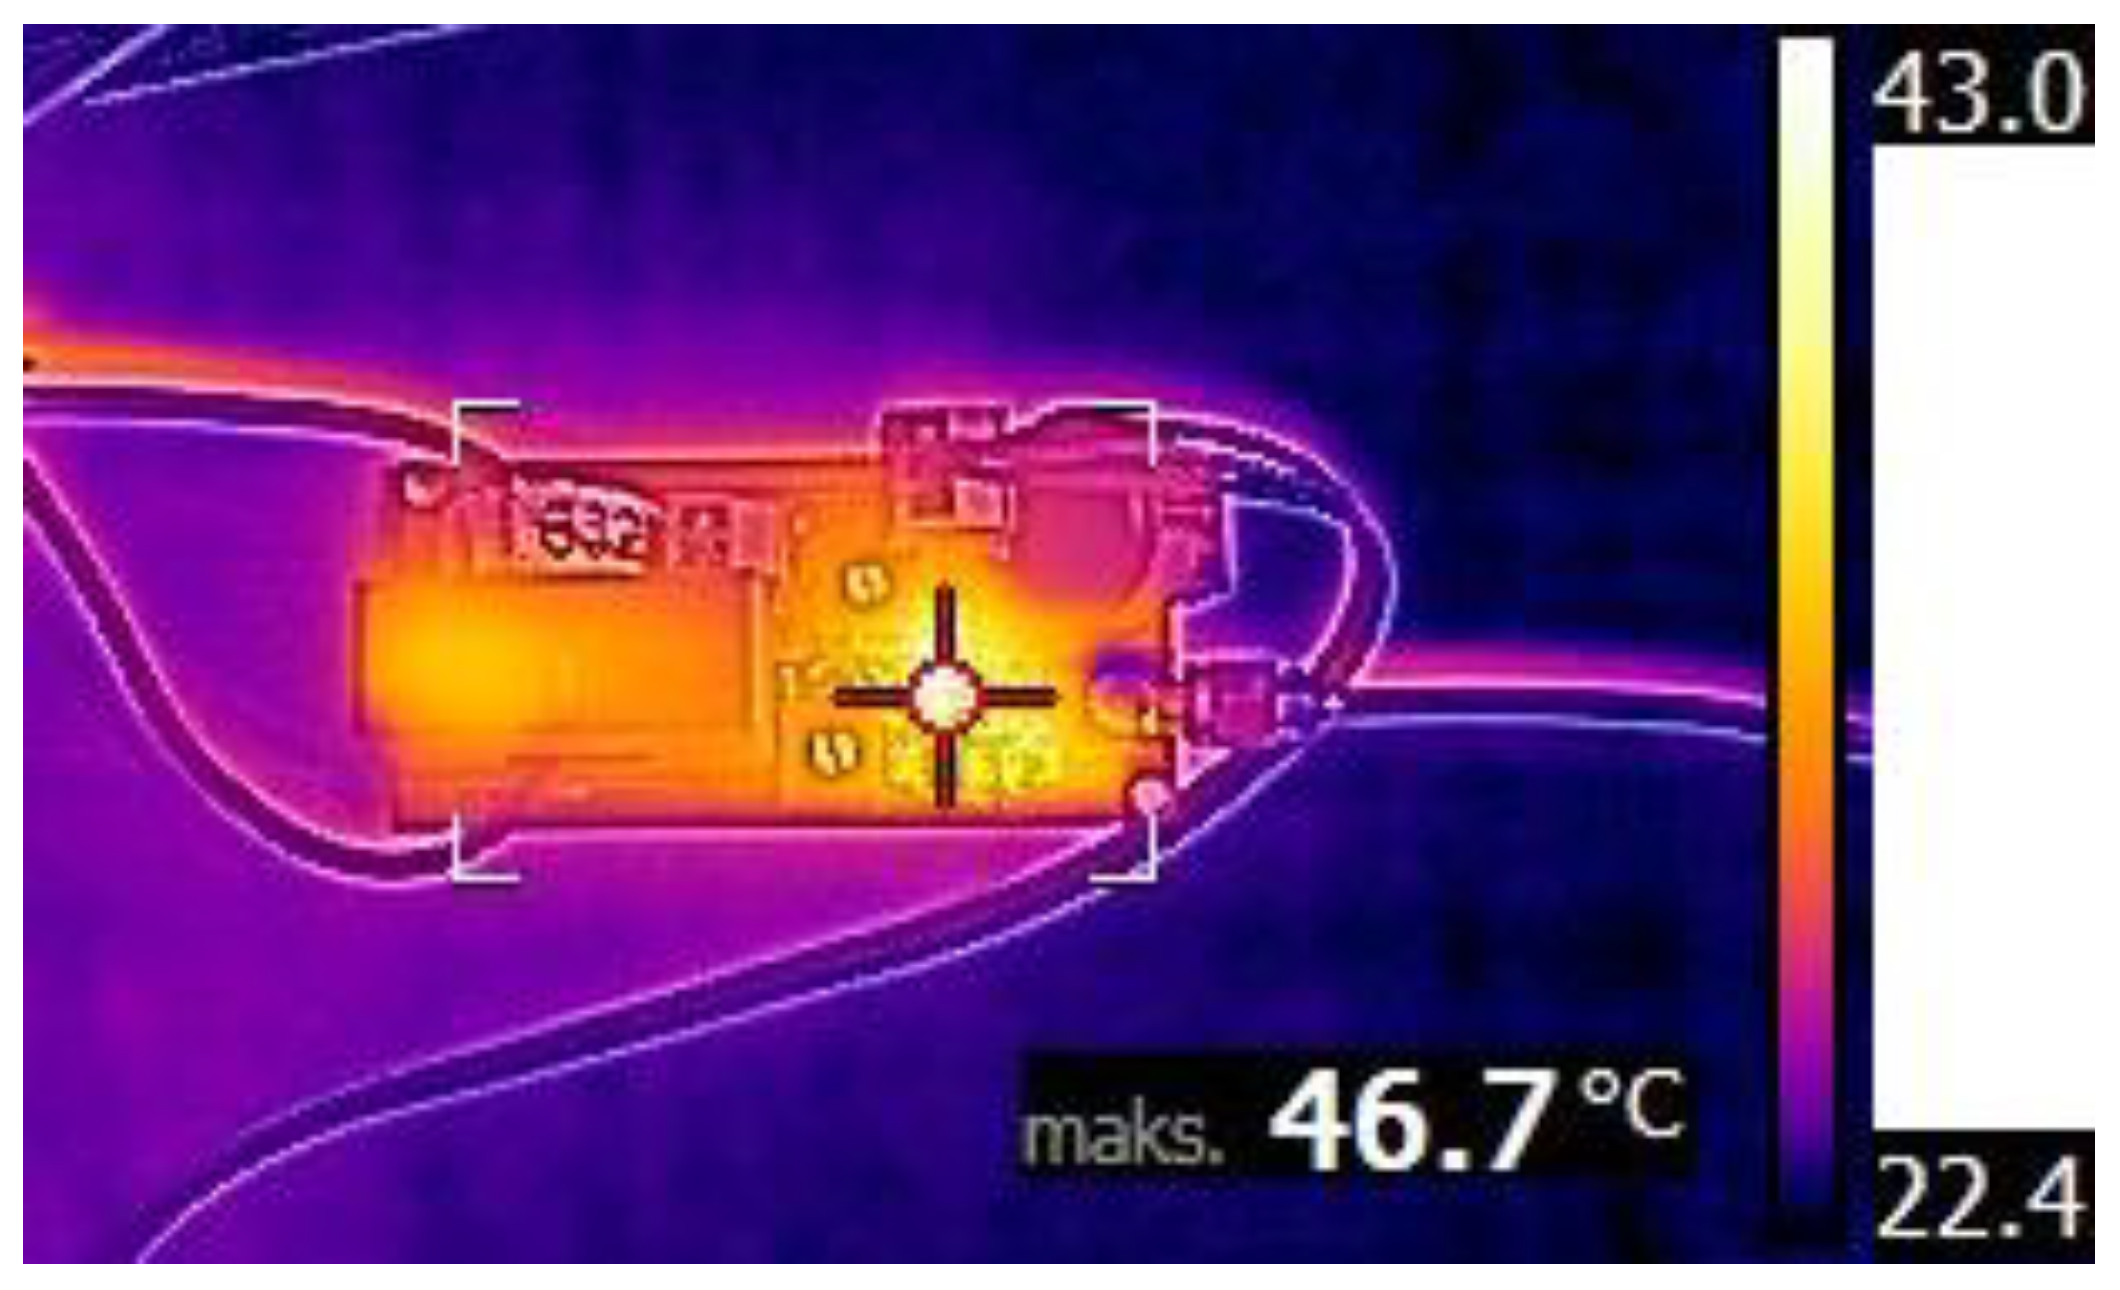
4.4. Temperature Analysis of the Steady State

An infrared image was taken during the high current measurement (40 A) by ALCS. Figure 11 shows the temperature field of the proposed ALCS sensor. The hot spot (+46.7 °C) is the operational amplifier. Another important area of high temperature is the area of the CT and the LA55-P sensor. These components are exposed to a high temperature caused by the measured current. The CT-related losses (losses in copper and core) will heat the transformer and should also be taken into account.

5. Conclusions

The present paper presents a concept of the current sensor, which was made as an extended industrial LEM current sensor. A general comparison with commercially available sensors and sensors from the referenced papers shows that the ALCS has a better bandwidth and current range. The research results presented in this paper confirm that the proposed current sensor has various superior qualities, such as a much wider band than the original LEM sensor (extended high frequency band—from kHz to MHz). The sensor is able to measure bipolar currents up to 40 A, with galvanic isolation. The sensor has a safe voltage output signal of 1 V = 10 A (theoretical gain) and the same voltage supply system as the commercial LEM sensor (+15 V, 0 V, and −15 V). Its low sensor modification cost (an amplifier and a current transformer are the most expensive additional elements) makes it an inexpensive sensor in comparison to the commercial high-band (up a few MHz) sensors. The ALCS uses commercially available elements (CT and LEM). Both sensors have a current-type output signal, which is considered to be an important novelty of the sensor. The current-type output signals significantly reduce the noise impact to the measured current signal.

Author Contributions

Conceptualization, M.C. and M.B.; Data curation, J.S.; Formal analysis, A.D., M.B. and R.D.; Funding acquisition, A.S.; Investigation, M.C.; Methodology, M.C. and A.D.; Resources, A.S.; Supervision, A.D. and A.S.; Validation, R.D.; Visualization, M.C.; Writing—original draft, M.C. and A.D.; Writing—review & editing, M.C. and M.B. All authors have read and agreed to the published version of the manuscript.

Funding

This work was supported by The National Centre for Research and Development of Poland, grant number: TECHMATSTRATEG1/347200/11/NCBR/2017.

Institutional Review Board Statement

Not applicable.

Informed Consent Statement

Not applicable.

Conflicts of Interest

The authors declare no conflict of interest.

References

  1. Costa, F.; Poulichet, P.; Mazaleyrat, F.; Laboure, E. The current sensors in power electronics, a review. EPE J. 2001, 11, 7–18. [Google Scholar] [CrossRef]
  2. Pogliano, U.; Bosco, G.C.; Serazio, D. Coaxial Shunts as AC–DC Transfer Standards of Current. IEEE Trans. Instrum. Meas. 2009, 58, 872–877. [Google Scholar] [CrossRef]
  3. Filipski, P.S.; Boecker, M.; Garcocz, M. 20-A to 100-A AC–DC Coaxial Current Shunts for 100-kHz Frequency Range. IEEE Trans. Instrum. Meas. 2008, 57, 1637–1641. [Google Scholar] [CrossRef]
  4. Zhang, W.; Zhang, Z.; Wang, F.; Brush, E.V.; Forcier, N. High-Bandwidth Low-Inductance Current Shunt for Wide-Bandgap Devices Dynamic Characterization. IEEE Trans. Power Electron. 2021, 36, 4522–4531. [Google Scholar] [CrossRef]
  5. Kondrath, N.; Kazimierczuk, M.K. Bandwidth of Current Transformers. IEEE Trans. Instrum. Meas. 2009, 58, 2008–2016. [Google Scholar] [CrossRef]
  6. Cataliotti, A.; di Cara, D.; di Franco, P.A.; Emanuel, A.E.; Nuccio, S. Frequency response of Measurement Current Transformers. In Proceedings of the 2008 IEEE Instrumentation and Measurement Technology Conference, Victoria, BC, Canada, 12–15 May 2008; pp. 1254–1258. [Google Scholar] [CrossRef]
  7. Rodrigo-Mor, A.; Muñoz, F.A.; Castro-Heredia, L.C. Principles of Charge Estimation Methods Using High-Frequency Current Transformer Sensors in Partial Discharge Measurements. Sensors 2020, 20, 2520. [Google Scholar] [CrossRef] [PubMed]
  8. Luo, G.; Zhang, D. Study on performance of developed and industrial HFCT sensors. In Proceedings of the 2010 20th Australasian Universities Power Engineering Conference, Christchurch, New Zealand, 5–8 December 2010; pp. 1–5. [Google Scholar]
  9. Li, H.; Beczkowski, S.; Munk-Nielsen, S.; Lu, K.; Wu, Q. Current measurement method for characterization of fast switching power semiconductors with Silicon Steel Current Transformer. In Proceedings of the 2015 IEEE Applied Power Electronics Conference and Exposition (APEC), Charlotte, NC, USA, 15–19 March 2015; pp. 2527–2531. [Google Scholar] [CrossRef]
  10. Ahmed, A.; Coulbeck, L.; Castellazzi, A.; Johnson, C.M. Design and test of a PCB Rogowski coil for very high dI/dt detection. In Proceedings of the 2012 15th International Power Electronics and Motion Control Conference (EPE/PEMC), Novi Sad, Serbia, 4–6 September 2012; pp. DS1a.2-1–DS1a.2-4. [Google Scholar] [CrossRef]
  11. Sun, C.; Wen, Y.; Li, P.; Ye, W.; Yang, J.; Qiu, J.; Wen, J. Self-Contained Wireless Hall Current Sensor Applied for Two-Wire Zip-Cords. IEEE Trans. Magn. 2016, 52, 8600204. [Google Scholar] [CrossRef]
  12. Xu, C.; Liu, J.; Zhang, Q.; Xu, C.; Yang, Y. Investigation of the thermal drift of open-loop Hall Effect current sensor and its improvement. In Proceedings of the 2015 IEEE International Workshop on Applied Measurements for Power Systems (AMPS), Aachen, Germany, 23–25 September 2015; pp. 19–24. [Google Scholar] [CrossRef]
  13. Weiss, R.; Itzke, A.; Reitenspieß, J.; Hoffmann, I.; Weigel, R. A Novel Closed Loop Current Sensor Based on a Circular Array of Magnetic Field Sensors. IEEE Sens. J. 2019, 19, 2517–2524. [Google Scholar] [CrossRef]
  14. Dalessandro, L.; Karrer, N.; Kolar, J.W. High-Performance Planar Isolated Current Sensor for Power Electronics Applications. IEEE Trans. Power Electron. 2007, 22, 1682–1692. [Google Scholar] [CrossRef]
  15. Dalessandro, L.; Karrer, N.; Kolar, J.W. A novel isolated current sensor for high-performance power electronics applications. In Proceedings of the Twenty-First Annual IEEE Applied Power Electronics Conference and Exposition, Dallas, TX, USA, 19–23 March 2006; p. 8. [Google Scholar] [CrossRef]
  16. Burkhard, U. Open-source wideband (DC to MHz range) isolated current sensor. HardwareX 2019, 5. [Google Scholar] [CrossRef]
  17. Ziegler, P.; Tröster, N.; Schmidt, D.; Ruthardt, J.; Fischer, M.; Roth-Stielow, J. Wide Bandwidth Current Sensor for Commutation Current Measurement in Fast Switching Power Electronics. In Proceedings of the 2020 22nd European Conference on Power Electronics and Applications (EPE’20 ECCE Europe), Lyon, France, 7–11 September 2020; pp. 1–9. [Google Scholar] [CrossRef]
  18. Li, K.; Videt, A.; Idir, N. GaN-HEMT fast switching current measurement method based on current surface probe. In Proceedings of the 2014 16th European Conference on Power Electronics and Applications, Lappeenranta, Finland, 26–28 August 2014; pp. 1–10. [Google Scholar] [CrossRef]
  19. Allegro, MycroSystems, Inc. Linear Hall Sensors. 2005. Available online: https://www.allegromicro.com/en/products/sense/current-sensor-ics/zero-to-fifty-amp-integrated-conductor-sensor-ics (accessed on 20 May 2021).
  20. Silicon Laboratories. Si8920 Data Sheet. Available online: https://www.silabs.com/ (accessed on 20 May 2021).
  21. LEM. Current Transducer LA 55-P 17 September 2018. Available online: https://www.lem.com/ (accessed on 13 May 2021).
  22. Tektronix, Inc. TCP0030A Datasheet 30 A AC/DC Current Probe. Available online: https://www.tek.com/datasheet/30-ac-dc-current-probe (accessed on 27 May 2021).
  23. Coaxial Shunts T&M RESEARCH PRODUCTS, Inc. Available online: http://www.ib-billmann.de/bilder/pdf/shunts_tech.pdf (accessed on 28 June 2021).
  24. Pearson Electronics. Clamp on Current Monitors. Available online: https://www.pearsonelectronics.com/products/clamp-on-current-monitors (accessed on 28 June 2021).
  25. Power Electronic Measurements-PEM. CWT Ultra-Mini. Available online: http://www.pemuk.com/Userfiles/CWTum/CWTUM_DS_Feb_2020.pdf (accessed on 30 June 2021).
  26. ABB Entrelec. MP and EL Industry Current Sensors. Available online: https://search.abb.com/library/Download.aspx?DocumentID=1SBC140156C02__&LanguageCode=en&DocumentPartId=&Action=Launch (accessed on 30 June 2021).
  27. Analog Devices, Inc. AD8000, 1.5 GHz, Ultrahigh Speed Op Amp. Available online: https://www.analog.com/ (accessed on 27 May 2021).
  28. Tektronix, Inc. MDO3000 Mixed Domain Oscilloscope. Available online: https://www.tek.com/oscilloscope/mdo3000-mixed-domain-oscilloscope (accessed on 27 May 2021).
  29. Tektronix, Inc. TPP1000 Passive Voltage Probes. Available online: https://www.tek.com/datasheet/passive-voltage-probes (accessed on 27 May 2021).
  30. Nitzsche, M.; Zehelein, M.; Tröster, N.; Roth-Stielow, J. Precise Voltage Measurement for Power Electronics with High Switching Frequencies. In Proceedings of the PCIM Europe 2018, International Exhibition and Conference for Power Electronics, Intelligent Motion, Renewable Energy and Energy Management, Nuremberg, Germany, 5–7 June 2018. [Google Scholar] [CrossRef]
  31. Zhang, Z.; Guo, B.; Wang, F.F.; Jones, E.A.; Tolbert, L.M.; Blalock, B.J. Methodology for Wide Band-Gap Device Dynamic Characterization. IEEE Trans. Power Electron. 2017, 32, 9307–9318. [Google Scholar] [CrossRef]
  32. GS66508T/GS66516T-EVBDB GaN EHEMT Daughter Board and GS665MB-EVB Evaluation Platform User’s Guide. Available online: https://gansystems.com/wp-content/uploads/2018/04/GS665xxT-EVBDB_UserGuide_rev_20180126.pdf (accessed on 28 June 2021).
Figure 1. General concept of the ALCS as a bloc diagram.
Energies 14 04194 g001
Figure 2. Schematic (simplified) of the proposed sensor with the LA 55-P sensor and current transformer with the ADS8000TRDZ operational amplifier.
Energies 14 04194 g002
Figure 3. Prototype of the proposed sensor—PCB realization of ALCS.
Energies 14 04194 g003
Figure 4. Magnitude as a function of frequency—(a) LEM with CT; and (b) output characteristics of the ALCS–BODE plot, with marked characteristic points (−3 dB).
Energies 14 04194 g004
Figure 5. ALCS sensor output voltage (V) in the function of the measured current (A). The difference between the theoretical and the practical chart does not exceed 0.03 V.
Energies 14 04194 g005
Figure 6. Capacitor discharging circuit as an impulse current generator circuit. All current sensors have been marked on the figure: ALCS, LA 55-P, TCP0030A [22], and the low-inductance current shunt resistor, CSR.
Energies 14 04194 g006
Figure 7. Measured current signal in the function of time—(a) 1 μs/div; and (b) 200 ns/div—CH3: LEM sensor LA55-P, CH4: ALCS—augmented LEM current sensor.
Energies 14 04194 g007
Figure 8. (a) Measured current signal vs time (1 μs/div)—CH1: CSR with passive probe TPP1000, CH2: TCP0030A, CH3: Hall sensor LA55-P with a Bandpass Filter of 20 MHz, CH4: ALCS. (b) All aligned signals are presented.
Energies 14 04194 g008
Figure 9. Current (A), Error (A), and Squared Error (A2) in the function of time (ns)—analysis of the proposed sensor, ALCS, in comparison with CSR and TCP0030A probe.
Energies 14 04194 g009
Figure 10. The unfiltered current measured by ALCS, with a rising time equal to 9.13 ns.
Energies 14 04194 g010
Figure 11. IR photo of the proposed sensor in steady state operation under a full load current (40 A).
Energies 14 04194 g011
Table 1. The general summary of power electronics current sensors.
Current SensorsNameReferenceBandwidth [MHz]Slope Rise Time [ns]Capable of Measuring DC SignalsIsolationEstimated SizeEstimated CostApplication Constraints
CSRSDN-414-01[23]4001.0YesNoSmallModerate
(<500$)
limited energy dissipation (EMAX = 6 J)
SDN-414-10[23]20000.18YesNoSmallModerate
(<500$)
limited energy dissipation (EMAX = 1 J)
Not reported[3]0.1Not reportedYesNoLargeNot reported20 A to 100 A
SMDCSR[4]2230Not reportedYesNoSmallNot reportedlimited energy dissipation and SMD mount
HFCTPearson Model 8585C[24]2002.0No (>1500 Hz)YesLargeHigh
(>500$)
Max. RMS Current
5 A
Pearson Model 4688[24]3012No (>600 Hz)YesLargeHigh
(>500$)
Max. RMS Current
15 A
RCCWT015[25]3042No (>116 Hz)YesSmallHigh
(>500$)
Peak current
±30 A and 2.0 kA/μs
PCB Rogowski[10]10–30Not reportedNoYesSmallNot reportedMax. RMS Current
not reported
Hall sensorABB EL50P1[26]0.2Not reportedYesYesMediumLow
(<50$)
50 A RMS
±80 peak to peak
LEM LA 55-P[21]0.2500YesYesMediumLow
(<50$)
50 A RMS
±70 peak to peak
ACS70331[19]1Not reportedYesYesSmallLow
(<50$)
5 A and SMD mount
ACS37002MA[19]0.4Not reportedYesYesSmallLow
(<50$)
+/−100 A and SMD mount
CSR + isol. amplifierCSR with SI8920[20]0.9400YesYesSmallLow/ModerateLimited by CSR
TMR + RCNot reported[17]3154.2YesYesMediumNot reported26 A and a PCB is required
Hall + HFCTDC planar-CT[15]30Not reportedYesYesSmallNot reported30 A and soldering is required
OS sensor[16]5Not reportedYesYesSmallLow
(<50$)
10 A and a PCB is required
Current Surface Probe (CSP)[18]1332.5YesYesMediumNot reportedNot reported
TCP0030A[22]1202.92YesYesLargeVery High
(>4000$)
30 A RMS
±50 A peak to peak
Proposed ALCS 38.3310.49YesYesLargeLow
(<50$)
40 A RMS
±40 A peak to peak
Table 2. Comparison of the cut-off frequency.
ElementSymbolTheoretical Value
(4), (10) and (13)
Simulation Value
(Figure 4)
CTfLF553.58 Hz579.43 Hz
fHF221.04 MHz225.42 MHz
LEM RC filterfHF-RC2513.27 Hz2513 Hz
Table 3. Comparison of the current shunt resistor response with TCP0030A and ALCS (based on Figure 9)—CSR has been considered as a reference.
Step-Response CharacteristicsTCP0030AALCS
Response delay (RD)6 ns4 ns
Time delay to reach peak value (TDRPV)1 ns13 ns
Peak value difference (PVD)0.48 A0.24 A
Root Mean Squared Error (RMSE)0.41 A0.22 A
Mean error (ME)0.09 A0.02 A
Publisher’s Note: MDPI stays neutral with regard to jurisdictional claims in published maps and institutional affiliations.

