Article

Assessment Method to Identify the Potential of Rooftop PV Systems in the Residential Districts

1
Senior Fellow of HEA, Sydney Institute of Business and Technology, Sydney City Campus, Western Sydney University, Sydney, NSW 2000, Australia
2
Mechanical Engineering, Sydney City Campus, Western Sydney University, Sydney, NSW 2000, Australia
*
Author to whom correspondence should be addressed.
Energies 2021, 14(14), 4240; https://doi.org/10.3390/en14144240
Submission received: 20 April 2021 / Revised: 9 June 2021 / Accepted: 8 July 2021 / Published: 14 July 2021
(This article belongs to the Special Issue Renewable Energy Integration Toward a Sustainable Energy Transition)

Abstract

:
The installation of rooftop PV systems in residential buildings and dwellings has increased rapidly in the past decade, and these systems have become a major source of renewable energy in many countries. This paper presents a new method of estimating the potential of rooftop PV systems to meet energy demands in residential districts by introducing a roof suitability factor. The method of assessment is based on an online tool called SunSPot, which uses a solar radiation heat map layer of building roofs and the PVSYST solar performance software. A sample of 400 houses from four suburbs considered in the Sydney City Council 2030 sustainability plan was selected to conduct the performance analysis of rooftop PV systems and develop a formula that can estimate the suburban annual energy production. The results show that if the dwelling roofs in residential suburbs could be covered by PV arrays it would produce enough electricity to exceed the local electricity demand and, in some suburbs, a surplus of more than 87%.

1. Introduction

Rooftop solar PV system installation has increased significantly in different countries during the past ten years. This increase was powered first by generous local governments’ feed-in tariff schemes, followed by falling costs of PV systems and increasing grid electricity tariffs. Statistical studies show that, since 2012, there has been 60% decline in rooftop PV system prices [1]. The grid-connected rooftop PV system has been considered in the energy strategy planning of numerous countries. A large number of related research works, which consider technical, economic, and environmental criteria, have showed that this technology is a feasible solution for electricity generation, and could play a significant role in the future electricity supply [2,3,4,5,6,7,8,9,10]. In the Australian context, residential rooftop PV systems first fed energy into the local grid at the end of the first decade of the 21st century following the generous rebate schemes of local and federal governments. As a result, local councils were able to consider these systems in their building sustainability plans; for example, the sustainable Sydney 2030 strategy plan comprises ten targets. Some of these targets are linked to environmental sustainability, such as the reduction of greenhouse gas emissions to 50% of 1990 levels, and the capacity to meet local electricity demand [4].
Various case studies have been conducted to estimate the energy potential of rooftop PV systems; however, most of these adopted the same methodology by considering solar irradiation map layers on roof surfaces and geographical information for the respective site. Peng J. and Lu L. [5] investigated the potential of rooftop PV systems to meet part of the energy demand in Hong Kong. The area of PV arrays was estimated from the building floor area and corrected by factors of solar suitability and architectural suitability. The energy generated from the PV system was then estimated using a mathematical model that described solar irradiation, solar angles, PV panel distribution on the roof, and PV panel technical specifications. The study showed that rooftop PV systems could meet 14% of the country’s energy demand. Miranda R. et al. [6] evaluated the technical and economic potential of rooftop PV systems in the Brazilian residential sector. Spatial analysis based on geographic information was conducted to evaluate the energy generation from different residential urban areas by assuming optimum rooftop PV array inclination and orientation angles. The aim of the study of Miranda R. et al. was to forecast the number of residential rooftop PV systems that would be installed by the year 2026 and their economic impact. A high-resolution remote sensing data method was used to estimate the suitability of rooftops for PV system installation [7]. This method estimates the net present value of the potential of PV systems using light detection and ranging (LiDAR) data and the nonlinear efficiency characteristics of PV systems. Assouline D. et al. [8] estimated the rooftop PV potential of urban areas in Switzerland by combining mathematical models of available solar irradiation and geometric information systems. The analysis was based on four major steps: estimating the monthly global irradiation on tilted roofs; estimating the shadowing effects; estimating the available roof area of buildings; and estimating the solar PV electricity. The study showed that rooftop PV systems could cover up to 28% of the country’s electricity demand. Lee M. et al. [9] considered the spatial and temporal diversity of solar PV technology to estimate the economic potential of rooftop PV systems within a region in Korea. The electricity generation of the rooftop PV system was calculated for a district of 21,681 buildings using Hillshade analysis to quantify the roof area for which the PV system was not able to perform efficiently. They integrated various key factors in their model, such as available rooftop area, hourly solar radiation, PV module efficiency, module area, system size, and performance ratio. It was shown that the annual economic potential of the installed rooftop solar PV systems could supply up to 4.48% of the annual electricity consumption in the selected district. A multi-criteria approach based on geographic information systems and light detection and ranging was developed by Kouhestani F. et al. [10] to estimate the rooftop PV electricity potential of buildings in the city of Lethbridge, Canada. The study showed that solar electricity from rooftop PV systems in Lethbridge can meet about 38% of its electricity demand. Other researchers focused on estimating the potential of industrial rooftop PV systems using the geometric information system method [11]. This study selected a sample of 139 industrial plants using a net metering grid connection. Their work concluded that, by enabling an enhanced net metering policy, rooftop PV systems may present considerable savings and emission reductions in the industrial sector. The work presented in the literature noted above does not provide an online tool that is available to researchers to investigate the potential of rooftop PV electricity in residential districts. This research gap was recently addressed by Roberts M. et al. [12,13], who developed an online tool calledSunSPoT (Australian PV Institute Solar Map, funded by the Australian Renewable Energy Agency), which can be used to estimate the total potential of PV rooftop systems via a roof space mapping tool that evaluates available roof spaces, and estimates shading and roof orientation. This work was conducted for different residential and commercial zones in states and local government areas in Australia. The study showed that the annual solar electricity output from the available roof spaces in Australia is greater than the current consumption in the national electricity market.
The methods described in the above literature review estimated the overall energy production of rooftop PV systems using geographic scanning and solar irradiation mapping of building roofs. However, this kind of mapping does not identify the actual usable area of different types of roofs or the obstacles to the solar PV array layout, such as solar windows, satellite dishes, chimneys, and air conditioning units. The method developed in this work focuses on identifying the usable area of dwelling roofs for the layout of PV arrays by introducing the roof suitability factor. The aim is to obtain a more accurate picture of the rooftop PV potential of the Sydney City suburbs included in the sustainable Sydney 2030 strategy plan. We also aim to estimate the actual annual PV energy production using an adequate number of roof samples to justify the proposed average roof suitability factor for each suburb. In Section 2 of this paper, the online SunSPot tool is verified and a roof suitability factor chart is developed. In the Results and Discussion section, statistical data of house samples are presented and an equation for suburban annual energy production is developed. The energy and environmental impact of the suburban rooftop PV system is provided in the conclusion.

2. Materials and Methods

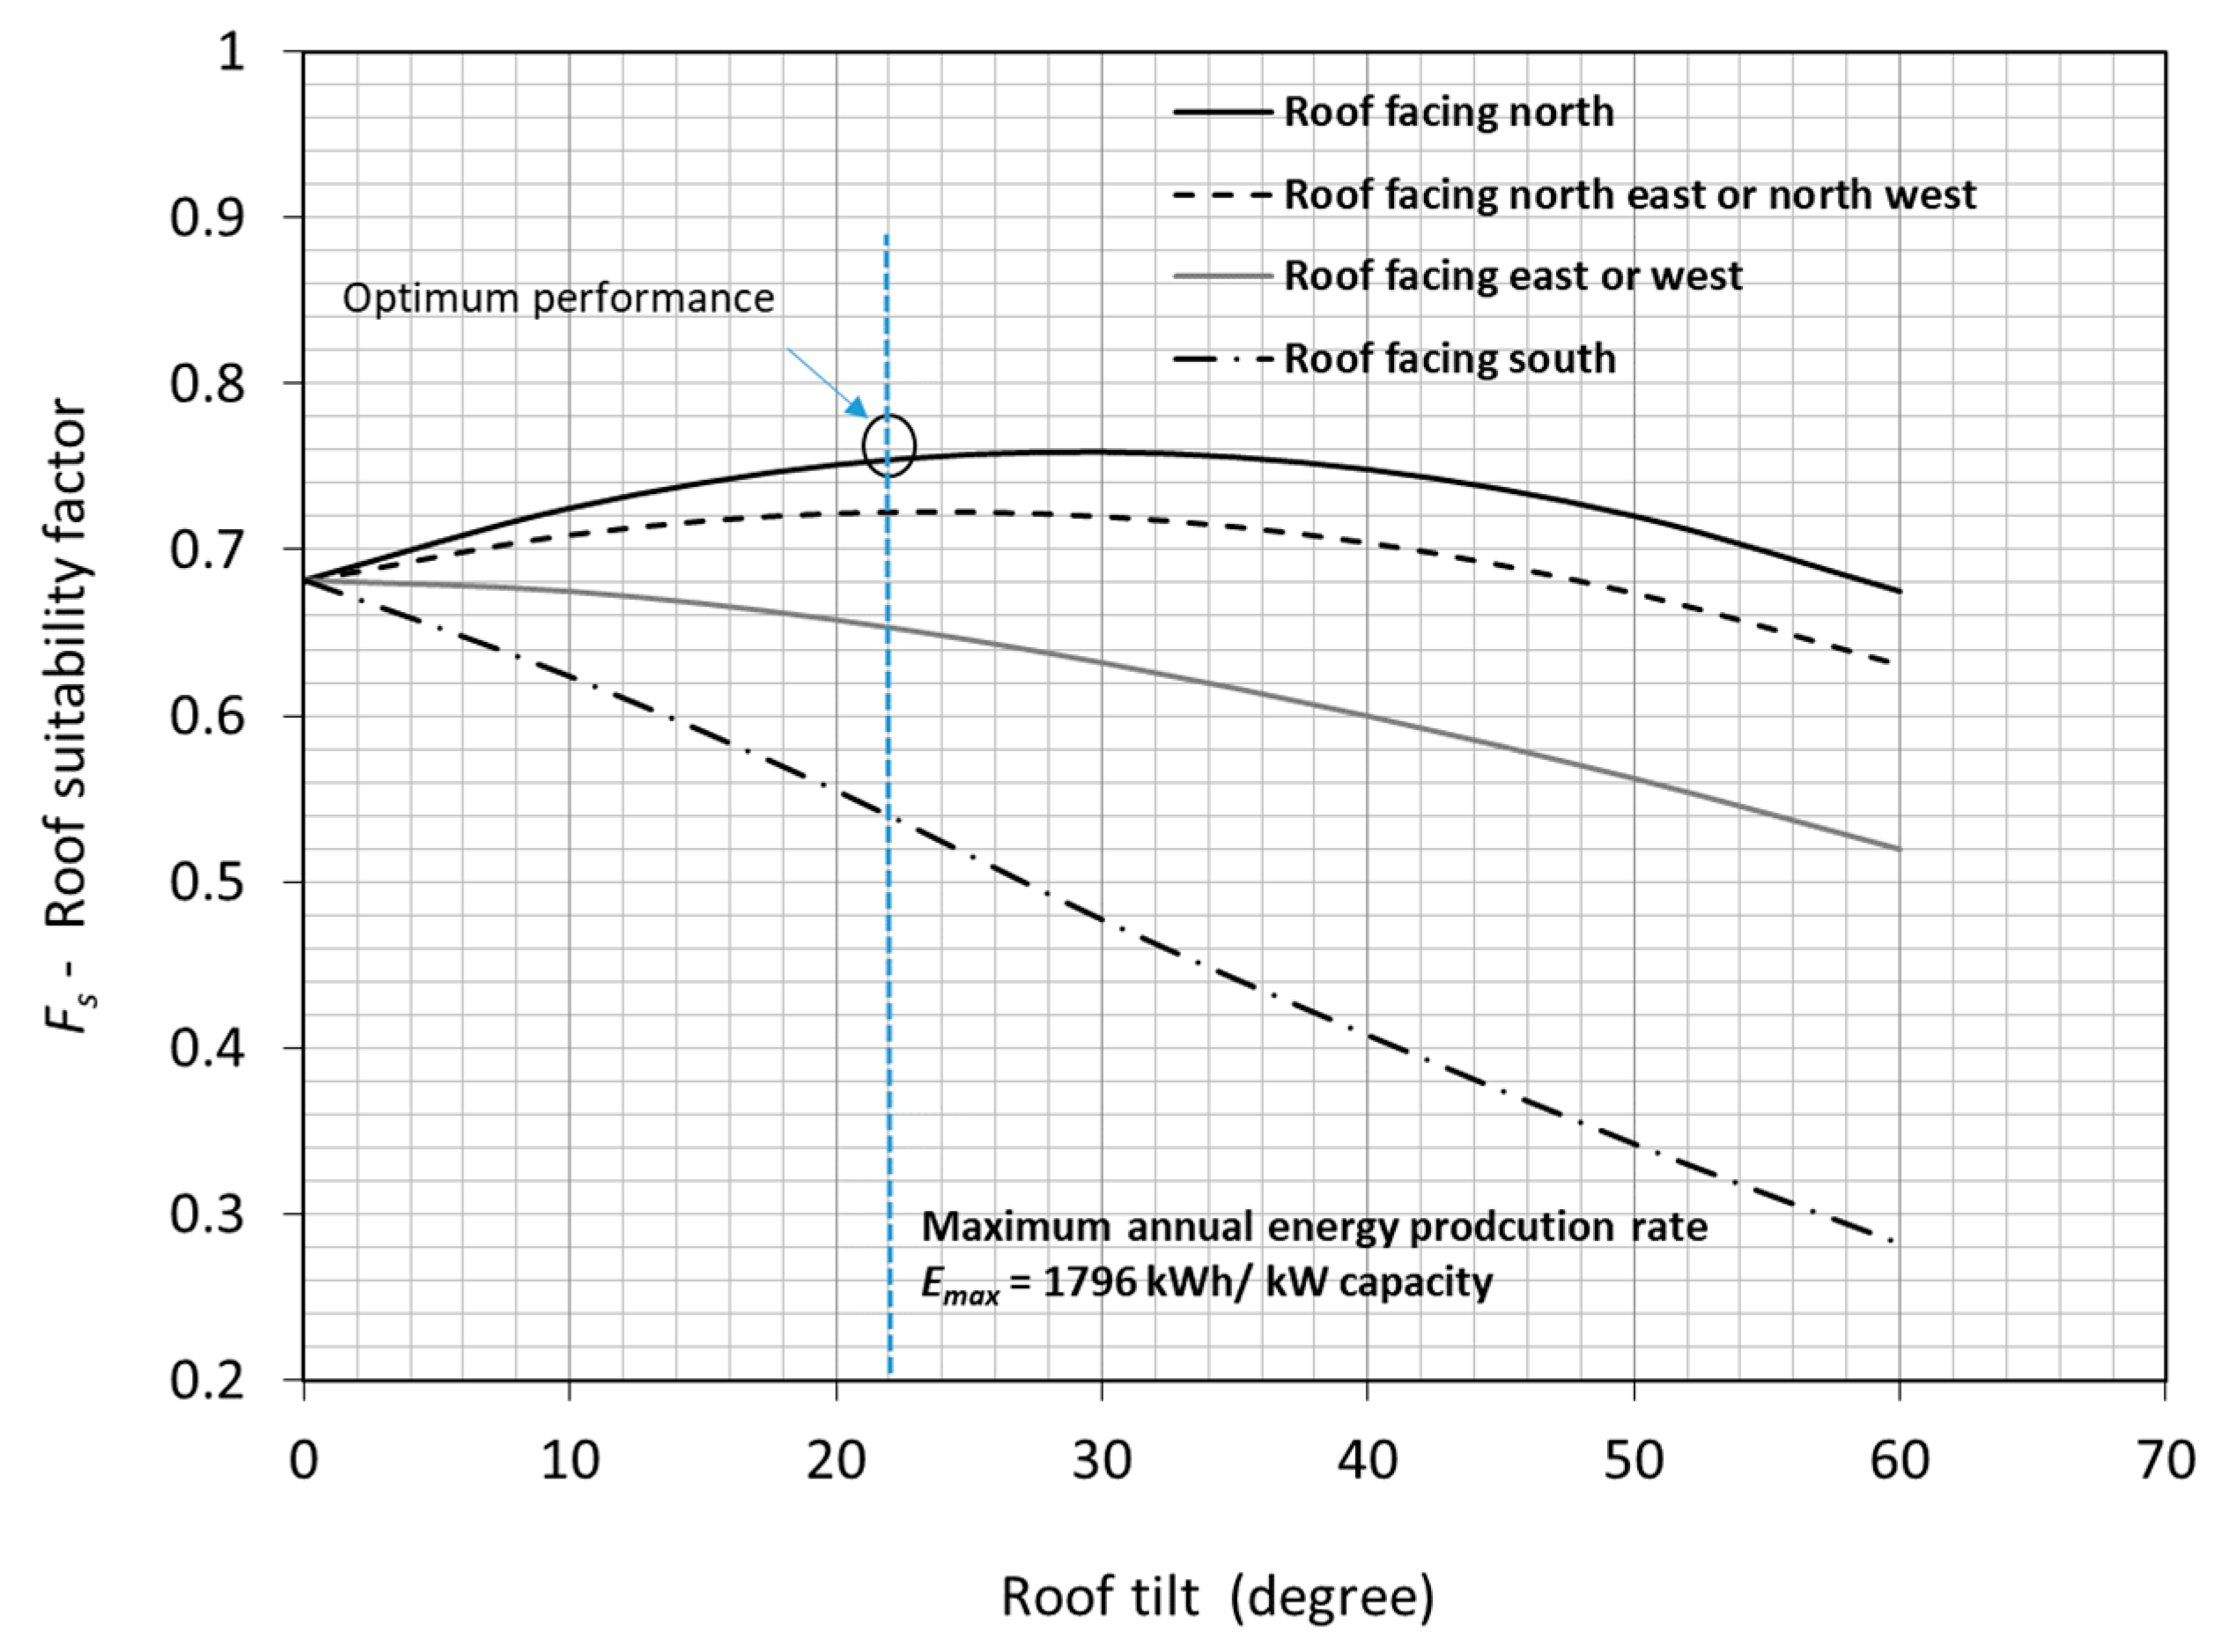
2.1. Optimising Rooftop PV System

A large number of factors relate to roof design that affect PV system performance, such as roof surface orientation, roof inclination, shading, and building obstructions. Shading and building obstructions are caused by adjacent buildings, trees, chimneys, skylights, TV satellite, etc. Therefore, the usable area for PV rooftop systems must exclude the area covered by shading and building obstructions. The orientation and inclination of PV panels are vital factors in the accurate calculation of the generated solar energy at a given site. To ensure a practical measurement of the roof suitability for the application of PV systems, energy generated from a PV array on any roof must be benchmarked against the energy generated from the same PV array when it operates at ideal orientation and inclination angles. This ideal operation can be achieved when the PV panel operates with the two-axis tracking mode. Based on this fact, the roof suitability factor can be developed to benchmark the performance of the rooftop PV system, and can be presented by:
F s = E p   E m a x  
where Fs—roof suitability factor, which ranges between 0 and 1; EP—energy production rate of the available rooftop PV array area (kWh/kW); Emax—energy production rate of the available rooftop PV array area when it is in two-axis solar tracking mode (kWh/kW).
The roof suitability factor, Fs, chart can be constructed for every main city using the PVSYST software [14] to calculate the values of EP and Emax for different inclination and orientation angles, as depicted in Figure 1.
The maximum value of roof suitability factor Fs that can be achieved at any site depends on the standard design of the roof endorsed by the building code and the site latitude. For example, the maximum value of Fs that can be achieved in Sydney is derived when the roof tilt angle is 23° and the orientation is northward, as shown in Figure 1. Solar PV systems can lose about 4% of their output if their roof orientation is toward the north-east or north-west. The loss in system output is up to 13% if the roof faces east or west. It is clear from this figure that south-facing roofs are not preferable locations for rooftop PV arrays because they result in a decline of about 27% in the system’s annual output.

2.2. Estimating the Potential of Rooftop PV System Using Heat Map Tool

Detailed estimates of solar potential within Australian cities were conducted by combining two types of analysis—top-down and bottom-up analyses—thereby generating an online tool called SunSPoT that estimates PV capacity for each roof [12]. In the top-down analysis, a digital representation was conducted to estimate the total roof area of the buildings in major cities in Australia, and these buildings were categorised by postcode and primary zone. In bottom-up analysis, solar potential was considered using satellite data for solar radiation, weather at the specific site, roof slope, roof orientation, and shading from nearby buildings and vegetation.
The annual energy production of the rooftop PV system estimated by SunSPoT can be verified using actual yearly measured data of an operating system of 1.75 kW capacity [15]. SunSPoT was first used to estimate the output of the PV system from the roof area covered by the PV panels, as shown in Figure 2a. Then, this annual output was compared with the output of 4 years of continuous operation, as shown in Figure 2b. The percentage of error in the annual energy output estimated by SunSPoT tool was found to be in the range between −3.6% and −7%. The first three years show consistent errors in the estimated annual output (around −3.6%). However, the 7% decline in the 4th year was due to the change in solar irradiation conditions caused by an increase in cloudy and rainy days.
Annual energy production was also estimated using the sophisticated PVSYST software [14] to justify the difference between the actual and simulated energy production, as presented in Figure 2b, which shows almost similar range of error. This verification shows that the error in the annual PV energy generation estimated by SunSPoT is reliable and within the accepted range of other simulation tools.

2.3. Methodology of Suburban Rooftop PV System Analysis

In this research, four suburbs of Sydney City Council (Newton, Erskineville, Redfern, and Rosebery) were selected to determine the potential of rooftop PV systems of local houses to meet the electricity demand of these suburbs. These suburbs are adjacent to the Sydney central business region (CBD), where most of their dwellings have limited roof areas compared with other suburbs in the greater Sydney region. The aim of conducting this study based on these four suburbs was to assess the viability of the sustainable Sydney 2030 strategy plan and determine whether the suburbs of Sydney City Council can meet the environment sustainability targets: the reduction of greenhouse gas emissions to 50% of 1990 level and the capacity to meet local electricity demand [4].
The SunSPoT online tool [16] was used to estimate the output of the rooftop PV system samples with the following steps:
  • Locate a house in a respective suburb by zoom in the SunSPoT online map.
  • Identify the usable roof area from the total area of the roof samples by removing the area of objects obstructing the layout of the PV panels, such as the area of chimneys, satellite dishes, antennas, and air-conditioning units. More than one side of the roof (north, east, and west) is considered if their area is suitable for PV panel installation (>4 m2).
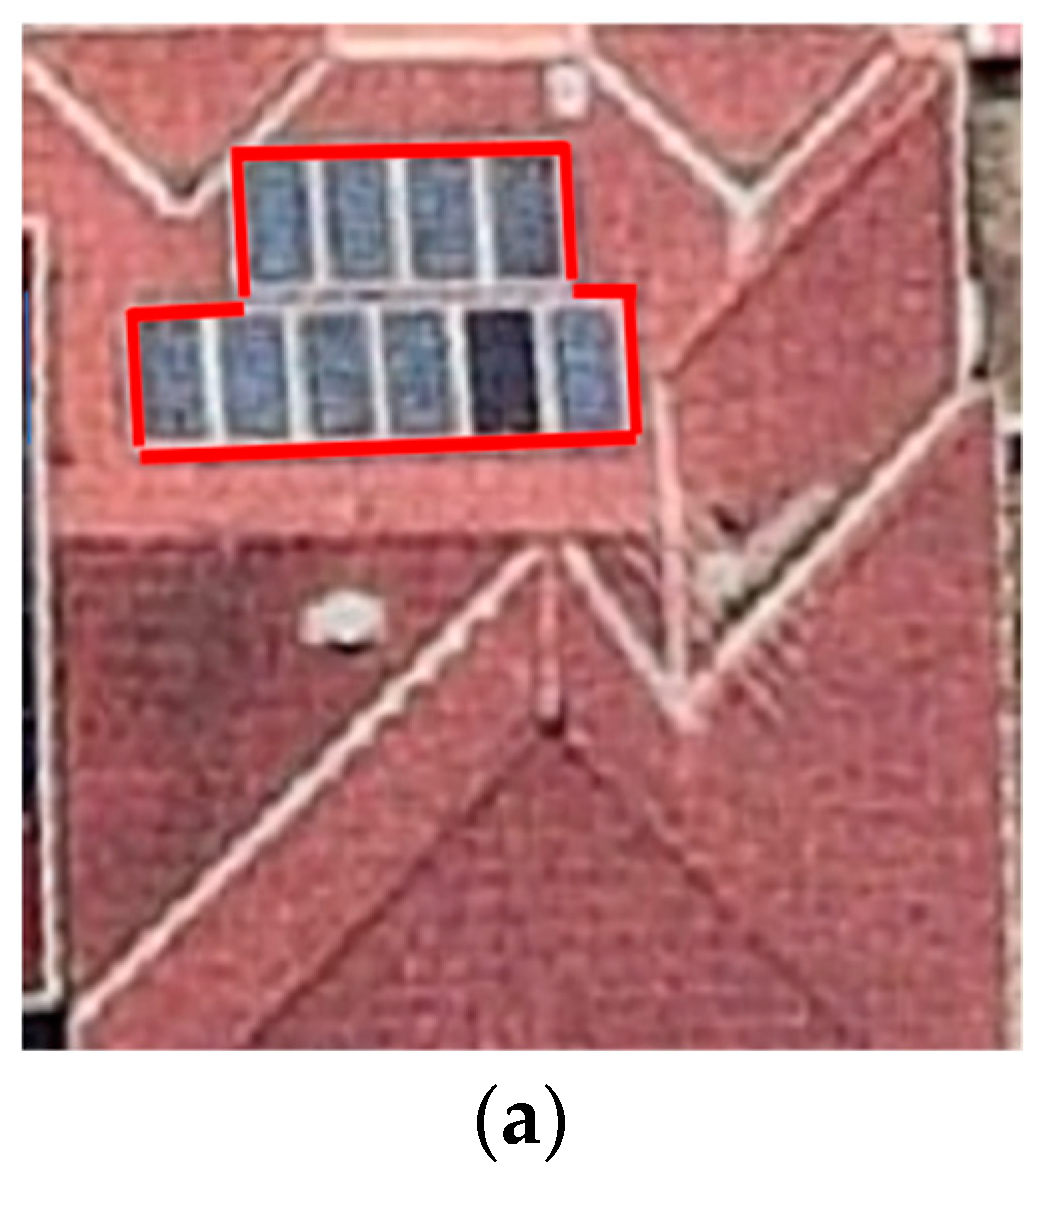
  • Draw the location of the PV array on the selected house roof using the SunSPoT roof space mapping tool, as described in Figure 3. This figure shows an example of the selected area of a north-east roof that would be suitable for the installation of PV panels, and the eliminated roof area on the east and west sides because it is less than 4 m2. The southern roof of all house samples was not considered in the analysis because it is not feasible from an economic perspective.
  • Perform the analysis using the calculate function in SunSPoT to estimate the rooftop PV system information, such as the PV panel array area, roof orientation, roof tilt angle, the capacity of the system, the annual yield, CO2 emissions avoided, and annual savings.
  • The data collected in step 4 are copied into an Excel sheet to perform statistical analysis.
Due to the variety of roof designs in the selected suburbs, the relative standard deviation of the average energy production was calculated versus the number of houses in the sample to find the number of houses that can be selected in each suburb. It is clearly shown in Figure 4 that the relative standard deviation of the average energy production changes with the number of houses in the sample until it reaches approximately steady values between 80–120 houses. Based on this finding, 100 houses in each suburb were selected in the PV system analysis. Each suburb was divided into 10 zones, with each consisting of 10 random houses that are eligible for the installation of a rooftop PV system, to estimate the average production of solar electricity of the suburb.

3. Results and Discussion

A sample of 100 house roofs in each suburb were used to estimate the average value of the rooftop PV system capacity that can be installed in the usable roof area. Figure 5 presents the distribution of the percentage of roof usable area for PV panel installation of a sample of 400 houses in the four suburbs selected in this study: Newtown, Redfern, Erskineville, and Rosebery.
It is clear that the dwelling roofs in the first three suburbs in Figure 5a–c are more suitable for rooftop PV panel application because the majority of houses have usable areas greater than 50%. The house samples of the three first suburbs of Figure 5 show that the average roof usable area is around 61–65%; in contrast, the fourth suburb (Figure 5d) is around 29%. The reason for this variation is the difference in the roofs’ architectural design, which results in limited access to PV panel arrays in the suburb of Rosebery.
It should be noted that, although the percentage of roof usable area of the suburb in Figure 5d is half that of the other suburbs, its total roof area is almost double the total roof area of the other three suburbs and, consequently, the PV array area can be doubled. Therefore, the rooftop PV capacities per square meter (kW/m2) of these suburbs (Newtown, Redfern, Erskineville, and Rosebery) are similar, and their average values were found to be 0.19, 0.18, 0.18, and 0.17 kW/m2, respectively. This rooftop PV capacity based on the usable roof area represents a measure of the size of the rooftop PV panel array that can be installed for each dwelling.
To estimate the average roof suitability factor of a suburb (given by Figure 1), average roof slope (β) and roof orientation (Z) were estimated from the selected samples. Figure 6 depicts the variation in roof tilt angle of the roof samples in the different suburbs. The roof angle varies between a slightly inclined roof of 3° and a roof inclination of 55°. The average title angles of each suburb a, b, c, and d are 33°, 31°, 31°, and 22°, respectively, which are within the range of the optimum tilt angle of the PV panel shown in Figure 1. However, the major factor found in these suburbs that causes a reduction in system performance is the roof orientation. The orientation angle of roof samples in different suburbs presented in Figure 7 varies from east orientation (+ sign) to west orientation (− sign). It should be noted that the suburbs b, c, and d in Figure 7 have average roof orientation angles (Z) between 5° and 10° to the north east, whereas suburb a has a more severe deviation from north, with an average orientation angle (Z) of around 23°.
The annual energy production from rooftop PV systems in each suburb can be estimated from the data collected from the sample of 100 houses using Equation (2). The suitability factor Fs given in Figure 1 for each suburb can be estimated using the average roof tilt, and the average roof orientation found from Figure 5 and Figure 6.
Therefore, annual energy production of each suburb can be estimated by:
Ep = Fs × Pc × Emax × N
where:
  • Ep  Annual energy production (kWh),
  • Fs  Average roof suitability factor,
  • Pc  Average capacity of PV panel array (kW),
  • Emax Maximum energy production rate (kWh/kW),
  • N   Number of houses in each suburb.
The maximum annual energy production rate (Emax) is the energy produced per kW capacity of the two-axis solar tracking PV system. This is estimated by selecting standard commercially available PV system specifications and using any PV performance software that has a two-axis tracking option, such as PVSYST [14]. The specification of a system already in operation [15], as presented in Table 1, was adopted in this work to estimate the value of Emax for Sydney, which was found to be equal to 1796 kWh/kW.
Equation (2) presents a method of estimating the annual energy production of the rooftop PV systems of any suburb without the need to estimate the output of each roof of the thousands of houses within that suburb.
The average capacity of PV panel arrays (Pc) in each suburb (a, b, c, and d) was estimated by identifying the usable area of the sample houses, and was found to be equal to 7.6, 7.2, 7.9, and 6.9 kW, respectively. The number of houses (N) in each suburb was deduced from Quickstats [17]. Table 2 presents the annual energy demand of the four suburbs covered in this study, the annual energy production of the rooftop PV systems estimated from Equation (2), and the estimated hectare of trees equivalent to tonnes of CO2 removed. The three suburbs of Newtown, Redfern, and Erskineville would generate sufficient solar electricity to meet the suburb demand, with surpluses of 87%, 7%, and 76%, respectively. It should be noted that the values of annual energy demand reported in Table 2 represent the demand by both residential and commercial sectors. Therefore, the energy surplus from rooftop PV systems in these three suburbs can cover the shortages of other surrounding suburbs. The energy production of the rooftop PV systems of the fourth suburb, Rosebery, can only meet 68% of the energy demand due to the lower residential usable area of the suburb, as depicted in Figure 5d, and because commercial buildings covering a large area of the suburb.
Table 2 shows that the average suitability factors of the four suburbs are similar and lie in the range of 0.74–0.76 due to small differences in average roof orientation.
The cost of installation of the rooftop PV system depends on different factors, such as quality of the system components, system location or roof height, and length of cabling network. The SunSPoT online tool considers some of these factors and can be used to estimate the cost of the proposed system based on the local market prices. The cost of the 400 houses (in AUD/kW) selected in this study was estimated, and is presented in Figure 8 with reference to the system size (in kW). It can be concluded from this figure that most of the roof usable areas of the studied houses are suitable for a system with a minimum size of 4 kW, and the price for this system would be around 950 AUD/kW. The payback period for these systems varies and depends on the design factors, tariff for selling solar electricity to the grid, metering mode (net or gross), and energy consumption management of each household. Based on the current net metering system used by energy companies in the local area of Sydney City Council, the savings estimated by the SunSPoT tool show that the payback period of rooftop PV systems in Sydney City Council suburbs would be within the range of 4–5 years.

4. Conclusions

Solar electricity generated from rooftop PV systems has become a significant source of energy in numerous countries, and the use of these systems has expanded significantly in the residential areas of large cities. In this research work, a methodology for estimating solar energy production of suburban rooftop PV systems was introduced. The methodology is based on the collection of design and performance information from selected suburban roof samples using a roof space mapping tool calledSunSPoT. A sample of 400 houses from four adjacent suburbs within the Sydney City Council area was considered, and statistical analysis was conducted on roof useable area, roof slope, roof orientation, and PV system capacity. The results of the analysis show that, although differences existed in roof area design, the rooftop PV capacity per square meter (kW/m2) for the four suburbs was similar, and was within the range of 0.17 to 0.19 kW/m2. An average roof suitability factor chart was introduced as a measure of roof potential for PV system application. This chart was used with a developed formula to estimate the annual energy production of the suburban rooftop PV systems. The energy analysis outcome showed that three of the four suburbs considered in this study could produce sufficient solar electricity from the dwellings’ roofs to meet the residential and commercial energy demand. The surplus of energy produced from these suburbs (between 7% and 87%) could cover any shortage in the adjacent suburb if a local network energy arrangement is considered. The area of planted trees equivalent to the amount of CO2 removed from the four suburbs by solar electricity is almost double the total area of the council. The results show that it would be possible to make the majority of Sydney City suburbs zero energy districts. This would meet the target of the Sydney 2030 environment sustainability plan, if a stimulus package for rooftop PV application is provided by the local councils. The package should consider the option of a battery storage system in dwellings to enhance power system flexibility, enable a high level of PV energy integration, and reduce grid energy congestion. Further work will be conducted on the potential of PV rooftop systems in suburbs that are not adjacent to the Sydney central business district.

Author Contributions

S.O. carried out Conceptualization, methodology, formal analysis, original draft preparation, and supervision, T.H.N. carried out software, validation, formal analysis, investigation, and data curation. Both authors have read and agreed to the published version of the manuscript.

Funding

This research received no external funding.

Conflicts of Interest

The authors declare no conflict of interest.

References

  1. Egan, R.; Kallmier, E.; Ashby, O.; Koschier, L.; Passey, R. National Survey Report of PV Power Applications in Australia; Australian PV Institute: Sydney, Australia; Australian Renewable Energy Agency: Canberra, Australia, 2019.
  2. Chen, C.-N.; Yang, C.-T. The Investability of PV Systems under Descending Feed-In Tariffs: Taiwan Case. Energies 2021, 14, 2728. [Google Scholar] [CrossRef]
  3. Al-Aboosi, F.Y.; Al-Aboosi, A.F. Preliminary Evaluation of a Rooftop Grid-Connected Photovoltaic System Installation Under the Climatic Conditions of Texas (USA). Energies 2021, 14, 586. [Google Scholar] [CrossRef]
  4. Hu, R. Sustainable Development Strategy for the Global City: A Case Study of Sydney. Sustainability 2015, 7, 4549–4563. [Google Scholar] [CrossRef] [Green Version]
  5. Peng, J.; Lu, L. Investigation on the development potential of rooftop PV system in Hong Kong and its environmental benefits. Renew. Sustain. Energy Rev. 2013, 27, 149–162. [Google Scholar] [CrossRef]
  6. Miranda, R.; Szklo, A.; Chaeffer, R. Technical-economic potential of the roof top PV systems on Brazilian rooftops. Renew. Energy 2015, 75, 694–713. [Google Scholar] [CrossRef]
  7. Luka, N.N.; Seme, S.; Dezan, K.; Zalik, B.; Stumberger, G. Economic and environmental assessment of rooftops regarding suitability for photovoltaic systems installation based on remote sensing data. Energy 2016, 107, 854–865. [Google Scholar] [CrossRef]
  8. Assouline, D.; Mohajeri, N.; Scartezzini, J.-L. Quantifying rooftop photovoltaic solar energy potential: A machine learning approach. Sol. Energy 2017, 141, 278–296. [Google Scholar] [CrossRef]
  9. Lee, M.; Hong, T.; Jeongb, K.; Kima, J. A bottom-up approach for estimating the economic potential of the rooftop solar photovoltaic system considering the spatial and temporal diversity. Appl. Energy 2018, 232, 640–659. [Google Scholar] [CrossRef]
  10. Kouhestani, F.; Byrne, J.; Johnson, D.; Spencer, L.; Hazendonk, P.; Brown, B. Evaluating solar energy technical and economic potential on rooftops in an urban setting: The city of Lethbridge, Canada. Int. J. Energy Environ. Eng. 2019, 10, 13–32. [Google Scholar] [CrossRef] [Green Version]
  11. Jara, P.; Castro, M.; Esparcia, E.; Ocon, J. Quantifying the Techno-Economic Potential of Grid-Tied Rooftop Solar Photovoltaics in the Philippine Industrial Sector. Energies 2020, 13, 19. [Google Scholar] [CrossRef]
  12. Roberts, M.; Nagrath, K.; Briggs, C.; Copper, J.; Bruce, A.; Mckibben, J. How much Rooftop Solar can be Installed in Australia? In Report for the Clean Energy Finance Corporation and the Property Council of Australia; UTS: Sydney, Australia, 2019. [Google Scholar]
  13. Roberts, M.; Copper, J.; Bruce, A. Analysis of Rooftop Solar Potential on Australian Residential Buildings. In Proceedings of the Asia Pacific Solar Research Conference, Sydney, Australia, 4–6 December 2018. [Google Scholar]
  14. Mermoud, A. PVSYST Photovoltaic Software V5.74; The University of Geneva: Geneva, Switzerland, 2012. [Google Scholar]
  15. Odeh, S. Long Term Assessment of a Grid Connected Solar PV System in Sydney. J. Energy Power Eng. 2016, 10, 591–599. [Google Scholar] [CrossRef]
  16. Australian PV Institute. SunSPoT Rooftop Solar Mapping Tool. Available online: https://pv-map.apvi.org.au/sunspot/map#/ (accessed on 21 January 2021).
  17. Australian Bureau of Statistics. Quickstats. 2016. Available online: https://quickstats.censusdata.abs.gov.au/census_services/getproduct/census/2016/quickstat/SSC10180?opendocument (accessed on 24 February 2021).
Figure 1. Roof suitability factor for rooftop PV system application in Sydney.
Energies 14 04240 g001
Figure 2. Verification of SunSPoT annual energy production of a 1.75 kW system. (a) Roof area covered by PV array, (b) comparison of the estimated annual energy generated by SunSPoT with four years of measured data.
Energies 14 04240 g002aEnergies 14 04240 g002b
Figure 3. Selecting the usable area of the roof.
Energies 14 04240 g003
Figure 4. Relative standard deviation of average energy production by different numbers of houses that are suitable for rooftop PV application.
Energies 14 04240 g004
Figure 5. The distribution of roof useable area in four suburbs: (a) Newtown, (b) Redfern, (c) Erskineville, (d) Rosebery.
Energies 14 04240 g005
Figure 6. Roof slope angle (β) in four suburbs: (a) Newtown, (b) Redfern, (c) Erskineville, (d) Rosebery.
Energies 14 04240 g006
Figure 7. Roof orientation angle (Z) in four suburbs: (a) Newtown, (b) Redfern, (c) Erskineville, (d) Rosebery. Y axis values represent roof orientation: Zero is toward north, 90° is toward East, −90° is toward west.
Energies 14 04240 g007
Figure 8. Rooftop PV system capacity versus total cost.
Energies 14 04240 g008
Table 1. PV system specification.
PV module Si-Mono Model FS—175 W
Number of PV modules in series5 modules in parallel 2 strings
Total number of PV modules10 × 175 W each
Total nominal power (@ STC)1750 W
Array operating characteristics164 V and 9.6 A
Total module area12.8 m2
Inverter Model Sunny Boy SB 1700
ManufacturerSMA
Operating Voltage139–320 V
Power1.55 kW AC
Table 2. Annual energy production of suburban rooftop PV systems (Emax = 1796 kWh/kW). All values of β, Z, Fs, and Pc are the average of the respective suburb.
SuburbB
(°)
Z
(°)
FsPc
(Kw)
NDemand
(Gwh/Year)
Production Ep
(Gwh/Year)
Hectares of Trees Equivalent to CO2 Removed Annually
Newtown33230.747.6751640.4875.91783
Redfern2970.767.2718665.8870.621589
Erskineville2850.767.9404724.743.64934
Rosebery25100.756.9441560.541.031047
Publisher’s Note: MDPI stays neutral with regard to jurisdictional claims in published maps and institutional affiliations.

