Article

Application of an Improved Mayr-Type Arc Model in Pyro-Breakers Utilized in Superconducting Fusion Facilities

1
Key Laboratory of Optoelectronic Devices and Systems of Ministry of Education and Guangdong Province, College of Physics and Optoelectronic Engineering, Shenzhen University, Shenzhen 518060, China
2
Advanced Energy Research Center, Shenzhen University, Shenzhen 518060, China
3
Institute of Plasma Physics, Chinese Academy of Sciences, Hefei 230031, China
*
Author to whom correspondence should be addressed.
Energies 2021, 14(14), 4383; https://doi.org/10.3390/en14144383
Submission received: 28 June 2021 / Revised: 16 July 2021 / Accepted: 16 July 2021 / Published: 20 July 2021

Abstract

:
Pyro-breaker, a fast-responding, highly reliable and explosive-driven circuit breaker, is utilized in several Quench Protection Systems (QPS). The commutation process and its parameters are the main technical considerations in the process of designing a new pyro-breaker. The commutation parameters, such as the commutation time and the current change rate, are not only determined by the electrical parameters of the commutation circuit but also the arc behavior during the operation. The arc behavior is greatly affected by the structure and the driving mechanism of the Commutation Section (CS) in the pyro-breaker. The arc model was developed decades ago and the black-box arc model is considered a valid method to study arc behavior. In this paper, the Schavemaker black-box arc model, an improved Mayr-type arc model, is applied to study the commutation process of a newly designed pyro-breaker. Unlike normal circuit breakers, the arc discussed in this paper is discharged in deionized water. A parameter selection method is proposed. The practicability of the method is verified by numerical calculation in Power Systems Computer Aided Design (PSCAD) and experimentally.

1. Introduction

1.1. Motivation and Incitement

Direct current (DC) power systems offer enhanced efficiency, reliability and simplicity over alternating current (AC) systems. They have been adopted in aircrafts, ships, urban transit systems and nuclear power plants [1,2,3]. Nonetheless, because there is no natural zero-crossing point, as in an AC system, extinguishing a DC arc is more challenging when it comes to avoiding breaking failure caused by the arc burning and reigniting [4].
Due to the fast responsiveness and highly reliability of pyro-breakers, they have been adopted as backup breakers in Quench Protection Systems (QPS) in a number of superconducting fusion facilities [5,6,7,8,9]. When a quench phenomenon occurs, the enormous electromagnetic energy in the superconducting coil is converted to heat energy [10]. This causes irreversible damage to the superconducting coil. Therefore, the energy needs to be commutated and consumed by a discharge resistor within a short period of time.
The pyro-breaker presented in this paper was developed from the concept of the pyro-breaker used in ITER [9] and it is expected that it will be utilized in an ongoing design project by the QPS for the China Fusion Engineering Test Reactor (CFETR) [11,12,13]. Various studies have been undertaken on the structure and thermal dynamics of the breaker [14,15]. As part of the design process, the breaker has to be tested in a high-power laboratory to confirm its performance and capability.

1.2. Literature Review

Arc models are a feasible way to study the commutation process theoretically and build on the tests results of a breaker. A fully developed arc model which has good correspondence with the arc behavior of the breaker can be applied to link the structural design to the commutation parameters of the pyro-breaker.
Research into DC arcs is usually conducted by means of dynamic arc models [16,17,18]. There are two types of dynamic arc model: the physical–mathematical model and the pure mathematical model. The physical–mathematical model describes arc characteristics by studying and analyzing the physical processes of the arc, which are very complex and difficult to measure. The pure mathematical model, i.e., the black-box model, treats the arc as an electrical component. It only describes the external relationship between the arc voltage and the arc current. Since Mayr and Cassie published their dynamic arc models [19,20], many studies have been devoted to studying and modifying their differential equations to fit the measured data [21,22,23,24,25]. Determining the values of the parameters of the arc model is considered to be the most difficult problem in the application of the black-box arc model. Furthermore, most of the existing arc model research has focused on arcs discharged in a vacuum or in open air [26,27,28]. The arc in the pyro-breaker presented here, however, is discharged in deionized water.

1.3. Paper Organization and Contribution

First, the structure of a pyro-breaker currently under design is introduced. Then the paper discusses the adoption of the Schavemaker black-box arc model, an improved Mayr-type arc model [23], to simulate the commutation process of the discussed pyro-breaker. It then discusses how the simulation was conducted, using Power Systems Computer Aided Design (PSCAD). Next, it describes how a fitted curve of the arc model parameter was obtained by examining ITER pyro-breaker tests. It then proposes a parameter selection method based on the fitted curve and verifies this on the newly designed pyro-breaker.
This method provides the theoretical basis for the study of the current commutation process of the pyro-breaker. It fills certain gaps in the literature regarding arc modeling in an underwater and explosive-driven circuit breaker, and provides a foundation for designing the pyro-breaker in QPS for CFETR.

2. Arc Modeling for Pyro-Breaker

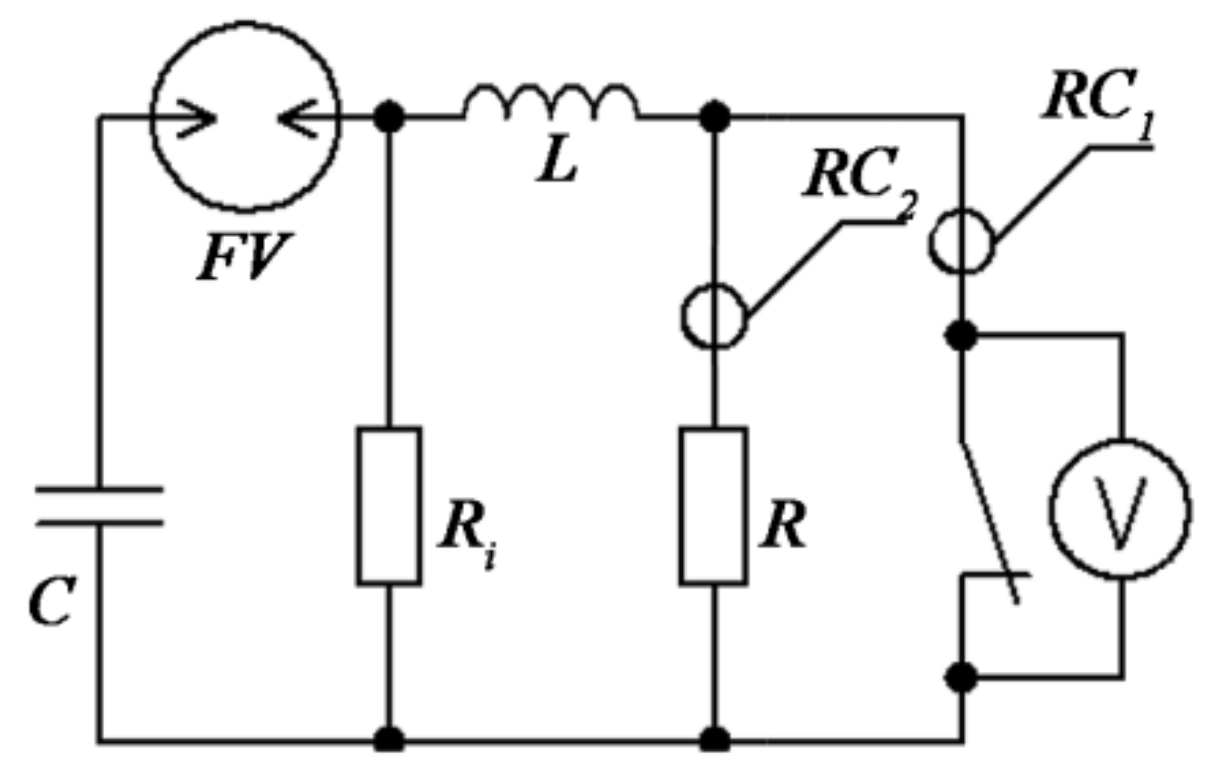
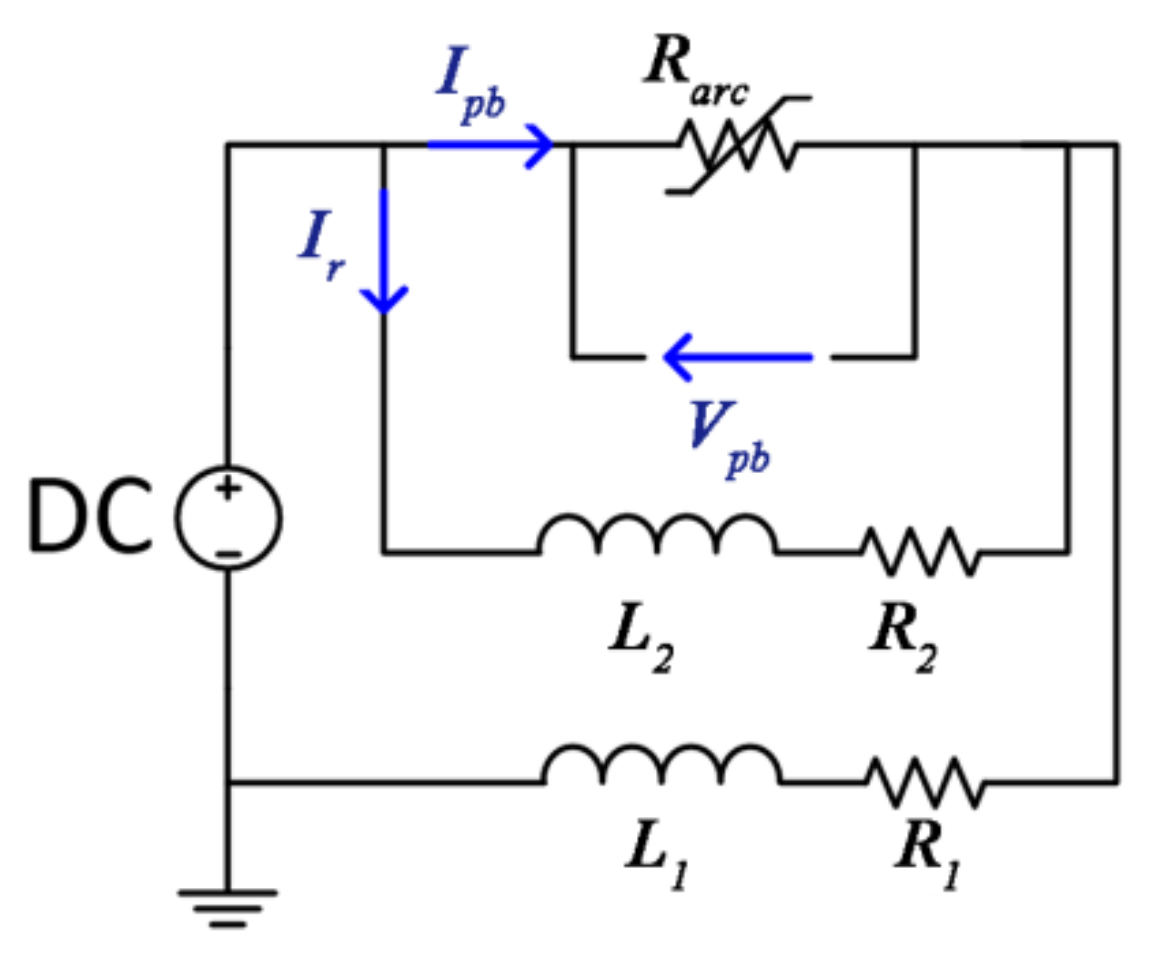
2.1. The Commutation Section in the Pyro-Breaker

The commutation function is achieved through the Commutation Section (CS) in the pyro-breaker. As shown in Figure 1, the main components of the CS are the lower explosive, the support epoxy and the barrel conductor. The barrel conductor is a thin cylindrical copper wall. Circular grooves are arranged on the external surface to provide stress concentration, which leads to a high current density. Deionized water flows through the inner cavity of the barrel conductor and works as a cooling and detonation transmission medium. When the main breaker fails to disconnect the circuit, the CS is triggered to operate.
After the detonation wave reaches the barrel conductor, the barrel conductor will break along the annular grooves. Due to the restrictions by the equidistantly installed support epoxy, the barrel conductor will break into several rings, as shown in Figure 2. Multiple arcs will appear between each ring and be extinguished by the high-pressure deionized water in the cylinder. The commutation capacity of the pyro-breaker depends on the number and size of the gaps between the rings. The current will commutate into a set of resistors to discharge the tremendous energy in the superconducting magnet. The arc behavior in the CS, which greatly affects the commutation capacity of the pyro-breaker, is determined by the structure and driving mechanism of the CS.

2.2. The Schavemaker Black-Box Arc Model

Black-box models describe non-linear arc conductance over time. The purpose of the black-box arc model is to study the external relationship between arc voltage and arc current during arc ignition.
The Mayr arc model, defined by Equation (1), and the Cassie arc model, defined by Equation (2), are the most widely used black-box arc models.
1 g d g d t = 1 τ u i P 0 1
1 g d g d t = 1 τ u E 0 1
Here, the time constant τ shows the increasing rate of arc resistance. A smaller value of τ indicates a shorter time for the arc resistance to reach a certain level. P0 is the cooling power, which depends on the internal characteristics of the circuit breaker. E0 is the reference arc voltage, which is irrelevant to the arc current. The Cassie and Mayr arc models are pure mathematical models, based on different assumptions. They both consider only one aspect of the heat dissipation equation. In fact, arc energy tends to dissipate in a manner that combines these two assumptions. In a circuit breaker, arc energy is mainly transmitted by convection and radial diffusion.
The Schavemaker black-box arc model, defined by Equation (3), is a Mayr-type arc model integrated with the Cassie arc model.
1 g d g d t = 1 τ u i m a x E 0 i , P 0 + P 1 u i 1
P1 is the cooling constant, which adjusts the impact of the input power on P0. The pressure caused by ohmic heating during arc extinguishment is embodied in P1. In a high current area, Equation (3) is reduced to the Cassie arc model. Near the zero-current region, Equation (3) is reduced to the Mayr arc model. The validity of both the Cassie model in a high current area and the Mayr model in a near-zero-current region have been proven.
As a result of the multiple gaps formed during the explosion in the CS, several arcs are ignited. To simplify the modeling, this series of arcs is regarded as a single arc.

3. Simulation and Experiment

3.1. Parameter Fitting

Schavemaker pointed out that the parameters in the equation can be either constant or a function of the electrical quantities. Many variations in these parameters can be found in [29]. Several of these varieties achieve good results in simulations. Schavemaker pointed out that there is no unique relationship between the electrical quantities and the parameters of the arc model. For example, at a certain time instant, k, Equation (1) can be transformed to:
  d l n g d t k u i k   τ k 1 / P 0 k = 1   o r   A x = b
Equation (4) is an under-determined system [30]. There are two unknown factors in one equation. It can be deduced that there is no unique set of (τ, P) values which can fit the current and voltage measured in the experiment. Hence, there is more than one set of parameter choices that can achieve a simulation which agrees with the actual switching characteristics.
Normally, the parameters of the black-box arc model are derived hypothetically and verified experimentally. A method to explore the parameter selection patterns is proposed here. The method adopts the Parameter Sweep Strategy [31,32] to fit the commutation test results of the ITER pyro-breaker in PSCAD.
The test circuit of the ITER pyro-breaker is illustrated in Figure 3. A current of sufficient amplitude was produced by means of capacitor bank C. The ignition resistor Ri provided the necessary opening conditions for the ignitrons. After triggering the ignitrons, FV, the current began to rise in the pyro-breaker branch. After the current reached the defined test level, the pyro-breaker operated and the current switched to the discharge resistor R. The current pulse length and its value depended on the inductance of the coil, L. The Rogowski coils, RC1 and RC2, were installed to measure the current in the pyro-breaker and the discharge resistor branches. A high-voltage probe was used to measure the voltage across the pyro-breaker.
The PSCAD model was built to simulate the test circuit of the ITER pyro-breaker, as shown in Figure 4. To simplify the simulation, a DC resource was selected as the power supply. Due to the characteristics of the electrical components, a resistor, R1, was added to the inductance in the main circuit and an inductor, L2, was added to the discharge resistor branch. The electrical parameters were set according to the ITER pyro-breaker test circuit, as shown in Table 1. The arc was regarded as a variable resistor, Rarc. The module, Rarc, was applied with the Schavemaker black-box arc model. Ipb is the current in the pyro-breaker branch. Ir is the current in the discharge resistor branch. Vpb is the voltage across the pyro-breaker. Since the resistance of the pyro-breaker was quite small, Vpb can be regarded as the arc voltage.
There are four parameters in the Schavemaker black-box arc model. E0 is used to modify and calculate the value in the large current area. It has little influence on the current zero-crossing area. Hence, E0 is set to 10 kV, according to the design requirements. For the values of τ, P0 and P1, it can be concluded from the above analysis that there is no unique set of solutions to fit the arc model of the pyro-breaker. Schavemaker gave a set of parameter choices for an arc burning in SF6: τ = 0.27 μs, P0 = 15.917 kW and P1 = 0.9943. According to the definition of each parameter, the time constant, τ, in water should be smaller than the time constant in gas [33], while the cooling power, P0, should be relatively larger than the cooling power in gas. Therefore, this study qualitatively selected a series of parameters in different orders of magnitude to run several simulations in PSCAD. It can be observed from the simulation results that as the time constant increased, the response time between arc ignition and breaking operation became longer. The cooling power, P0, mostly affects the voltage waveform, and even a slight variation in P1 has a significant effect on the time delay in arc ignition.
The oscillogram of the ITER pyro-breaker test at 72.5 kA is shown in Figure 5 [34]. As illustrated in Figure 5a, the commutation process began at 90 μs and finished at 199 μs, giving a total commutation time of 109 μs. The peak voltage was 14.9 kV, as shown in Figure 5b. In PSCAD, a set of simulations and parameter sweeping were conducted. Finally, a group of parameters that fit the test oscillogram was obtained, as illustrated in Figure 6. In the simulation, τ was 0.02 μs, P0 was 2500 kW and P1 was 1.00147. The commutation time, the value and the time peak voltage occurred in the simulation agreed with the test results.
Based on the above analysis, P1 is considered to be the only parameter affected by the input current among all four parameters. Hence, for pyro-breakers with the same driving mechanism, the value rule of P1 under different input currents I can be deduced. Based on this assumption, simulations and parameter fitting have been carried out for a large number of ITER pyro-breaker tests [34,35,36,37] and the P1-I diagram, illustrated in Figure 7, obtained.
By examining the P1-I diagram, it can be observed that the value of the parameter P1 has a linear relationship with the input current defined by Equation (5). The fit goodness (R2) is 0.98383.
P 1 = 2.374 × 10 5 I + 0.9997
It needs to be mentioned that a pyro-breaker is a single-action switch with a very fast and transient operation process driven by explosives. It is necessary to reassemble the breaker and reconnect it into the circuit after each test, which may alter the stray inductance value of the circuit. This can lead to differences in the commutation process under the same current. Therefore, the data obtained from several tests at the same current were averaged and any highly inconsistent datapoints were deleted.

3.2. Simulation and Experiment

The test model illustrated in Figure 4 was also applied to simulate the commutation process of the pyro-breaker designed for CFETR, in order to verify the proposed value rule of P1. As shown in Table 2, the electrical parameters were set according to the test circuit: P0 = 2500 kW, τ = 0.02 μs and E0 = 2 kV, according to the design requirements. Based on Equation (5), when the input current is 40 kA, P1 is 1.0006.
The simulation results are shown in Figure 8. Due to the setting of a delay, the current in the pyro-breaker branch began to commutate to the resistance branch from 200 μs. Simultaneously, the voltage across the breaker, i.e., the arc voltage, began to increase. The current in the pyro-breaker branch crossed the zero point at 413 μs. The arc voltage reached a peak value of 9.20 kV at 346 μs.
The commutation test of the pyro-breaker was carried out on a DC test platform. The output current of the platform was set to 40 kA. The test circuit is illustrated in Figure 9. The inductance of the discharge resistor branch was 20 μH. The resistance of the inductance was 2.5 mΩ. Two Rogowski coils were installed in the pyro-breaker branch and the discharge resistor branch to measure the current. A voltage differential probe was applied to measure the voltage across the breaker.
The oscillograms of the commutation test are shown in Figure 10. The current in the pyro-breaker branch began to commutate at 100 μs and finished at 321 μs. The current commutating speed reached its peak value at around 240 μs. This lead to a large di/dt and resulted in the appearance of a peak voltage of 9.17 kV.

3.3. Discussion

The application of black-box arc models in a circuit breaker is very complicated, especially when the arc is discharged underwater. The selection of parameters is the main problem. There are four parameters in the Schavemaker black-box arc model: the time constant, the cooling power, the cooling constant and the reference voltage constant. Based on a set of parameter choices given by Schavemaker, curve fitting for the ITER pyro-breaker was performed using the parameter sweep strategy. As illustrated in Figure 5 and Figure 6, the simulation in PASCAD corresponded well with the test results.
By analyzing the sweeping process and the simulations, it can be concluded that as the time constant increased, commutation duration became longer and the peak current became higher. The cooling power had the same effects as the reference voltage. They mostly affected the voltage waveform. As the cooling power increased, the voltage diagram changed into a sharp-shaped waveform. The cooling constant was the only parameter affected by the input current among all four parameters. As shown in Figure 7, within an input current range of 70–90 kA, the change in P1 was within 5 × 10⁻⁴. Even a slight variation in P1 had a significant effect on the time delay of the arc ignition. This might be because the model was applied in a high-power situation. The influence of the electrical power input was relatively higher than in the lower input power situation. Moreover, the stray inductance value of the circuit varies every time the pyro-breaker is reassembled and connected into the circuit, leading to differences in the commutation process under the same current. Any analysis of the relationship between P1 and the input current needs take this variation into account.
As shown in Figure 8a, the commutation time was 213 μs and the commutation speed reached its highest value at 146 μs in the simulation results. As shown in Figure 10a, the commutation time was 221 μs and the commutation speed reached its highest value at 140 μs in the experimental results. By comparing the results of the simulation and the experiment, it can be concluded that the current commutation time and the peak voltage obtained from the simulation agree with the experimental results. It can be inferred that the values for (P0, τ and E0) determined in this paper can be applied in pyro-breakers with a similar driving mechanism, and that P1 can be determined by the proposed method under different input currents.
It can be observed from Figure 10a that the current curve of Ir has a small hump in the beginning section of the commutation phase. This might because multiple gaps are formed at different speeds during the explosion. This would result in a certain randomness in the rate of change of the arc resistance and the arc voltage. As illustrated in Figure 8b, the simulated voltage has a smoother waveform than the voltage waveform of the test illustrated in Figure 10b. For modelling purposes, in this paper the multiple arcs were regarded as a single arc. In future simulations, this randomness could be treated as a factor of the arc model to enhance the accuracy of the simulation.

4. Conclusions

The arc, as an inevitable phenomenon occurring when a direct current (DC) circuit breaker is opened, directly determines the performance of the breaker. It is very challenging to develop a pure physical model based on arc characteristics. Many studies have focused on the application of the black-box arc model in the analysis of arc behavior in circuit breakers. Nevertheless, the application of the black-box arc model for this type of breaker, in which the arc ignites under water, remains to be explored.
The Schavemaker arc black-box model was applied to study the current commutation of the presented pyro-breaker. By analyzing the test results of the pyro-breaker in ITER, a suitable method for the selection of parameters was proposed. The feasibility of this method was verified by means of experiments on the pyro-breaker prototype designed for the China Fusion Engineering Test Reactor (CFETR), which was developed from the concept of the pyro-breaker used in ITER. This method provided a theoretical basis for the study of the current commutation process of the pyro-breaker.
Since the pyro-breaker presented here is an extremely fast, nonlinear and single-operated switch, it is necessary to build a more accurate and stable test platform to measure the commutation process. A high-speed camera could be implemented into the platform to inspect the arc’s behavior during the operation. Also, the randomness in the gap formation of the commutation section (CS) should be factored into the arc modeling to enhance the accuracy of the simulation. The operation time is extremely short, so contamination of the deionized water was ignored in this paper. However, changes in the electrical characteristics of the water and their effect on arc ignition could be valuable future research directions. Moreover, for this kind of complex problem, Artificial Intelligence techniques could be considered for parameter fitting in the future.

Author Contributions

Conceptualization, J.H. and J.L.; methodology, J.H.; validation, J.H., K.W. and J.L.; formal analysis, J.H.; writing—original draft preparation, J.H.; writing—review and editing, J.H., K.W. and J.L.; supervision, J.L. and K.W.; project administration, J.L.; funding acquisition, J.L. and K.W. All authors have read and agreed to the published version of the manuscript.

Funding

This research was funded by the National Key Research and Development Program of China, grant number 2017YFE0300500.

Institutional Review Board Statement

Not applicable.

Informed Consent Statement

Not applicable.

Data Availability Statement

Not applicable.

Acknowledgments

This work was supported by Shenzhen Clean Energy Research Institute. The authors would like to express gratitude to Honghao Ma of University of Science and Technology of China and the students who helped with the experiments.

Conflicts of Interest

The authors declare no conflict of interest.
Nomenclature of the Variables
garc conductance
ttime
uarc voltage
iarc current
τtime constant
P0cooling power
E0reference arc voltage
P1cooling constant
Ipbcurrent in the pyro-breaker branch
Ircurrent in the discharge resistor branch
Vpbvoltage across the pyro-breaker
R2fit goodness
Abbreviations
DCdirect current
ACalternating current
QPSQuench Protection System
ITERInternational Thermonuclear Experimental Reactor
CFETRChina Fusion Engineering Test Reactor
PSCAD Power Systems Computer Aided Design
CSCommutation Section

References

  1. Park, J.S.; Choi, J.H.; Gu, B.G.; Jung, I.G. Feasibility study of DC electrical distribution system. In Proceedings of the 8th International Conference on Power Electronics—ECCE Asia, Jeju, Korea, 29 May 2011–2 June 2011; pp. 2935–2938. [Google Scholar] [CrossRef]
  2. Li, H.; Xiang, B.; Song, W.; Geng, Y.; Liu, Z.; Wang, J.; Pei, X.; Tu, Y. Effect of Arc Chute on DC Current Interruption by Liquid Nitrogen in HTS Electrical System of Distributed Propulsion Aircraft. IEEE Trans. Appl. Supercond. 2021, 31, 1–5. [Google Scholar] [CrossRef]
  3. Yazdani-Asrami, M.; Zhang, M.; Yuan, W. Challenges for developing high temperature superconducting ring magnets for rotating electric machine applications in future electric aircrafts. J. Magn. Magn. Mater. 2021, 522, 1–3. [Google Scholar] [CrossRef]
  4. Niewind, J.; Hemdan, N.G.A.; Klosinski, C.; Bösche, D.; Kurrat, M.; Gerdinand, F.; Meisner, J.; Passon, S. Operation and protection of 380V DC distribution systems. In Proceedings of the 2017 IEEE Manchester PowerTech, Manchester, UK, 18–22 June 2017; pp. 1–6. [Google Scholar] [CrossRef]
  5. Fu, P.; Song, Z.Q.; Gao, G.; Tang, L.J.; Wu, Y.B.; Wang, L.S.; Liang, X.Y. Quench protection of the poloidal field superconducting coil system for the EAST tokamak. Nucl. Fusion. 2006, 46, S85. [Google Scholar] [CrossRef]
  6. Rummel, T.; Gaupp, O.; Lochner, G.; Sapper, J. Quench protection for the superconducting magnet system of WENDELSTEIN 7-X. IEEE Trans. Appl. Supercond. 2002, 12, 1382. [Google Scholar] [CrossRef]
  7. Barabaschi1, P.; Kamada, Y.; Shirai, H. Progress of the JT-60SA project. Nucl. Fusion. 2019, 59, 112005. [Google Scholar] [CrossRef]
  8. Song, I.; Choi, C.; Cho, M. Quench Protection System for the Superconducting Coil of the KSTAR Tokamak. IEEE Trans. Appl. Supercond. 2007, 17, 1–6. [Google Scholar] [CrossRef]
  9. Manzuk, M.; Avanesov, S.; Roshal, A.; Bestuzhev, K.; Nesterenko, A.; Volkov, S. The 70 kA pyrobreaker for ITER magnet back-up protection. Fusion Eng. Des. 2013, 88, 1537–1540. [Google Scholar] [CrossRef]
  10. Zhu, J.; Zhang, Y.; Dong, Y.; HL-2A Team. Characterization of plasma current quench during disruptions at HL-2A. Plasma Sci. Technol. 2017, 19, 055101. [Google Scholar] [CrossRef] [Green Version]
  11. Ren, Y.; Zhu, J.; Gao, X.; Shen, F.; Chen, S. Electromagnetic, mechanical and thermal performance analysis of the CFETR magnet system. Nucl. Fusion. 2015, 55, 093002. [Google Scholar] [CrossRef]
  12. Zheng, J.; Song, Y.; Liu, X.; Lu, K.; Qin, J. Overview of the Design Status of the Superconducting Magnet System of the CFETR. IEEE Trans. Appl. Supercond. 2018, 28, 4204305. [Google Scholar] [CrossRef]
  13. Song, Y.; Wu, S.; Li, J.; Wan, B.; Wan, Y.; Fu, P.; Ye, M.; Liu, S.; Gao, X. Concept design of CFETR Tokamak machine. In Proceedings of the 2013 IEEE 25th Symposium on Fusion Engineering (SOFE), San Francisco, CA, USA, 10–14 June 2013; pp. 1–6. [Google Scholar] [CrossRef]
  14. He, J.; Song, Z.; Tang, C.; Fu, P.; Zhang, J. Study of contact resistance in the design of a pyro-breaker applied in superconducting fusion facility. Plasma Sci. Technol. 2019, 21, 065602. [Google Scholar] [CrossRef]
  15. He, J.; Song, Z.; Tang, C.; Fu, P.; Ye, J. Designing of cooling water system for a pyro-breaker utilized in superconductive fusion facility. Fusion Eng. Des. 2019, 148, 111294. [Google Scholar] [CrossRef]
  16. Gammon, T.; Lee, W.; Zhang, Z.; Johnson, B.C. A Review of Commonly Used DC Arc Models. IEEE Trans. Ind. Appl. 2015, 51, 1398. [Google Scholar] [CrossRef]
  17. Khakpour, A.; Franke, S.; Uhrlandt, D.; Gorchakov, S.; Methling, R. Electrical Arc Model Based on Physical Parameters and Power Calculation. IEEE Trans. Plasma Sci. 2015, 43, 2721. [Google Scholar] [CrossRef]
  18. Rau, S.; Zhang, Z.; Lee, W. 3D magnetohydrodynamic modeling of DC arc in power system. In Proceedings of the 2016 IEEE/IAS 52nd Industrial and Commercial Power Systems Technical Conference (I&CPS), Detroit, MI, USA, 1–5 May 2016; pp. 1–7. [Google Scholar] [CrossRef]
  19. Cassie, A.M. Arc Rupture and Circuit Severity: A New Theory. In Proceedings of the Conférence Internationale des Grands Réseaux Électriques à Haute Tension (CIGRE Report), Paris, France, 29 June–8 July 1939; Volume 102, pp. 1–14. [Google Scholar]
  20. Mayr, O. Beitrage zur Theorie des Statischen und des Dynamischen Lichtbogens. Arch. Elektr. 1943, 37, 588–608. [Google Scholar] [CrossRef]
  21. Wu, X.; Li, Z.; Tian, Y.; Mao, W.; Xie, X. Investigate on the simulation of black-box arc model. In Proceedings of the 2011 1st International Conference on Electric Power Equipment—Switching Technology, Xi’an, China, 23–27 October 2011; pp. 629–636. [Google Scholar] [CrossRef]
  22. Ahmethodzic, A.; Kapetanovic, M.; Sokolija, K.; Smeets, R.P.P.; Kertesz, V. Linking a physical arc model with a black box arc model and verification. IEEE Trans. Dielectr. Electr. Insul. 2011, 18, 1029. [Google Scholar] [CrossRef]
  23. Schavemaker, P.H.; Slui, L. An improved Mayr-type arc model based on current-zero measurements [circuit breakers]. IEEE Trans. Power Deliv. 2000, 15, 580–584. [Google Scholar] [CrossRef]
  24. Guardado, J.L.; Maximov, S.G.; Melgoza, E.; Naredo, J.L.; Moreno, P. An improved arc model before current zero based on the combined Mayr and Cassie arc models. IEEE Trans. Power Deliv. 2005, 20, 138. [Google Scholar] [CrossRef]
  25. Gao, Y.; Wang, L.; Zhang, Y.; Zeng, K. Research on the Calculation Method for the Parameters of the Simplified Schavemaker AC Arc Model. In Proceedings of the 2018 Prognostics and System Health Management Conference (PHM-Chongqing), Chongqing, China, 26–28 October 2018; pp. 150–156. [Google Scholar] [CrossRef]
  26. Wang, D.; Liao, M.; Wang, R.; Li, T.; Qiu, J.; Li, J.; Duan, X.; Zou, J. Research on Vacuum Arc Commutation Characteristics of a Natural-Commutate Hybrid DC Circuit Breaker. Energies 2020, 13, 4823. [Google Scholar] [CrossRef]
  27. Hashemi, E.; Niayesh, K. DC Current Interruption Based on Vacuum Arc Impacted by Ultra-Fast Transverse Magnetic Field. Energies 2020, 13, 4644. [Google Scholar] [CrossRef]
  28. Najam, A.; Pieterse, P.; Uhrlandt, D. Electrical Modelling of Switching Arcs in a Low Voltage Relay at Low Currents. Energies 2020, 13, 6377. [Google Scholar] [CrossRef]
  29. Haupt, M. Untersuchung der Anwendungsmöglichkeiten von Lichtbogenzweipolmodellen zur Beschreibung des Thermischen Schaltverhaltens von SF6-Leistungsschaltem. PhD Thesis, RWTH Aachen University, Aachen, Germany, 12 February 1988. [Google Scholar]
  30. Strang, G. Linear Algebra and its Applications, 3rd ed.; Harcourt Brace Jovanovich Publishers: London, UK, 2010. [Google Scholar]
  31. Lim, S.; Khan, U.A.; Lee, J.; Lee, B.; Kim, K.; Gu, C. Simulation analysis of DC arc in circuit breaker applying with conventional black box arc model. In Proceedings of the 2015 3rd International Conference on Electric Power Equipment—Switching Technology (ICEPE-ST), Busan, Korea, 25–28 October 2015; pp. 332–336. [Google Scholar] [CrossRef]
  32. Park, K.; Lee, H.; Asif, M.; Lee, B.; Shin, T.; Gu, C. Assessment of various kinds of AC black-box arc models for DC circuit breaker. In Proceedings of the 2017 4th International Conference on Electric Power Equipment—Switching Technology (ICEPE-ST), Xi’an, China, 22–25 October 2017; pp. 465–469. [Google Scholar] [CrossRef]
  33. Yoon, K.H.; Spindle, H.E. A Study of the Dynamic Response of Arcs in Various Gases. Trans. Am. Inst. Electr. Eng. 1958, 77, 1634–1640. [Google Scholar] [CrossRef]
  34. Miklyaev, S. Pirobreaker RD-Test Report. JQ9M2X; Efremov Institute: St. Petersburg, Russia, 2013. [Google Scholar]
  35. Miklyaev, S. Test Report on Pirobreaker. MN7QZ6; Efremov Institute: St. Petersburg, Russia, 2014. [Google Scholar]
  36. Miklyaev, S. Report on Reliability Tests of the TF FDU Pirobreaker (Step 3). MU3Q8N; Efremov Institute: St. Petersburg, Russia, 2014. [Google Scholar]
  37. Miklyaev, S. Report on Reliability Tests of the TF FDU Pirobreaker (Step 4). RDTSHR; Efremov Institute: St. Petersburg, Russia, 2015. [Google Scholar]
Figure 1. Structure of the CS of the pyro-breaker: (1) upper conductor (2) deionized water (3) barrel conductor (4) support epoxy (5) explosive (6) lower conductor.
Energies 14 04383 g001
Figure 2. Formation of the barrel conductor in operation: (1) exterior epoxy (2) support epoxy (3) arc (4) explosive (5) barrel conductor (6) rings.
Energies 14 04383 g002
Figure 3. The test circuit of ITER pyro-breaker.
Energies 14 04383 g003
Figure 4. The PSCAD model of the commutation test circuit.
Energies 14 04383 g004
Figure 5. ITER pyro-breaker tested at 72.5 kA: (a) Current oscillogram; (b) Voltage oscillogram.
Energies 14 04383 g005
Figure 6. Simulation results in PSCAD of the ITER pyro-breaker at 72.5 kA: (a) Current oscillogram; (b) Voltage oscillogram.
Energies 14 04383 g006
Figure 7. P1-I diagram of ITER pyro-breaker.
Energies 14 04383 g007
Figure 8. Simulation results in PSCAD of the CFETR pyro-breaker at 40 kA: (a) current oscillogram; (b) voltage oscillogram.
Energies 14 04383 g008
Figure 9. The test circuit of the CFETR pyro-breaker.
Energies 14 04383 g009
Figure 10. CFETR pyro-breaker tested at 40 kA: (a) current oscillogram; (b) voltage oscillogram.
Energies 14 04383 g010
Table 1. The electrical parameters in the ITER pyro-breaker test circuit.
Electrical ComponentsL1R1L2R2
Value5 mH2.5 mΩ5 μH133 mΩ
Table 2. The electrical parameters in the CFETR pyro-breaker test circuit.
Electrical ComponentsL1R1L2R2
Value5 mH2.5 mΩ20 μH50 mΩ
Publisher’s Note: MDPI stays neutral with regard to jurisdictional claims in published maps and institutional affiliations.

