
Low-Speed Marine Diesel Engine Modeling for NOx Prediction in Exhaust Gases


Abstract
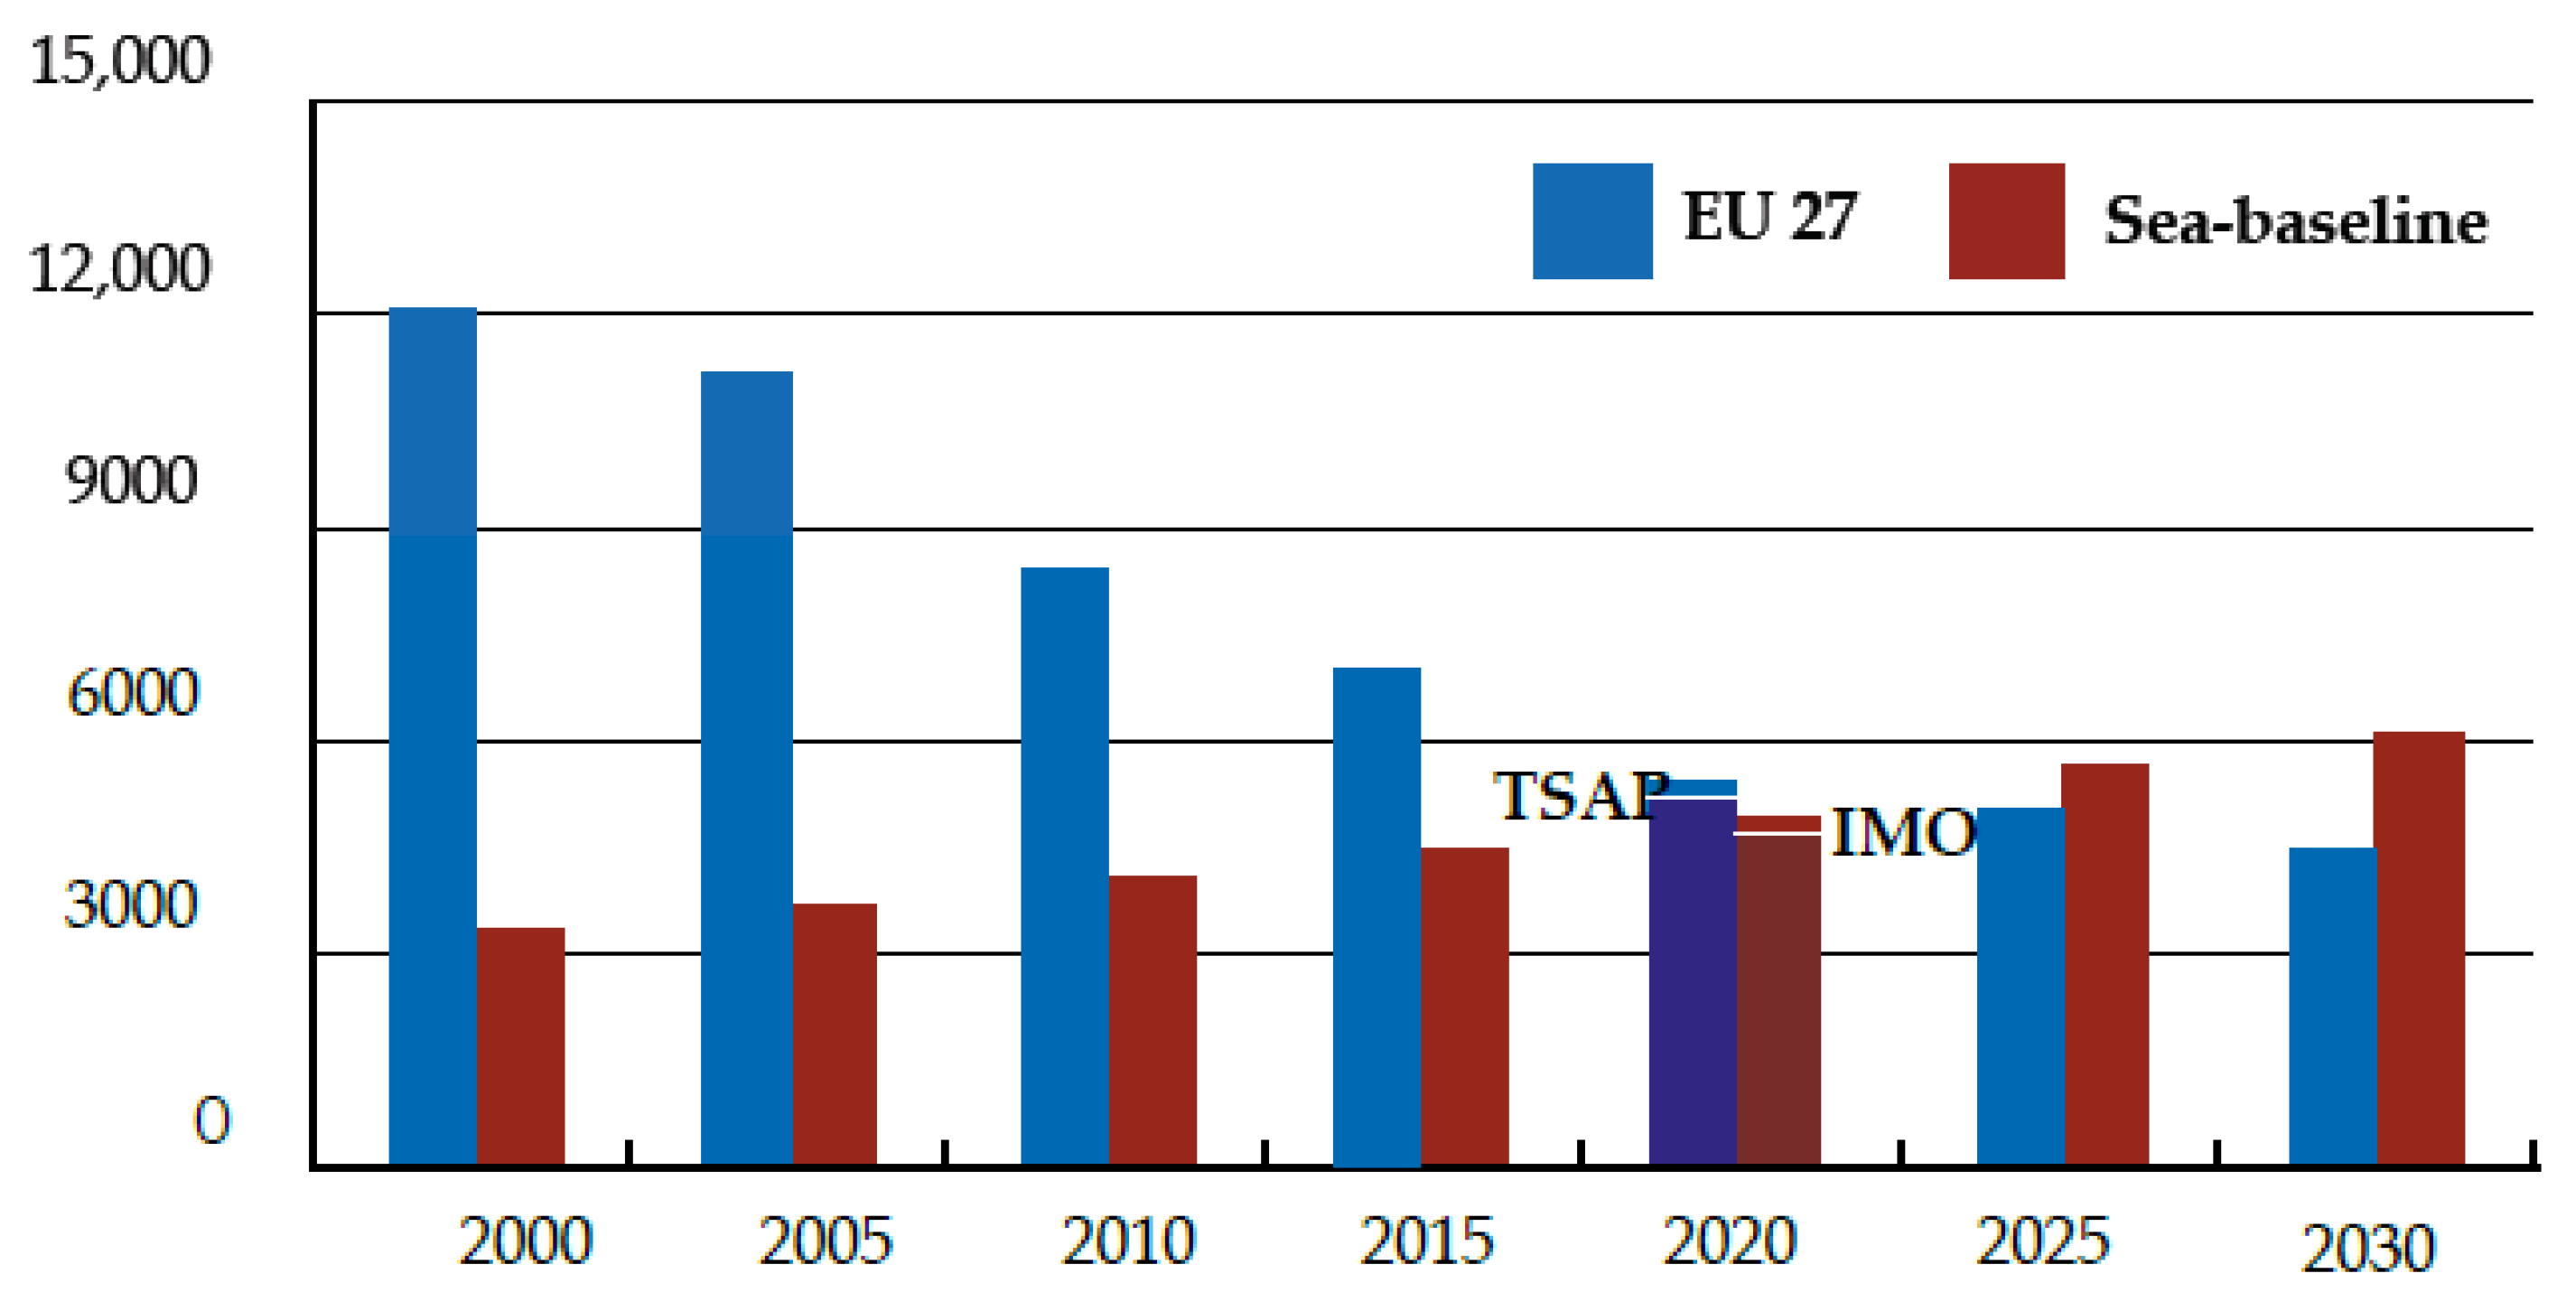
:1. Introduction
2. Description of the Simulation Model
3. Marine Diesel Engines Exhaust Emissions
3.1. Nitrogen Oxides
- Thermal NO;
- Prompt NO;
- N2O route;
- Fuel-bound nitrogen (FBN).
3.1.1. Thermal NO
3.1.2. Prompt NO
3.1.3. N2O Route
3.1.4. Fuel-Bound Nitrogen (FBN)
4. Influential Parameters of the Diesel Engine on the Formation of Nitric Oxide
4.1. Influence of Change of Injection Timing on Formation of Nitrogen Oxides
- Individual adjustment on each fuel oil high-pressure pump is enabled separately to equalize the maximum combustion pressures on each engine cylinder (±3 bar), which can be conducted in two ways:
- By physically moving the position of the servo on each fuel oil high-pressure pump VIT lever;
- By adjusting the screw connection of the VIT lever between the servo positioner and the lever of the VIT control (such as adjusting the indicated combustion pressure by acting on the lever to regulate the amount of fuel at each high-pressure pump).
- Common adjustment: for the whole engine, this is performed on the pneumatic position sensor unit located on the emergency control panel. Commonly, adjustments are performed if:
- There is a deviation of fuel quality from the prescribed quality;
- In case of wear of the high-pressure pump or if there has been a significant change in the fuel net specific energy.
4.2. Influence of Change of Compression Ratio on the Formation of Nitrogen Oxides
5. Testing, Verification and Validation of the Simulation Model
- Process: two-stroke, direct injection;
- Number and engine design: 6, in line;
- Cylinder diameter: 500 mm;
- Stroke: 2214 mm;
- Ignition sequence: 1-5-3-4-2-6;
- Maximum continuous rating MCR: 8680 kW;
- Maximum continuous engine speed: 103 rpm;
- Highest mean effective pressure: 19.4 bar;
- Highest combustion pressure: 184.8 bar;
- Brake-specific fuel consumption BSFC: 170.57 g/kWh @ 100% MCR;
- Compression ratio: 14.3;
- Ratio of crank radius to the connecting rod length: 0.5;
- Exhaust manifold volume: 6.13 m3;
- Scavenging air manifold volume: 7.14 m3;
- Scavenging ports opening angle: 40° before BDC;
- Scavenging ports closing angle: 40° after BDC;
- Exhaust valve opening angle: 60 to 65° before BDC;
- Exhaust valve closing angle: 95 to 100° after BDC.
- Environmental temperature: 30 °C;
- Atmospheric pressure: 758 mmHg/1011 mbar;
- Relative humidity: 45%.
6. Analysis of the Influence of the Injection Timing Change on the Formation of Nitrogen Oxides
7. Analysis of the Influence of the Change in the Compression Rate on the Formation of Nitrogen Oxides
8. Conclusions
Author Contributions
Funding
Institutional Review Board Statement
Informed Consent Statement
Data Availability Statement
Conflicts of Interest
Abbreviations
| BDCCFD | Bottom Dead leftComputational Fluid Dynamics |
| DMAEGR | Distillate Marine Fuel, Grade AExhaust Gases Recirculation |
| EU | European Union |
| F | Fuel |
| FBN | Fuel-Bound Nitrogen |
| IMO | International Maritime Organization |
| ISO | International Organization for Standardization |
| MAN | Maschinenfabrik Augsburg Nürnberg |
| MARPOL | International Convention for the Prevention of Pollution from |
| MCR | Maximum Continuous Rating |
| MEPC | Marine Environment Protection Committee |
| MSSCR | MicrosoftSelective Catalytic Reactor |
| SEU27 | Emissions from land-based sources (incl. domestic shipping) |
| TSAP | Target in line with the EU’s Thematic Strategy on Air Pollution |
| VBA | Visual Basic for Application |
| VEC | Variable Exhaust Valve Closing |
| VIT | Variable Injection Timing |
| Latin Symbols | |
| A | Frequency of collisions of molecules |
| A0 | Stoichiometric amount of air, kgair/kgfuel |
| Awall | Total combustion chamber surface, m2 |
| BSFC | Brake Specific Fuel Consumption, g/kWh |
| C1 | Constant in Equation (11), m/sK |
| C2 | Constant in Equation (11), m/sK |
| CA | Crank Angle, ° |
| cm | Mean piston speed, m/s |
| CN | Fuel cetane number |
| cvm | Mean piston speed, m/s |
| cvr | Mean gases speed, m/s |
| dc | Cylinder diameter, m |
| dp | Cylinder pressure change, bar/°α |
| dQ | Heat transferred to the gas, J/°α |
| dQch | Amount of chemical energy, J/°α |
| dQwall | Heat transferred to the chamber surface, J/°α |
| dV | Cylinder volume change, m3/°α |
| Ea | Activation energy, J/kmolK |
| G | Gibbs potential at standard pressure, kJ/kmol |
| h | Amount of hydrogen, kgh/kgfuel |
| hk | Height from the piston crown and the first compression ring, m |
| k | Arrhenius rate constant |
| k1 | Rate constant of the first Zeldovich reaction |
| k2 | Rate constant of the second Zeldovich reaction |
| k3 | Rate constant of the third Zeldovich reaction |
| Kp | Equilibrium constant |
| m | Vibe function form factor |
| mair, d | Mass of delivered air, kg/kWh |
| mair, stoich | Mass of air required for stoichiometric combustion, kg/kWh |
| N2O | Nitrous oxide |
| N2O3 | Dinitrogen trioxide |
| N2O5 | Dinitrogen pentoxide |
| NO | Nitrogen monoxide |
| NO2 | Nitrogen dioxide |
| NOx | Nitrogen oxide emission concentration, g/kWh |
| o | Amount of oxygen, kgo/kgfuel |
| O3 | Ozone |
| p | Combustion pressures, bar |
| pc,UZ | Pressure at the time of closing the exhaust valve, bar |
| Pe | Effective engine power, kW |
| pe | Mean effective pressure, bar |
| Pi | Indicated engine power, kW |
| pi | Mean indicated pressure, bar |
| pinj | Pressure at the time of injection, bar |
| pmax | Maximum combustion pressure, bar |
| pmot | Motoring pressure (cylinder pressure without combustion), bar |
| R | Universal gas constant, J/kmolK |
| Rcp | Gas constant of combustion products |
| ROHR | Rate of Heat Release, MJ |
| rpm | Revolution Per Minutes, min−1 |
| s | Amount of sulfur, kgs/kgfuel |
| T | Temperature, K |
| Tc,UZ | Temperature at the time of closing the exhaust valve, K |
| Tinj | Temperature at the time of fuel injection, K |
| Tmax | Maximum combustion temperature, K |
| V | Cylinder volume, m3 |
| v | Rate of reaction progress |
| Vc,UZ | Cylinder volume at the time of closing the exhaust valve, m3 |
| VK | Cylinder clearance volume, m3 |
| Vs | Clearance volume, m3 |
| VS | Cylinder displacement volume, m3 |
| xN2 | Mole fraction of nitrogen |
| xO2 | Mole fraction of oxygen |
| Greek symbols | |
| αwall | Heat transfer coefficient |
| γ | Ratio of specific heat capacities at constant pressure and volume |
| Δl | Change in compression shim thickness, mm |
| ε | Compression ratio |
| ηm | Mechanical efficiency |
| λai | Excess air ratio |
| λm | Ratio of crank radius to the connecting rod length |
References
- European Environmental Bureau-Air Pollution from Ships. Available online: http://www.cleanshipping.org/download/111128_Air%20pollution%20from%20ships_New_Nov-11%283%29.pdf (accessed on 15 November 2018).
- American LUNG Association-Nitrogen Dioxide. Available online: https://www.lung.org/our-initiatives/healthy-air/outdoor/air-pollution/nitrogen-dioxide.html (accessed on 25 November 2020).
- Rules for Technical Supervision of Sea-Going Ships, Part 22—Pollution Prevention; Croatian Register of Shipping: Split, Croatia, 2010.
- Komar, I.; Lalić, B. Chapter 8: Sea Transport Air Pollution, In Current Air Quality Issues; IntechOpen: Rijeka, Croatia, 2015; pp. 165–202. [Google Scholar] [CrossRef] [Green Version]
- Lamas, M.I.; Rodriguez, C.G. Emissions from Marine Engines and NOx Reduction Methods. J. Marit. Res. 2012, IX, 77–82. [Google Scholar]
- Llamas, X.; Eriksson, L. Control-oriented modeling of two-stroke diesel engines with EGR for marine applications. Proc. Inst. Mech. Eng. Part M J. Eng. Marit. Environ. 2018, 233, 1–24. [Google Scholar]
- Foteinos, M.; Papazoglou, A.; Kyrtatos, N.P.; Stamatelos, T. A Three-Zone Scavenging Model for Large Two-Stroke Uniflow Marine Engines Using Results from CFD Scavenging Simulations. Energies 2019, 12, 1719. [Google Scholar] [CrossRef] [Green Version]
- Lamas, M.; Vidal, C.G.R.V. Computational Fluid Dynamics Analysis of the Scavenging Process in the MAN B&W 7S50MC Two-Stroke Marine Diesel Engine. J. Ship Res. 2012, 56, 154–161. [Google Scholar]
- Lalić, B.; Komar, I.; Nikolić, D. Optimization of Ship Propulsion Diesel Engine to Fulfill the New Requirements for Exhaust Emission. Trans. Marit. Sci. 2014, 3, 20–31. [Google Scholar] [CrossRef] [Green Version]
- Hountalas, D.T.; Raptotasios, S.; Antonopoulos, A.; Daniolos, S.; Dolaptzis, I.; Tsobanoglou, M. Two-Stroke Marine Diesel Engine Variable Injection Timing System Performance Evaluation And Optimum Setting For Minimum Fuel Consumption At Acceptable NOx Levels. In Proceedings of the ASME 2014, 12th Biennial Conference on Engineering Systems Design and Analysis, ESDA2014-20528, Copenhagen, Denmark, 25–27 June 2014. [Google Scholar]
- Forero, J.D.; Valencia, G.E.; Obregon, L.G. Study of the Influence of Compression Ratio on the Rate of Heat Release in Small Displacement Diesel Engines. Indian J. Sci. Technol. 2018, 11, 1–8. [Google Scholar]
- Serin, H.; Yildizhan, Ş. Influence of the compression ratio on the performance and emission characteristics of a vcr diesel engine fuelled with alcohol blended fuels. Eur. Mech. Sci. 2017, 1, 39–46. [Google Scholar] [CrossRef]
- Heywood, J.B. Internal Combustion Engine Fundamentals, 2nd ed.; McGraw-Hill Series in Mechanical Engineering: New York, NY, USA, 2018. [Google Scholar]
- Rajkumar, M. Heat Release Analysis and Modeling for a Common-Rail Diesel Engine. Master’s Thesis, University of Tennessee, Knoxville, TN, USA, 2002. [Google Scholar]
- Grljušić, M.; Tolj, I.; Radica, G. An Investigation of the Composition of the Flow in and out of a Two-Stroke Diesel Engine and Air Consumption Ratio. Energies 2017, 10, 805. [Google Scholar] [CrossRef] [Green Version]
- Guan, C.; Theotokatos, G.; Chen, H. Analysis of Two Stroke Marine Diesel Engine Operation Including Turbocharger Cut-Out by Using a Zero-Dimensional Model. Energies 2015, 8, 5738–5764. [Google Scholar] [CrossRef] [Green Version]
- Račić, N. Simulation of Performance of the Ship Propulsion System with Slow Speed Diesel Engine in Aggravated Conditions. Ph.D. Thesis, Faculty of Engineering, University of Rijeka, Rijeka, Croatia, 2008. [Google Scholar]
- Woschni, G. Die Berechtung der Wandverluste und der thermischen Belastung der Bauteile von Dieselmotoren. MTZ Nr. 1970, 12, 491–499. [Google Scholar]
- Bernečić, D.; Šegulja, I. Heat transfer influence analysis on combustion pressure in two stroke slow speed marine diesel engines. Marit. Sci. J. Marit. Res. 2013, 27, 73–85. [Google Scholar]
- Radica, G. Expert System for Diagnosis and Optimization of Marine Diesel Engines. Ph.D. Thesis, Faculty of Mechanical Engineering and Naval Architecture, Zagreb, Croatia, 2004. [Google Scholar]
- Jankov, R. Matematičko Modeliranje Strujno-Termodinamičkih Procesa i Pogonskih Karakteristika Dizel Motora, Kvazistacionarni Modeli, I i II deo—Osnovi; Naučna knjiga: Beograd, Serbia, 1984. [Google Scholar]
- Lalić, B. Low Speed Marine Diesel Engine Modeling for NOx Prediction in Exhaust Gases. Ph.D. Thesis, Faculty of Electrical Engineering, Mechanical Engineering and Naval Architecture, University of Split, Split, Croatia, 2020. [Google Scholar]
- Parra, C.A.F. Heat Transfer Investigations in a Modern Diesel Engine. Ph.D. Thesis, University of Bath Department of Mechanical Engineering, Bath, UK, 2008. [Google Scholar]
- Tomić, M.; Jovanović, Z.; Knežević, D.; Masončić, Z.; Dragutinović, S. The Simple Method for IC Engine Heat Release Evaluation from Cylinder Pressure Record. In Proceedings of the 2015 International Conference on Advance in Software, Control and Mechanical Engineering (ICSCME 2015), Antalya, Turkey, 7–8 September 2015; pp. 1–8. [Google Scholar]
- McAllister, S.; Jyh-Yuan Chen, A.C. Fernandez-Pello: Fundamentals of Combustion Processes; Springer Science + Business Media: New York, NY, USA, 2011. [Google Scholar]
- Filipović, I.; Lipanović, S. General and Inorganic Chemistry, Part I General Chemistry; Schoolbook: Zagreb, Croatia, 1995. [Google Scholar]
- Škifić, N. Influence Analisys of Engine Equipement Parameters on Diesel Engine Characteristics. Ph.D. Thesis, Faculty of Engineering, University of Rijeka, Rijeka, Croatia, 2003. [Google Scholar]
- Zeldovich, Y.A. The Oxidation of Nitrogen in Combustion and Explosions. J. Acta Physicochim. URSS 1946, 21, 577–628. [Google Scholar]
- Diotallevi, F. Development of a Multi-Zone Model for NOx Formation in Diesel Engines. Master’s Thesis, KTH Industrial Engineering and Management, Stockholm, Sweden, 2007. [Google Scholar]
- Turns, S.R. An Introduction to Combustion—Concepts and Applications, 2nd ed.; McGraw-Hill Series; Mechanical Engineering: New York, NY, USA, 2000. [Google Scholar]
- Weisser, G.A. Modelling of Combustion and Nitric Oxide Formation for Medium-Speed DI Diesel Engines: A Comparative Evaluation of Zero and Thre-Dimensional Approaches. Ph.D. Thesis, ETH Swiss Federal Institute of Technology, Zürich, Switzerland, 2001. [Google Scholar]
- Herding, G. Emissionsvehalten eines DI Dieselmotors bai Verwendung von Modulirter-und Pilot Einspritzung. Dissertation, Technische Universität, Graz, Austria, 1991. [Google Scholar]
- Yum, K.K. Modeling and Simulation of Transient Performance and Emission of Diesel Engine—Pseudo Bond Graph Approach to Modelling the Thermodynamic Process. Master’s Thesis, Norvegian University of Science and Technology, Trondheim, Norway, 2012. [Google Scholar]
- Hanson, R.K.; Salimian, S. Chapter 6: Survey of Rate Constants in the N/H/O System in Combustion Chemistry; Springer: New York, NY, USA, 1984; pp. 361–421. [Google Scholar]
- Isenburg, R.; Creping, J.; Beer, A. Diesel-Speichereinspritzsystem Common-Rail; Bosch: Stuttgart, Germany, 1998. [Google Scholar]
- U.S. Secretary of Commerce on behalf of the United States. J. Phys. Chem. Ref. Data 1992, 21, 411.
- U.S. Secretary of Commerce on behalf of the United States. J. Phys. Chem. Ref. Data 2005, 34, 814.
- Merker, G.P.; Hohlbaum, B.; Rauscher, M. Two-Zone Model for Calculation of Nitrogen-Oxide Formation in Direct Injection Diesel Engines. SAE 1993 Trans. 1993, 2043–2050. [Google Scholar] [CrossRef]
- Zajemska, M.; Poskart, A.; Musiał, D. The kinetics of nitrogen oxides formation in the flame gas. J. Econ. Enviromental Studies EES 2015, 15, 445–460. [Google Scholar]
- MAN PrimeSev Academy—ME Control System. Available online: https://www.mandieselturbo.com/docs/librariesprovider11/classificationsociety/me-critical-principles-by-vassilis-kois.pdf?sfvrsn=2 (accessed on 10 December 2019).
- MAN B&W Diesel—MAN B&W S50ME-B9.3-TII Project Guide, Electronically Controlled Two-stroke Engines with Camshaft Controlled Exhaust Valves, Edition 0.5. Available online: https://marine.man-es.com/applications/projectguides/2stroke/content/printed/S50ME-B9_3.pdf (accessed on 1 October 2019).
- Brodosplit-Diesel Engine Factory, Technical file MAN B&W S50ME-B9.3. 16 September 2016.


| Tier | Ship Construction Date on or After | rpm < 130 | 130 < rpm < 2000 | rpm ≥ 2000 |
|---|---|---|---|---|
| I | 1 January 2000 | 17.0 g/kWh | 45·n−0.2, e.g., 720 rpm= 12.1 g/kWh | 9.8 g/kWh |
| II | 1 January 2011 | 14.4 g/kWh | 44·n−0.23, e.g., 720 rpm = 9.7 g/kWh | 7.7 g/kWh |
| III | 1 January 2016 * | 3.4 g/kWh | 9·n−0.2, e.g., 720 rpm = 2.4 g/kWh | 2.0 g/kWh |
| First Chemical Reaction Forward Rate Constants, mol/cm3s | First Chemical Reaction Backward Rate Constants, mol/cm3s | Reference |
|---|---|---|
| [31] | ||
| [32] | ||
| [33] | ||
| [34] | ||
| [35] | ||
| [36] | ||
| / | [37,38] |
| First Chemical Reaction Forward Rate Constants, mol/cm3s | Calculated NO Concentration, mol/rpm | Calculated NOx Concentration, g/kWh | Measured NOx Concentration, g/kWh |
|---|---|---|---|
| 0.370183 | 36.0828 | 14.47 | |
| 8.623153 | 337.0949 | ||
| 15.974068 | 624.4557 | ||
| 1.803006 | 70.4828 | ||
| 2.3341·10−11 | 8.7068·10−10 |
| First Chemical Reaction Forward Rate Constants, mol/cm3s | Calculated NO Concentration, mol/rpm | Calculated NOx Concentration, g/kWh | Measured NOx Concentration, g/kWh |
|---|---|---|---|
| 0.231957 | 6.9402 | 10.37 | |
| 2.134097 | 63.8531 | ||
| 3.878566 | 116.0483 | ||
| 0.448852 | 13.4298 | ||
| 1.415·10−11 | 4.036·10−10 |
| Characteristic Values | Unit | ISO-F-DMA |
|---|---|---|
| Kinematic viscosity @ 50 °C | mm2/s | 2.913 |
| Density | kg/m3 | 834.3 |
| Net specific energy | kJ/kg | 42940 |
| Carbon | m/m | 85.86 |
| Hydrogen | m/m | 13.78 |
| Sulfur | m/m | 0.033 |
| Nitrogen | m/m | 0.0019 |
| Oxygen | m/m | 0.32 |
| Water | m/m | 0.0 |
| Engine Load (MCR) | Unit | 50% | 75% |
|---|---|---|---|
| Engine indicated power | kW | 4759.98 | 6856.19 |
| Engine effective power | kW | 4358.08 | 6505.20 |
| Mechanical efficiency | - | 0.9155 | 0.9488 |
| Engine speed | rpm | 81.90 | 93.60 |
| Compression pressure | bar | 127.10 | 139.86 |
| Max. combustion pressure | bar | 150.32 | 162.76 |
| Mean indicated pressure | bar | 13.37 | 16.85 |
| Fuel oil consumption | g/kWh | 163.45 | 164.21 |
| NOx (as NO2) | g/kWh | 14.47 | 10.37 |
| Engine Load (MCR) | Unit | 50% | 75% |
|---|---|---|---|
| Engine indicated power | kW | 4747.29 | 6851.72 |
| Engine effective power | kW | 4347.95 | 6500.95 |
| Mechanical efficiency | - | 81.90 | 93.60 |
| Engine speed | rpm | 81.90 | 93.60 |
| Compression pressure | bar | 127.10 | 139.86 |
| Max. combustion pressure | bar | 150.32 | 162.76 |
| Mean indicated pressure | bar | 13.34 | 16.84 |
| Fuel oil consumption | g/kWh | 163.44 | 164.21 |
| NOx (as NO2) | g/kWh | 14.47 | 10.37 |
| Engine Load (MCR) | Unit | 50% | 75% |
|---|---|---|---|
| Engine indicated power | kW | −0.266 | −0.065 |
| Engine effective power | kW | −0.232 | −0.065 |
| Mechanical efficiency | - | 0 | 0 |
| Engine speed | rpm | 0 | 0 |
| Compression pressure | bar | 0 | 0 |
| Max. combustion pressure | bar | −0.224 | −0.059 |
| Mean indicated pressure | bar | 0 | 0 |
| Fuel oil consumption | g/kWh | 0 | 0 |
| NOx (as NO2) | g/kWh | 0 | 0 |
| Δφ [°CA] | ΔφID [°CA] | pinj [bar] | Tinj [K] | Pi [kW] | pmax [bar] | Tmax [K] | BSFC [g/kWh] | NOx [g/kWh] |
|---|---|---|---|---|---|---|---|---|
| −2.0 | 1.9641 | 125.28 | 1095.62 | 5145.28 | 152.82 | 1562.93 | 150.86 | 17.82 |
| −1.5 | 1.9606 | 126.06 | 1099.54 | 5008.06 | 151.72 | 1552.44 | 154.99 | 16.98 |
| −1.0 | 1.9578 | 126.68 | 1102.79 | 4915.43 | 151.27 | 1546.68 | 157.92 | 16.18 |
| −0.5 | 1.9564 | 127.01 | 1104.35 | 4818.40 | 150.86 | 1540.47 | 161.10 | 15.33 |
| 0.0 | 1.9560 | 127.10 | 1104.76 | 4749.27 | 150.32 | 1537.13 | 163.44 | 14.47 |
| +0.5 | 1.9563 | 127.01 | 1104.35 | 4637.06 | 149.27 | 1535.87 | 167.39 | 13.92 |
| +1.0 | 1.9578 | 126.68 | 1102.78 | 4494.04 | 147.62 | 1535.24 | 172.72 | 13.12 |
| +1.5 | 1.9606 | 126.06 | 1099.53 | 4332.25 | 145.33 | 1534.76 | 179.17 | 12.42 |
| +2.0 | 1.9641 | 125.28 | 1095.62 | 4157.95 | 142.98 | 1533.81 | 186.68 | 11.85 |
| Δφ [°CA] | ΔφID [°CA] | pinj [bar] | Tinj [K] | Pi [kW] | pmax [bar] | Tmax [K] | BSFC [g/kWh] | NOx [g/kWh] |
|---|---|---|---|---|---|---|---|---|
| −2.0 | 2.2272 | 137.14 | 1001.18 | 7126.25 | 167.93 | 1469.54 | 157.88 | 13.63 |
| −1.5 | 2.2226 | 137.99 | 1005.38 | 7056.66 | 166.72 | 1468.57 | 159.44 | 12.46 |
| −1.0 | 2.2178 | 138.80 | 1009.98 | 6978.96 | 165.45 | 1467.68 | 161.22 | 11.67 |
| −0.5 | 2.2163 | 139.57 | 1010.12 | 6902.66 | 164.08 | 1466.86 | 163.00 | 10.97 |
| 0.0 | 2.2148 | 139.61 | 1012.06 | 6851.72 | 162.76 | 1466.11 | 164.21 | 10.37 |
| +0.5 | 2.2163 | 139.57 | 1010.12 | 6731.02 | 161.23 | 1465.37 | 167.15 | 9.61 |
| +1.0 | 2.2178 | 138.80 | 1009.98 | 6655.61 | 159.56 | 1464.68 | 169.05 | 8.68 |
| +1.5 | 2.2226 | 137.99 | 1005.38 | 6612.81 | 157.79 | 1463.69 | 170.14 | 7.84 |
| +2.0 | 2.2272 | 137.14 | 1001.18 | 6565.15 | 155.58 | 1462.75 | 171.38 | 7.12 |
| Δl [mm] | ε [[–] | ΔφID [°CA] | pinj [bar] | Tinj [K] | Pi [kW] | pmax [bar] | Tmax [K] | BSFC [g/kWh] | NOx [g/kWh] |
|---|---|---|---|---|---|---|---|---|---|
| −10.0 | 13.55 | 1.9968 | 116.01 | 1069.76 | 4421.50 | 138.66 | 1484.65 | 175.57 | 5.93 |
| −8.0 | 13.69 | 1.9874 | 118.23 | 1077.68 | 4487.26 | 141.00 | 1496.02 | 173.00 | 7.23 |
| −6.0 | 13.84 | 1.9786 | 120.45 | 1085.14 | 4552.95 | 143.33 | 1507.03 | 170.50 | 8.72 |
| −4.0 | 13.99 | 1.9705 | 122.67 | 1092.14 | 4618.57 | 145.66 | 1517.55 | 168.08 | 10.42 |
| −2.0 | 14.14 | 1.9630 | 124.88 | 1098.68 | 4684.12 | 147.99 | 1527.58 | 165.73 | 12.34 |
| 0.0 | 14.30 | 1.9560 | 127.10 | 1104.76 | 4749.61 | 150.32 | 1537.13 | 163.44 | 14.47 |
| +2.0 | 14.46 | 1.9495 | 129.32 | 1110.38 | 4815.01 | 152.64 | 1546.21 | 161.22 | 16.82 |
| +4.0 | 14.63 | 1.9434 | 131.54 | 1115.54 | 4880.36 | 154.96 | 1554.80 | 159.06 | 19.39 |
| +6.0 | 14.80 | 1.9379 | 133.76 | 1120.24 | 4945.63 | 157.28 | 1562.91 | 156.96 | 22.17 |
| +8.0 | 14.97 | 1.9327 | 135.97 | 1124.49 | 5010.84 | 159.59 | 1570.55 | 154.92 | 25.15 |
| +10.0 | 15.15 | 1.9279 | 138.19 | 1128.27 | 5075.99 | 161.90 | 1577.71 | 152.93 | 28.53 |
| Δl [mm] | ε [[–] | ΔφID [°KV] | pinj [bar] | Tinj [K] | Pi [kW] | pmax [bar] | Tmax [K] | BSFC [g/kWh] | NOx [g/kWh] |
|---|---|---|---|---|---|---|---|---|---|
| −10.0 | 13.55 | 2.3141 | 122.14 | 937.92 | 6444.91 | 151.61 | 1426.18 | 169.38 | 4.62 |
| −8.0 | 13.69 | 2.2902 | 125.68 | 953.97 | 6485.63 | 153.84 | 1434.88 | 168.32 | 5.52 |
| −6.0 | 13.84 | 2.2685 | 129.23 | 969.41 | 6526.28 | 156.08 | 1443.23 | 167.27 | 6.54 |
| −4.0 | 13.99 | 2.2488 | 132.77 | 984.24 | 6566.86 | 158.31 | 1451.21 | 166.23 | 7.69 |
| −2.0 | 14.14 | 2.2308 | 136.31 | 998.45 | 6607.37 | 160.53 | 1458.84 | 165.21 | 8.96 |
| 0.0 | 14.30 | 2.2143 | 139.86 | 1012.06 | 6647.80 | 162.76 | 1466.11 | 164.21 | 10.37 |
| +2.0 | 14.46 | 2.1993 | 143.40 | 1025.05 | 6688.17 | 164.98 | 1473.01 | 163.22 | 11.91 |
| +4.0 | 14.63 | 2.1856 | 146.95 | 1037.43 | 6728.46 | 167.21 | 1479.55 | 162.24 | 13.58 |
| +6.0 | 14.80 | 2.1729 | 150.49 | 1049.20 | 6768.69 | 169.42 | 1485.74 | 161.28 | 15.39 |
| +8.0 | 14.97 | 2.1614 | 154.03 | 1060.36 | 6808.85 | 171.64 | 1491.57 | 160.33 | 17.31 |
| +10.0 | 15.15 | 2.1507 | 157.58 | 1070.90 | 6848.95 | 173.86 | 1497.20 | 159.39 | 19.36 |
Publisher’s Note: MDPI stays neutral with regard to jurisdictional claims in published maps and institutional affiliations. |
© 2021 by the authors. Licensee MDPI, Basel, Switzerland. This article is an open access article distributed under the terms and conditions of the Creative Commons Attribution (CC BY) license (https://creativecommons.org/licenses/by/4.0/).
Share and Cite
Lalić, B.; Poljak, A.; Radica, G.; Mišura, A. Low-Speed Marine Diesel Engine Modeling for NOx Prediction in Exhaust Gases. Energies 2021, 14, 4442. https://doi.org/10.3390/en14154442
Lalić B, Poljak A, Radica G, Mišura A. Low-Speed Marine Diesel Engine Modeling for NOx Prediction in Exhaust Gases. Energies. 2021; 14(15):4442. https://doi.org/10.3390/en14154442
Chicago/Turabian StyleLalić, Branko, Andrijana Poljak, Gojmir Radica, and Antonija Mišura. 2021. "Low-Speed Marine Diesel Engine Modeling for NOx Prediction in Exhaust Gases" Energies 14, no. 15: 4442. https://doi.org/10.3390/en14154442