Abstract
With a growing demand for safe, clean, and affordable energy, countries across the world are now seeking to create and rapidly develop renewable energy (RE) businesses. The success of these businesses often hinges on their ability to translate RE into sustainable value for energy consumers and the multiple stakeholders in the energy industry. Such value includes low production costs due to an abundance of natural resources (e.g., wind, water, sunlight), and public health benefits from reduced environmental pollution. Despite the potential for value creation, many RE businesses have struggled to create affordable energy as abundant as that which is produced by traditional fossil fuels. The rationale being that traditional RE sources emanating from natural resources tend to rely on unpredictable weather conditions. Therefore, to help RE businesses deliver sustainable value, we should leverage disruptive innovation that is less dependent on natural resources. This paper is one of the first attempts to assess the impact of disruptive innovation on RE business performances based on the survey data obtained from multiple countries representing both emerging and developed economies.
1. Introduction
The International Energy Agency expect the current energy demand to increase by 37% in the next 25 years [1]. Similarly, the International Energy Outlook 2019 [2] predicted significant growth in worldwide energy demand over the 28 years from 2012 to 2040. Total worldwide consumption of energy is expected to grow from 549 quadrillion British thermal units (Btu) in 2012 to 629 quadrillion Btu in 2020, and eventually to 815 quadrillion Btu in 2040—a 48% increase—from 2012 to 2040 [3]. This rapidly growing energy demand cannot be filled by conventional fossil fuels such as oil, natural gas, and coal. Beyond these conventional energy sources having dwindled in recent years, their use has created adverse environmental conditions from carbon emissions and the natural habitats destroyed by their extraction. For example, the United States (US) alone demands approximately 20.5 million barrels of petroleum fuel every day, of which approximately 68% is consumed by the transportation sector alone. The increasing use of these fuels will continue to exacerbate issues with air pollution, intensify global warming, and result in other environmental problems such as acid rain from the emission of various contaminants such as CO2, CO, SOx, NOx, and other volatile organic compounds (VOCs) [4].
To make matters worse, energy prices have been rising. For example, the cost of oil adjusted for inflation rose from $9.94 in 1931 to $53.18 per barrel in April 2017 [5,6]. The growth in energy demand will primarily come from emerging economies in Asia, Africa, Latin America, and certain Middle Eastern regions, and be fueled by the rapid population growth and economic development. The latest Pew research report predicted that developing countries in these regions will account for two-thirds of the energy demand growth by 2030 [7]. As such, world leaders have begun to recognize the need for alternative energy sources and thus enacted laws and regulations to support their energy development and expansion. Examples of these alternative sources include nuclear, solar, hydro, wind, geothermal, and biomass. Except for nuclear power, these alternative energy sources provide clean, non-toxic, and environmentally friendly renewable energy; however, many of these sources will not be sufficient for completely replacing fossil fuels and satisfying growing energy demands. One of the promising alternative energy sources includes renewable energy (RE) that can replace conventional energy sources in electrical power systems due to its environmental and technical merits, especially with the variations in fossil fuel prices and their non-renewability [8]. In particular, China has utilized RE far more than its counterparts in developed economies as shown in Figure 1 and Figure 2.
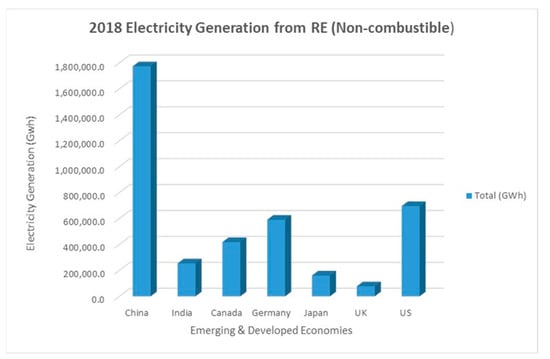
Figure 1.
The consumption of renewable energy for electricity across nations. Data sources: IEA (2018). Consistent, accurate and timely energy data and statistics, https://www.iea.org/data-and-statistics, accessed on 18 July 2021; National geographic (2020), Electricity generation from renewable energy, resource library.
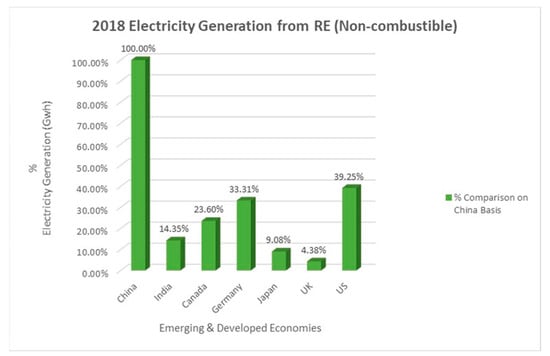
Figure 2.
The comparative use of renewable energy for electricity across nations. Data sources: IEA (2018). Consistent, accurate and timely energy data and statistics, https://www.iea.org/data-and-statistics, accessed on 18 July 2021; National geographic (2020), Electricity generation from renewable energy, resource library.
A lack of RE utilization has been attributed to the limited technology available for extraction and some commercialization failures. For instance, bio-fuel has been regarded as one of the most viable sources of RE. However, bio-fuel still requires various food sources such as soybeans, corn, coconuts, peanuts, cottonseeds, rapeseeds, and sunflowers, which are essential for daily living and thus can be expensive, especially where there are limited food supplies. In particular, the conventional wisdom is that the RE revolution is largely the domain of rich and developed countries. However, emerging economies have been leading the way in RE growth, since they view clean energy technology as a cost-efficient solution to their surging energy demands [9]. According to The Medium-Term Renewable Energy Market Report 2016 [10], the share of RE in global power generation rose to over 26% in 2020, from 22% in 2013. They also estimated that the amount of global electricity generated from RE would exceed the combined electricity demand of China, India, and Brazil in 2020.
Spurred by both economic and demographic growth, world energy consumption grew on an average of two percent a year during the 2000–2018 period [11]. Ever-growing energy consumption coupled with dwindling traditional energy sources such as fossil-fuel-based oil and gas creates a need for alternative energy sources. Those sources include RE that can be generated by solar, wind, geothermal, hydro-power, and bio-fuel. Unlike traditional energy sources, RE sources are plentiful and economical due to unlimited supplies from Mother Earth and are environmentally clean with no emitted greenhouse gases. The utilization of RE, however, necessitates technological innovation in converting raw energy sources into usable or affordable utilities. For instance, solar power generated by sunlight is non-dispatchable without an energy storage system for time-delayed usage due to cloud cover and limited daytime hours. This means that energy storage technologies such as battery technology are crucial for the utilization of solar power. Likewise, wind turbine technology is essential for generating wind power. As such, technological innovations play a critical role in converting natural resources into RE sources. Since technological innovations require out-of-the-box thinking and research and development (R&D) investments, RE businesses should transform their business mentality and business model. Lundvall [12] observed that the firm’s organizational culture could significantly affect its technological innovations. Similarly, Boons et al. [13] and Markides and Sosa [14] found that technological innovations tended to parallel business model innovations.
In general, business model innovations are referred to as the innovative processes and rationale of how an organization creates, delivers, and captures value as opposed to how to create a new product or service [15]. Business model innovations in the energy sector may encompass the adoption of lean principles in managing energy sources, the use of collaborative technology in remotely controlling energy grids, disruptive technology in generating renewable energy, data-driven marketing, changes in profit models, changes in energy consumer value propositions, and so forth. Examples of technological innovations aligned with business model innovations in the energy sector include hairy solar panels built on carbon-nanotube fabric, magnetic levitation of the wind turbines with disks capturing the wind from all directions, integrated photovoltaic/thermal (BIPVT) systems, and floating offshore wind technology in deep water [16,17]. Technological innovations accompanied by business model innovations would entail changes in the socio-technical landscape, the shared responsibility of caring for the surrounding community and the ecosphere, and reconstruction of the path for RE business developments [18,19].
Those changes will lead to the reformulation of the RE business’ energy production, marketing, and distribution strategies that will, in turn, affect the RE business performance. The rationale being that the adoption of new RE technology may enhance the efficiency of developing and delivering RE to its consumers and consequently improve the RE business performance. Considering the potential impact of technological and business model innovations on the RE business performance, the primary objective of this paper is to assess such an impact predicated on the theory of innovation, innovation diffusion, and social systems that will be expounded later. The novelty of this paper is the scientific investigation of the role of disruptive innovation in commercializing RE businesses successfully.
2. Literature Review
There exist abundant works in the literature on RE development, deployment, and impact analysis [20,21,22]. However, research proposing the integrated method of evaluating the performance of RE businesses from the perspectives of all the stakeholders is scant. At best, extant conventional RE businesses’ performance measures were discrete and focused primarily on financial returns. Thus, those measures paid little or no attention to the social, environmental, and perceptual dimensions that were significant to key decision-makers of the RE businesses [23]. Nevertheless, there are noteworthy pioneering studies proposing systematic performance measures of RE businesses. Those include Brent and Kruger [24] and Achtenhagen, et al. [25] who developed qualitative performance measures of RE businesses, whereas Awerbuch and Sauter (2006) developed quantitative performance measures. The prior literature on sustainability also provided us with the wider implications of RE businesses [13,26,27,28,29].
Other noticeable themes in the RE literature were primary focuses on the cases of developing countries (or emerging economies). However, such focuses might have been motivated by the premise that RE businesses in developing countries tended to lack sustainable infrastructures such as wind turbines, solar panels, and thermal power stations and thus increased the need for technology and business model innovations [30,31]. Nevertheless, a majority of the prior RE studies did not recognize a difference in RE businesses between developing and developed economies from innovation perspectives [32,33]. Business model innovations can spur creative solutions through entrepreneurial actions, create new markets for RE businesses, and boost revenue generation mechanisms [34]. Such implications of business model innovations for RE businesses were not captured by most of the prior RE literature including works focusing on the cases of developing countries [20,35].
For example, Painuly [36] developed a conceptual framework for identifying barriers to RE consumption. Some of the important barriers included the controlled energy sector due to the government monopoly, restricted access to technology, a lack of economic viability, high transaction cost, the high up-front cost of invested capital, limited RE market, a lack of R&D oriented culture, and a lack of RE-related information and its dissemination. Martinot et al. [37] conducted a descriptive study that assessed the size of rapidly growing RE markets in developing countries (especially Nepal and China) and reported how RE created by solar home systems, mini-grids, and biogas could affect both economic (reduced kerosene and candle use expenses) and social benefits (less time and labor for fuelwood collection and cooking). However, they did not evaluate the impact of RE use on rural development. Urmee et al. [38] conducted two case studies that analyzed the RE system designed to provide environment-friendly electricity to those living in rural communities in Bangladesh and Fiji. Huenteler et al. [39] conducted a case study of Thailand’s electricity sector to create realistic measures for the contributions of local and global technological learning to a reduction in utility cost and then discussed implications of such learnings for the international climate policy. Their study was one of the first to assess the impact of technology learning on the cost of generating RE. Recently, Ragosa and Warren [40] presented a logistics and fixed-effect model based on the data collected from the panel representing various developing countries to provide insights into the drivers and barriers for foreign private investment into the RE industry sector. They found that international public finance, regulatory support measures, feed-in tariffs, and political stability were major drivers for foreign private investment in RE power generation. Tocpu and Togcu [41] adopted two dynamic panel data estimation techniques based on the data collected from a panel of developed economies over the period 1990–2014 to investigate the impact of renewable energy consumption on income inequality.
Despite their significant contribution to the RE literature, none of these studies on RE use shed light on the RE business model innovations and built theoretical foundations for the commercialization of RE businesses and their links to disruptive innovation. This literature review also revealed that an empirical study intended for theory building was rare in the RE literature. To fill a research gap voided by the prior RE literature as summarized in Table 1, this paper aims to examine the role of disruptive innovation in enhancing the desired outcome (performance) of commercialized RE businesses in both emerging (developing) and developed countries predicated on the theory of innovation and social systems.

Table 1.
A review of selected prior literature on renewable energy.
3. Theory Building and Hypotheses Development
The three anchoring theories for this research are the theory of innovation, innovation diffusion, and social system theory. The theory of innovation (TOI), which encompasses the various processes of inventing new environmental technologies, has a theoretical underpinning for RE technology development and business model innovations [42]. TOI first proposed by Schumpeter [43] has emerged as economic thinking that doing things differently in the realm of economic life can influence the allocation of the organization’s given resources and the accumulation of its wealth [44,45]. TOI is predicated on the premise that a firm competes based on innovation capabilities that are valuable, rare, difficult to imitate, and non-substitutable by competitors. Put simply, TOI theorizes that a firm capable of accomplishing innovation can improve its performance and subsequently gain a competitive advantage in the marketplace. Herein, innovation refers to the process of bringing any new, problem-solving idea into use [45]. However, innovation does not necessarily refer to a new idea or the invention of new technology. Instead, it involves the realization of a new idea or development of a new system for commercial use that often leads to economic growth through positive social change [46,47]. Considering that RE business development can be regarded as an innovation capability by changing the business-as-usual mentality through conscious conservation and pollution prevention, the TOI may be useful for explaining how RE business development can improve firm performance. Innovation in RE business development includes an understanding of customers’ need for alternative energy sources as part of knowledge creation and market configuration. As such, TOI defies the conventional way of assessing firm performance in only discrete economic terms, which overlooks the environmental effect of social interfaces with potential customers, overarching business model innovations, and changes in environment infrastructure [48].
As another theory related to the theory of innovation, the theory of innovation diffusion focused on the patterns of interrelationships among varying kinds of social unit such as individuals, groups, institutions, and cultures for adopting innovations [49]. This theory postulates that the process of innovation diffusion depends upon whether the environment surrounding the innovation adopter is supportive, persistent, neutral, or inhibitive. In a nutshell, the theory of innovation diffusion focuses on understanding how, why and at what rate innovative ideas and technologies spread in a social system [50].
Considering multiple stakeholders (e.g., firms, consumers, and government entities) involved in environmental protection, the social systems theory first introduced by Luhmann [51] can help us better understand the creation of innovative knowledge regarding the development of environmental technology. The social systems theory was built upon system thinking that sought to understand the coherence and connectedness of all facets of social activities including environmental protection and sustainable energy usage by the whole community. Put simply, social systems theory is predicated on a belief that a social system consists of people who interact with each other and then influence one another’s behavior through communication and interrelated activities. Social system theory was designed to reduce complexity involving diverse elements such as humans, institutions, technologies, and business communities [51]. Thus, the application of social systems theory to the RE business may be useful for gathering and analyzing information about RE efficiency through the community feedback mechanism, which helps compare the actual outcome of the RE business to the desired RE business outcome. In other words, this theory can help us explain the dynamics of RE business performances that might be influenced by combined economic, socio-ecological, business, and institutional motives.
Based on the aforementioned theoretical framework and the extant literature review, we developed a research model comprising seven constructs: (1) disruptive innovation, (2) integrated vision, (3) knowledge creation, (4) connectedness, (5) eco-communal management, (6) market creation, and (7) sustainable value as shown in Figure 3 and associated hypotheses described in the following subsections.
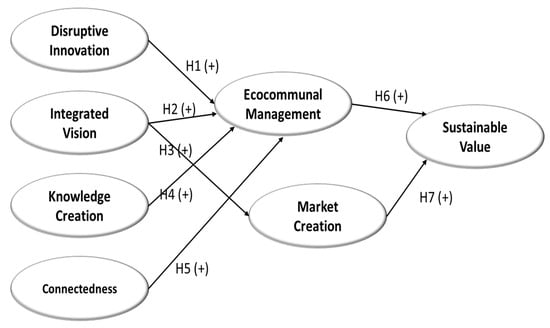
Figure 3.
A conceptual research model.
3.1. The Impact of Disruptive Innovation on the Renewable Energy (RE) Market
Over the years, solar, wind, water, nuclear, and geothermal are the traditional sources of RE. However, thanks to the innovative technological breakthrough accelerated by the fourth industrial revolution, many new RE sources were created in the recent past. These sources include artificial photosynthesis, 3D-printed solar energy trees, liquid sunlight, carbon nanotube electricity, the electrocaloric effect, and tidal stream generators [52]. These sources resulting from disruptive innovations have the potential to harness the power of electricity at cleaner but more affordable prices. Thus, RE businesses leveraging these innovations can attract more potential RE consumers to the RE market and consequently expand their market bases. Disruptive innovations are changing fundamental RE producer–consumer relationships and hastening socio-technological paradigm shifts in the RE market [53]. That is to say, disruptive innovations that include technological and business model inventions have significant implications for the outcomes of RE businesses through RE market expansion [54,55]. In light of these discussions, we postulate that disruptive innovation will have a positive impact on RE market creation.
Hypothesis 1 (H1).
Disruptive innovation is positively related to RE market creation.
3.2. The Impact of Integrated Vision on the RE Market
An integrated vision of an RE project encompasses the strategy for creating sustainable value for all of the project stakeholders; this strategy should be synchronized with the economic, social, and ecological developments and aspirations of the project’s host community. It reflects the firm’s organizational characteristics, strategy, and core values that help the firm come up with creative solutions for challenging strategic problems through its entrepreneurial actions [18,56]. As such, an integrated vision sets the overarching business goals of a firm tends to have a significant impact on its functional strategy such as marketing strategy (Ireland et al., 2009). A clear and well-articulated strategic vision provides the market focus or niche that allows the RE business to create competitive advantages over its rivals. This vision can be developed by creating aggregated value chains that can generate economic, social, and ecological benefits. Considering the highly competitive nature of the RE market structure, the integrated vision is imperative for the success of RE businesses that were reflected by eco-communal management [57]. Herein, eco-communal management represents the return on investment (ROI) and the competitive position of RE projects [58]. Based on this rationale, we posit that integrated vision will be positively related to eco-communal management, other control variables such as firm size, business/project customer household income, reflective practices, and business/project location being equal.
Hypothesis 2 (H2).
Integrated vision is positively related to eco-communal management.
In addition, since the integrated vision may dictate the firm’s effort to acquire and retain customers and then target a particular market segment, integrated vision defines the perimeters of the RE target markets served through entrepreneurial actions taken for RE demands. Under this premise, we hypothesize that integrated vision has a positive, significant, and substantial relationship with RE market creation.
Hypothesis 3 (H3).
Integrated vision is positively related to RE market creation.
3.3. The Impact of Knowledge Creation on Eco-Communal Management
As an integral part of the intellectual capital, knowledge creation refers to the extraction of information regarding target customer needs, the RE project itself, its related technologies and resources, and the overarching economic, ecological, and social agenda developed from socialization, externalization, globalization, and combined processes [59,60]. As such, knowledge creation helps develop business intelligence regarding RE customer needs and preferences, consumer behavior, advances in RE technology, and the impact of those advances on RE development through interactions, socialization, internalization, and externalization [59]. Knowledge creation can also lead to continuous innovation that revitalizes economic activities for society at large. Based on this premise, we hypothesize that knowledge creation is positively related to eco-communal management after controlling the firm size, project customer household income, reflective practices, and project/business location [61,62].
Hypothesis 4 (H4).
Knowledge creation is positively related to eco-communal management.
3.4. The Impact of Connectedness on Eco-Communal Management
As an integral part of the social capital, connectedness refers to the relationships among multiple stakeholders of RE projects such as RE project managers, end RE users (customers), RE project investors and regulators, and the host community of the RE project [28,63]. Through the establishment of strong social capitals, connectedness can facilitate the creation of common goals and shared sustainable value that can be translated into integrated economic, ecological, and social benefits for all the affected parties of the RE project. Thus, connectedness can affect both the long-term and the short-term (day-to-day) operational efficiency of RE businesses and the subsequent RE business performance [64]. For this reason, we predict that connectedness will have a positive impact on eco-communal management, once variables such as the firm size, project customer household income, and project location are controlled.
Hypothesis 5 (H5).
Connectedness is positively related to eco-communal management.
3.5. The Impact of Eco-Communal Management on Sustainable Value
Eco-communal management is viewed as the key management strategy of a RE business (or project) that creates integrated economic, ecological, and social benefits for all stakeholders. It is the primary pathway for translating the integrated vision, know-how, resources, and relational capabilities of the RE business into sustainable value [65]. Through the establishment of a symbiotic and synergistic partnership among trading partners and their surrounding communities, eco-communal management aims to improve the ROI, the enhancement of the sustainable value of the RE project, and the subsequent competitive position of RE projects. Its underlying philosophy is the promotion of easy living, sustainability, self-sufficiency, and biodiversity for the RE-host community by creating financial, environmental, and social values [66]. Driven by business model innovations, it utilizes project lifecycle management and stewardship for value creation in new markets [67,68]. In other words, eco-communal management is an innovative strategy that mediates the relationship between the integrated vision of an RE project and the desired environmental outcomes. The eco-communal management can help assess the impact of RE projects on the sustainability of the local community, which reflects the true success of RE projects [58]. As such, eco-communal management may mediate the relationships among an integrated vision of the RE project, RE firm size, RE affected community’s household income and reflected practices. Firm size is known to influence innovation capabilities and sustainable entrepreneurship, which can affect the outcomes of RE projects [69,70]. In the long run, deployment of the RE project can enhance entrepreneurial activities that, in turn, improve household incomes in communities that host RE projects. An increase in household income in a host community will increase business opportunities and then facilitate the firm’s engagement in RE projects. Thus, we identified firm size, RE host community’s household income, and reflective practices as control variables for our proposed model. Herein, a reflective practice meant ways to enhance awareness and care that are instrumental for creating RE businesses [29]. Since sustainable value can be translated into the economic, ecological, and social dimensions of integrated value that are beneficial for stakeholders, it reflects the capacity to do well in RE businesses [71]. Based on this premise, we posit that eco-communal management has a positive relationship with sustainable value after controlling variables such as the firm size, project customer household income, and project location.
Hypothesis 6 (H6).
Eco-communal management is positively related to sustainable value.
3.6. The Impact of Market Creation on Sustainable Value
Market creation refers to transitions for new products (e.g., green products) or services (e.g., reclaiming end-of-lifecycle products). Market creation in the context of RE development can be articulated in terms of the sustainable value for multiple stakeholders. Market creation, which is framed by the entrepreneurial drive of a RE business, is an essential part of RE product/service offerings, opportunity creation, value propositions, and monetization since RE demand cannot be created without the establishment of RE target customer bases and their market segments. Thus, it may affect the sustainable value of RE businesses [65]. To validate this premise, we hypothesize that market creation is positively related to the desired outcomes of an RE business venture or project.
Hypothesis 7 (H7).
Market creation is positively related to sustainable value.
Figure 3 shows the conceptual research model of all the constructs discussed above and the hypothetical relationships among them.
4. Research Methodology
To determine which exogenous factors drive RE use and assess how much that use affects a firm’s value creation efforts and RE business performance, we considered three theories of strategic management: (1) theory of innovation, (2) theory of innovation diffusion, and (3) social systems theory.
Considering multiple stakeholders (e.g., firms, consumers, and government entities) involved in environmental protection, the social systems theory first introduced by Luhmann [51] can help us better understand the creation of innovative knowledge regarding the development of environmental technology. Put simply, social systems theory is predicated on a belief that a social system consists of people who interact with each other and then influence one another’s behavior through communication and interrelated activities. Thus, this theory can help us explain the dynamics of RE business performance that might be influenced by combined economic, socio-ecological, business, and institutional motives.
4.1. Research Sample
To validate the theories introduced above, we gathered data from 204 key decision/policy makers in RE businesses in emerging economies (e.g., China, India, and Brazil) and 222 key decision/policymakers in developed economies (e.g., primarily US, Canada, Germany, Japan, and the UK but with a few responses from France and Norway). These key decision-makers were identified through the personal networks and business relationships of the researchers. Approximately 45% of our respondents were senior executives with titles of chief executive officer (CEO), chief operating officer (COO), chief financial officer (CFO), or chief technology officer (CTO), while the remaining respondents were mid-level managers with titles such as project manager, program manager, and site manager who got involved in RE business initiatives. All the respondents reported having RE project development experience with their respective companies. These respondents were identified through multiple sources such as the Renewable Energy Business Alliance (REBA), International Renewable Energy Agency (IRENA), International Renewable Energy Alliance (REN Alliance), International Network for Sustainable Energy (INFORSE), World Council for Renewable Energy, public renewable energy companies listed on foreign stock exchanges (e.g., Hong Kong, Shanghai, Mumbai), the Clean Energy Business Council, and the authors’ consulting project clients. Considering the potential difficulty of mail surveys targeting foreign organizations, we administered a web-based survey instrument. The survey instrument was administered from October 2014 to February 2015. After screening for missing information, unengaged responses, outliers, kurtosis, and skewness, the usable response rate was 25%.
4.2. Measurement Items
For the measurement of survey questionnaire items, we used five-point Likert scales, except for managerial responsibility (moderator) and the controls (firm size, project customer’s household income, and reflective practices). The comparative fit index (CFI) for the measurement model indicated a good fit, with a value above 0.90 (CFI = 0.956). The root mean square error of approximation (RMSEA) also indicated a good fit, with its value (RMSEA = 0.0637) below a stringent upper limit of 0.07 or 0.08 [72,73].
4.3. Independent Variables
We utilized four independent variables: disruptive innovation, integrated vision, knowledge creation, and connectedness. Disruptive innovation (α = 0.88) was measured using five items adapted from the works of Govindarajan and Kopalle [74]. These five items measure product, process, service innovation dimensions, and performances in the context of introducing disruptive offerings. For integrated vision, we used three first-order factors and seven items (Cronbach’s α = 0.89) adapted from Carroll et al. [75]. Knowledge creation was measured with four first-order factors and a total of 13 items (α = 0.94) adapted from Schulz [76] and Schulze and Hoegl [77]. Connectedness was measured using two first-order factors and a total of six items (α = 0.93) adapted from van Bel et al. [78].
4.4. Mediators
We considered two mediators: eco-communal management and market creation. For eco-communal management, we used two first-order factors and five items (α = 0.84) adapted from Kayworth and Leidner [79] and Bono and Anderson [80]. Market creation was measured using two items (α = 0.81) adapted from Jain and Kaur [81].
4.5. Dependent Variable
To measure the outcomes of RE projects, we considered sustainable values as a dependent (outcome) variable. For sustainable value, we used two first-order factors and eight items (α = 0.94) adapted from Zhu et al. [82].
4.6. Control Variables
Generally, large-sized, well-established firms are more likely to engage in RE projects and tend to invest greater resources to enhance their innovation capabilities in RE development [83]. Thus, the effects of firm size as measured by the number of employees of RE businesses in emerging economies (China, India) and developed economies (Canada, Germany, Japan, U.K., and the US), the reflective practices of the firm (which represent how well-established the firm is), location, and economic status of the RE project’s host community should be regarded as control variables. We have observed how well-established firm’s employee motivation, interest in innovations, and job attributes are different from start-up startup companies, which may be an important indicator of engagement in disruptive innovation. Consideration of these control variables will ensure a more accurate assessment of the causal relationships among the independent and dependent variables.
4.7. Pilot Study
We also pre-tested the survey instrument using a Q-sort from the responses of 15 research participants including academicians, industry experts, and host community members who were knowledgeable about the RE industry. This resulted in 90% of the items being placed correctly. Furthermore, to assure the reliability, validity, and appropriateness of the survey instruments, we also conducted a pilot test in which we administered the survey instrument to 50 key decision-makers engaged in RE businesses in both emerging and developed economies prior to the full-scale survey. Based on their feedback, some questionnaire items were modified by shortening the items without changing their meaning. This modification intends to increased readability and clarity, and reduce the estimated time required to complete the survey.
5. Analysis Results and Discussions
As a part of our overall investigation, we conducted both an exploratory factor analysis (EFA) and a confirmatory factor analysis (CFA) with and without common latent factors, followed by structural equation modeling (SEM). The hypothesized model was tested using a two-step procedure, based on recommendations made by Preacher et al. [84]. The proposed SEM was run by using AMOS software with bootstrapping to measure the direct and indirect effects of the mediation and moderated mediations. Several EFA statistics indicated that the data were adequate and appropriate for further investigation. To elaborate, the EFA resulted in a Kaiser–Meyer–Olkin (KMO) statistic of 0.921 and a significant Bartlett’s test of sphericity (χ2 = 21,708, df = 5253, and p < 0.001) indicating sufficient inter-correlations. All commonalities were above 0.50, further confirming that each item shared some common variance with the other items [85]. In addition, we noticed that all of the commonalities exceeded 0.50, which confirmed that each item shared some common variances with the others [85]. All measures of sampling adequacy (MSA) across the diagonal of the anti-image matrix were above 0.70, indicating that the data were appropriate for factoring. The CFA value met all validity and reliability requirements, indicating that the model fit the data well. The composite reliability for all of the constructs was greater than 0.70, and the average variance extracted (AVE) met the requirement for convergent validity. The maximum shared variances (MSV) and average shared variances (ASV) were less than the AVE, meeting the discriminate validity requirements [86]. The reliability requirements were met with both the Cronbach’s alpha and composite reliability for each construct greater than 0.70. The effects of common method bias were checked by comparing the CFA results with and without common latent factors (CLFs), following Gaskin’s recommendations [87]. In addition, there was no difference between the CFA results with and without CLFs, indicating that common method bias did not have a significant effect on the data collected.
5.1. Measurement Model
The CFA of the measurement model yielded good model fit statistics with χ2 = 1802.69, degree of freedom = 977, CFI = 0.900, TLI = 0.889, and RMSEA = 0.062. As summarized in Table 2, the CFA met all validity and reliability requirements, indicating that the model fit the data well [85]. The composite reliability for all of the constructs was greater than 0.70, and the AVE met the requirement for convergent validity. The MSV were less than the AVE, as were the ASV, meeting the discriminate validity requirements [86]. All of the developed scales demonstrated reliability since both the Cronbach’s alpha and composite reliability for each construct were greater than the recommended threshold value of 0.70. The effects of common method bias were checked by comparing the CFA results with and without a CLF, following Gaskin’s method [87]. There was no difference in the CFA results with and without the CLF, indicating that common method bias was not a concern for the collected data.
Table 2.
Confirmatory factor analysis (CFA) validity and reliability.
5.2. Test Results
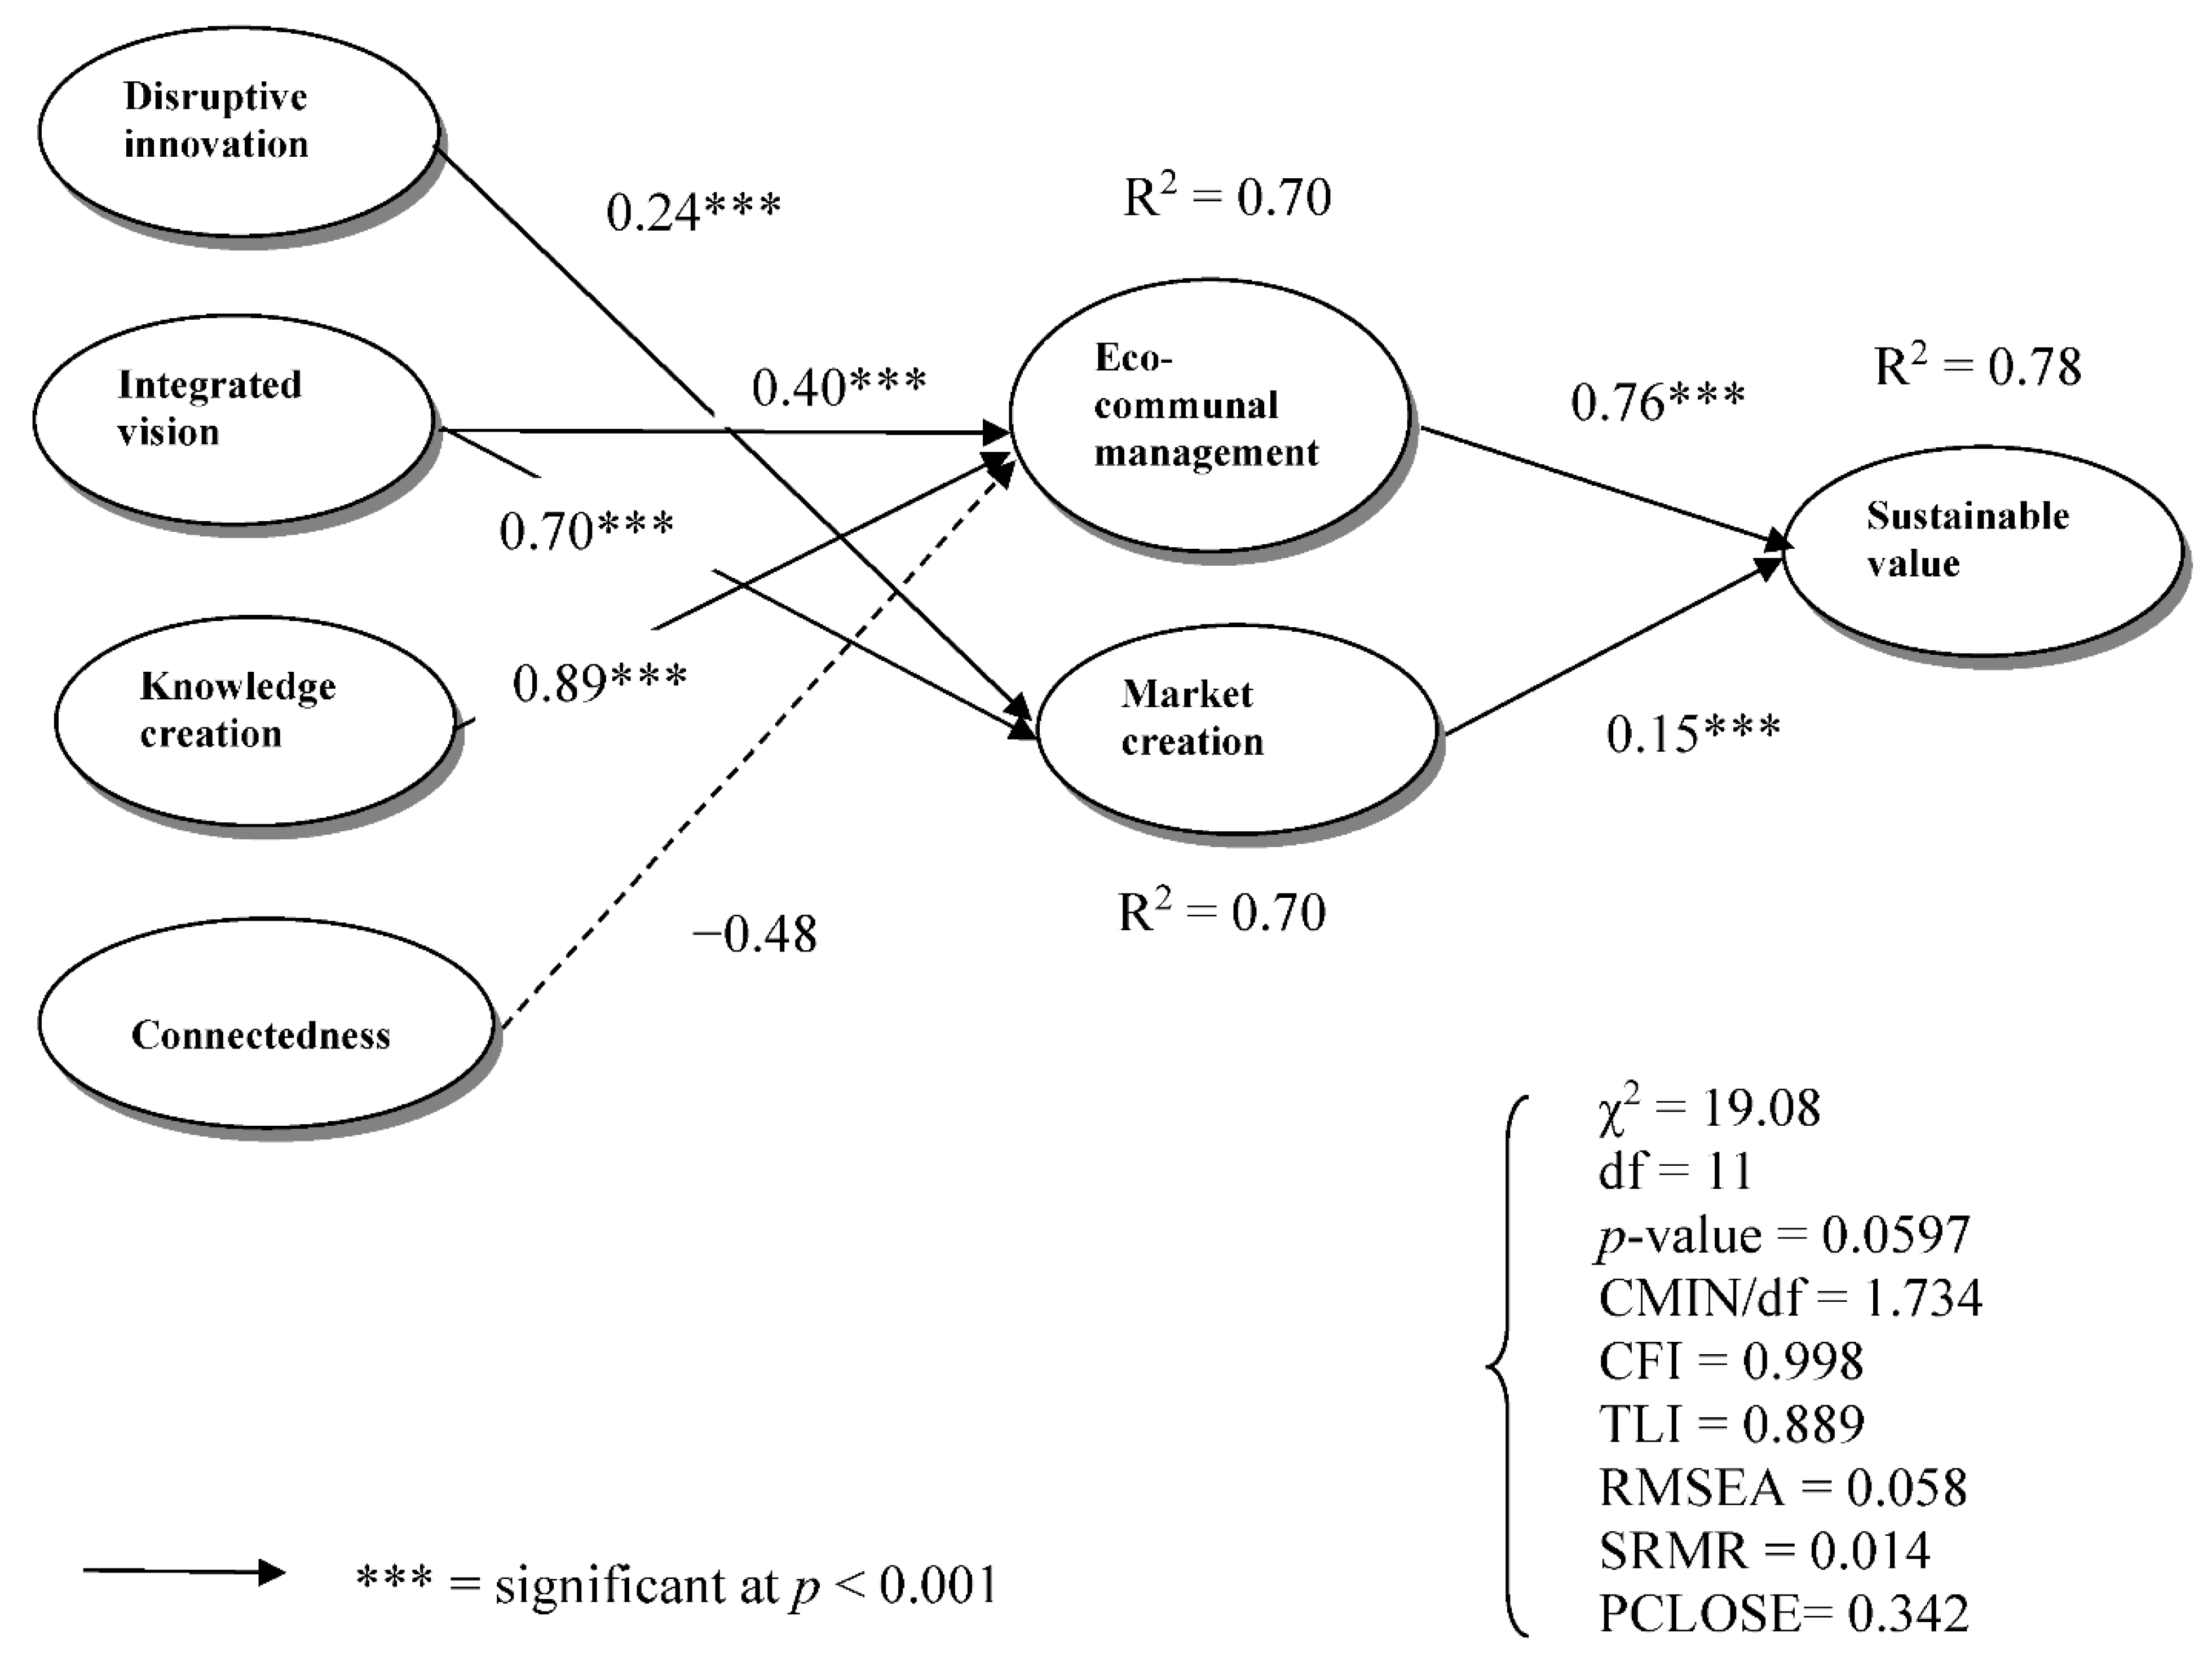
The hypothesized models fit the data well, with model fit statistics of χ2 = 19.08, df = 11, CMIN/df = 1.734, CFI = 0.998, TLI = 0.889, and RMSEA = 0.058 [88,89,90]. The hypothesized model tested as shown in Figure 4 fits the data well, with model fit statistics of χ2 = 19.08, df = 11, CMIN/df = 1.73, CFI = 0.998, and p > 0.05 as summarized in Table 2 [88,89,90]. Therefore, all but one of the antecedents had significant impacts on the mediators, and the mediators had significant impacts on the outcome variable.
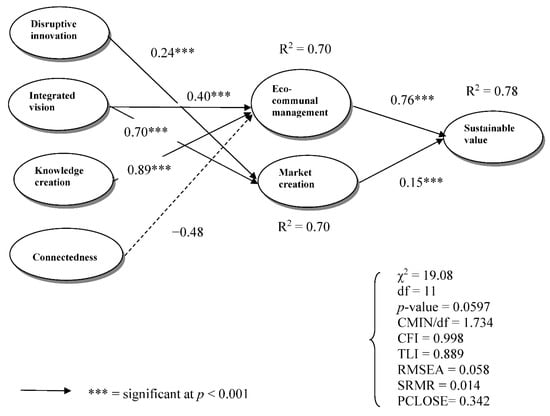
Figure 4.
Structural equation model results.
As predicted, H1 was supported (β = 0.24, p < 0.001), indicating that disruptive innovation had a significantly positive impact on eco-communal management. Both H2 and H3 were also supported, with confirming a significantly positive relationship between integrated vision and eco-communal management (β = 0.40, p < 0.001), and an even stronger relationship between integrated vision and market creation (β = 0.70, p < 0.001). The test result for H4 further highlighted the importance of knowledge creation to the creation of RE markets. The strongest relationship was verified with the high coefficient value (β = 0.89, p < 0.001).
On the other hand, H5 was not supported. In other words, a relationship between connectedness and eco-communal management turned out to be negative, with a highly significant beta of –0.48 (β = −0.48, p < 0.001). As anticipated, both H6 and H7 were supported, with β = 0.76, p < 0.001 and β = 0.15, p < 0.001, respectively. These results confirm that both eco-communal management and market creation had significantly positive impacts on the performance of RE businesses. That is to say, eco-communal management enhanced sustainable value. A summary of the hypotheses test results is presented in Table 3. Further verifying the robustness of the model, the predictor variables were found to explain 78% of the variance in the outcome variable.
Table 3.
A summary of hypotheses test results.
Going further, we tested to see if the RE business outcome differed depending on the economic development stage of host countries (emerging versus developed economies). When we compared the data analysis results of two contrasting economies path-by-path, we found that two data sets were not invariant with a Chi-square difference (Δχ2) of 29.63, degree of freedom difference (Δdf) of 13, and p-value = 0.005. To elaborate, RE businesses in developed economies have stronger RE business foundations in terms of integrated vision, knowledge creation, connectedness, eco-communal management, and market creation than their counterparts in emerging economies due in part to their greater financial resources and economic maturity. In particular, the strongest positive relationship existed between knowledge creation and eco-communal management (β = 0.91, p < 0.001) in developed economies, whereas emerging economies showed a significant positive relationship between knowledge creation and market creation in (β = 0.55, p < 0.001). The positive outcome relationship between eco-communal management and sustainable value is turned out to be significant for emerging economies as well (β = 0.93, p < 0.001). In light of this discussion, the performance of RE businesses in both developed and emerging economies may be enhanced by creating appropriate RE knowledge bases. Knowledge creation is crucial for improving the sustainable value of RE businesses since it can augment or revolutionize existing energy sectors through disruptive innovation. For both emerging and developed economies, we should note that eco-communal management had the greatest impact on sustainable value. Thus, regardless of the economic maturity, RE businesses should adopt some of the eco-communal management practices which positively contribute to an improvement of the sustainable value, as suggested by Pavlovich and Krahnke [91]. Furthermore, the comparison of the two data sets indicates that RE businesses may benefit from the strong linkage between the integrated vision of the businesses and the associated market creation, where this linkage is much stronger for developed economies (β = 0.80, p < 0.001) than for emerging economies (β = 0.19, p < 0.05). Enhancing this linkage necessitates continuous innovation, which helps sustain successful RE business entrepreneurship. Such innovation begins with the establishment of RE education/training programs, and innovative business culture across the social system.
6. Key Finding and Managerial Implications
Overall, this study suggests that the effort to create sustainable value for RE businesses starts with knowledge creation. In other words, a primary path for creating sustainable value for RE businesses is underpinned by knowledge creation. Such value creation led to desired RE business outcomes via eco-communal management. Herein, knowledge included both entrepreneurial and tacit knowledge (e.g., expert insights gained from RE business experiences). This finding indicated that disruptive innovation based on knowledge creation improved the competitive positioning of the RE businesses and helped develop symbiotic and synergistic relationships among ROI, environmental, and social benefits as noted by prior RE studies [31,92,93].
In addition, disruptive innovation built upon integrated vision played a significant role in RE market creation that, in turn, had a positive impact on the sustainable value. Thus, RE businesses must engage in technological and business model innovations, accompanied by environment friendly (or green) marketing strategy [94]. On the other hand, we noticed that the direct negative impact of connectedness on eco-communal management due to the culture stressing the individual rights/benefits and stratified management structures. This finding is somewhat surprising in that the development of social capital and the subsequent strong bond among RE multiple stakeholders are thought to improve RE-related benefits for all the stakeholders and the subsequent eco-communal management. The possible explanation for this finding is the adverse impact of rising individualism (specially developed economies) on the pursuit of group-oriented, integrated benefits emanating from RE businesses.
However, we discovered a strong positive relationship between knowledge creation and eco-communal management (especially in developed economies). That is to say, the performance of RE businesses in developed economies may be enhanced by creating appropriate knowledge about eco-communal management as noted by Machlup [95]. We also observed that RE businesses in developed economies may benefit from the linkage between the integrated vision of the RE businesses and the associated RE market creation. Enhancing this linkage requires the nurturing of a culture of continuous innovation, which strengthens sustainable entrepreneurial spirits and associated education/training programs. Congruent with a finding of Chen et al. [96], we found that a positive relationship between knowledge creation and market creation could improve the performance of RE businesses. That is to say, knowledge creation is an important prerequisite to the improvement of RE business performances.
To summarize, from managerial perspectives gained from the aforementioned findings, we can conclude that both the integrated vision and knowledge creation spurred by innovative corporate culture and eco-communal mindsets are essential for the RE business success, while social capital is not necessarily critical for the RE business success. Theoretical implications of this study result are the validation of TOI and the theory of innovation diffusion for RE business development. However, this study could not fully validate the social systems theory due to the negative role of connectedness in establishing eco-communal management.
7. Conclusions and Future Research Directions
This paper is one of the first to assess the impact of disruptive innovation, integrated vision, connectedness, and knowledge creation on the RE business performance in both developing and developed economies. As such, the model developed in this paper needs to be verified for contextual applicability (i.e., generalizability and transferability) before it can be utilized for other industry sectors.
In light of the fast-paced technological and business model innovations that are integral parts of today’s knowledge-based business landscape in the era of the industrial revolution 4.0, the role of disruptive innovation and knowledge/market creation in enhancing sustainable value in the RE businesses is of paramount importance for the success of RE entrepreneurs or start-up businesses. This paper is intended to provide strategic managerial guidance for both start-up and existing RE businesses to help them survive and prosper with the optimal configuration of innovation initiatives or new business model developments. As such, this paper can help enhance sustainable value for all RE business stakeholders. In closing, we should note that the current research framework and model could be refined and then successfully applied to other emerging business ventures.
Author Contributions
Methodology, Y.H.; writing—original draft, H.M. Both authors have read and agreed to the published version of the manuscript.
Funding
This research received no external funding.
Institutional Review Board Statement
Not applicable.
Informed Consent Statement
Not applicable.
Data Availability Statement
Not applicable.
Conflicts of Interest
The authors declare no conflict of interest.
References
- IEA. World Energy Outlook; Unpublished Report; IEA Energy Business Council: Paris, France, 2014. [Google Scholar]
- IEO. International Energy Outlook 2019. 2019. Available online: https://www.eia.gov/outlooks/ieo/ (accessed on 10 October 2019).
- EIA. Annual Energy Outlook 2020. 2020. Available online: https://www.eia.gov/outlooks/aeo/ (accessed on 7 April 2020).
- Tiwari, A.K. Energy consumption, CO2 emissions, and economic growth: Evidence from India. J. Int. Bus. Econ. 2011, 12, 85–122. [Google Scholar] [CrossRef]
- ChartsBin. Historical Crude Oil Prices, 1861 to Present. 2020. Available online: http://chartsbin.com/view/oau (accessed on 15 April 2020).
- Macrotrends. U.S. Inflation Rate 1960–2020. 2020. Available online: https://www.macrotrends.net/countries/USA/united-states/inflation-rate-cpi (accessed on 15 March 2020).
- Pew Charitable Trusts. Distributed Generation: Cleaner, Cheaper, and Stronger: Industrial Efficiency in the Changing Utility Landscape; Unpublished Report; ICF International: Washington, DC, USA, 2015. [Google Scholar]
- Ali, E.S.; El-Sehiemy, R.A.; Abou El-Ela, A.A.; Mahmoud, K.; Lehtonen, M.; Darwish, M.M.F. An effective bi-stage method for renewable energy sources integration into unbalanced distribution systems considering uncertainty. Processes 2021, 9, 471. [Google Scholar] [CrossRef]
- Scott, M. Emerging Markets Are Leading the Way on Clean Energy Growth, Investing. 2014. Available online: https://www.forbes.com/sites/mikescott/2014/10/31/emerging-markets-are-leading-the-way-on-clean-energy-growth/#7c4b5a48181d (accessed on 13 July 2017).
- International Energy Agency. Renewable Energy Mid-Term Market Report 2016: Market Analysis and Forecasts to 2021; Unpublished Report; OECD/IEA: Paris, France, 2016. [Google Scholar]
- Enerdata. Total Energy Consumption, Global Energy Statistical Yearbook 2020. 2020. Available online: https://yearbook.enerdata.net/total-energy/world-consumption-statistics.html (accessed on 15 March 2021).
- Lundvall, B. National Systems of Innovation: Toward a Theory of Innovation and Interactive Learning; Anthem Press: London, UK, 2010. [Google Scholar]
- Boons, F.; Montalvo, C.; Quist, J.; Wagner, M. Sustainable innovation, business models and economic performance: An overview. J. Clean. Prod. 2013, 45, 1–8. [Google Scholar] [CrossRef]
- Markides, C.; Sosa, L. Pioneering and first mover advantages: The importance of business models. Long Range Plan. 2013, 46, 325–334. [Google Scholar] [CrossRef]
- Chestnut, D. What Is Business Model Innovation? Market Research. 2019. Available online: https://bizfluent.com/about-7220445-business-model-innovation-.html (accessed on 15 April 2020).
- Taylor, P. New Wave of Renewable Energy Technologies. Fincyte. 2017. Available online: https://www.fincyte.com/renewable-energy-technologies/#:~:text=Estimating%20the%20increasing%20energy%20consumption%2C%20arose%20a%20need,coal%2C%20and%20the%20coefficient%20of%20efficiency%20was%20small (accessed on 11 March 2021).
- Bento, N.; Fontes, M. Emergence of floating offshore wind energy: Technology and industry. Renew. Sustain. Energy Rev. 2019, 99, 66–82. [Google Scholar] [CrossRef]
- Milbrath, L.W. Envisioning a Sustainable Society: Learning Our Way out; Suny Press: Albany, NY, USA, 1989. [Google Scholar]
- Rifkin, J. The Empathic Civilization: The Race to Global Consciousness in a World in Crisis; Penguin Press: New Yok, NY, USA, 2009. [Google Scholar]
- Sheikh, N.J.; Kocaoglu, D.F.; Lutzenhiser, L. Social and political impacts of renewable energy: Literature review. Technol. Forecast. Soc. Chang. 2016, 108, 102–110. [Google Scholar] [CrossRef]
- Jenniches, S. Assessing the regional economic impacts of renewable energy sources–A literature review. Renew. Sustain. Energy Rev. 2018, 93, 35–51. [Google Scholar] [CrossRef]
- Bourcet, C. Empirical determinants of renewable energy deployment: A systematic literature review. Energy Econ. 2020, 85, 104563. [Google Scholar] [CrossRef]
- Menegaki, A. Valuation for renewable energy: A comparative review. Renew. Sustain. Energy Rev. 2008, 12, 2422–2437. [Google Scholar] [CrossRef]
- Brent, A.; Kruger, W. Systems analyses and the sustainable transfer of renewable energy technologies: A focus on remote areas of Africa. Renew. Energy 2009, 34, 1774–1781. [Google Scholar] [CrossRef] [Green Version]
- Achtenhagen, L.; Melin, L.; Naldi, L. Dynamics of business models–Strategizing, critical capabilities, and activities for sustained value creation. Long Range Plan. 2013, 46, 427–442. [Google Scholar] [CrossRef] [Green Version]
- Awerbuch, S.; Sauter, R. Exploiting the oil–GDP effect to support renewables deployment. Energy Policy 2006, 34, 2805–2819. [Google Scholar] [CrossRef]
- Cooperrider, D.; Whitney, D. Collaborating for Change; Barrett-Koehler: San Francisco, CA, USA, 1999. [Google Scholar]
- Ehrenfeld, J.R.; Hoffman, A.J. Flourishing: A Frank Conversation about Sustainability; Stanford University Press: Palo Alto, CA, USA, 2013. [Google Scholar]
- Laszlo, C.; Ehrenfeld, J.; Brown, J.; Gorham, M.; Pose, I.B.; Robson, L.; Saillant, R.; Sherman, D.; Werder, P. Flourishing Enterprise: The New Spirit of Business; Stanford University Press: Palo Alto, CA, USA, 2014. [Google Scholar]
- Aisf, M.; Muneer, T. Energy supply, its demand and security issues for developed and emerging economies. Renew. Sustain. Energy Rev. 2007, 11, 1388–1413. [Google Scholar] [CrossRef]
- Hall, J.K.; Daneke, G.A.; Lenox, M.J. Sustainable development and entrepreneurship: Past contributions and future directions. J. Bus. Ventur. 2010, 25, 439–448. [Google Scholar] [CrossRef]
- Baden-Fuller, C.; Haefliger, S. Business models and technological innovation. Long Range Plan. 2013, 46, 419–426. [Google Scholar] [CrossRef] [Green Version]
- Lyberopoulos, G.; Theodoropoulou, E.; Mesogiti, I.; Makris, P.; Varvarigos, E. A highly dynamic and distributed operational framework for smart energy networks. In Proceedings of the 2014 IEEE 19th International Workshop on Computer Aided Modeling and Design of Communication Links and Networks (CAMAD), Athens, Greece, 1–3 December 2014; pp. 120–124. [Google Scholar]
- Chesbrough, H. Business model innovation: Opportunities and barriers. Long Range Plan. 2010, 43, 354–363. [Google Scholar] [CrossRef]
- Negro, S.O.; Alkemade, F.; Hekkert, M.P. Why does renewable energy diffuse so slowly? A review of innovation system problems. Renew. Sustain. Energy Rev. 2012, 16, 3836–3846. [Google Scholar] [CrossRef] [Green Version]
- Painuly, J.P. Barriers to renewable energy penetration; a framework for analysis. Renew. Energy 2001, 24, 73–89. [Google Scholar] [CrossRef]
- Martinot, E.; Chaurey, A.; Lew, D.; Moreira, J.R.; Wamukonya, N. Renewable energy markets in developing countries. Annu. Rev. Energy Environ. 2002, 27, 309–348. [Google Scholar] [CrossRef]
- Urmee, T.; Harries, D.; Schlapfer, A. Issues related to rural electrification using renewable energy in developing countries of Asia and Pacific. Renew. Energy 2009, 34, 354–357. [Google Scholar] [CrossRef]
- Huenteler, J.; Niebuhr, C.; Schmidt, T.S. The effect of local and global learning on the cost of renewable energy in developing countries. J. Clean. Prod. 2016, 128, 6–21. [Google Scholar] [CrossRef]
- Ragosa, G.; Warren, P. Unpacking the determinants of cross-border private investment in renewable energy in developing countries. J. Clean. Prod. 2019, 235, 854–865. [Google Scholar] [CrossRef]
- Topcu, M.; Tugcu, C.T. The impact of renewable energy consumption on income inequality: Evidence from developed countries. Renew. Energy 2020, 151, 1134–1140. [Google Scholar] [CrossRef]
- Nelson, R.R.; Winter, S.G. In search of a useful theory of innovation. In Innovation, Economic Change and Technology Policies; Klaczko-Ryndziun, S., Banerji, R., Feldman, J.A., Mansour, M.A., Billeter, E., Burckhardt, C., Ugi, I., Fu, K.-S., Fehl, G., Brunn, E., Eds.; Springer: Berlin/Heidelberg, Germany, 1977. [Google Scholar]
- Schumpeter, J.A. The creative response in economic history. J. Econ. Hist. 1947, 7, 149–159. [Google Scholar] [CrossRef] [Green Version]
- Sweezy, P.M. Professor Schumpeter’s theory of innovation. Rev. Econ. Stat. 1943, 15, 93–96. [Google Scholar] [CrossRef]
- Sundbo, J. The Theory of Innovation: Entrepreneurs, Technology and Strategy; Edward Elgar Publishing: Cheltenham, UK, 1998. [Google Scholar]
- Hagedoorn, J. Innovation and entrepreneurship: Schumpeter revisited. Ind. Corp. Chang. 1996, 5, 883–896. [Google Scholar] [CrossRef]
- Schumpeter, J.A. Essays on Entrepreneurs, Innovations, Business Cycles and the Evolution of Capitalism; Routledge: Milton Park, UK, 2017. [Google Scholar]
- Porter, M.E.; Kramer, M.R. Creating shared value. Harv. Bus. Rev. 2011, 89, 62–77. [Google Scholar]
- Wani, T.A.; Ali, S.W. Innovation diffusion theory. J. Gen. Manag. Res. 2015, 3, 101–118. [Google Scholar]
- Rogers, E.M. Diffusion of Innovations; The Fress Press: New York, NY, USA, 1962. [Google Scholar]
- Luhmann, N. Social Systems; Stanford University Press: Palo Alto, CA, USA, 1995. [Google Scholar]
- Krašna, M.; Klemenčič, E.; Kutnjak, Z.; Kralj, S. Phase-changing materials for thermal stabilization and thermal transport. Energy 2018, 162, 554–563. [Google Scholar] [CrossRef]
- Bughin, J.; Chui, M.; Manyika, J. Clouds, big data, and smart assets: Ten tech-enabled business trends to watch. McKinsey Q. 2010, 56, 75–86. [Google Scholar]
- Hart, S.L.; Christensen, C.M. The great leap. Sloan Manag. Rev. 2002, 44, 51–56. [Google Scholar]
- Viswanathan, M.; Seth, A.; Gau, R.; Chaturvedi, A. Ingraining product-relevant social good into business processes in subsistence marketplaces: The sustainable market orientation. J. Macromark. 2009, 29, 406–425. [Google Scholar] [CrossRef]
- Ireland, R.; Duane, J.; Covin, G.; Kuratko, D.F. Conceptualizing corporate entrepreneurship strategy. Entrep. Theory Pract. 2009, 33, 19–46. [Google Scholar] [CrossRef]
- Schoemaker, P. How to link strategic vision to core capabilities. Sloan Manag. Rev. 1992, 34, 67. [Google Scholar]
- Del Rio, P.; Burguillo, M. Assessing the impact of renewable energy deployment on local sustainability: Towards a theoretical framework. Renew. Sustain. Energy Rev. 2008, 12, 1325–1344. [Google Scholar] [CrossRef]
- Nonaka, I.; Byosiere, P.; Borucki, C.C.; Konno, N. Organizational knowledge creation theory: A first comprehensive test. Int. Bus. Rev. 1994, 3, 337–351. [Google Scholar] [CrossRef]
- Yang, B.; Watkins, K.E.; Marsick, V.J. The construct of the learning organization: Dimensions, measurement, and validation. Hum. Resour. Dev. Q. 2004, 15, 31–55. [Google Scholar] [CrossRef]
- Dewey, J. The Quest for Certainty: A Study of the Relation of Knowledge and Action; George Allen & Unwin: London, UK, 1929. [Google Scholar]
- Hessels, L.K.; Van Lente, H. Re-thinking new knowledge production: A literature review and a research agenda. Res. Policy 2008, 37, 740–760. [Google Scholar] [CrossRef]
- Pretty, J. Social capital and the collective management of resources. Science 2003, 302, 1912–1914. [Google Scholar] [CrossRef] [Green Version]
- Papagiannakis, G.; Voudouris, I.; Lioukas, S.; Kassinis, G. Environmental management systems and environmental product innovation: The role of stakeholder engagement. Bus. Strategy Environ. 2019, 28, 939–950. [Google Scholar] [CrossRef]
- Schaltegger, S.; Wagner, M. Sustainable entrepreneurship and sustainability innovation: Categories and interactions. Bus. Strategy Environ. 2011, 20, 222–237. [Google Scholar] [CrossRef]
- Hart, S.L.; Dowell, G. Invited editorial: A natural-resource-based view of the firm: Fifteen years after. J. Manag. 2011, 37, 1464–1479. [Google Scholar] [CrossRef]
- Christensen, C.M.; Horn, M.B.; Johnson, C.W. Disrupting Class: How Disruptive Innovation Will Change the Way the World Learns; McGraw-Hill: New York, NY, USA, 2008. [Google Scholar]
- Hall, J.; Vredenburg, H. The challenges of innovating for sustainable development. MIT Sloan Manag. Rev. 2012, 45, 61–68. [Google Scholar]
- Beck, T.; Demirgüç-Kunt, A.S.; Maksimovic, V. Financial and legal constraints to growth: Does firm size matter? J. Financ. 2005, 60, 137–177. [Google Scholar] [CrossRef]
- Hockerts, K.; Wüstenhagen, R. Greening Goliaths versus emerging Davids—Theorizing about the role of incumbents and new entrants in sustainable entrepreneurship. J. Bus. Ventur. 2010, 25, 481–492. [Google Scholar] [CrossRef] [Green Version]
- Laszlo, C.; Cooperrider, D.L. Design for sustainable value: A whole system approach. Adv. Appreciative Inq. 2007, 2, 15–29. [Google Scholar]
- MacCallum, R.C.; Browne, M.W.; Sugawara, H.M. Power analysis and determination of sample size for covariance structure modeling. Psychol. Methods 1996, 1, 130–149. [Google Scholar] [CrossRef]
- Steiger, J.H. Understanding the limitations of global fit assessment in structural equation modeling. Personal. Individ. Differ. 2007, 42, 893–898. [Google Scholar] [CrossRef]
- Govindarajan, V.; Kopalle, P.K. Disruptiveness of innovations: Measurement and an assessment of reliability and validity. Strateg. Manag. J. 2006, 27, 189–199. [Google Scholar] [CrossRef]
- Carroll, J.M.; Rosson, M.B.; Zhou, J. Collective efficacy as a measure of community. In Proceedings of the SIGCHI Conference on Human Factors in Computing Systems, Portland, OR, USA, 2–7 April 2005; ACM: New York, NY, USA, 2005; pp. 1–10. [Google Scholar]
- Schultz, P.W. Inclusion with nature: The psychology of human-nature relations. In Psychology of Sustainable Development; Springer: New York, NY, USA, 2002; pp. 61–78. [Google Scholar]
- Schulze, A.; Hoegl, M. Organizational knowledge creation and the generation of new product ideas: A behavioral approach. Res. Policy 2008, 37, 1742–1750. [Google Scholar] [CrossRef]
- Van Bel, D.T.; Smolders, K.C.H.J.; Ijsselsteijn, W.A.; de Kort, Y. Social connectedness: Concept and measurement. Intell. Environ. 2009, 2, 67–74. [Google Scholar]
- Kayworth, T.R.; Leidner, D.E. Leadership effectiveness in global virtual teams. J. Manag. Inf. Syst. 2002, 18, 7–40. [Google Scholar] [CrossRef]
- Bono, J.E.; Anderson, M.A. The advice and influence networks of transformational leaders. J. Appl. Psychol. 2005, 90, 1306. [Google Scholar] [CrossRef] [PubMed]
- Jain, S.K.; Kaur, G. Green marketing: An attitudinal and behavioral analysis of Indian consumers. Glob. Bus. Rev. 2004, 5, 187–205. [Google Scholar] [CrossRef]
- Zhu, Q.; Sarkis, J.; Lai, K. Confirmation of a measurement model for green supply chain management practices implementation. Int. J. Prod. Econ. 2008, 111, 261–273. [Google Scholar] [CrossRef]
- Tsai, W. Knowledge transfer in intra-organizational networks: Effects of network position and absorptive capacity on business unit innovation and performance. Acad. Manag. J. 2001, 44, 996–1004. [Google Scholar]
- Preacher, K.J.; Rucker, D.D.; Hayes, A.F. Addressing moderated mediation hypotheses: Theory, methods, and prescriptions. Multivar. Behav. Res. 2007, 42, 85–227. [Google Scholar] [CrossRef] [PubMed]
- Hair, J.F.; Black, W.C.; Babin, B.J.; Anderson, R.E. Multivariate Data Analysis; Prentice-Hall: Hoboken, NJ, USA, 2010. [Google Scholar]
- Fornell, C.; Larcker, D.F. Structural equation models with unobservable variables and measurement error: Algebra and statistics. J. Mark. Res. 1981, 18, 382–388. [Google Scholar] [CrossRef]
- Gaskin, J. Measurement Model Invariance. GaskinNation’s StatWiki. 2012. Available online: http://statwiki.kolobkreations.com (accessed on 5 March 2021).
- Hu, L.; Bentler, P.M. Cutoff criteria for fit indexes in covariance structure analysis: Conventional criteria versus new alternatives. Struct. Equ. Modeling A Multidiscip. J. 1999, 6, 1–55. [Google Scholar] [CrossRef]
- Marsh, H.W.; Hau, K.; Wen, Z. In search of golden rules: Comment on hypothesis-testing approaches to setting cutoff values for fit indexes and dangers in overgeneralizing Hu and Bentler’s (1999) findings. Struct. Equ. Model. 2004, 11, 320–341. [Google Scholar] [CrossRef]
- Tabachnick, B.G.; Fidell, L.S. Using Multivariate Statistics; Pearson: Upper Saddle River, NJ, USA, 2007. [Google Scholar]
- Pavlovich, K.; Krahnke, K. Empathy, connectedness and organisation. J. Bus. Ethics 2012, 105, 131–137. [Google Scholar] [CrossRef]
- Armitage, D.R.; Plummer, R.; Berkes, F.; Arthur, R.I.; Charles, A.T.; Davidson-Hunt, I.J.; Diduck, A.P.; Doubleday, N.C.; Johnson, S.S.; Marschke, M. Adaptive co-management for social-ecological complexity. Front. Ecol. Environ. 2009, 7, 95–102. [Google Scholar] [CrossRef] [Green Version]
- Hitt, M.A.; Ireland, R.D.; Sirmon, D.G.; Trahms, C.A. Strategic entrepreneurship: Creating value for individuals, organizations, and society. Acad. Manag. Perspect. 2011, 25, 57–75. [Google Scholar]
- Kumar, V.; Jones, E.; Venkatesan, R.; Leone, R.P. Is market orientation a source of sustainable competitive advantage or simply the cost of competing? J. Mark. 2011, 75, 16–30. [Google Scholar] [CrossRef]
- Machlup, F. Knowledge: Its Creation, Distribution and Economic Significance, Volume III: The Economics of Information and Human Capital; Princeton University Press: Princeton, NJ, USA, 2014. [Google Scholar]
- Chen, M.; Cheng, S.; Hwang, Y. An empirical investigation of the relationship between intellectual capital and firms’ market value and financial performance. J. Intellect. Cap. 2005, 6, 159–176. [Google Scholar] [CrossRef]


Publisher’s Note: MDPI stays neutral with regard to jurisdictional claims in published maps and institutional affiliations. |
© 2021 by the authors. Licensee MDPI, Basel, Switzerland. This article is an open access article distributed under the terms and conditions of the Creative Commons Attribution (CC BY) license (https://creativecommons.org/licenses/by/4.0/).