Article

A Theoretical Optimum Tilt Angle Model for Solar Collectors from Keplerian Orbit

Laboratory of Navigation and Remote Sensing, Institute of Space Science and Applied Technology, Harbin Institute of Technology at Shenzhen, Shenzhen 518055, China
*
Authors to whom correspondence should be addressed.
Energies 2021, 14(15), 4454; https://doi.org/10.3390/en14154454
Submission received: 16 June 2021 / Revised: 15 July 2021 / Accepted: 19 July 2021 / Published: 23 July 2021

Abstract

:
Solar energy has been extensively used in industry and everyday life. A more suitable solar collector orientation can increase its utilization. Many studies have explored the best orientation of the solar collector installation from the perspective of data analysis and local-area cases. Investigating the optimal tilt angle of a collector from the perspective of data analysis, or guiding the angle of solar collector installation, requires an a priori theoretical tilt angle as a support. However, none of the current theoretical studies have taken the real motion of the Sun into account. Furthermore, a complete set of theoretical optimal tilt angles for solar energy is necessary for worldwide locations. Therefore, from the view of astronomical mechanics, considering the true orbit of the Sun, a mathematical model that is universal across the globe is proposed: the Kepler motion model is constructed from the solar orbit and transformed into the local Earth coordinate system. After that, the calculation of the optimal tilt angle solution is given. Finally, several examples are shown to demonstrate the variation of the optimal solar angle with month and latitude. The results show that for daily fixed solar collectors, the altitude angle of the collector should be about 6° above the noon solar altitude angle in summer and 6° lower in winter. For annual fixed collectors, the tilt angle should be slightly higher than the latitude. In summary, this study demonstrates that when a location is specified, this model can be used to calculate the theoretical optimum tilt angle of solar collectors for that position.

Graphical Abstract

1. Introduction

As a green energy source, solar energy has been widely used around the world. A solar collector can keep soaking in maximal rays when it is orthographic to the sunlight. In addition to improving the conversion efficiency from solar to chemical energy [1], one of the key points for solar energy to be fully utilized is the optimized design of the tilt angle (or its complementary angle: elevation angle) of the solar collector. For a given solar collector position, the optimization of the solar tilt angle can be mainly summarized into two schemes as follows.
One is to change the elevation angle of the solar collector periodically to ensure that more direct sunlight is obtained: Yakup [2] showed that changing the inclination angle 12 times a year can improve the utilization rate by 5% (latitude = 4.90° N and longitude = 115° E); this method has been proven to be effective by experiments [3]. A further study showed that adjusting the tilt angle a different number of times during the year will result in different solar reception effects [4]. Furthermore, Solar trackers that allow for both tilt and azimuth angle can offer a better solution: Zsiborács [5] explored the performance of solar collectors at different azimuth angles, which has provided theoretical support for the tracker. Racharla [6] introduced the principles and methods of active and passive trackers. Afterwards, Junbin Zhang [7] proposed a two-axis tracking method using BeiDou and GPS to determine the position of solar collectors. In order to try not to introduce additional energy losses in the tracker, Henriques [8] recently proposed an npTrack approach. By using the scheme of adjusting the angle, more than 10% additional energy can be collected into a solar battery, but its own energy consumption would increase by 2–3% [9]. In addition, not all solar collectors have the ability to adjust their angle automatically, especially when deployed over a large area. For fixed solar collectors, it is especially critical to set the optimal tilt angle at the beginning.
Thus, there is also a need to fix solar collectors and calculate the best elevation angle for that year or even many years. The study of fixed solar tilt can be divided into two categories: empirical schemes using actual measured data and theoretical simulation models.
Empirically, the solar inclination can be obtained using numerical calculations with reference to local latitude, longitude, and meteorological conditions. Breyer [10] proposed a global model that considers the reception of multiple rays, but the model relies on a horizontal diffuse reflection dataset. Racharla [6] introduced the coordinate system and the parameters concerning the solar orientation, starting from a presumed circular orbit. Adell [11] proposed a theoretical model that takes local climate conditions into account. Kallioğlu [12] experimentally explored the optimal tilt angle for some regions of the Northern Hemisphere by adjusting the tilt angle of the solar energy. Deng [13] proposed a new solar model from the perspective of simulation and data analysis. Chinchilla [14] used global horizontal radiation data collected from 2551 sites across the world to calculate the best annual average angle. Considering the influence of the actual environment, Kim’s study [15] used machine learning method to determine the optimal tilt angle. Similarly, a neural network can be constructed to determine the local solar oblique illumination acceptance rate [16]. For long-term fixed solar collectors, the impact of the actual environment needs to be considered [17].
Theoretically, Nfaoui [18] used true solar time, however, only the Moroccan region is used as a case study. Vician [19] used the best angle of the day for a solar collection efficiency analysis. Gardashov [20] provided a solution for highland areas by modifying the cloud transmittance model for light. Abood [21] simulated solar orbit and gave a practical solution.
In fact, in the above studies, scholars have simplified the solar motion to a circular motion and used the simplified model for calculation. Since the Earth moves in an elliptical orbit around the Sun, the Sun is at a focal point of the ellipse—it is necessary to take this factor into account. One of the reasons for not considering the real solar orbital motion is that in the past there has not been a complete orbital motion system and geodetic coordinate frame. However, in recent years, with the development of orbital theory [22] and the coordinate frame system [23], it has become possible to solve the orientation of solar collectors theoretically.
In summary, none of the existing studies have explored the orientation of a place on Earth toward the Sun from the perspective of Keplerian orbits. In addition, global analysis of the optimal tilt angle has not been reported. To provide guidance for fixed installation angles of solar collectors around the world, a refined theoretical model is proposed. This model mainly considers the Kepler motion of the Sun [22,24,25,26]. This motion can be transformed and then described by the local coordinate system. When the latitude, longitude, and geodetic height are known, the theoretical optimal angle of solar energy can be modeled according to this theory.

2. Methods

The conversion of the coordinate system is the basis for completing the description of the solar motion from the local coordinate system of the Earth. Therefore, first of all, the coordinate system used by the model is presented.

2.1. Coordinate Frames and Orbit Parameters

There are several coordinated frames. Note that both the Earth-centered ecliptic inertial (ECEI) coordinate frame and the Earth-centered inertial (ECI) coordinate frame are celestial coordinate frame. The Earth-centered, Earth-fixed (ECEF) coordinate frame is the terrestrial coordinate system.

2.1.1. ECEI Coordinate Frame

ECEI’s original point is the center of the Earth, its X-axis points to the J2000.0 vernal equinox (12 h 2000.1.1 solar calendar), its X-Y plane is the ecliptic plane, and its Z-axis points to ecliptic pole.

2.1.2. ECI Coordinate Frame

(1) Definition
ECI’s original point is the center of the Earth. Its X-axis points to the J2000.0 vernal equinox (12 h 2000.1.1 solar calendar). Its Z-axis points to the conventional international origin (CIO). The X-Y-Z obeys the right-hand rule. This coordinate frame moves around the Sun, not around the CIO.
The ecliptic plane in the ECI coordinate frame is defined as the great circle where the Earth’s orbital plane intersects the celestial sphere.
(2) The transformation between ECEI and ECI
The coordinate transformation between ECEI and ECI can be described as follows [27]:
X E C E I = R e ( ε ) X E C I
where X denotes the coordinate system, Re is the rotate matrix, and ε is the obliquity of the ecliptic.

2.1.3. ECEF Coordinate Frame

(1) Definition
The ECEF coordinate frame is a kind of right-hand Cartesian coordinates system. In space rectangular coordinate frame ECEF, the original point is Earth centroid, the X-axis points to the mean Greenwich meridian, and the Z-axis points to the CIO. The X-Y plane is a mean equatorial plane, the X-Z plane is mean zero meridian.
(2) Transformation to ellipsoid geodetic ECEF coordinate frame
The formula from the ECI coordinate system to the ECEF coordinate system is expressed as follows [28]:
X E C E F = R M R S R N P X E C I
where RS is the Earth rotation matrix; RM is the polar shift matrix, and RNP is the precession nutation matrix. RM and RNP are relatively small and can be ignored.
(3) The transformation between space rectangular coordinate frame and spherical coordinate frame in ECEF
In ellipsoid geodetic coordinate system ECEF, ( X , Y , Z ) in space rectangular ECEF coordinate frame can be transformed to spherical coordinate ( φ , λ , h ) [29]:
( X Y Z ) = ( ( N + h ) cos ϕ cos λ ( N + h ) cos ϕ sin λ ( N ( 1 e 2 ) + h ) sin ϕ )
Conversely:
{ tan ϕ = Z X 2 + Y 2 ( 1 e 2 N N + h ) 1 tan λ = Y X h = X 2 + Y 2 cos ϕ N
where
N = a 1 e 2 sin 2 ϕ
where N is the prime vertical curvature radius, e is the first eccentricity, φ is the latitude, λ is the longitude, and h is the height.

2.1.4. The local Horizontal Coordinate System

(1) Definition
XENU is a left-handed Cartesian coordinate system. Its origin is a self-defined local point L 1 ( x 1 , y 1 , z 1 ) . Its X-axis points to north direction, its Y-axis points to east direction, and its Z-axis points to up direction.
(2) Transformation
The rotation matrix from the ellipsoid geodetic ECEF coordinate system to the local horizontal coordinate system can be expressed as follows [27]:
X E N U = R E X E C E F
The rotation step from ECEF to ENU is as follows [26]:
(a)
rotate angle λ E around Z-axis;
(b)
rotate angle (90°− ϕ E ) around Y-axis;
(c)
Change X-axis to the opposite direction
Therefore, the rotation matrix can be stated as follows [27]:
R E = ( sin ϕ E cos λ E sin ϕ E sin λ E cos ϕ E sin λ E cos λ E 0 cos ϕ E cos λ E cos ϕ E sin λ E sin ϕ E )

2.2. Theoretical Model for Calculating the Sun Position

By the above statement, it is known that ECEI is a coordinate system more related to the Sun. The motion of the Sun is first characterized under this coordinate system. Six parameters are needed to represent the orbit of the Sun.

2.2.1. Kepler Orbit Parameters for Solar in ECEI

(1) Parameters
There are six parameters in a Kepler orbit: the semi-major axis of the ellipse, orbital eccentricity, orbit inclination, the longitude of ascending node, the argument of perigee, and mean anomaly. These parameters for solar orbit are calculated as follows [26,30]:
{ a s = 1.0000002   A U e s = 0.016709114 - 0.000042052   T - 0.000000126   T 2 ε s = 84381.448 46.8150 T 0.00059 T 2 + 0.001813 T 3 Ω s = 0 f s = 2 arctan [ 1 + e s 1 e s tan E s 2 ] ω s = L s u n f s
where a s is the semi-major axis of the ellipse, AU is astronomical unit: 1 AU = 149,597,870,691 × 108 km; e s is the orbital eccentricity; ε s is the orbit inclination (here, it is the obliquity of the ecliptic from the equatorial plane); and Ω s is the longitude of ascending node. The vernal equinox of the Sun is the ascending intersection of the ecliptic with the celestial coordinate system, so Ω s = 0 . The parameters of the orbit are shown in Figure 1.
(2) Calculation of f s
Parameter E s is the eccentric anomaly, and it can be calculated by mean anomaly M s [27]:
E s e s sin E s = M s
It can be solved iteratively under the condition ( M i + 1 M i 1.0 × 10 8 ) , then f s can be calculated by E s . Where M s is given by [31,32]:
M s = 357.52910918 ° + 129596581.0481 T 0.5532 T 2 + 0.000136 T 3 0.00001149 T 4
(3) Calculation of w s
w s is the argument of Perigee. L s u n is solar zodiac longitude, and it is derived from three parameters [27]:
L s u n = D F Ω m o o n
D donates average angular distance from the Sun to Moon. F = L m o o n Ω m o o n , and there are several amendments to F [33,34]. L m o o n is the average longitude of the Moon. Ω m o o n is the average longitude of the Moon’s ascending node. D, F, and Ω m o o n are shown in [31]:
D = 297.8019547 ° + 1602961601.2090 T 6.3706 T 2 + 0.006593 T 3 0.00003196 T 4
F = 93.27209062 ° + 1739527262.8478 T - 12.7512 T 2 - 0.001037 T 3 - 0.00000417 T 4
Ω m o o n = 125.04455501 o 6962890.2665 T + 7.4722 T 2 + 0.007702 T 3 0.00005939 T 4

2.2.2. Describe the Solar Motion in ECEI

q and q ˙ are used to represent the position and velocity of the Sun, respectively [27]:
q = ( a ( cos E e ) a 1 e 2 sin E 0 ) = ( q cos f q sin f 0 ) , q ˙ = ( sin f e + cos f 0 ) n a 1 e 2
The Sun’s position and velocity vector in the ECEI coordinate system of the ecliptic coordinate system are as follows [27]:
[ p p ˙ ] = R 3 ( Ω ) R 1 ( i ) R 3 ( ω ) [ q q ˙ ]
where R and its subscripts represent the rotation matrix [27]:
R 3 ( Ω ) R 1 ( i ) R 3 ( ω ) = [ cos Ω s sin Ω s 0 sin Ω s cos Ω s 0 0 0 1 ] [ 1 0 0 0 cos i s sin i s 0 sin i s cos i s ] [ cos ω s sin ω s 0 sin ω s cos ω s 0 0 0 1 ]

2.2.3. Describe the Solar Motion in ECEF

Since the final need is to describe the solar orbital motion in the Earth coordinate system, this motion should be transferred from the coordinate system associated with the Sun to the geocentric geodesic coordinate system. This transformation process consists of two parts, first the rotation of the Z-axis, followed by the rotation of the X-axis. The specific two rotation processes are as follows.
(1) From ECEI to ECI
The movement of the Sun is described in ECI coordinates, the transformation Formula (1), where ε = 84,381.448 46.8150 T 0.00059 T 2 + 0.001813 T 3 . T is the measurement time of the Julian century from J2000.0 [35].
(2) From ECI to ECEF
Considering that the X-axis is pointing differently in ECI and ECEF, the rotation between ECI and ECEF is needed. The transformation Formula (2) can be expressed as follows [27]:
X E C E F = R s ( G A S T ) X E C I
where
R s ( G A S T ) = [ cos ( G A S T ) sin ( G A S T ) 0 sin ( G A S T ) cos ( G A S T ) 0 0 0 1 ]
GAST is the Earth rotation angle from the true vernal equinox to Greenwich meridian [27].
G A S T = G M S T + Δ Ψ cos ε + 0.00264 sin Ω + 0.000063 sin 2 Ω
where GMST is the mean equinox to Greenwich meridian. Δ Ψ is the nutation in longitude. The effect of the last two items is negligible [27]:
G A S T = G M S T + Δ Ψ cos ε
where
G M S T = G M S T 0 + α U T 1
In the above formula,
G M S T 0 = 6 × 3600.0 + 41 × 60.0 + 50.54841 + 8,640,184.812866 T + 0.093104 T 2 6.2 × 10 6 T 3 and α 1 .
G M S T 0 is the Greenwich angle of mean vernal equinox at 0:00 on the measuring day, U T 1 = U T C + d U T 1 , d U T 1 is published by the International Earth Rotation Service (IERS) ( d U T 1 < 0.7 s), so that U T 1 U T C and G M S T = G M S T 0 + U T C .
Without considering the influence of nutation, it is approximated that ε = 84181.448 .

2.2.4. Description of the Solar Motion in the Local Coordinate System

For a given latitude, longitude, and altitude for a solar collector place position P0 ( φ , λ , h ) , P0 (x0, y0, z0) can be calculated using Formula (3).
First, location P0 (x0, y0, z0) is defined as the origin point of local ENU (east-north-up) coordinate frame. In this frame, X-axis points to north, Y-axis points to east, and Z-axis points to up.
Then, the solar position Pi (xi, yi, zi) from ECEF can be transformed to the local coordinate frame using Formula (6). The rotation matrix RE can be seen in Formula (7). The relationship between azimuth AE, ZE and Pi (xi, yi, zi) is as follows:
( x i y i z i ) = d ( cos A E sin Z E sin A E sin Z E cos Z E ) , ( d E = x i 2 + y i 2 + z i 2 tan A E = y i / x i cos Z E = z i / d E )
For easy calculation, a spherical coordinate system is defined with the same origin and axis as local ENU frame. In this spherical frame, solar position Pi (xi, yi, zi) can be expressed as Pi (Ai, Zi, r) or P2 ( r ).
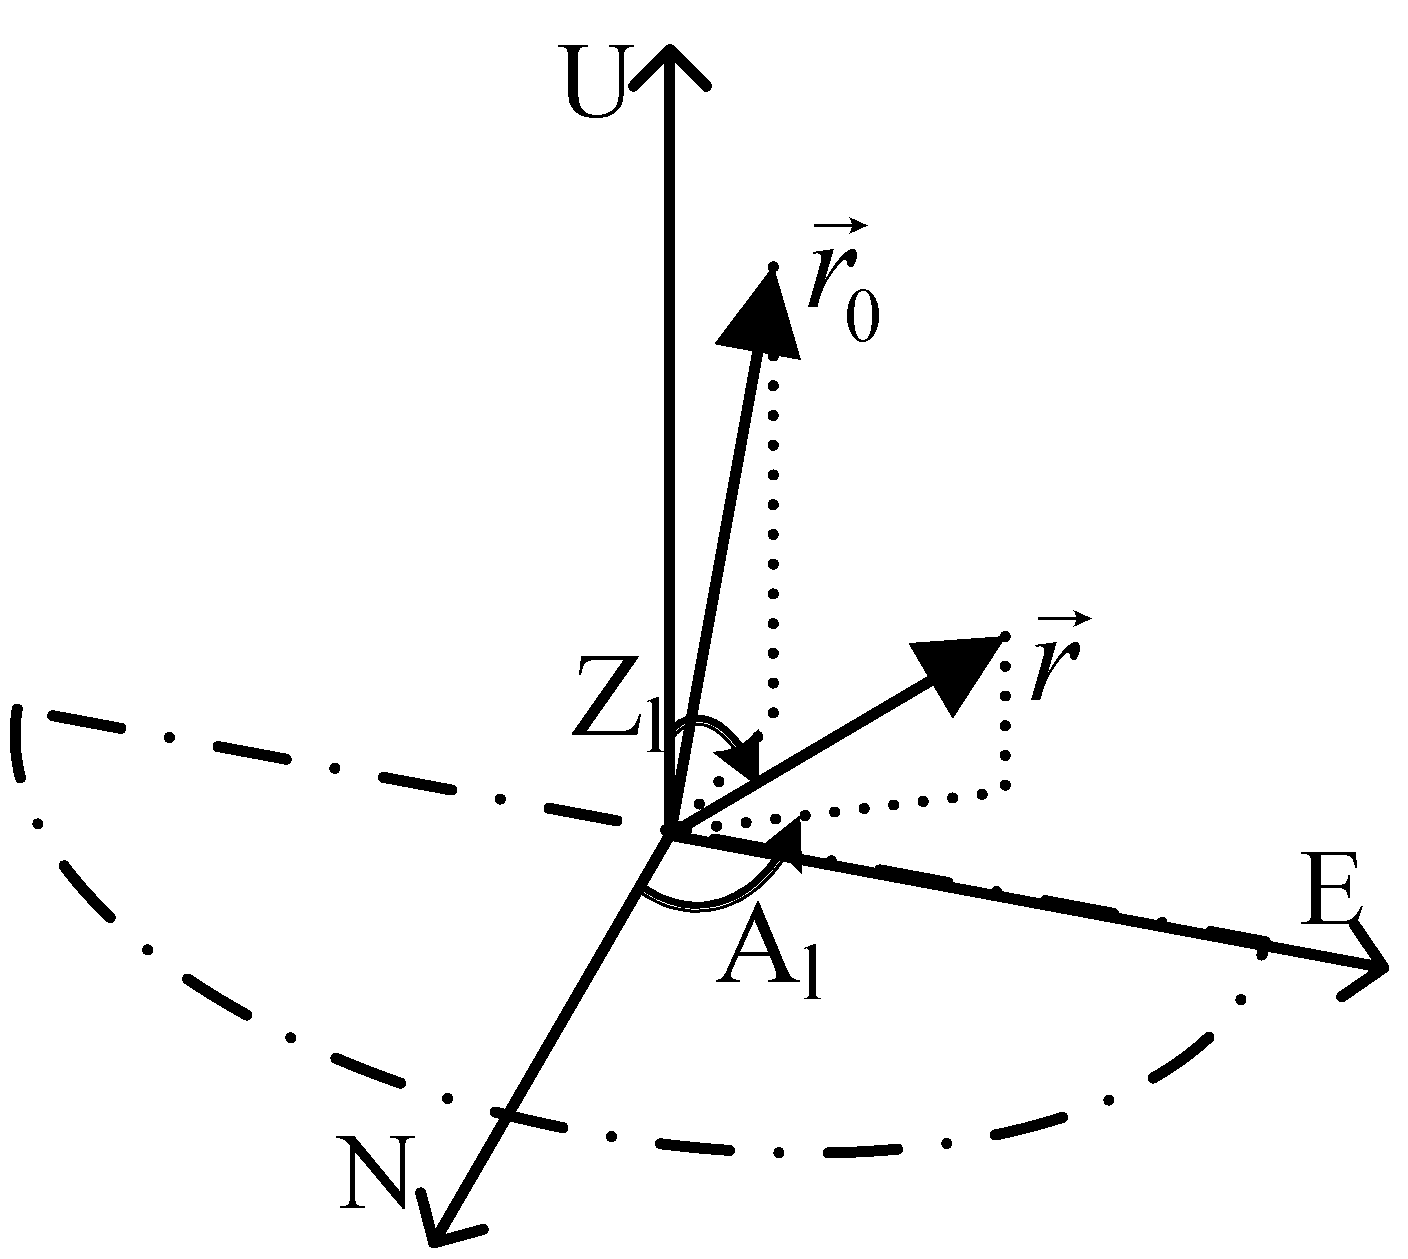
Z is the angle between the perpendicular and the diameter, then the Sun position is expressed as Pi (Ai, Zi, r ), where A is the azimuth from north to the projection of r i on X-Y plane and Z is the angle between up and r i , as shown in Figure 2.

2.3. Mathematical Solution to Capture Maximum Irradiation

2.3.1. Building a Formula for Maximum Solar Energy Reception under a Mathematical Model

According to Kepler’s second law, a line segment joining a planet and the Sun sweeps out equal areas during equal intervals of time. Therefore, for every equal small time interval t, r i d t is a constant value. Let the normal vector of the solar collector be r 0 . The problem of solving the optimal pointing angle of a solar collector is transformed into a mathematical problem: the maximum cumulative projection from r i d t on r 0 . The cumulative amount received in a period can be expressed as follows:
S p e r i o d = 0 S N r i r 0 d t
where S p e r i o d is the total tme.
(1)
ri under the spherical coordinate system
For the spherical coordinate system, r i (Ai, Zi, r i ) can be computed as follows:
{ Z i = arccos z r i A i = arctan y x
where
{ r i = ( x i x 0 ) 2 + ( y i y 0 ) 2 + ( z i z 0 ) 2 x = ( x i x 0 ) sin φ cos λ ( y i y 0 ) sin φ sin λ + ( z i z 0 ) cos φ y = ( x i x 0 ) sin λ + ( y i y 0 ) cos λ z = ( x i x 0 ) cos φ cos λ + ( y i y 0 ) cos φ sin λ + ( z i z 0 ) sin φ
Then the problem is transformed into solving the value of r 0 when S p e r i o d gets the maximum value. Note that (a) the sun can only be seen during the daytime, so Zi ranges from 0 to π 2 ; (b) P0 (x0, y0, z0) and Pi (xi, yi, zi) are in the ECEF frame.
(2)
ri under the Cartesian coordinate system
For the Cartesian coordinate system, r i and r i can be expressed as follows:
{ r i ( r 0 cos Z i cos A i , r 0 cos Z i sin A i , r 0 sin Z i ) r 0 ( r 0 cos Z 0 cos A 0 , r 0 cos Z 0 sin A 0 , r 0 sin Z 0 )
where r0 is unit length and is independent of the final result.

2.3.2. Solution for This Model

The model in a Cartesian coordinate system is used for solving the problem. For each epoch
r i r = r 0 2 [ cos Z i cos Z 0 ( cos A i cos A 0 + sin A i sin A 0 ) + sin Z i sin Z 0 ]
(1)
Optimal Azimuth
Ai and Zi can be calculated at eac epoch following the model mentioned above. The mathematical problem then becomes finding the value of cosZ0, sinZ0, cosA0, and sinA0 when S p e r i o d = 0 S N r i r 0 d t acquires the maximum value in a time period. This problem seems very difficult to solve, but it can be simplified by using the laws of celestial mechanics of motion. It can be inferred from Kepler’s second law that the projection of ri in the y = Z0 plane varies uniformly with time. Therefore, the optimum azimuth can be taken as the mean of the precise azimuth of sunrise and sunset moments. In that case, the value of A0 is known and can be stated as follows:
A 0 = A s u n r i s e + A s u n s e t 2
At this point, the value of Ai is no longer relevant to the final result, so Ai can take any value. To simplify the calculation, we make Ai = A0. Usually, in the ENU coordinate system, A0 is very close to π during the day (i.e., the azimuth of the Sun at noon is the best azimuth for the day).
(2)
Optimal Elevation
In the ENU coordinate system, when A0 = π, the formula for direct solar radiation for each calendar element is simplified as follows:
r i r = r 0 2 ( cos Z i cos Z 0 cos ( A i - π ) + sin Z i sin Z 0 )
Zi and Ai for all epochs of each day can be calculated by the theory of the previous sections. Therefore, r i r is a function of Z0. The value of Z0 is taken to be the value of the day when r i r takes its maximum value.

2.4. Calculation Process

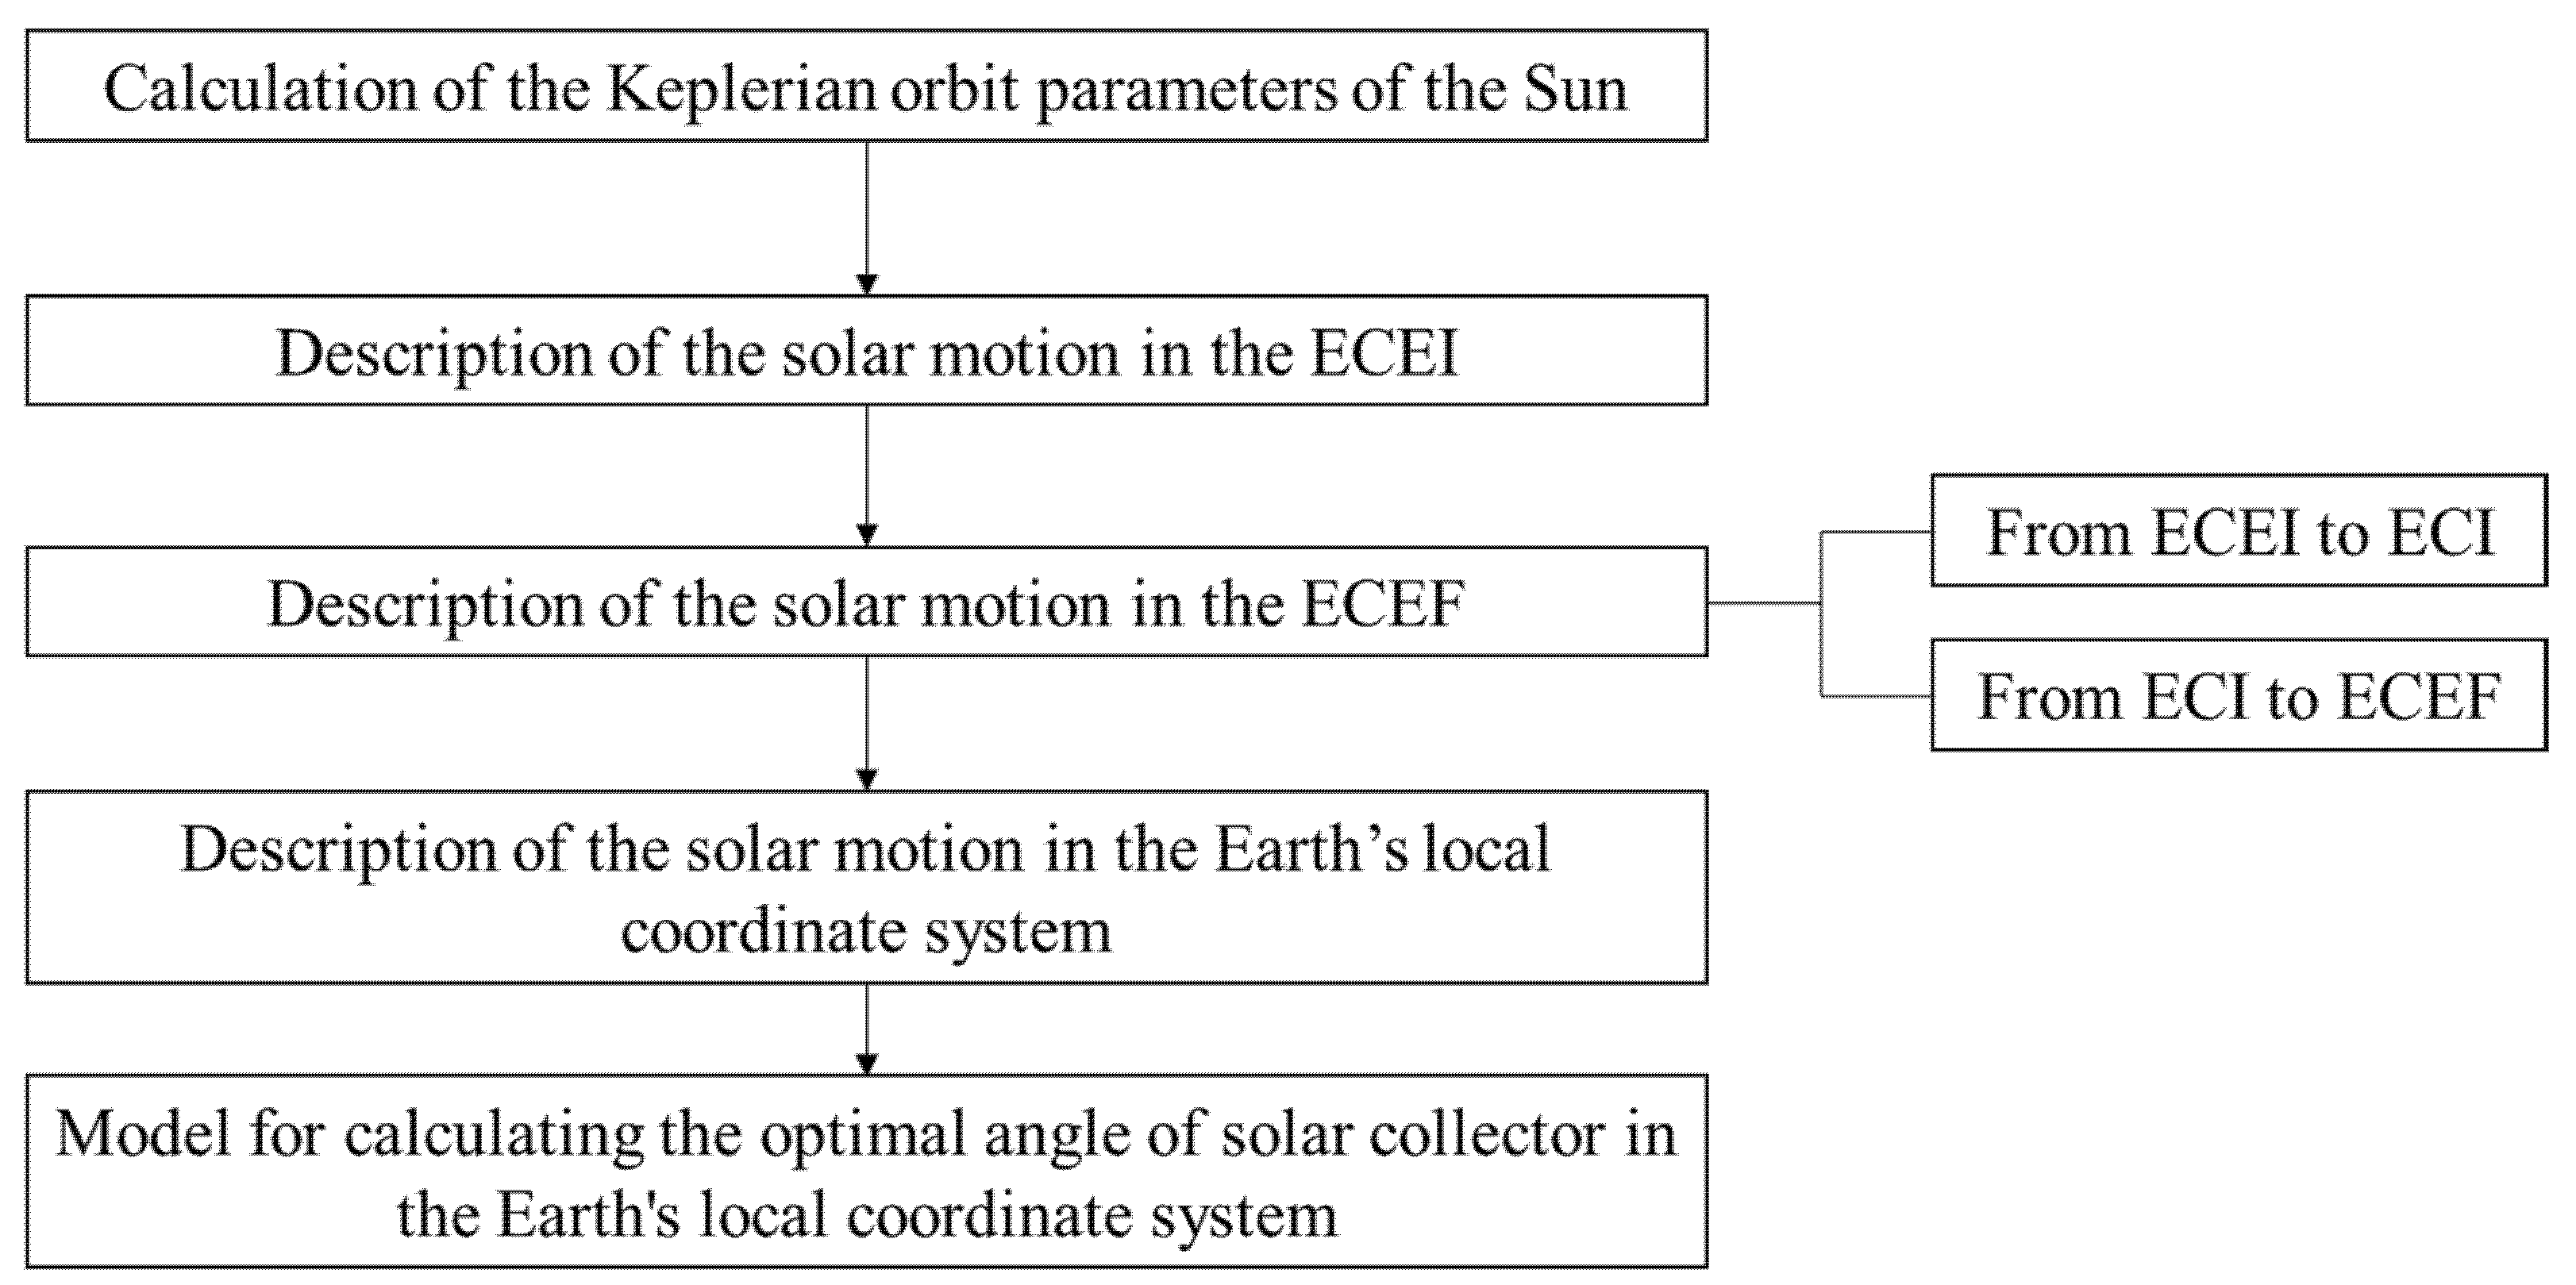
To summarize the above process visually, Figure 3 has been used to show the solar motion and the process of coordinate system transformation.
First, six orbital parameters are necessary to describe the orbital motion. These six parameters are shown in Equation (8). Among them, it is necessary to calculate two parameters.
Second, since the X-Y plane of the ECEI coordinate system is the ecliptic plane, it is easier to describe the solar motion in the ECEI coordinate system in the beginning.
Third, ECEF is a coordinate system that rotates with the Earth. The solar collector also rotates with the Earth, so the solar motion needs to be described under this coordinate system as well. Since ECI and ECEI have the same X-axis orientation, and also ECI and ECEF have the same Z-axis orientation, the ECI coordinate system is used as a transition.
After that, the Sun’s motion in the ECEF coordinate system is transformed into the local coordinate system. In this way, the coordinate system of the solar collector and the Sun is unified.
Finally, from a mathematical view, the cumulative amount of direct sunlight hitting the collector is used to determine the optimal tilt angle.

3. Results and Analysis

The essence of the above method is to describe the Keplerian motion between the Sun and the Earth in the Earth’s local coordinate system. When this model is constructed, theoretical sunrise and sunset moments can be calculated. The azimuth and altitude angles of the Sun at each moment can be simulated. The frequency of the solar elevation angle and azimuth angle calculation is once per minute. The calculation of solar altitude angle and azimuth angle is an attached work based on The National Renewable Energy Laboratory’s (NREL) Solar Position and Intensity (SOLPOS 2.0) C function [36].

3.1. Daily Variation of Solar Tilt Angle in Different Months

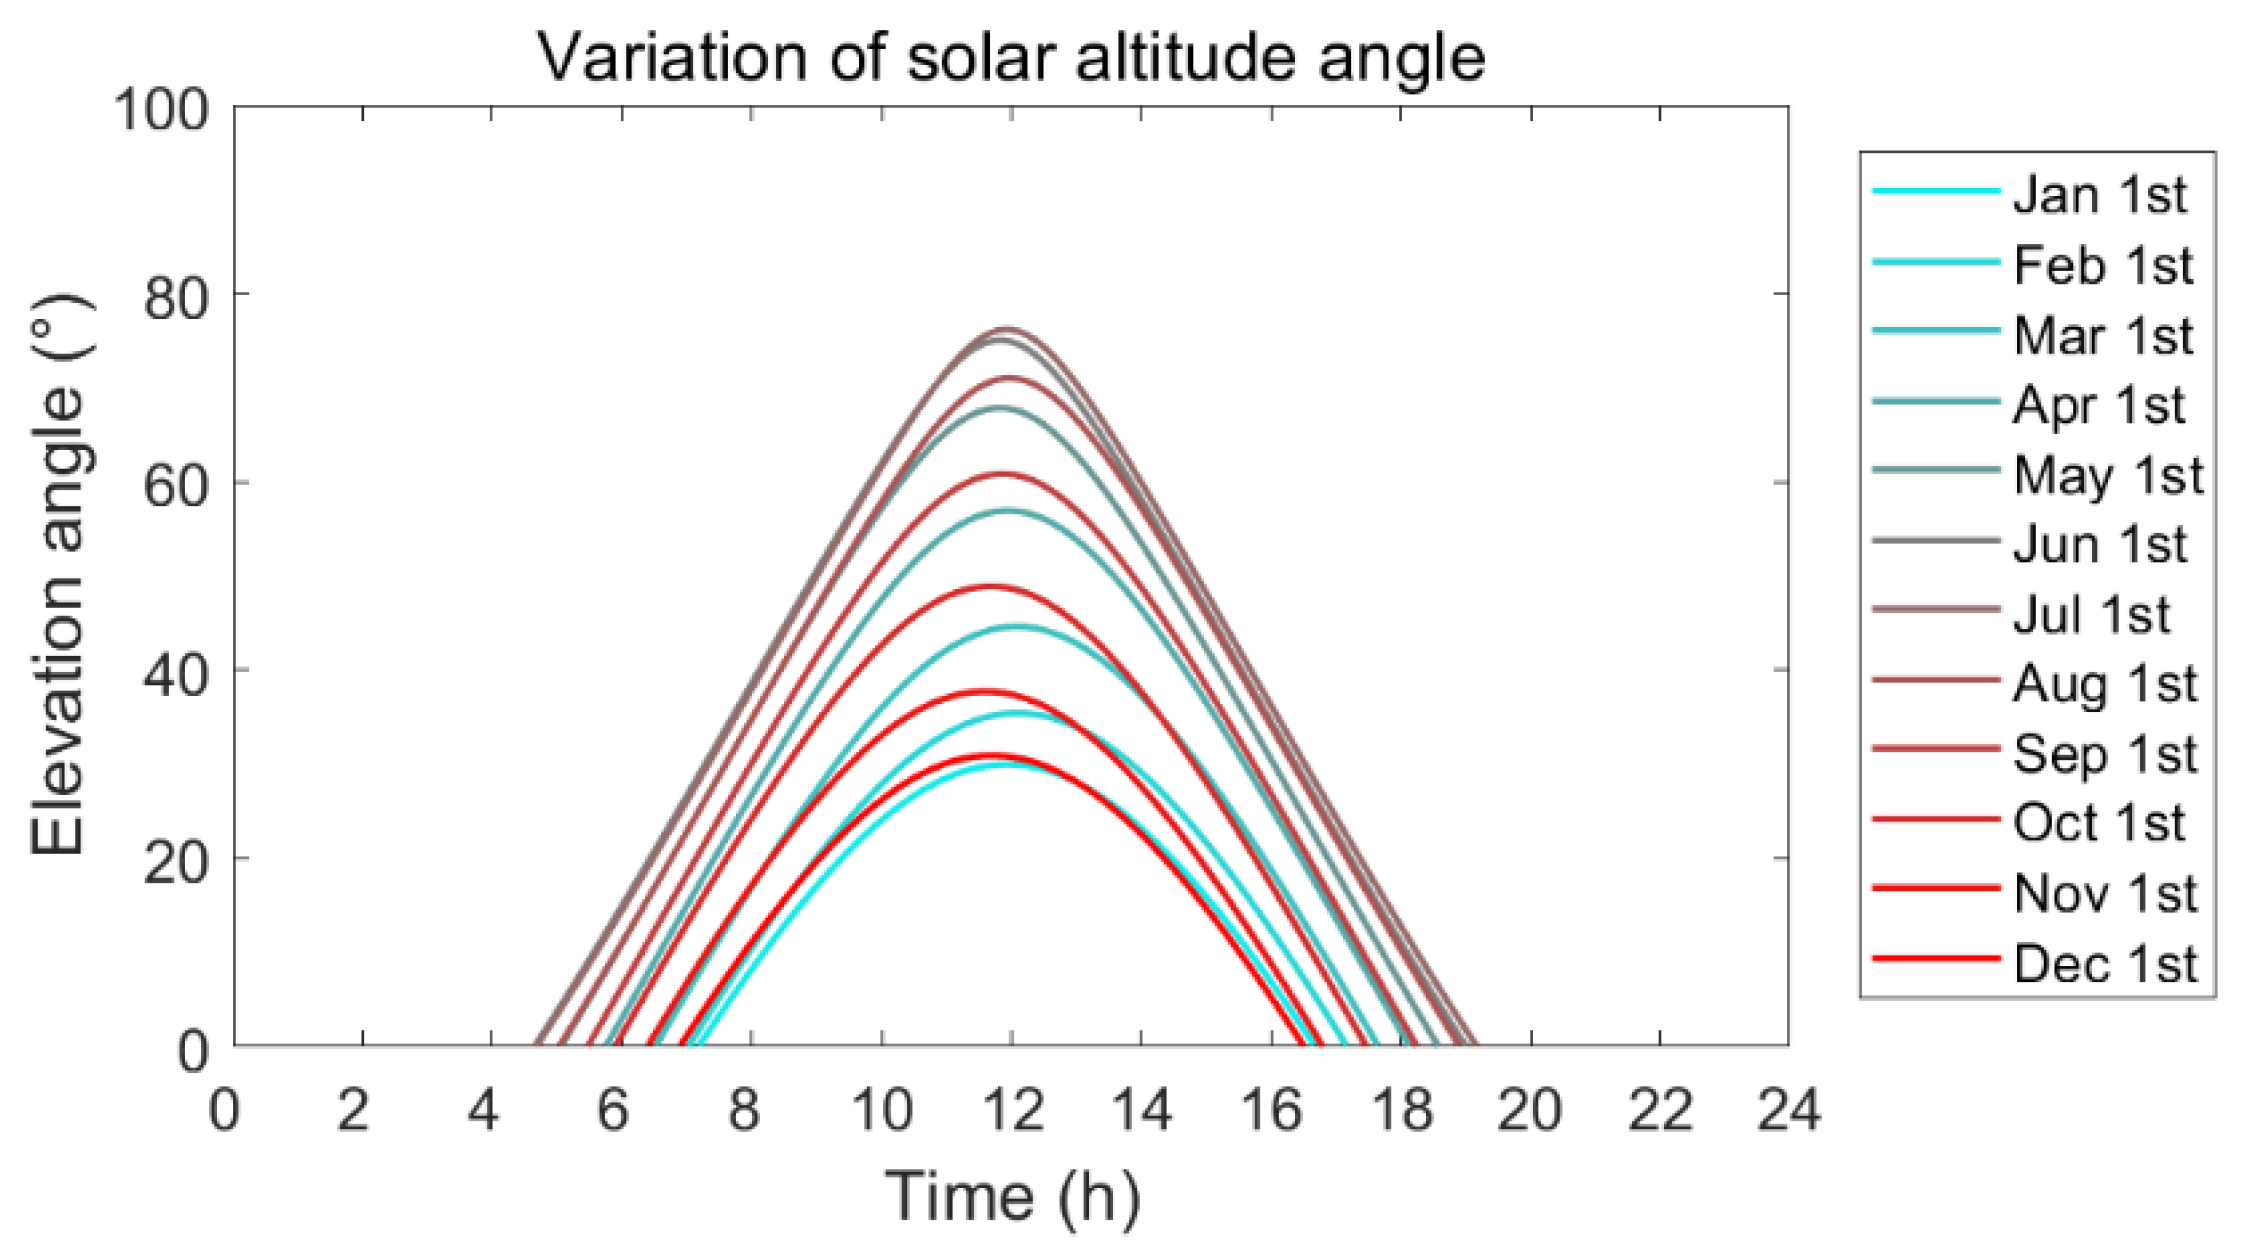
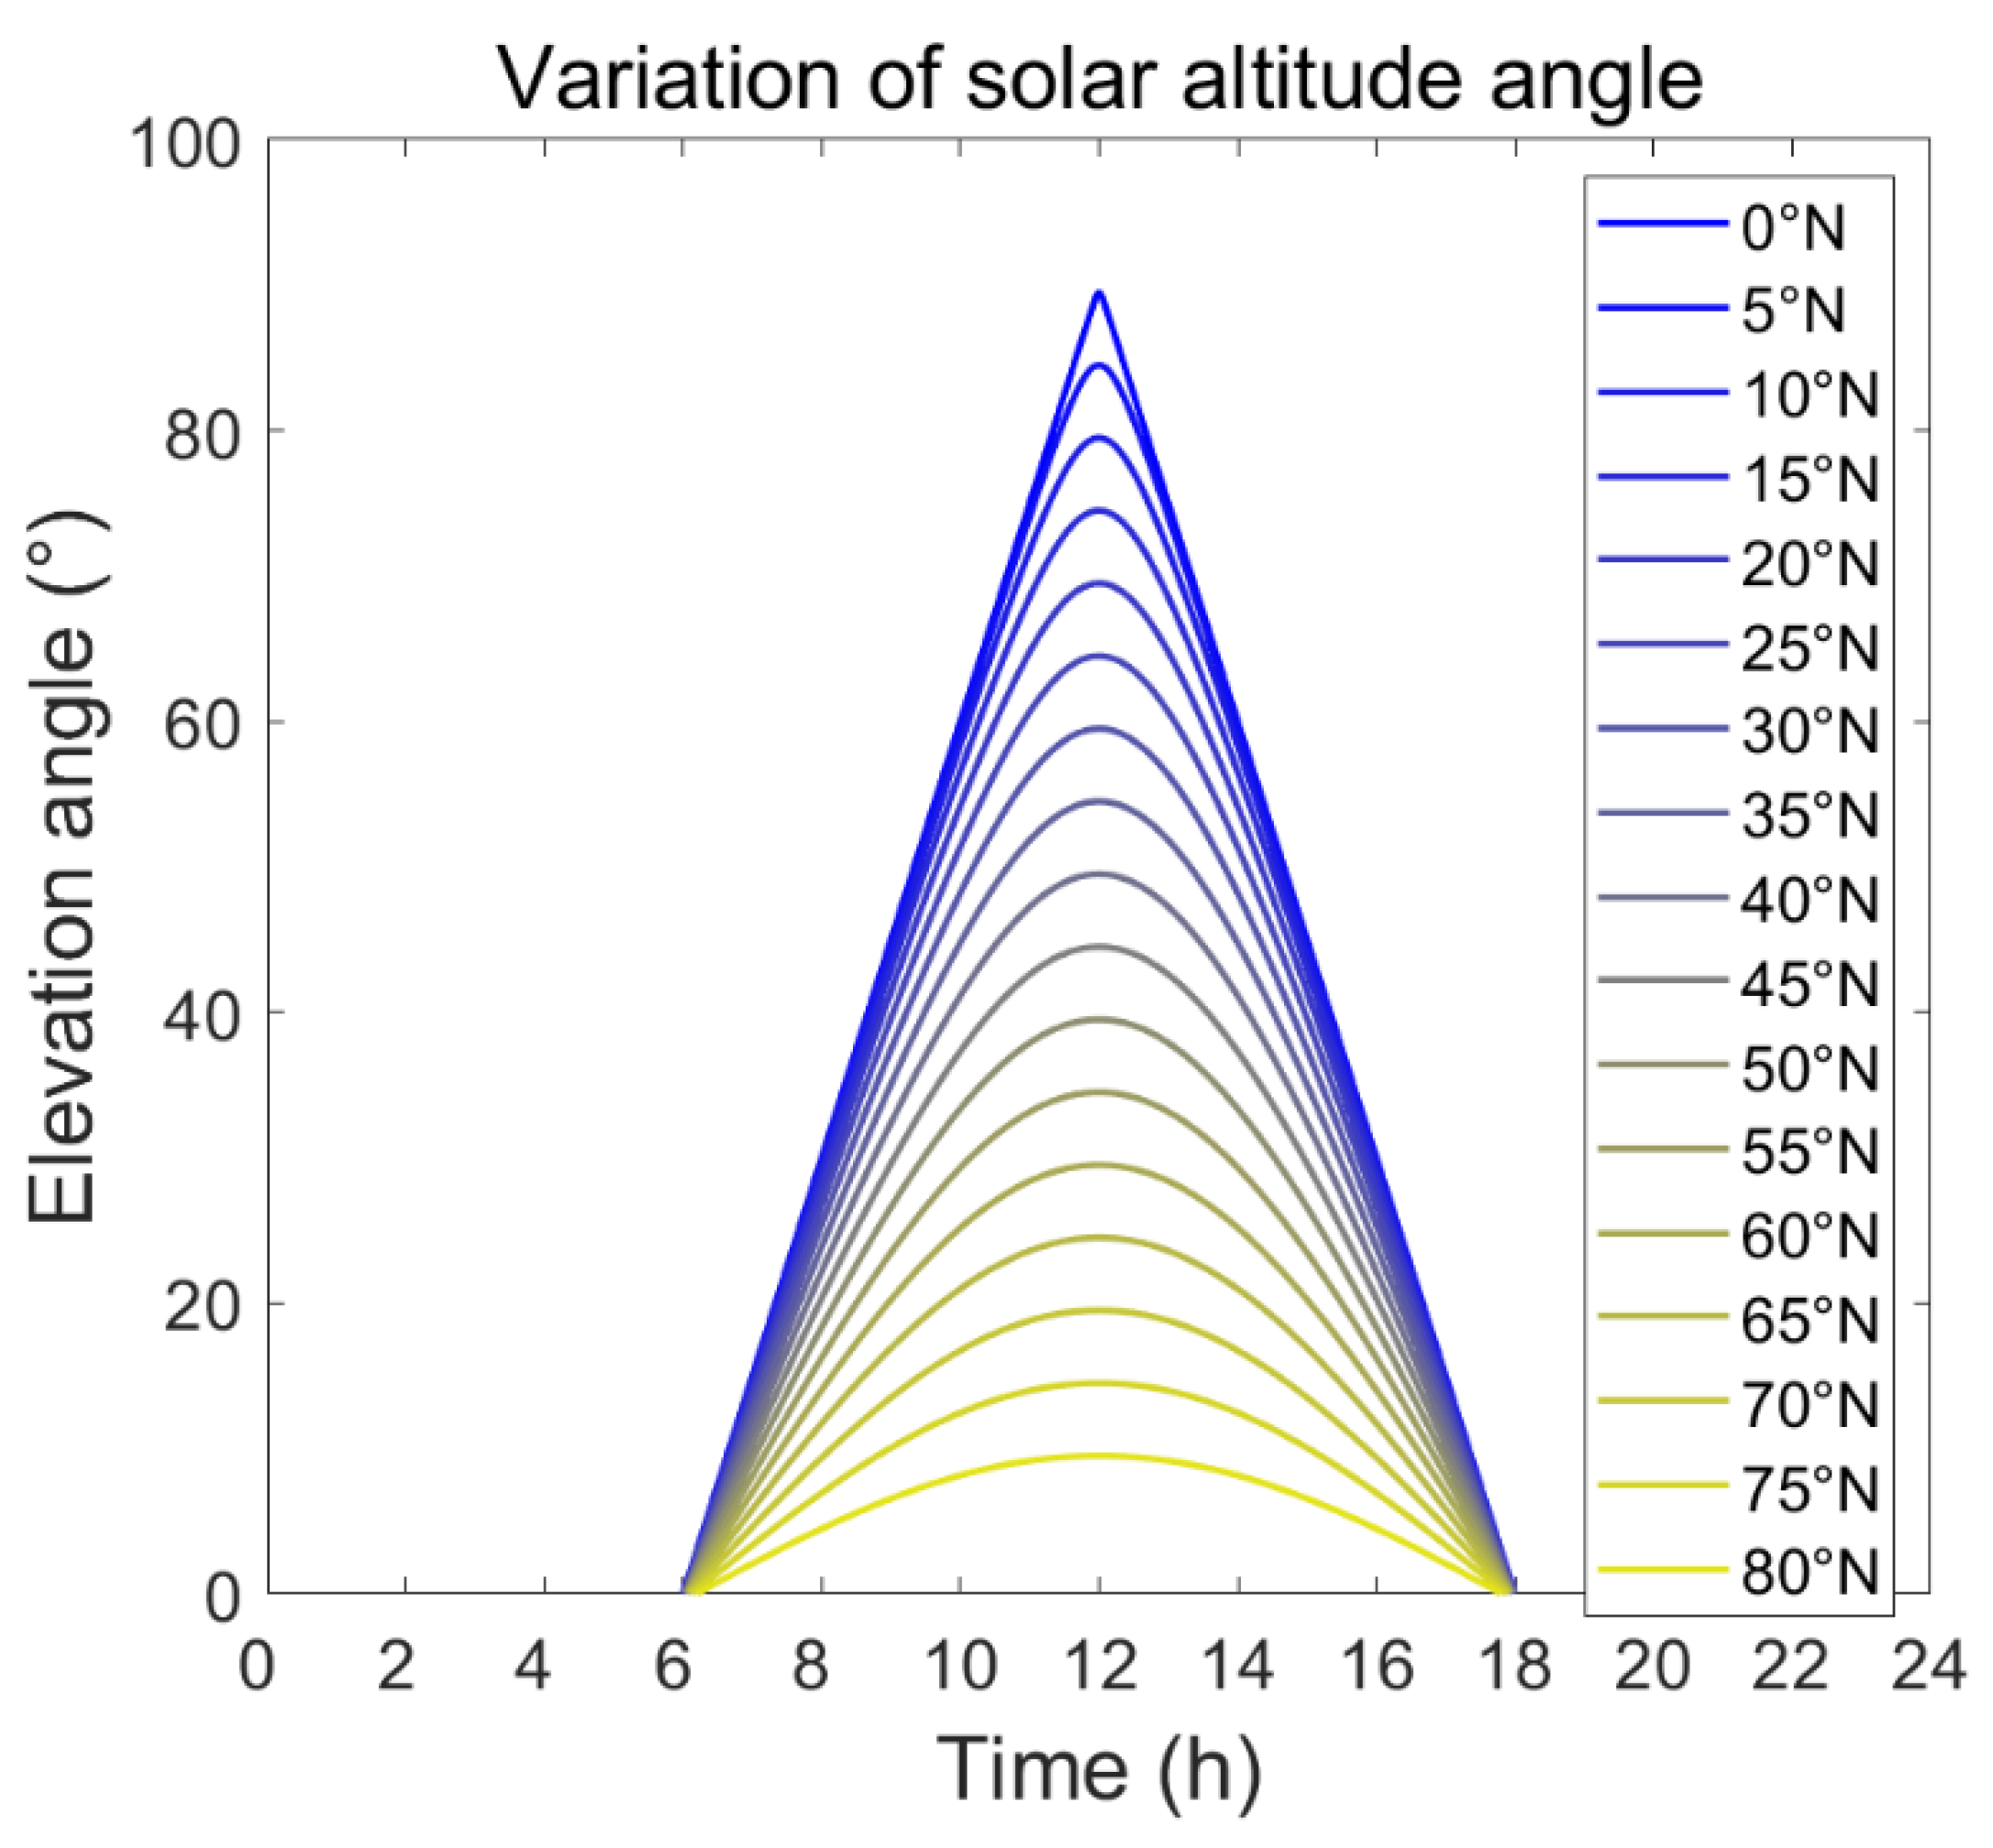
Taking Weihai at 37° N and 122° E as an example, the annual variation of solar elevation angle and azimuth angle are analyzed. The moment of sunrise ranges from seven o’clock on 1 January to 4:30 on 1 June, and the length of sunshine ranges from 9.5 h in January to 14.5 h in June. The different intercepts of the curves from the horizontal axis indicate the length of light hours on that day. The light hours are longest in summer and shortest in winter. In both winter and summer, at noon, the solar elevation angle reaches its maximum (Figure 4). This means that throughout the year, the optimal azimuth of the Sun should point to the position of the Sun at noon, and the optimal tilt angle of the Sun should be higher in summer than in winter.
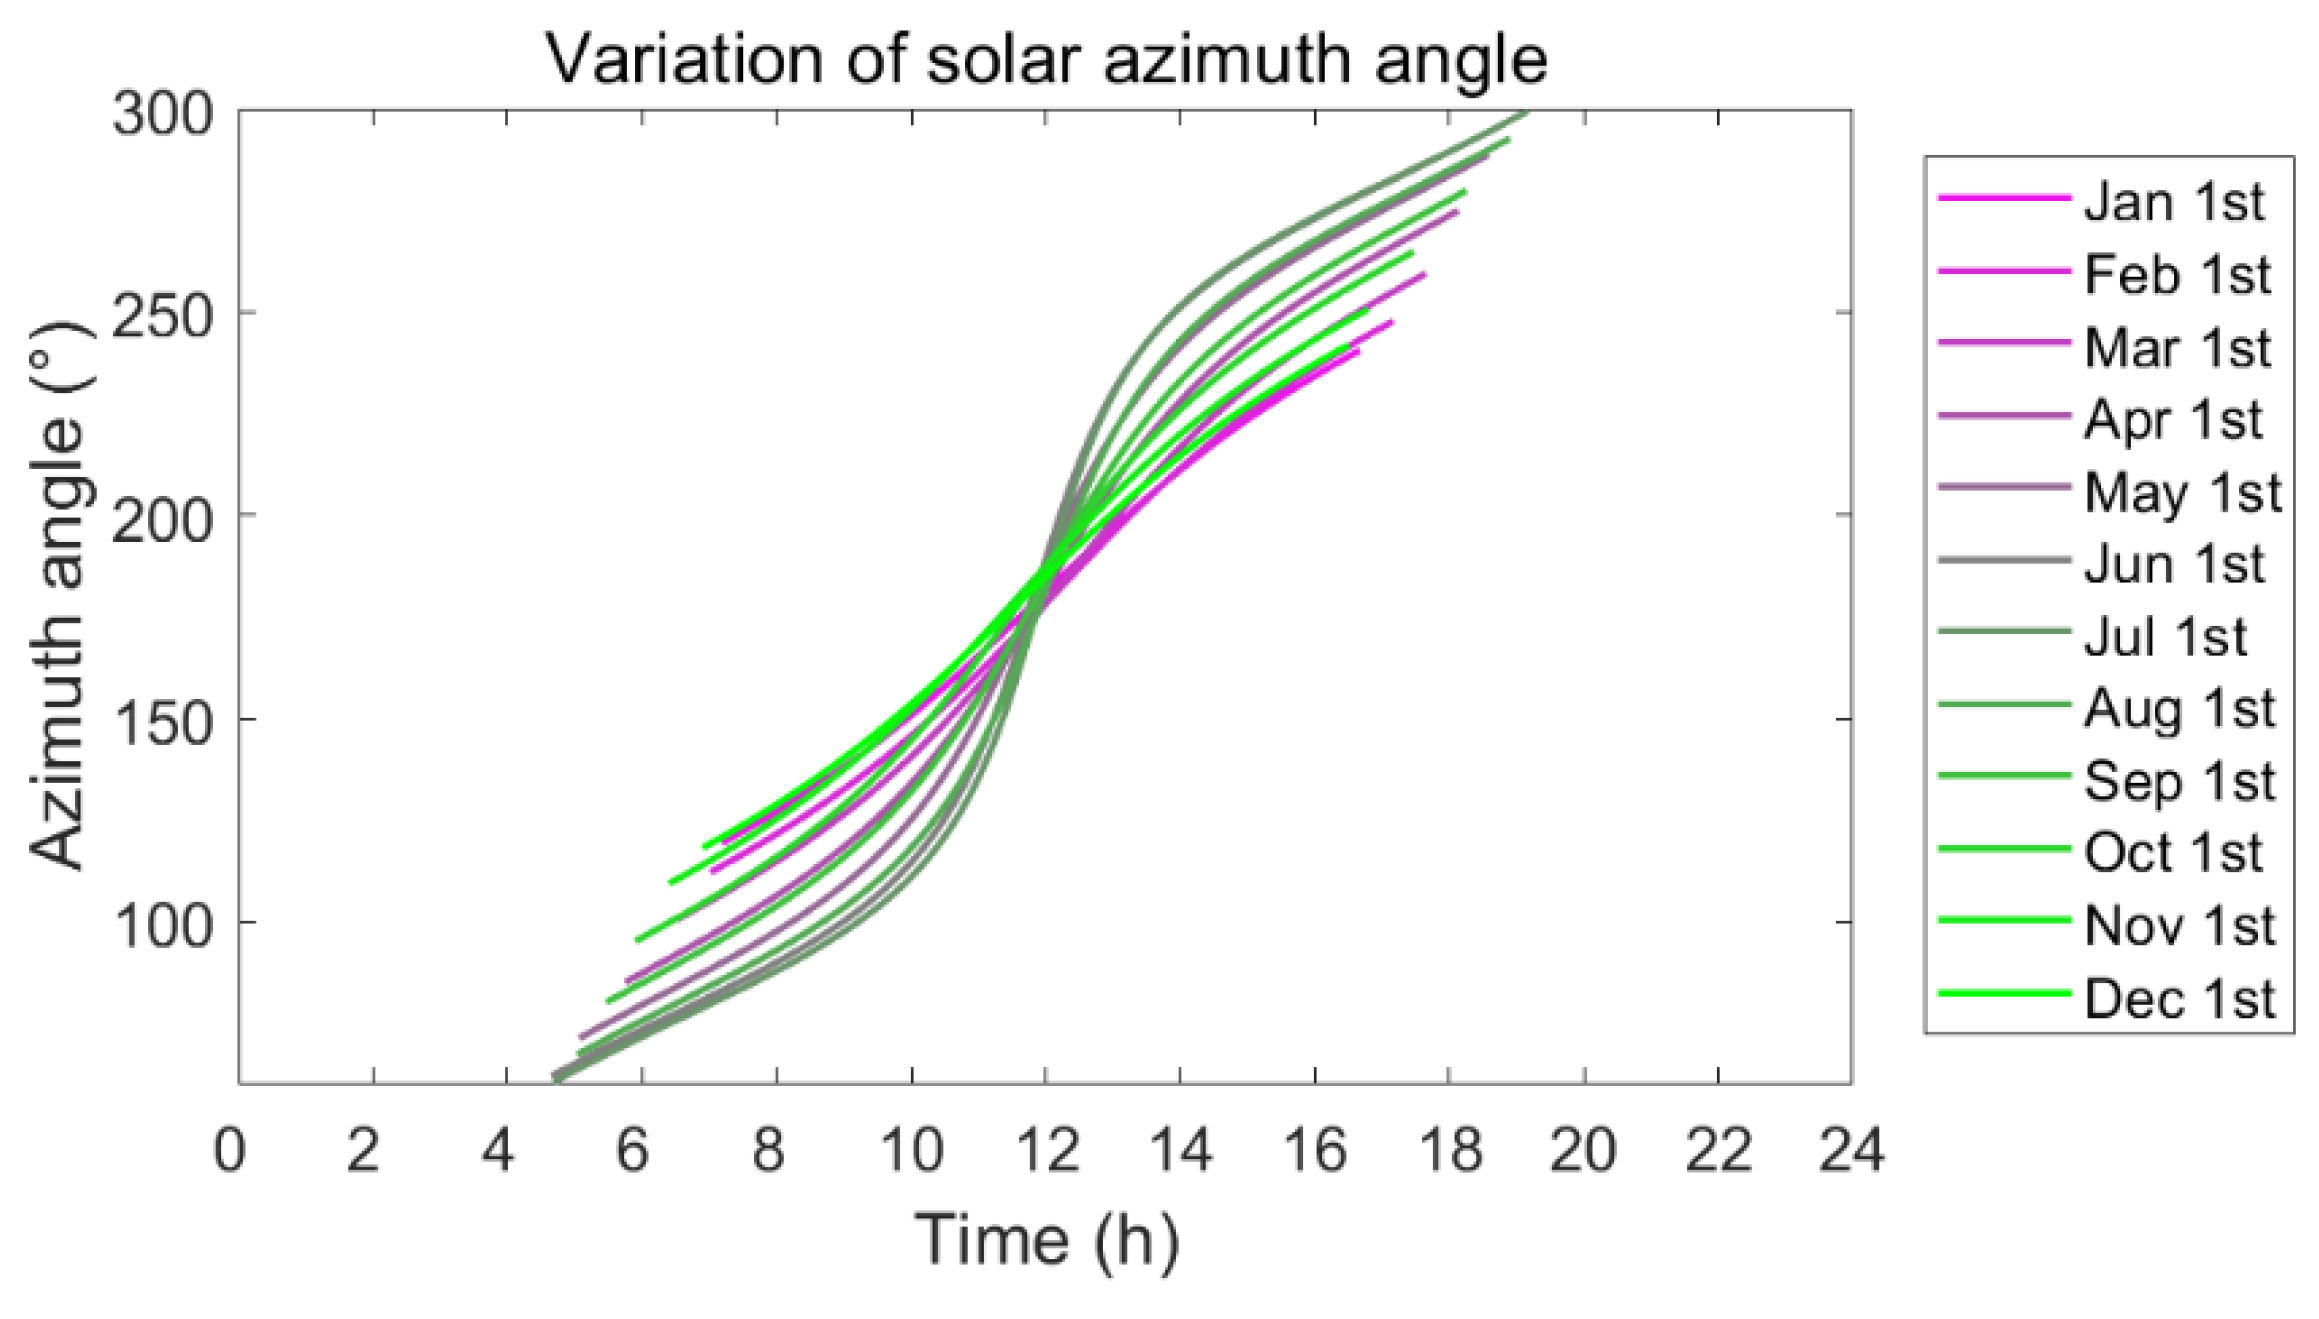
The solar azimuth is counted from due north, and 180° indicates due south. Basically, the Sun reaches south at noon in the Weihai area. The closer to noon, the faster the Sun’s azimuth changes, which is especially obvious in summer, but not in winter (Figure 5). Since the daily azimuth distribution is symmetrical, this inconsistency does not affect the fixed orientation of the solar optimum azimuth.
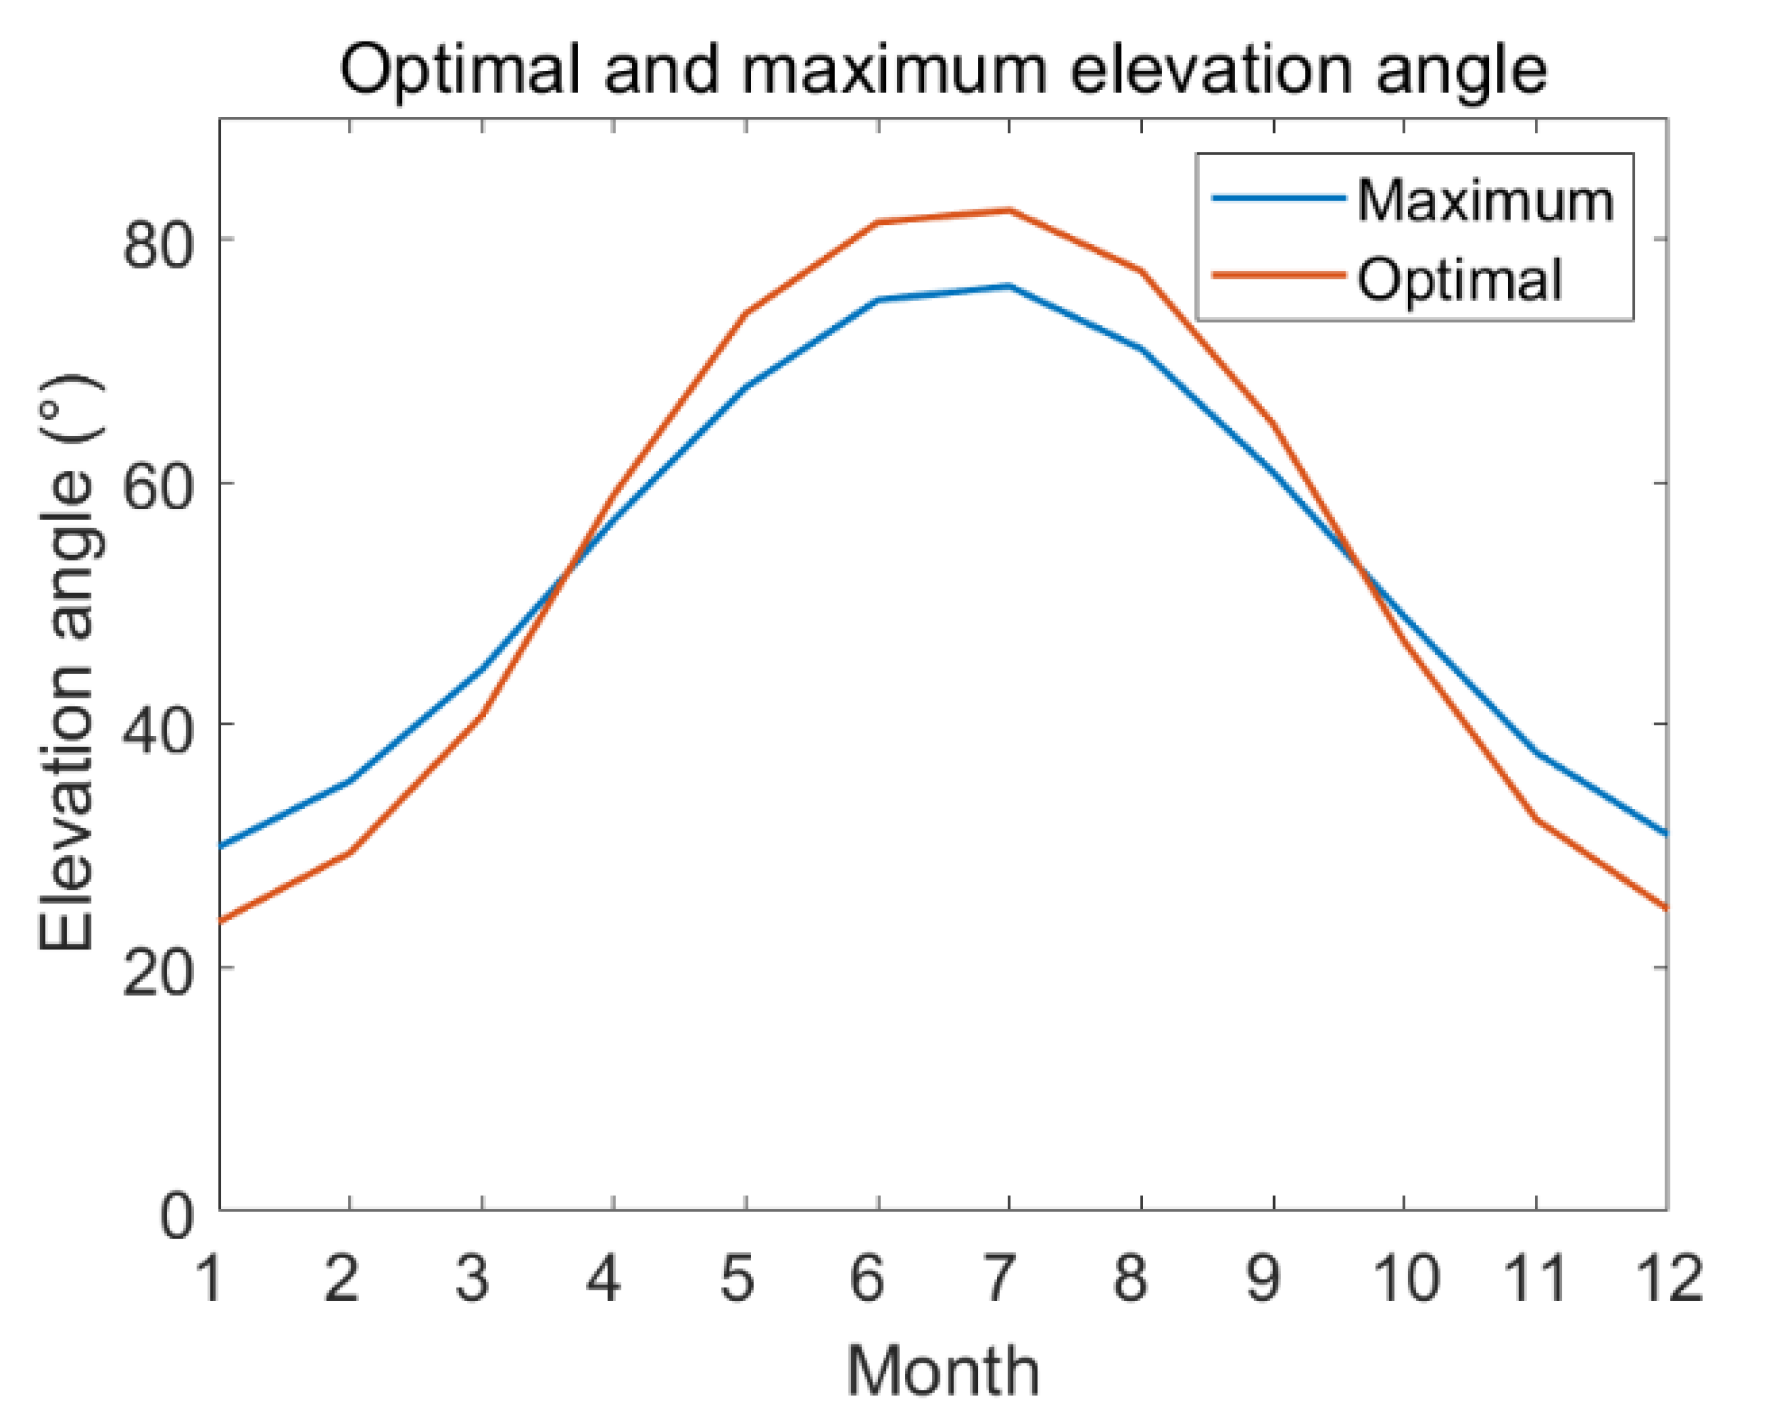
In practical engineering, for one day, a general solar collector tilt angle scheme is to take the complementary angle of the noon solar altitude angle as the collector tilt angle. However, simulation results show an inconsistency with this common sense. It can be seen by Figure 6 that the maximum solar elevation angle changes from 30.0° on 1 January to 76.1° on 1 July, while the optimal solar angle in Weihai area changes from 23.8° to 82.4°. During the period from the vernal equinox to the autumnal equinox, the optimal tilt angle of the day is greater than the solar tilt angle at noon. This means that during the summer and surrounding months, the inclination of the solar collector should be as small as possible for receiving more top-to-bottom irradiation. Conversely, near winter, solar collectors should be more upright and used to receive irradiation from south to north.
The table with the tilt angle on the first day of each month as a representative of that month is shown in Table 1. The optimal tilt angle is the complementary angle of the optimal elevation angle shown in Figure 6. This result is compared with the simulated and measured results of Turkey [37]: the tilt angle in this study is lower for most months, with June to August being 1.9° to 6.3° lower. However, this result for the lower tilt angle is much closer to the measured value in study [37]. A highly probable reason for this is that the solar collector is planar and therefore, in theory, it can only receive radiation from the front (i.e., half of the celestial sphere). When real solar motion is incorporated, the low tilt scheme is able to receive radiation from the upper half of the celestial sphere without having to wait until the solar motion crosses the front of the solar collector.
Darhmaoui [38] used a solar radiation prediction model with the best predicted inclination of 36.6°–36.7° and the optimal inclination of 36.5–36.9° at a latitude of 37.5°. Averaging the inclination angles for each month of Table 1, the average value of the best inclination angle for each month in Weihai yields 37.07°, which is close to Darhmaoui’s prediction and optimal model.

3.2. Variation of Best Angle with Latitude

The variation of the optimal tilt angle with latitude was analyzed on 21 March 2019 (vernal equinox). Figure 7 represents the daily variation of solar collector tilt angle for different latitudes. At the spring equinoxes, the global day and night are of equal length, both with sunrise at 6:00 and sunset at 18:00. At the equator, it is close to 90° at noon. This figure shows that the optimal inclination of the Sun on the equinox is only related to the latitude. With increasing latitude, the tilt angle of the Sun decreases at all moments. At 80° N, the solar tilt angle is below 10° at noon, corresponding to an optimal placement angle of about 6.5° on that day.
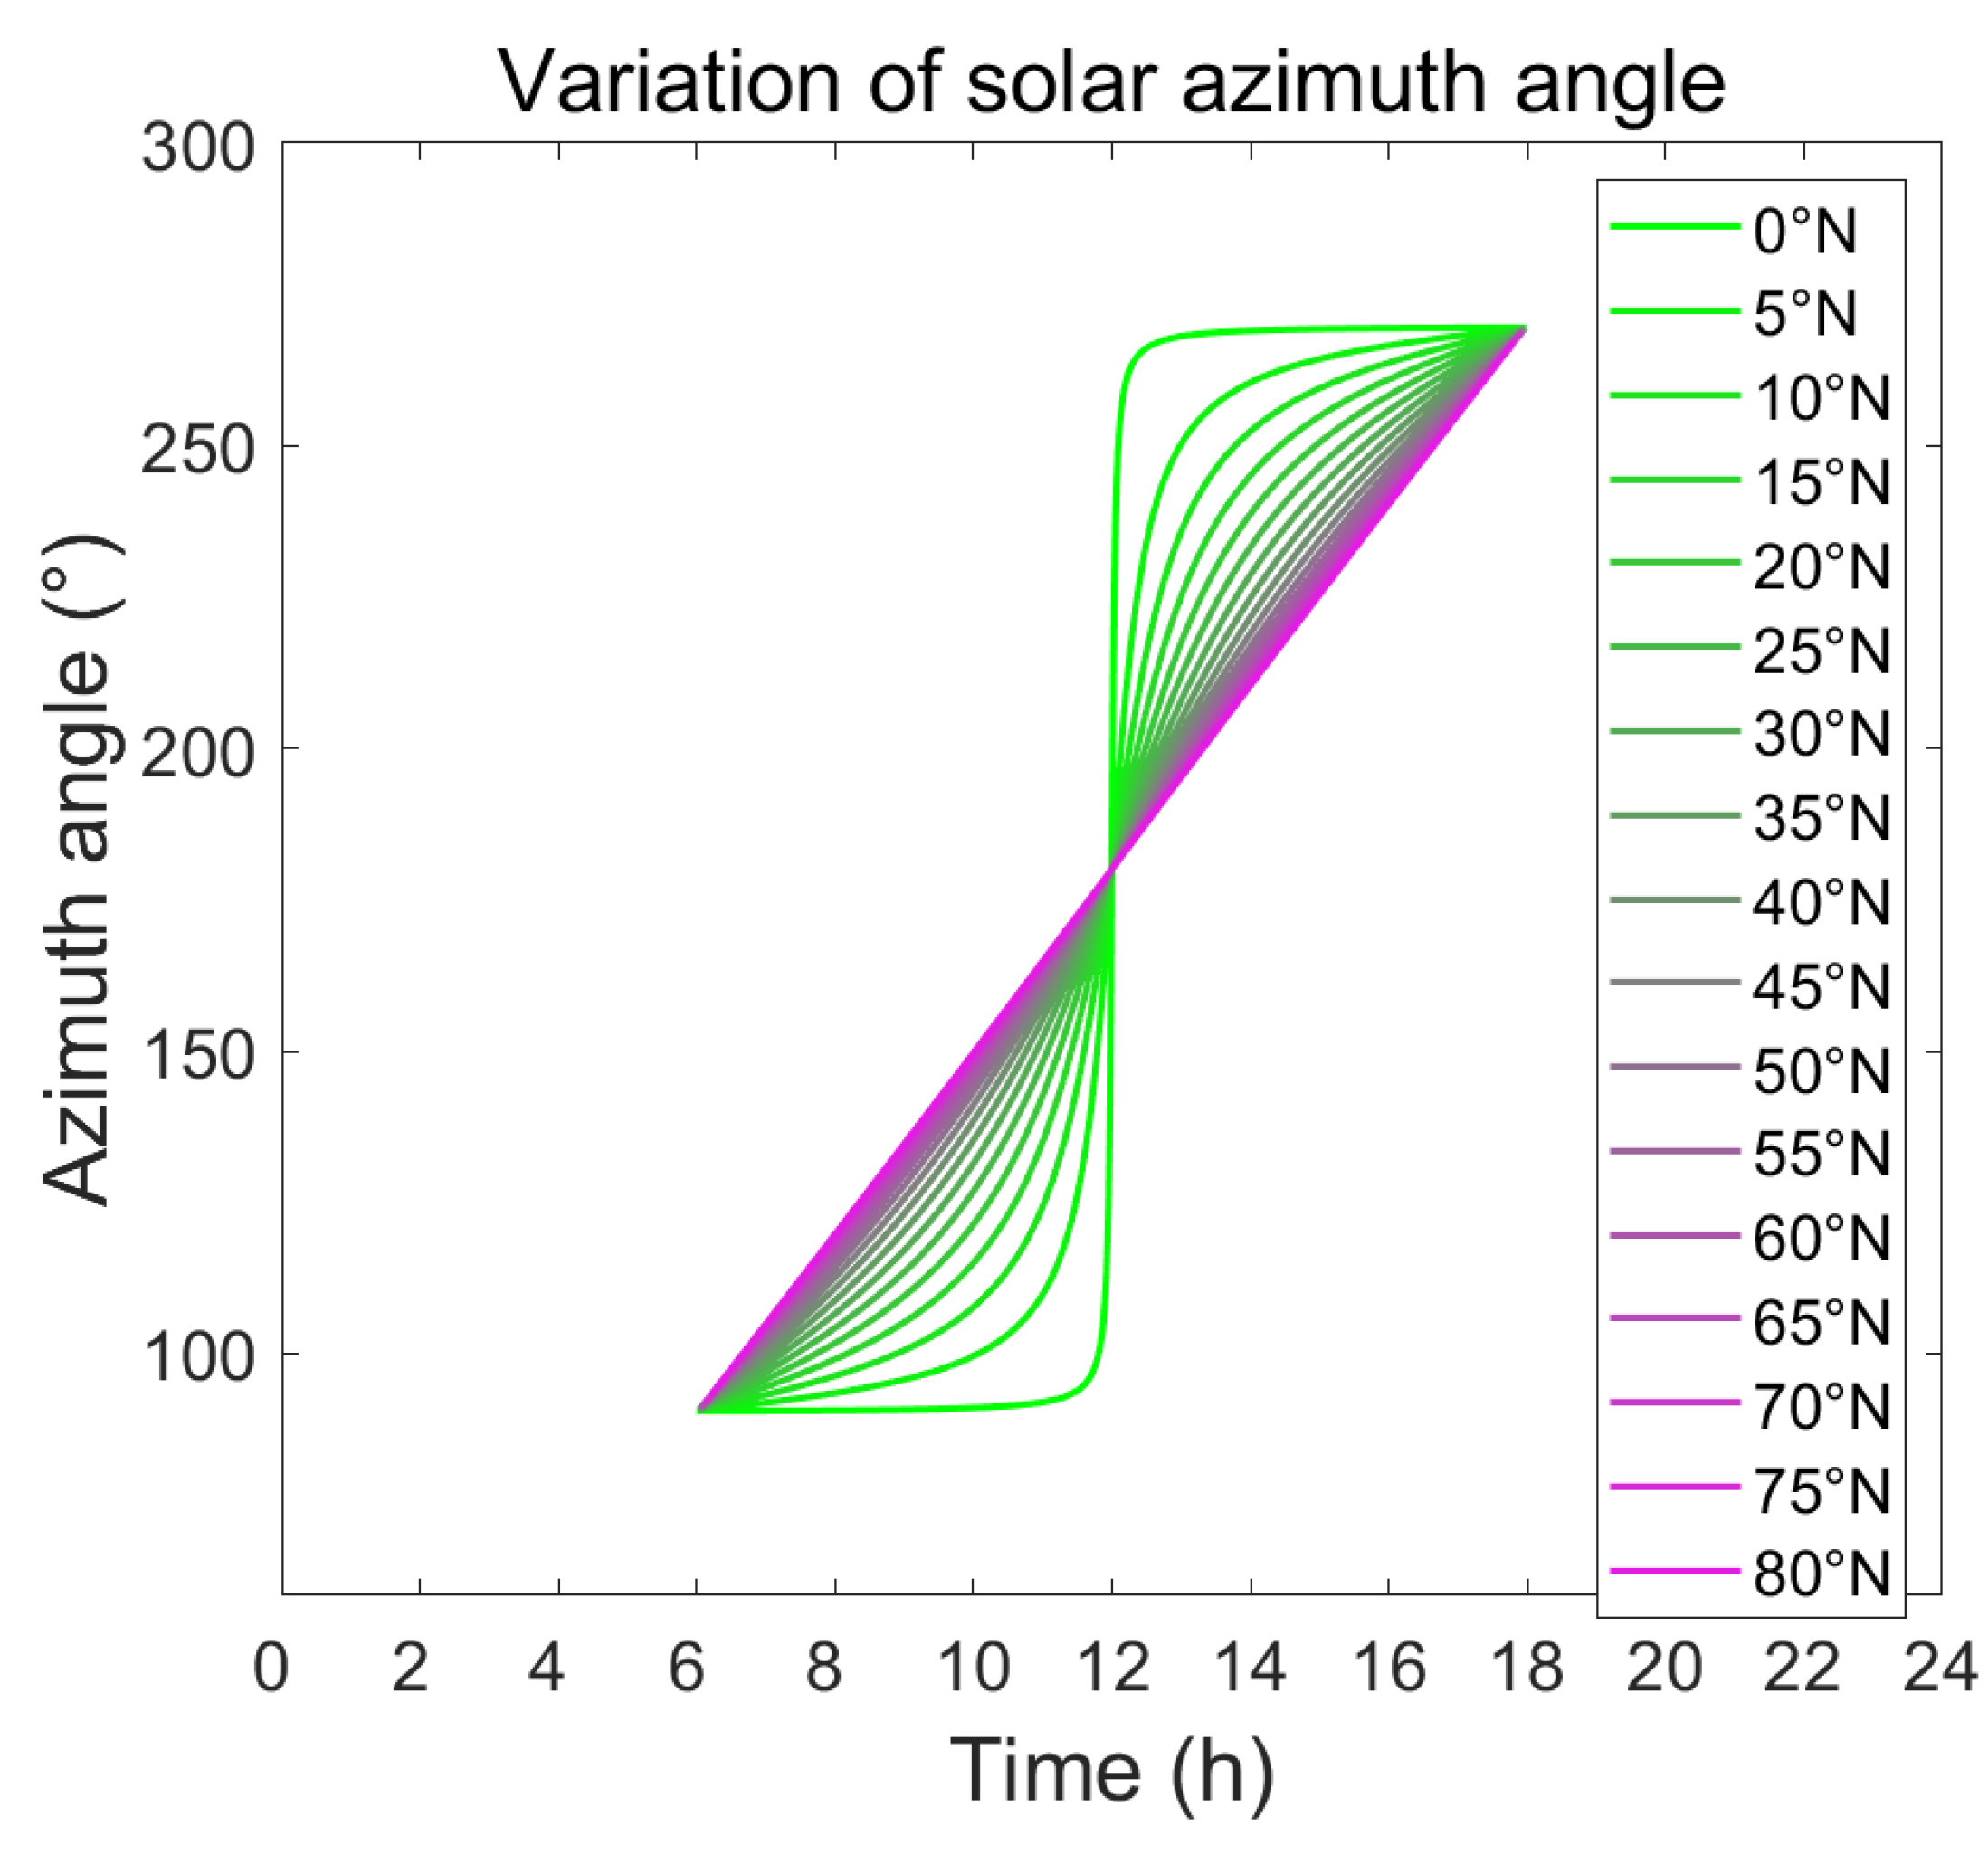
Figure 7 illustrates the daily variation of the solar azimuth with latitude. At high latitudes, the solar azimuth is essentially at a uniform rate. The lower the latitude, the faster the azimuth changes at noon, and the slower it changes at sunrise and sunset. For the point on the equator, since the Sun shines directly on the equator at the equinox, the Sun is always due east (90° azimuth) before noon, and after noon, it is always in the west (180° azimuth). Therefore, the curve at 0° N behaves as a vertical line at 12:00, as shown in Figure 8.
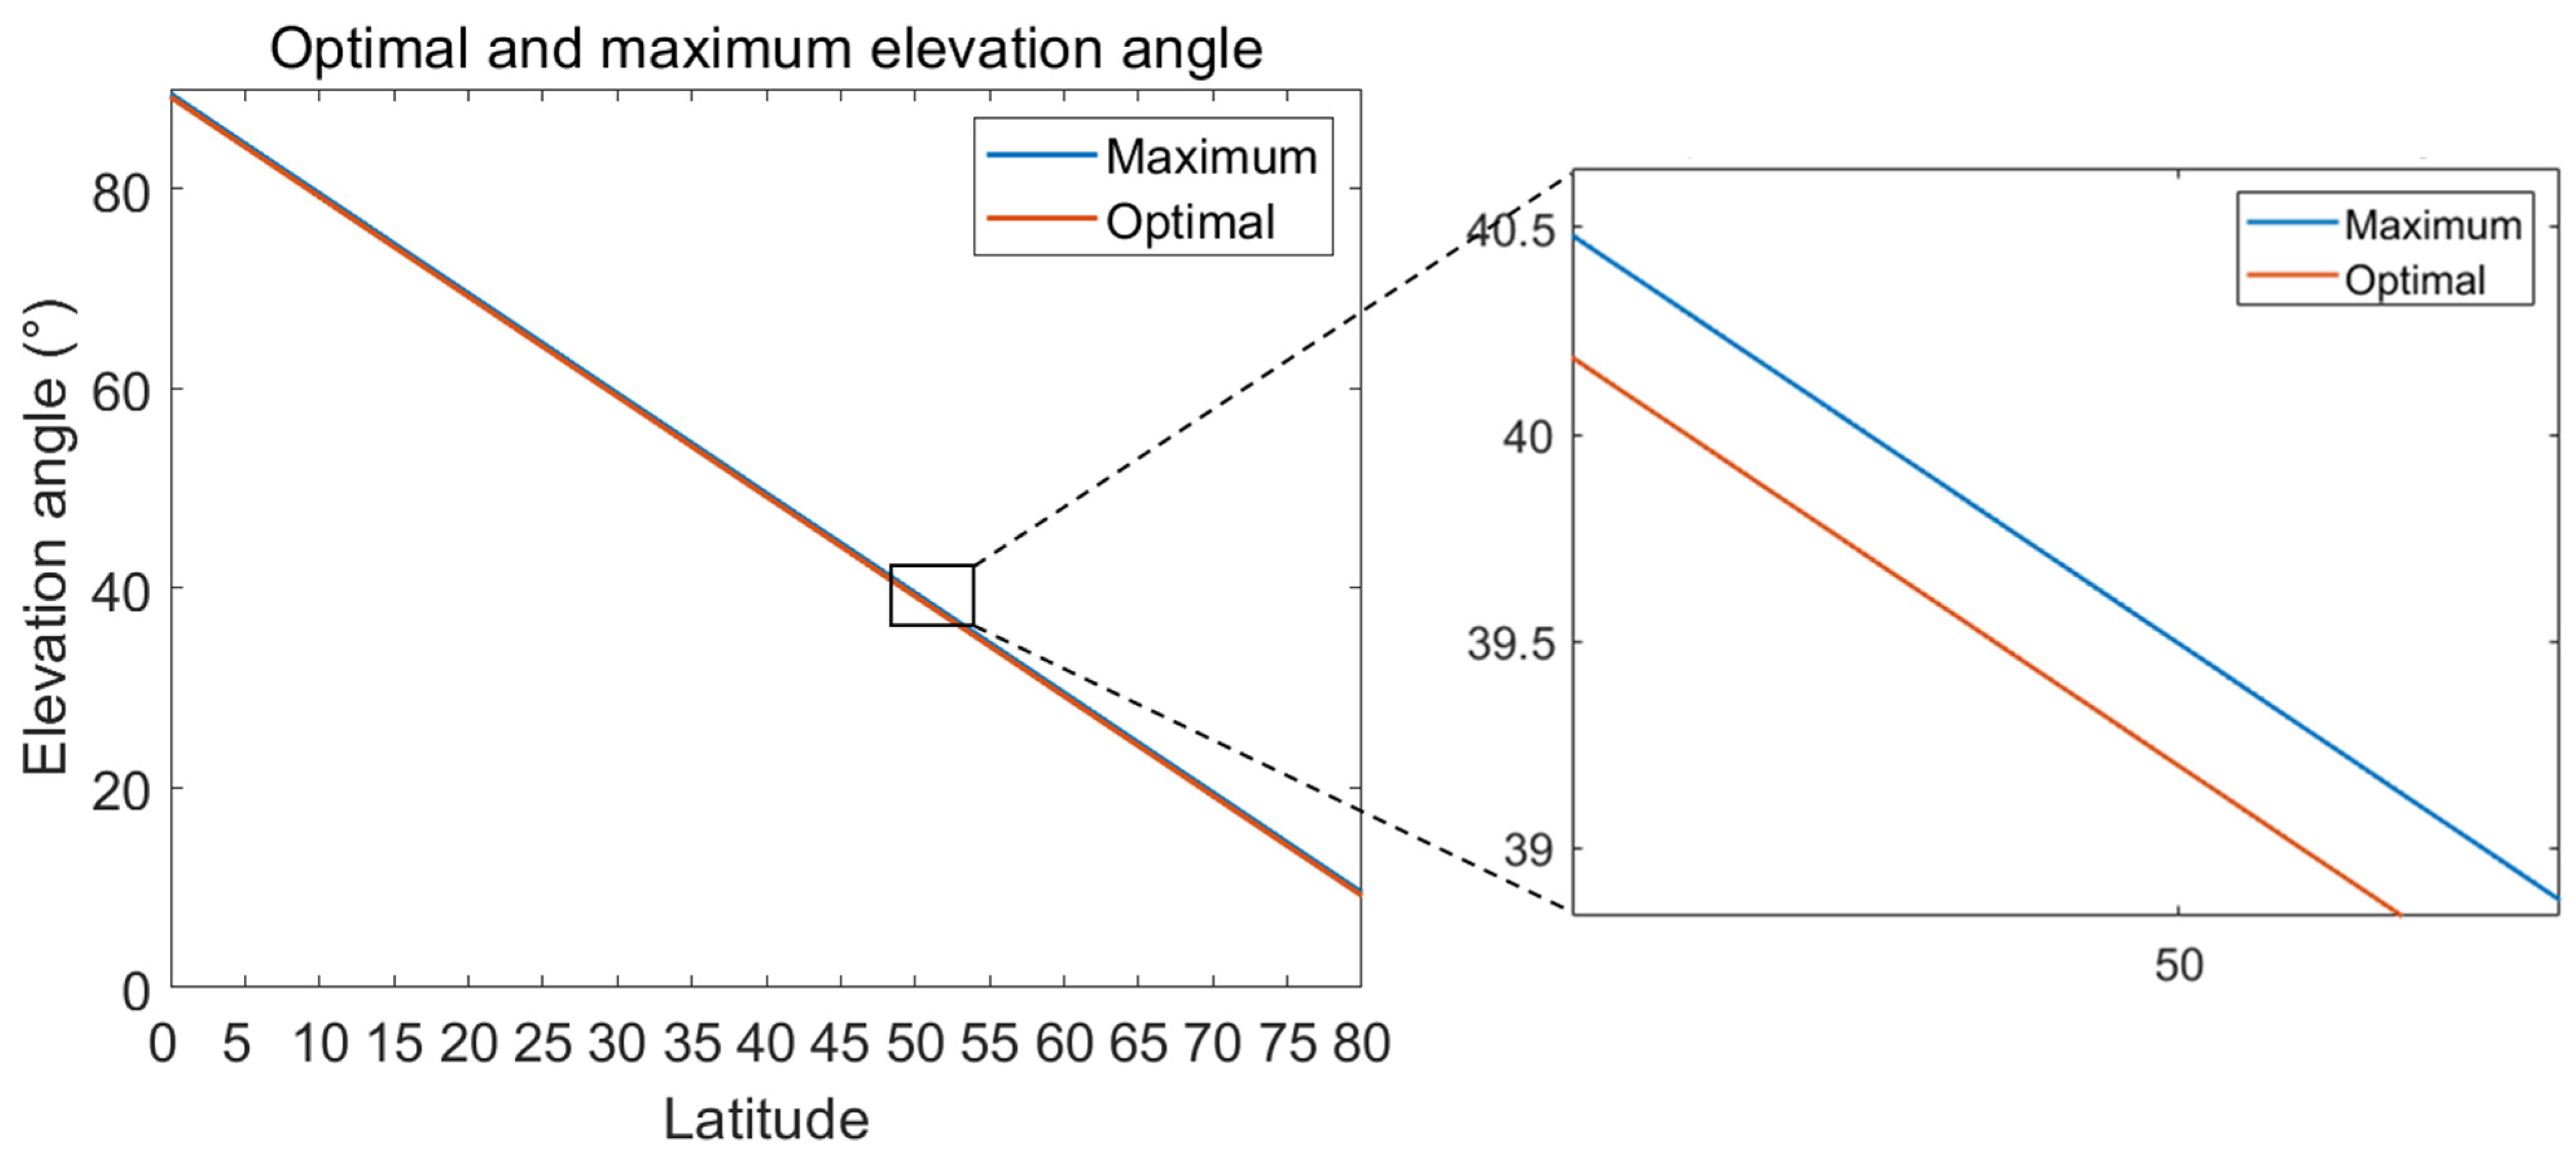
On the 2019 vernal equinox, the maximum and optimum tilt angles of the Sun on that day decrease with increasing latitude. Both are linearly decreasing in relation to latitude. This can be seen in Figure 9. In addition, the optimal tilt angle is not exactly equal to latitude but is about 0.9° smaller than latitude. Before the vernal equinox, the optimal tilt angle is smaller than latitude; around the vernal equinox, it is close to latitude; after the vernal equinox, it is greater than latitude.
The vernal equinox is used as a representative of the whole year, using 50.5° N as an example. The altitude angle of the Sun calculated by the model is 38.8°. Therefore, the tilt angle of the solar collector is 51.2°, which is 0.8° greater than the ‘latitude definition’ method [10] of 50.5°. This shows how the model differs from the conventional method. When the levelized cost of electricity model [10] is taken into account, an integrated optimal inclination angle should also be slightly larger than it is in the conventional method.

3.3. Losses Due to Deviation from the Optimal Angle

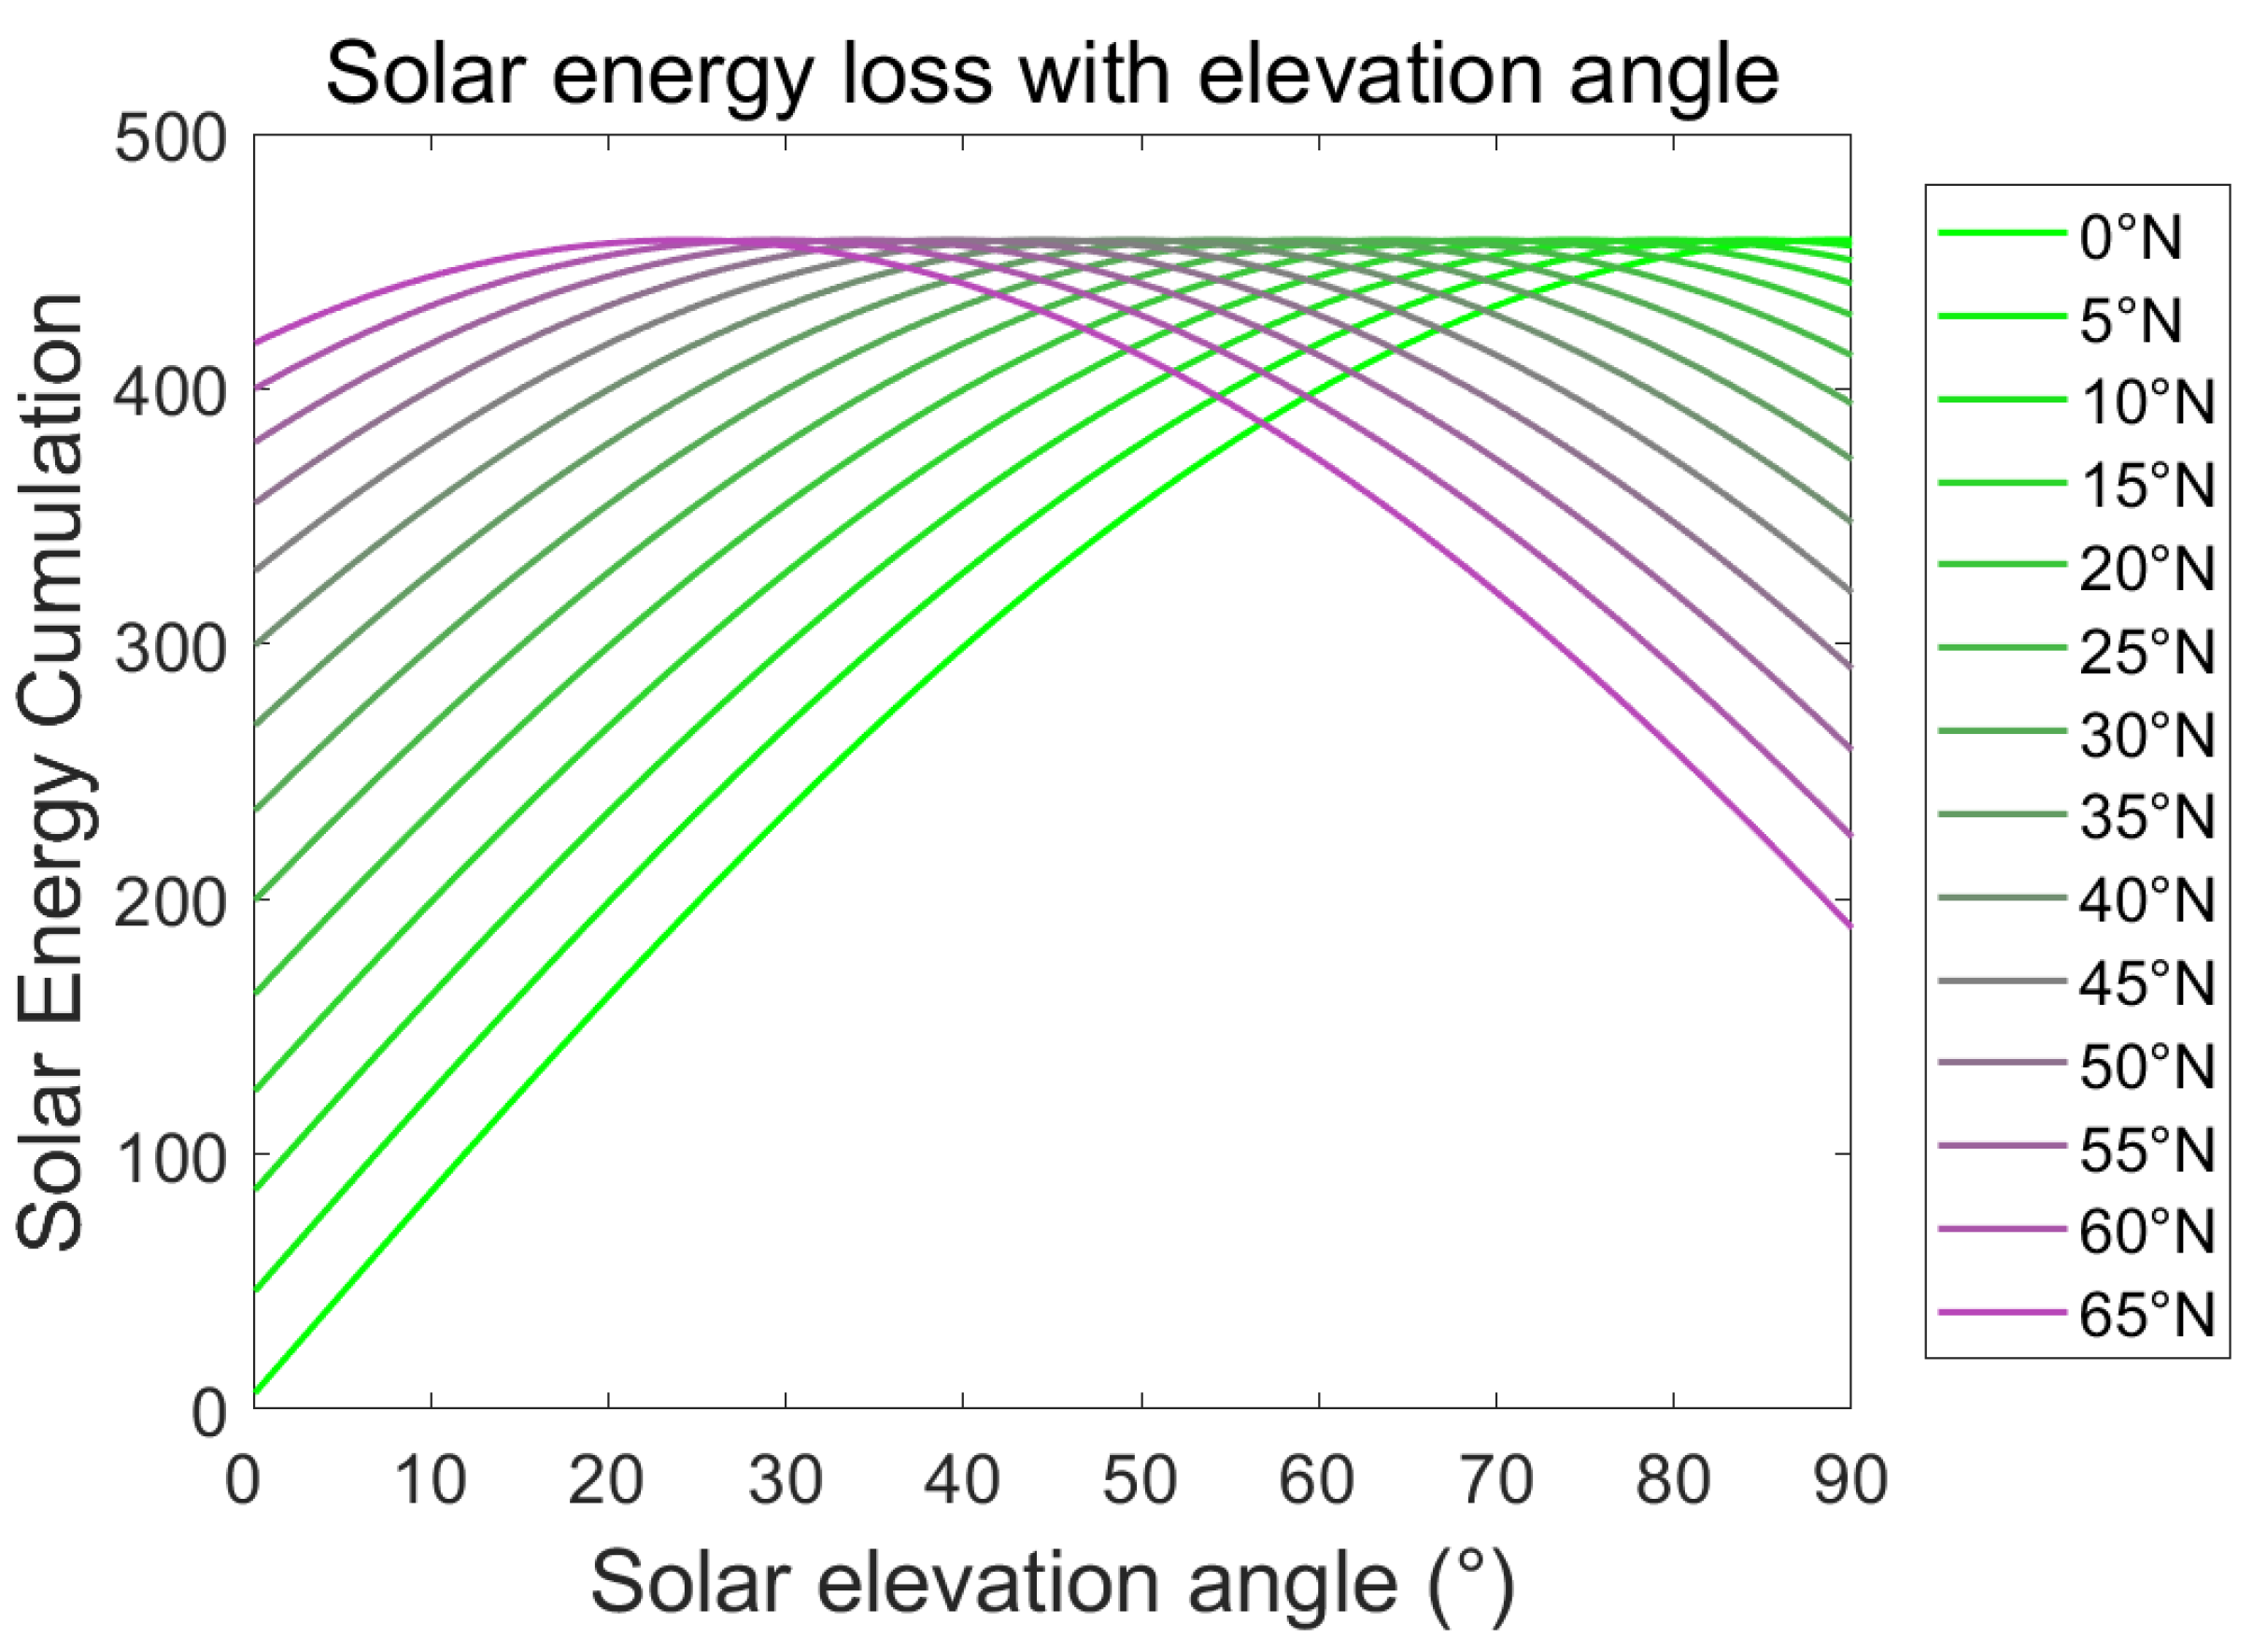
Figure 10 visualizes the potential losses that could result from deviating from the optimal solar placement angle. The vertical axis represents the solar energy accumulation calculated according to Equation (30). During the day, the difference in the tilt angle setting of the solar collectors causes a change in this accumulation. On the day shown, the optimal solar tilt angle for areas above 60° N is 15° or less. The higher the solar tilt angle at high latitudes, the more severe the solar loss. If the tilt angle is too high (e.g., 70°), it will result in only half the optimal angle of direct solar energy accumulation for that day. Similarly, at low latitudes, a high solar tilt angle, meaning that the solar collectors are nearly vertical to the ground, will also result in a reduction in direct solar accumulation. In addition, this figure shows that, with both sets to the local optimum inclination, lower latitudes receive higher solar energy accumulation than higher latitudes, although not significantly.

4. Conclusions

In this paper, a solar collector tilt model that incorporates solar orbital motion was presented. Based on this, the optimal tilt angles were analyzed for different latitudes and different times. The key steps of coordinate conversion of solar motion and the calculation method of solar energy accumulation were described in detail. When the latitude and longitude of a point on Earth are given, the theoretical optimal solar tilt angle for that day can be calculated. Then, the optimal tilt angle can be calculated accordingly. Subsequently, some analyses have shown that the optimal tilt angle is characterized by temporal and spatial variation.
First, in a typical northern latitude, the optimal tilt angle is higher in summer and lower in winter, inconsistent with the solar altitude angle at noon. The cut-off points for the variation are at the vernal and autumn equinoxes. This indicates that the optimal inclination angle of solar energy in summer should be lower than the remainder of the solar altitude angle at noon in summer in order to receive more radiation from directly above; while the collector in winter should be more inclined to receive more radiation from the south.
Second, the optimal tilt angle varies with latitude. The lower the latitude, the higher the optimal tilt angle. This variation is linear. In general, the tilt angle of solar collectors used throughout the year should be consistent with the local latitude [39]. However, the results show that the optimal tilt angle should be slightly higher than the latitude.
If the optimal tilt angle is not calculated and used, there is a loss of solar energy. The variation of the loss rate with the solar tilt angle setting has also been demonstrated. For residential single solar collectors, the losses due to deviations from the optimal tilt angle of up to 5° are insignificant. However, for large-area solar collectors, the losses due to deviation from the optimal tilt angle can rapidly increase.
In this study, only the daily accumulated optimal height angle was shown. For a fixed solar placement, it can also be used to calculate the annual cumulative optimum angle. In addition, when the local geographic and climatic factors do not affect the visibility of the Sun, one can directly use this model to calculate the optimal tilt angle. Since there is a general tendency in industry to use refined and simplified models, a more concise model that can be numerically described clearly in one or two equations can be proposed in the future and be generalized in the calculation of the tilt angle of solar collectors. Otherwise, in practical applications, factors such as atmospheric refraction, mountain blockage, and local climate should also be taken into account.

Author Contributions

Conceptualization: L.L. and G.X.; Data curation: T.L.; Funding acquisition: L.L. and G.X.; Methodology: L.L. and G.X.; Software: T.L. and J.L.; Supervision: G.X.; Visualization: Y.H. and M.S.; Writing–original draft: T.L.; Writing—review and editing: L.L., Y.H., and M.S. All authors have read and agreed to the published version of the manuscript.

Funding

This research was funded by the Shenzhen Science and Technology Program (group No. KQTD20180410161218820) and the China Postdoctoral Science Foundation (No. 2020M670896).

Data Availability Statement

The code, data, etc. related to this article can be obtained by contacting the author via e-mail.

Acknowledgments

An interest group from Shandong University, Weihai, provided the initial derivation and organization of the equations, and now the members have graduated and are pursuing further studies with other universities. The main members of this group are Xianke He from Shanghai Jiao Tong University, Tong Liu from Harbin Institute of Technology Shenzhen, Ziming Cao from Beijing Normal University, Zihang Feng from Shandong University, Lingyue Sun from the University of Calgary, and Zhiyue Li from the University of Hong Kong.

Conflicts of Interest

The authors declare no conflict of interest.

Abbreviations

Specific abbreviations and their full names.
ECEIEarth-centered ecliptic inertial
ECIEarth-centered inertial
ECEFEarth-centered, Earth-fixed
CIOconventional international origin
X*coordinate system
R*rotate matrix
ε obliquity of the ecliptic
Nthe prime vertical curvature radius
ethe first eccentricity
φ latitude
λ longitude
hheight above the sea level
a s the semi-major axis of the ellipse
e s the orbital eccentricity
ε s the orbit inclination
Ω s the longitude of ascending node
fsthe true anomaly
w s Perigee angular distance
AUastronomical unit (149,597,870,691 × 108 km)
Msthe flat anomaly
Lsunsolar zodiac longitude
Daverage angular distance from the Sun to Moon
F F = L m o o n Ω m o o n
Lmoonaverage longitude of the Moon
Ω m o o n the average longitude of the Moon’s ascending node
qthe position and velocity of the Sun
GASTthe Earth’s rotation angle from the true vernal equinox to Greenwich Meridian
GMSTthe mean equinox to Greenwich meridian
Δ Ψ the nutation in longitude
UTUniversal Time
IERSthe International Earth Rotation Service
ENUlocal east-north-up coordinate frame

References

  1. Banerjee, T.; Podjaski, F.; Kröger, J.; Biswal, B.P.; Lotsch, B.V. Polymer photocatalysts for solar-to-chemical energy conversion. Nat. Rev. Mater. 2021, 6, 168–190. [Google Scholar] [CrossRef]
  2. Yakup, M.A.; Malik, A.Q. Optimum tilt angle and orientation for solar collector in Brunei Darussalam. Renew. Energy 2001, 24, 223–234. [Google Scholar] [CrossRef]
  3. Shakya, S. Determination of the optimal tilt angle Nepal. Res. J. Phys. Sci. 2019, 7, 8–14. [Google Scholar]
  4. Abdallah, R.; Juaidi, A.; Abdel-Fattah, S.; Manzano-Agugliaro, F. Estimating the Optimum Tilt Angles for South-Facing Surfaces in Palestine. Energies 2020, 13, 623. [Google Scholar] [CrossRef] [Green Version]
  5. Zsiborács, H.; Baranyai, N.H.; Vincze, A.; Háber, I.; Weihs, P.; Oswald, S.; Gützer, C.; Pintér, G. Changes of Photovoltaic Performance as a Function of Positioning Relative to the Focus Points of a Concentrator PV Module: Case Study. Appl. Sci. 2019, 9, 3392. [Google Scholar] [CrossRef] [Green Version]
  6. Racharla, S.; Rajan, K. Solar tracking system—A review. Int. J. Sustain. Eng. 2017, 10, 72–81. [Google Scholar]
  7. Zhang, J.; Yin, Z.; Jin, P. Error analysis and auto correction of hybrid solar tracking system using photo sensors and orientation algorithm. Energy 2019, 182, 585–593. [Google Scholar] [CrossRef]
  8. Henriques, D.; Tiba, C. npTrack: A n-Position Single Axis Solar Tracker Model for Optimized Energy Collection. Energies 2021, 14, 925. [Google Scholar]
  9. Mousazadeh, H.; Keyhani, A.; Javadi, A.; Mobli, H.; Abrinia, K.; Sharifi, A. A review of principle and sun-tracking methods for maximizing solar systems output. Renew. Sustain. Energy Rev. 2009, 13, 1800–1818. [Google Scholar] [CrossRef]
  10. Breyer, C.; Schmid, J. Global Distribution of optimal Tilt Angles for fixed tilted PV Systems. In Proceedings of the 25th EU PVSEC/ WCPEC-5, Valencia, Spain, 6–10 September 2010. [Google Scholar]
  11. Adell, A. Determination of the optimum inclination of a flat solar collector in function of latitude and local climatic data. Rev. De Phys. Appliquée 1982, 17, 569–576. [Google Scholar] [CrossRef] [Green Version]
  12. Kallioğlu, M.A.; Durmuş, A.; Karakaya, H.; Yılmaz, A. Empirical calculation of the optimal tilt angle for solar collectors in northern hemisphere. Energy Sources Part A Recovery Util. Environ. Eff. 2019, 42, 1335–1358. [Google Scholar] [CrossRef]
  13. Deng, C.; Chen, F. Preliminary investigation on photo-thermal performance of a novel embedded building integrated solar evacuated tube collector with compound parabolic concentrator. Energy 2020, 202, 117706. [Google Scholar] [CrossRef]
  14. Chinchilla, M.; Santos-Martín, D.; Carpintero-Rentería, M.; Lemon, S. Worldwide annual optimum tilt angle model for solar collectors and photovoltaic systems in the absence of site meteorological data—ScienceDirect. Appl. Energy 2021, 281, 116056. [Google Scholar] [CrossRef]
  15. Kim, G.Y.; Han, D.S.; Lee, Z. Solar Panel Tilt Angle Optimization Using Machine Learning Model: A Case Study of Daegu City, South Korea. Energies 2020, 13, 529. [Google Scholar] [CrossRef] [Green Version]
  16. Cheng, H.-Y.; Yu, C.-C.; Hsu, K.-C.; Chan, C.-C.; Tseng, M.-H.; Lin, C.-L. Estimating Solar Irradiance on Tilted Surface with Arbitrary Orientations and Tilt Angles. Energies 2019, 12, 1427. [Google Scholar] [CrossRef] [Green Version]
  17. Farahmand, M.Z.; Nazari, M.E.; Shamlou, S.; Shafie-khah, M. The Simultaneous Impacts of Seasonal Weather and Solar Conditions on PV Panels Electrical Characteristics. Energies 2021, 14, 845. [Google Scholar] [CrossRef]
  18. Nfaoui, M.; El-Hami, K. Optimal tilt angle and orientation for solar photovoltaic arrays: Case of Settat city in Morocco. Int. J. Ambient Energy 2020, 41, 214–223. [Google Scholar] [CrossRef]
  19. Vician, P.; Palacka, M.; Ďurčanský, P.; Jandačka, J. Determination of Optimal Position of Solar Trough Collector. Procedia Eng. 2017, 192, 941–946. [Google Scholar] [CrossRef]
  20. Gardashov, R.; Eminov, M.; Kara, G.; Kara, E.G.; Mammadov, T.; Huseynova, X. The optimum daily direction of solar panels in the highlands, derived by an analytical method. Renew. Sustain. Energy Rev. 2020, 120, 109668. [Google Scholar] [CrossRef]
  21. Abood, A.A. A comprehensive solar angles simulation and calculation using matlab. Int. J. Energy Environ. 2015, 6, 367. [Google Scholar]
  22. Xu, G.; Jia, X. Orbits; Springer: Berlin/Heidelberg, Germany, 2013. [Google Scholar]
  23. Lu, Y. Positioning, Coordinate System, and Time Standard. In BDS/GPS Dual-Mode Software Receiver: Principles and Implementation Technology; Springer: Singapore, 2021; pp. 1–35. [Google Scholar]
  24. Xu, G.; Xu, T.; Yeh, T.-K.; Chen, W. Analytical solution of a satellite orbit disturbed by lunar and solar gravitation. Mon. Not. R. Astron. Soc. 2010, 410, 645–653. [Google Scholar] [CrossRef] [Green Version]
  25. Brouwer, D.; Clemence, G.M. Methods of Celestial Mechanics; Elsevier: New York, NY, USA; London, UK, 2013. [Google Scholar]
  26. Brumberg, V. Essential Relativistic Celestial Mechanics; CRC Press: Los Angeles, CA, USA, 2017. [Google Scholar]
  27. Xu, G.; Xu, Y. GPS: Theory, Algorithms and Applications; Springer: Berlin/Heidelberg, Germany, 2016. [Google Scholar]
  28. Petit, G. Comparision of “Old” and “New” Concepts: Coordinate Times and Time Transformations; Bureau International des Poids et Mesures: Sevres, France, 2002; IERS Technical Note No. 19. [Google Scholar]
  29. You, R.-J. Transformation of Cartesian to geodetic coordinates without iterations. J. Surv. Eng. 2000, 126, 1–7. [Google Scholar] [CrossRef]
  30. Xu, G.; Xu, J. On orbital disturbing effects of the solar radiation. Mon. Not. R. Astron. Soc. 2013, 432, 584–588. [Google Scholar] [CrossRef] [Green Version]
  31. McCarthy, D. International Earth Rotation Service; IERS Conventions: Paris, Italy, 1996. [Google Scholar]
  32. Chen, W.; Shen, W.; Han, J.; Li, J. Free wobble of the triaxial Earth: Theory and comparisons with International Earth Rotation Service (IERS) data. Surv. Geophys. 2009, 30, 39–49. [Google Scholar] [CrossRef]
  33. Montenbruck, O.; Armstrong, A.H. Practical Ephemeris Calculations; Springer: Berlin/Heidelberg, Germany, 1989. [Google Scholar]
  34. Meeus, J. Astronomische Algorithmen; Willmann-Bell, Inc.: Richmond, VA, USA, 1992. [Google Scholar]
  35. Seago, J.H.; Seidelmann, P.K. Mean Solar Time and Its Connection to Universal Time; Springer International Publishing: Cham, Switzerland, 2017. [Google Scholar]
  36. Michalsky, J.J. The Astronomical Almanac’s algorithm for approximate solar position (1950–2050). Sol. Energy 1988, 40, 227–235. [Google Scholar] [CrossRef]
  37. Karafil, A.; Ozbay, H.; Kesler, M.; Parmaksiz, H. Calculation of optimum fixed tilt angle of PV panels depending on solar angles and comparison of the results with experimental study conducted in summer in Bilecik, Turkey. In Proceedings of the International Conference on Electrical & Electronics Engineering, Bursa, Turkey, 26–28 November 2016. [Google Scholar]
  38. Darhmaoui, H.; Lahjouji, D. Latitude Based Model for Tilt Angle Optimization for Solar Collectors in the Mediterranean Region. Energy Procedia 2013, 42, 426–435. [Google Scholar] [CrossRef] [Green Version]
  39. China. MoHaU-RDotPsRo. Technical Standard for Solar Water Heating System of Civil Buildings; China Construction Industry Press: Beijing, China, 2018.
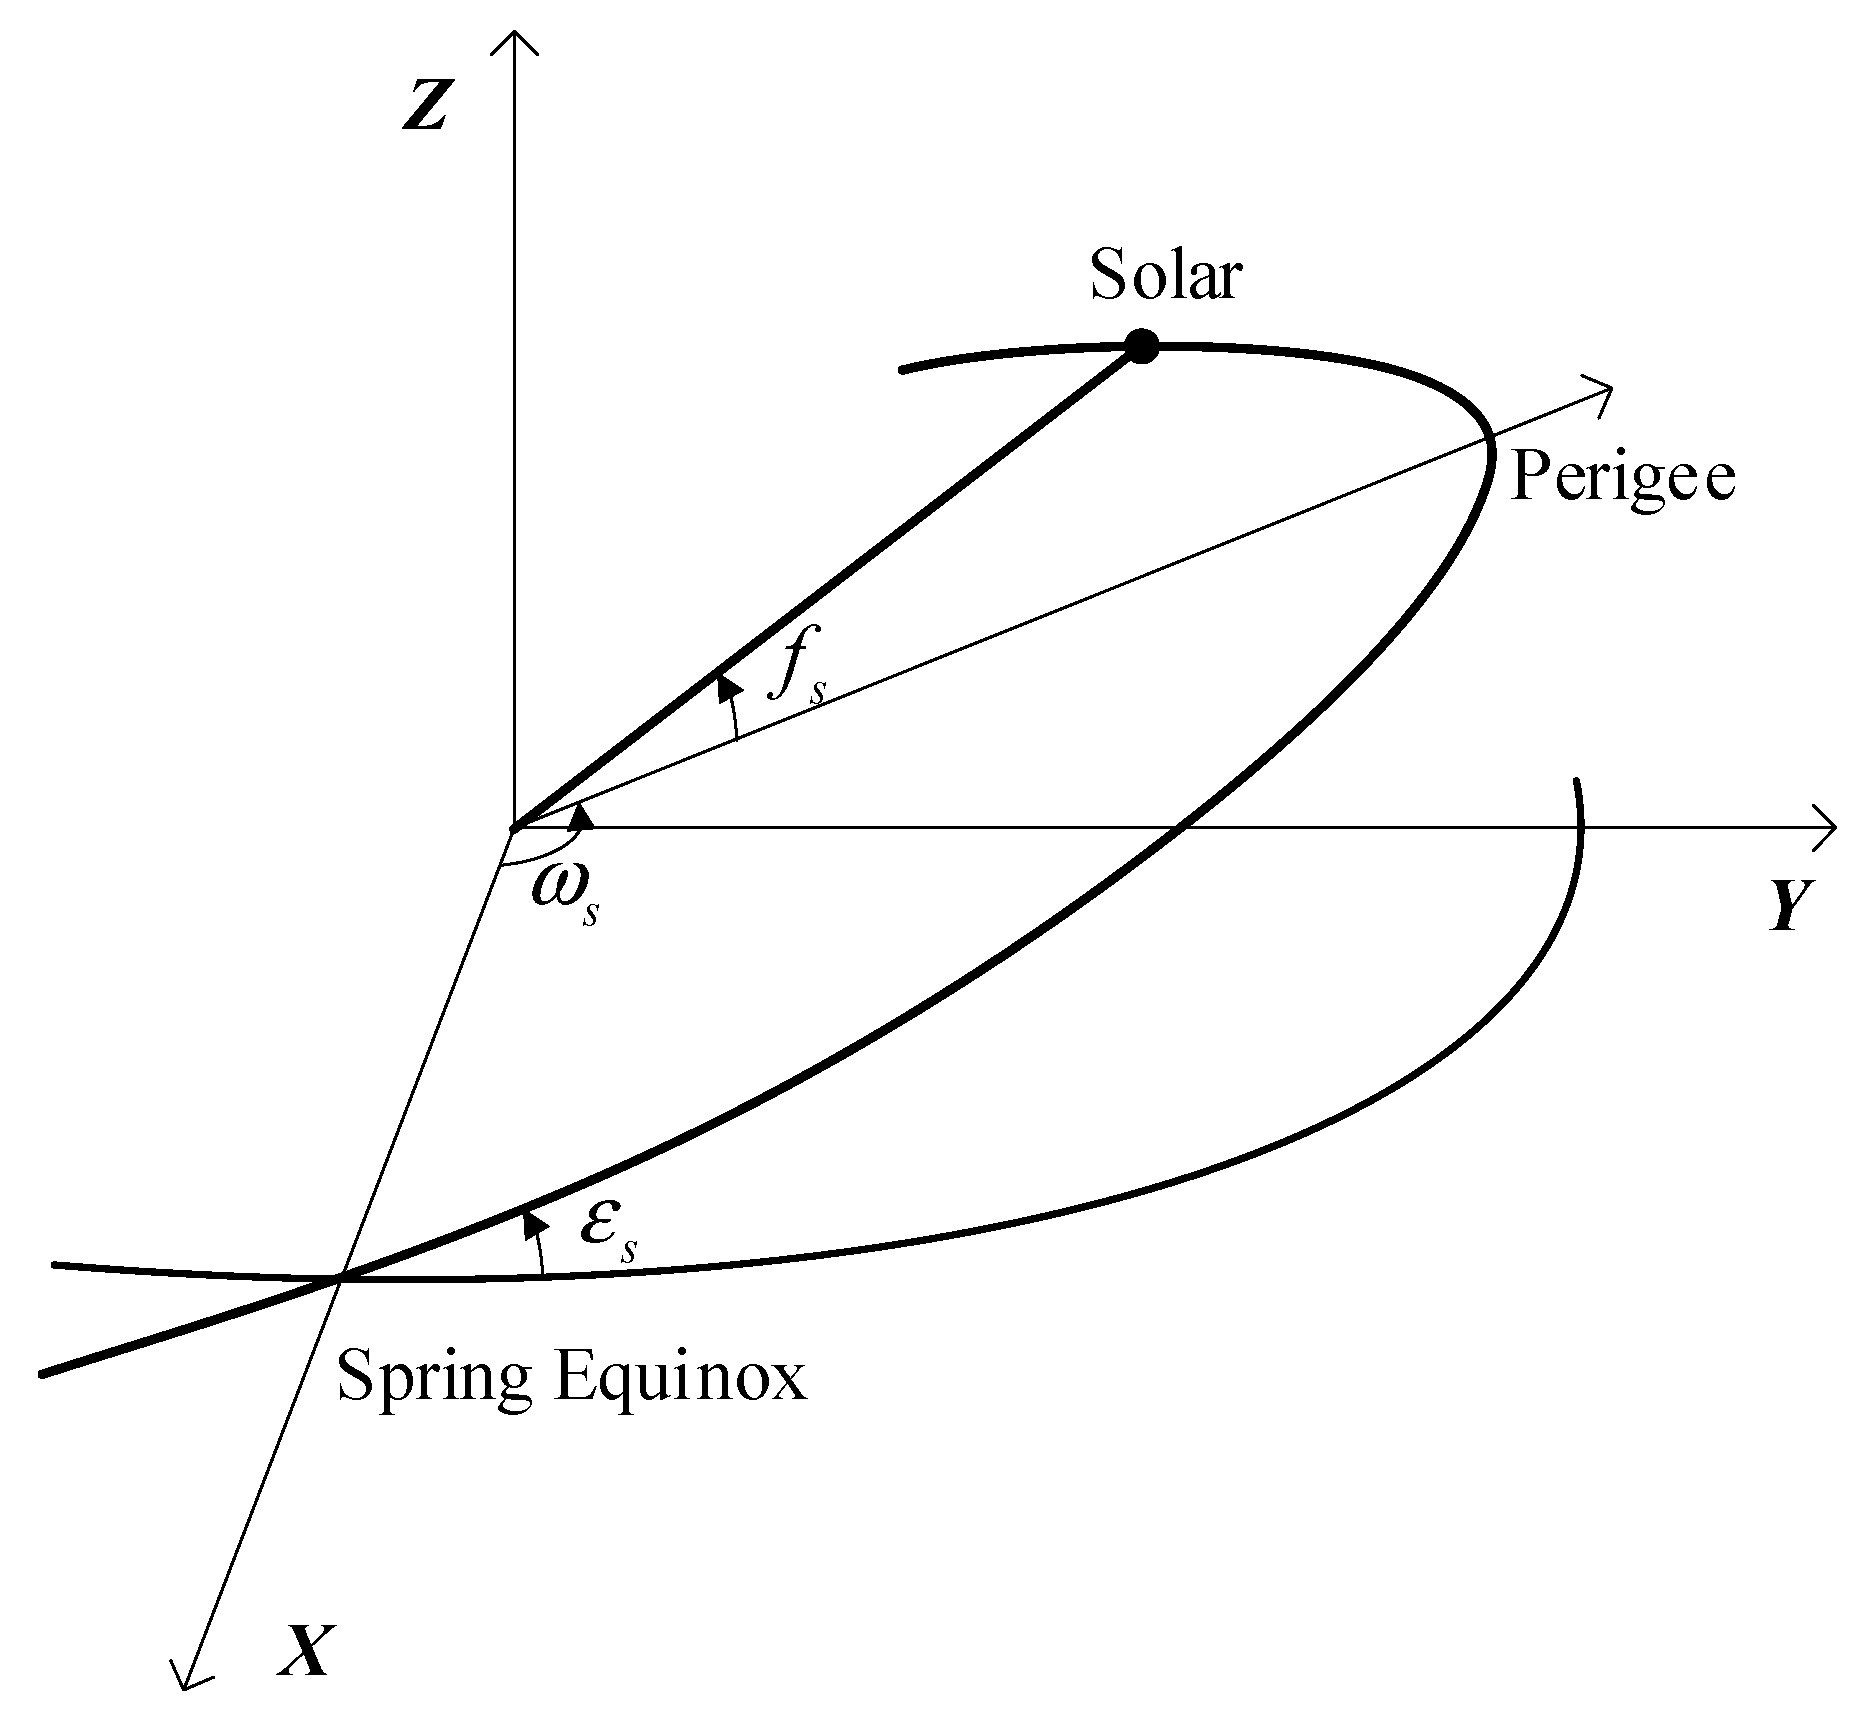
Figure 1. Kepler orbital parameters of the Sun in the celestial coordinate system with the Earth’s equator as the X-Y plane.
Energies 14 04454 g001
Figure 2. The instantaneous solar vector and the best pointing vector in the local spherical coordinate system.
Energies 14 04454 g002
Figure 3. A visual flowchart of the calculation used to describe the orbital motion of the Sun from the Earth’s local coordinate system. ECEI: Earth-centered ecliptic inertial; ECEF: Earth-centered, Earth-fixed; ECI: Earth-centered inertial.
Energies 14 04454 g003
Figure 4. Variation of the solar altitude angle on the first day of each month in 2019. The horizontal coordinates indicate the time of day in hours; the vertical coordinates indicate the solar collector tilt angle in degrees; the different curves indicate the first day of the different months. The location is 37° N and 122° E.
Energies 14 04454 g004
Figure 5. Variation of the solar azimuth angle on the first day of each month in 2019.
Energies 14 04454 g005
Figure 6. The optimal tilt and maximum elevation angles for 2019 vary with the month. The horizontal coordinates indicate the month, and the vertical coordinates indicate the elevation angle. The locations are 37° N and 122° E. The two lines indicate the optimal tilt angle (optimum) and the altitude angle at solar noon (maximum), respectively.
Energies 14 04454 g006
Figure 7. The variation of the solar altitude angle at the meridian of 37° E at the 2019 vernal equinox. The different curves indicate the daily variation of the Sun’s tilt angle with different latitudes. The horizontal coordinates indicate the time of day, the vertical coordinates indicate the solar tilt angle, and the legends indicate the different latitudes.
Energies 14 04454 g007
Figure 8. The variation of the solar azimuth angle at the meridian of 37° E at the 2019 vernal equinox.
Energies 14 04454 g008
Figure 9. The variation of the optimal orientation angle with latitude. The horizontal coordinates indicate different latitudes, and the vertical coordinates indicate the best tilt angle and the best azimuth angle, respectively.
Energies 14 04454 g009
Figure 10. The date is 20 February 2019. The horizontal coordinate indicates the solar tilt angle setting; the vertical coordinate indicates the measure of ri·r0 accumulated on that day (no units). The larger this value, the more direct radiation is accumulated at that solar tilt angle. The different colored curves indicate the variation brought by different latitudes from the equator to the Tropic of Cancer, separated by 5° N.
Energies 14 04454 g010
Table 1. The average value of the best inclination angle for each month in Weihai.
Month123456
Tilt Angle60.03°54.58°45.39°33.08°22.18°15.00°
Month789101112
Tilt Angle13.86°19.02°29.18°41.12°52.29°59.07°
Publisher’s Note: MDPI stays neutral with regard to jurisdictional claims in published maps and institutional affiliations.