Article

A Non-Intrusive Signal-Based Fault Diagnosis Method for Proton Exchange Membrane Water Electrolyzer Using Empirical Mode Decomposition

1
Laboratoire d’Energétique, d’Electronique et Procédés (LE2P)—Energy Lab, University of La Réunion, 15, Avenue René Cassin CS 92003, CEDEX 9, 97744 Saint-Denis, France
2
University of Grenoble Alpes, CNRS, Grenoble INP, LEPMI, 38000 Grenoble, France
3
University of Savoie Mont Blanc, LEPMI, 73000 Chambéry, France
*
Author to whom correspondence should be addressed.
Energies 2021, 14(15), 4458; https://doi.org/10.3390/en14154458
Submission received: 20 June 2021 / Revised: 15 July 2021 / Accepted: 19 July 2021 / Published: 23 July 2021
(This article belongs to the Special Issue Polymer Electrolyte Membrane Fuel Cells and Electrolyzers)

Abstract

:
This work focuses on a signal-based diagnosis approach dedicated to proton exchange membrane water electrolyzer (PEM WE) anode pump fault. The PEM WE cell measurements are performed with an experimental test bench to highlight the impact of water flow rate in the anode compartment. This approach is non-intrusive, and it can detect anode flow rate variation during the electrolysis and is designed to fulfill online diagnosis requirements. Contrary to electrochemical impedance spectroscopy-based approaches (EIS), this method stands out from existing procedures as a result of its few requirements, excluding any signal with perturbing amplitude. Therefore, the electrolyzer remains continuously available, even while the analysis is performed. The empirical mode decomposition (EMD) is used to decompose the signal variation into a sum of amplitude modulation and frequency modulation (AM-FM) components, called intrinsic mode functions (IMFs). In this work, the PEM WE current signal is decomposed into several IMFs using EMD. Then, the energetic contribution of each IMF is calculated. Experimental results exhibited that the energetic contribution of IMFs can be used as relevant criteria for fault diagnosis in PEM WE systems. This process only requires monitoring of the PEM WE current and has a low computational cost, which is a significant economic and technical advantage.

1. Introduction

At the end of the 21st century, hydrogen will attain approximately 50% of the part of H2 in the energy mix because of the development of efficient end-use technologies. In other words, hydrogen could be a significant final carrier energy [1]. According to recent trends and innovations [2], only water and electricity are necessary to produce hydrogen, which result from renewable energy sources such as wind and solar [3]. The proton exchange membrane water electrolyzer (PEM WE) has many advantages for hydrogen production: high working current density, high electrolysis efficiency, compact structure for small-scale hydrogen production equipment, etc. [4]. During water electrolysis operation of PEM WE, the oxygen bubbles are removed from the anode compartment thanks to the water flow [5]. According to the literature, the water circulation at the anode side is a critical parameter to assure the efficiency of the PEM WE. At high current density, the two-phase flow regime affects the mass transport water for the anode reaction and impacts directly the electrochemical performance [6]. Moreover, in situ visualization [7,8] is a powerful tool of diagnosis for the understanding of two-phase flow impact at the anode reaction. Our previous work [9] based on the numerical simulation suggests that anode flow rate is an important parameter that can be optimized to ensure effective performance and control of the two-phase flow regime impact. The accumulation of oxygen induces a critical two-phase flow regime which affects the electrochemical performance, the mass transfer, and the efficiency of the global system. Considering the complexity of the multiphysics phenomena involved in PEM WE, it is essential to have efficient supervision solutions able to provide accurate analysis and state of health diagnosis. Recent literature provides very few publications dealing with the diagnosis of electrolyzers, while numerous studies have been conducted for fuel cell systems [10]. Lebbal et al. [11] suggest identification and monitoring strategies applied to a PEM WE based on dynamic modelling. These model-based diagnosis strategies can detect and isolate faults on actuators, sensors, and electrolyzer systems and rely on the measurement of temperature, current and voltage of the system. The estimation of the model parameters is achieved using parametric optimization from experimental data. The results illustrate that the model-based signal can avoid several critical and hazardous operating conditions, such as the membrane hot point, membrane tears, membrane drying, or electrode destruction. Olivier et al. [12] exhibited a PEM WE model including all components, stacks and balance of plant; this model is based on bond graph methods. However, the authors have discussed the option to use this kind of model for diagnosis and control purposes, but no additional information nor justification is displayed. A state of the art highlighted that those diagnosis methods applied to PEM WE systems need to be extended, and it is urgent to develop innovative approaches for this purpose. In this work, a non-intrusive signal-based diagnosis approach is developed to detect PEM WE anode pump faults. Within the framework of fault diagnosis strategy, empirical mode decomposition (EMD) is a powerful tool to analyze non-stationary signals [13]. As mentioned in the review proposed by Lei et al. [14], The EMD approach is commonly employed in the diagnosis of rotating machinery. Cheng et al. [15] proposed a diagnostic method based on the energy operator demodulation approach, using the EMD to extract the feature of the AM-FM signal. The main objective of this study is to diagnose the mechanical fault of rotating machinery. Similar work has been reported based on the diagnosis of rotating machinery using the EMD approach [16,17]. EMD has several advantages compared to other common diagnosis approaches such as EIS-based, fast Fourrier transform (FFT), short time Fourier transform (STFT) or even wavelet transform (WT) approaches. Indeed, valid EIS measurements require linearity, causality, stability and finiteness [18]. FFT has poor performance on transitory signals [10]. For non-stationary signals, STFT is efficient, provided that the signals have uniform energy distribution within an analyzing window [19]. Concerning WT, reliability strongly depends on the selection of mother wavelets [20]. In contrast, EMD is intrinsically adaptive. Unlike other common diagnosis techniques, such as EIS-based approaches [21], its uniqueness resides in the fact that it does not need any signal with perturbing amplitude. No predetermined ensemble of functions is needed because it extracts the essential functions from the original signal itself. In addition, the EMD process has a low computational cost [22,23]. The proposed diagnosis approach can be performed online without disturbing the system. Thus, the electrolyzer remains continuously available, even while performing the diagnosis. Besides, the proposed diagnosis approach does not require additional sensors since it only relies on the PEM WE current, which is already monitored.

2. Methodology

2.1. Experimental Setup

2.1.1. Electrolyzer Cell

The experiments were carried out on a single cell PEM WE manufactured by CETH2 (Villebon-sur-Yvette, France). The membrane electrodes assembly (MEA) is supplied by the Fuel CellStore company (College Station, Texas, USA) and has an active area of 28 cm2. The MEA assembly consists of a Nafion® 115 membrane and two electrodes composed of iridium ruthenium oxide at a powder loading of 3 mg.cm−2 at the anode side and composed of platinum black at a powder loading of 3 mg.cm−2 at the cathode side. The MEA is sandwiched between two liquid/gas diffusion layers (LGDLs). The MEA (28 cm2 of active area) and the LGDLs (thickness ca. 1.68 mm) are positioned between the anode and the cathode grill mesh (thickness ca. 1.02 mm). The cell operated at 25 °C with a pressure of 1 bar at the anode side and 2 bar at the cathode side (absolute pressure). The cell specification and the nominal operating conditions are gathered in Table 1. The Italian company, Materials Mates (Rho, Italy) has manufactured the setup of the experimental test station (ETB system, Figure S1 in Supplementary Materials). It is noteworthy that a part of the literature focuses on the optimization of the membrane and the research of a new component polymer [24,25,26].
To obtain optimal cell performance and to minimize the ohmic resistance, the membrane electrodes assembly is activated ex situ and subsequently, in situ. The ex situ activation consists of the MEA’s immersion in deionized water at 60 °C (ca. 18 h), followed by immersion in fresh deionized water (ca. 3 h) at room temperature. The in situ activation involves the MEA conditioning in the cell at a constant current of 1 A·cm−2 through 18 h. To ensure accurate performance and to prevent potential damage, a nominal flow rate at the anode and the cathode sides is set and the stabilization anodic and cathodic pressures are observed after setting. Therefore, the cell reaches a higher heating value (HHV) efficiency of 67% at room temperature (20 °C) and atmospheric pressure.

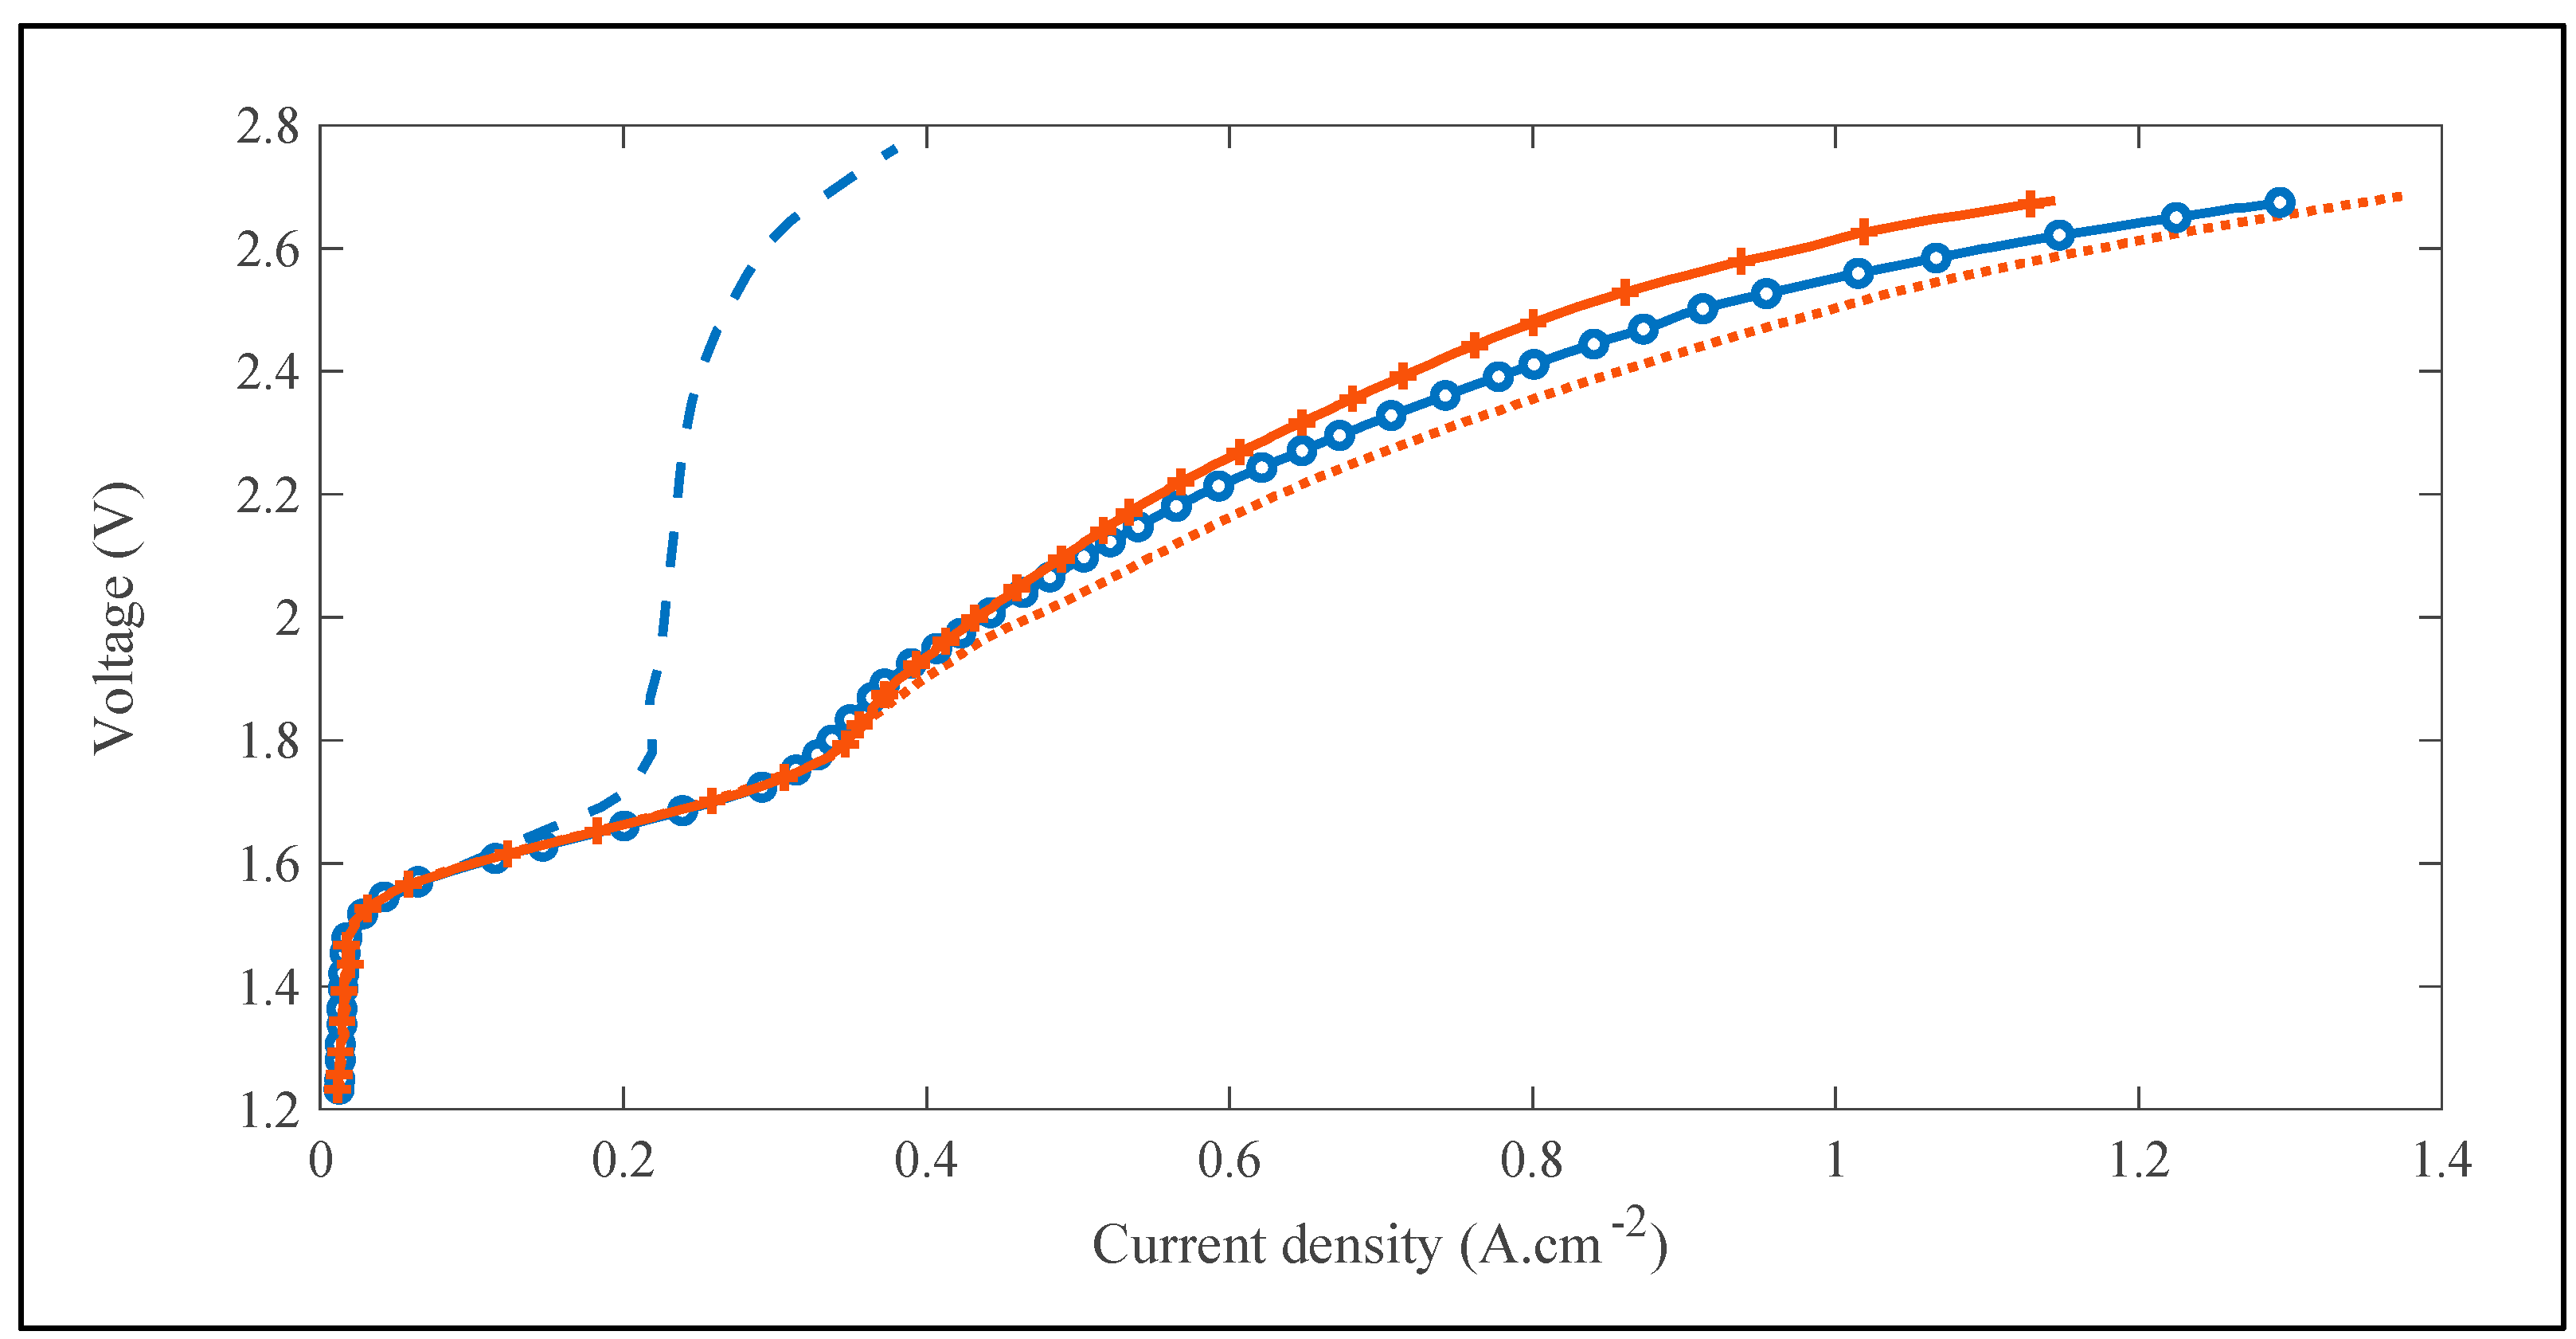
2.1.2. Polarization Curves

Figure 1 shows that a decrease in the anode flow rate (0.15 L·min−1 to 0.03 L·min−1) improves the electrochemical performance of the PEM WE. Similar results are also reported in the works of Ito et al. [6]. However, with a very low anode flow rate (Qa = 0.01 L·min−1), a decrease in the electrochemical performance of the PEM WE is observed. This behavior is due to the weak removal of bubble gas in the anode side. As shown in Figure 1, appropriate management of the anode flow rate is required to ensure the stability and efficiency of the PEM WE at the high current density. To ensure the removal of oxygen bubbles at the electrode in the anode current collector [8], the water flow rate was fitted using a ratio of anode inlet water flow rate to the amount of water required to the anode electrolysis (proportional to operating current density) [6]. Therefore, the supply of pure water to the anode is critical to the state of health of the PEM WE.

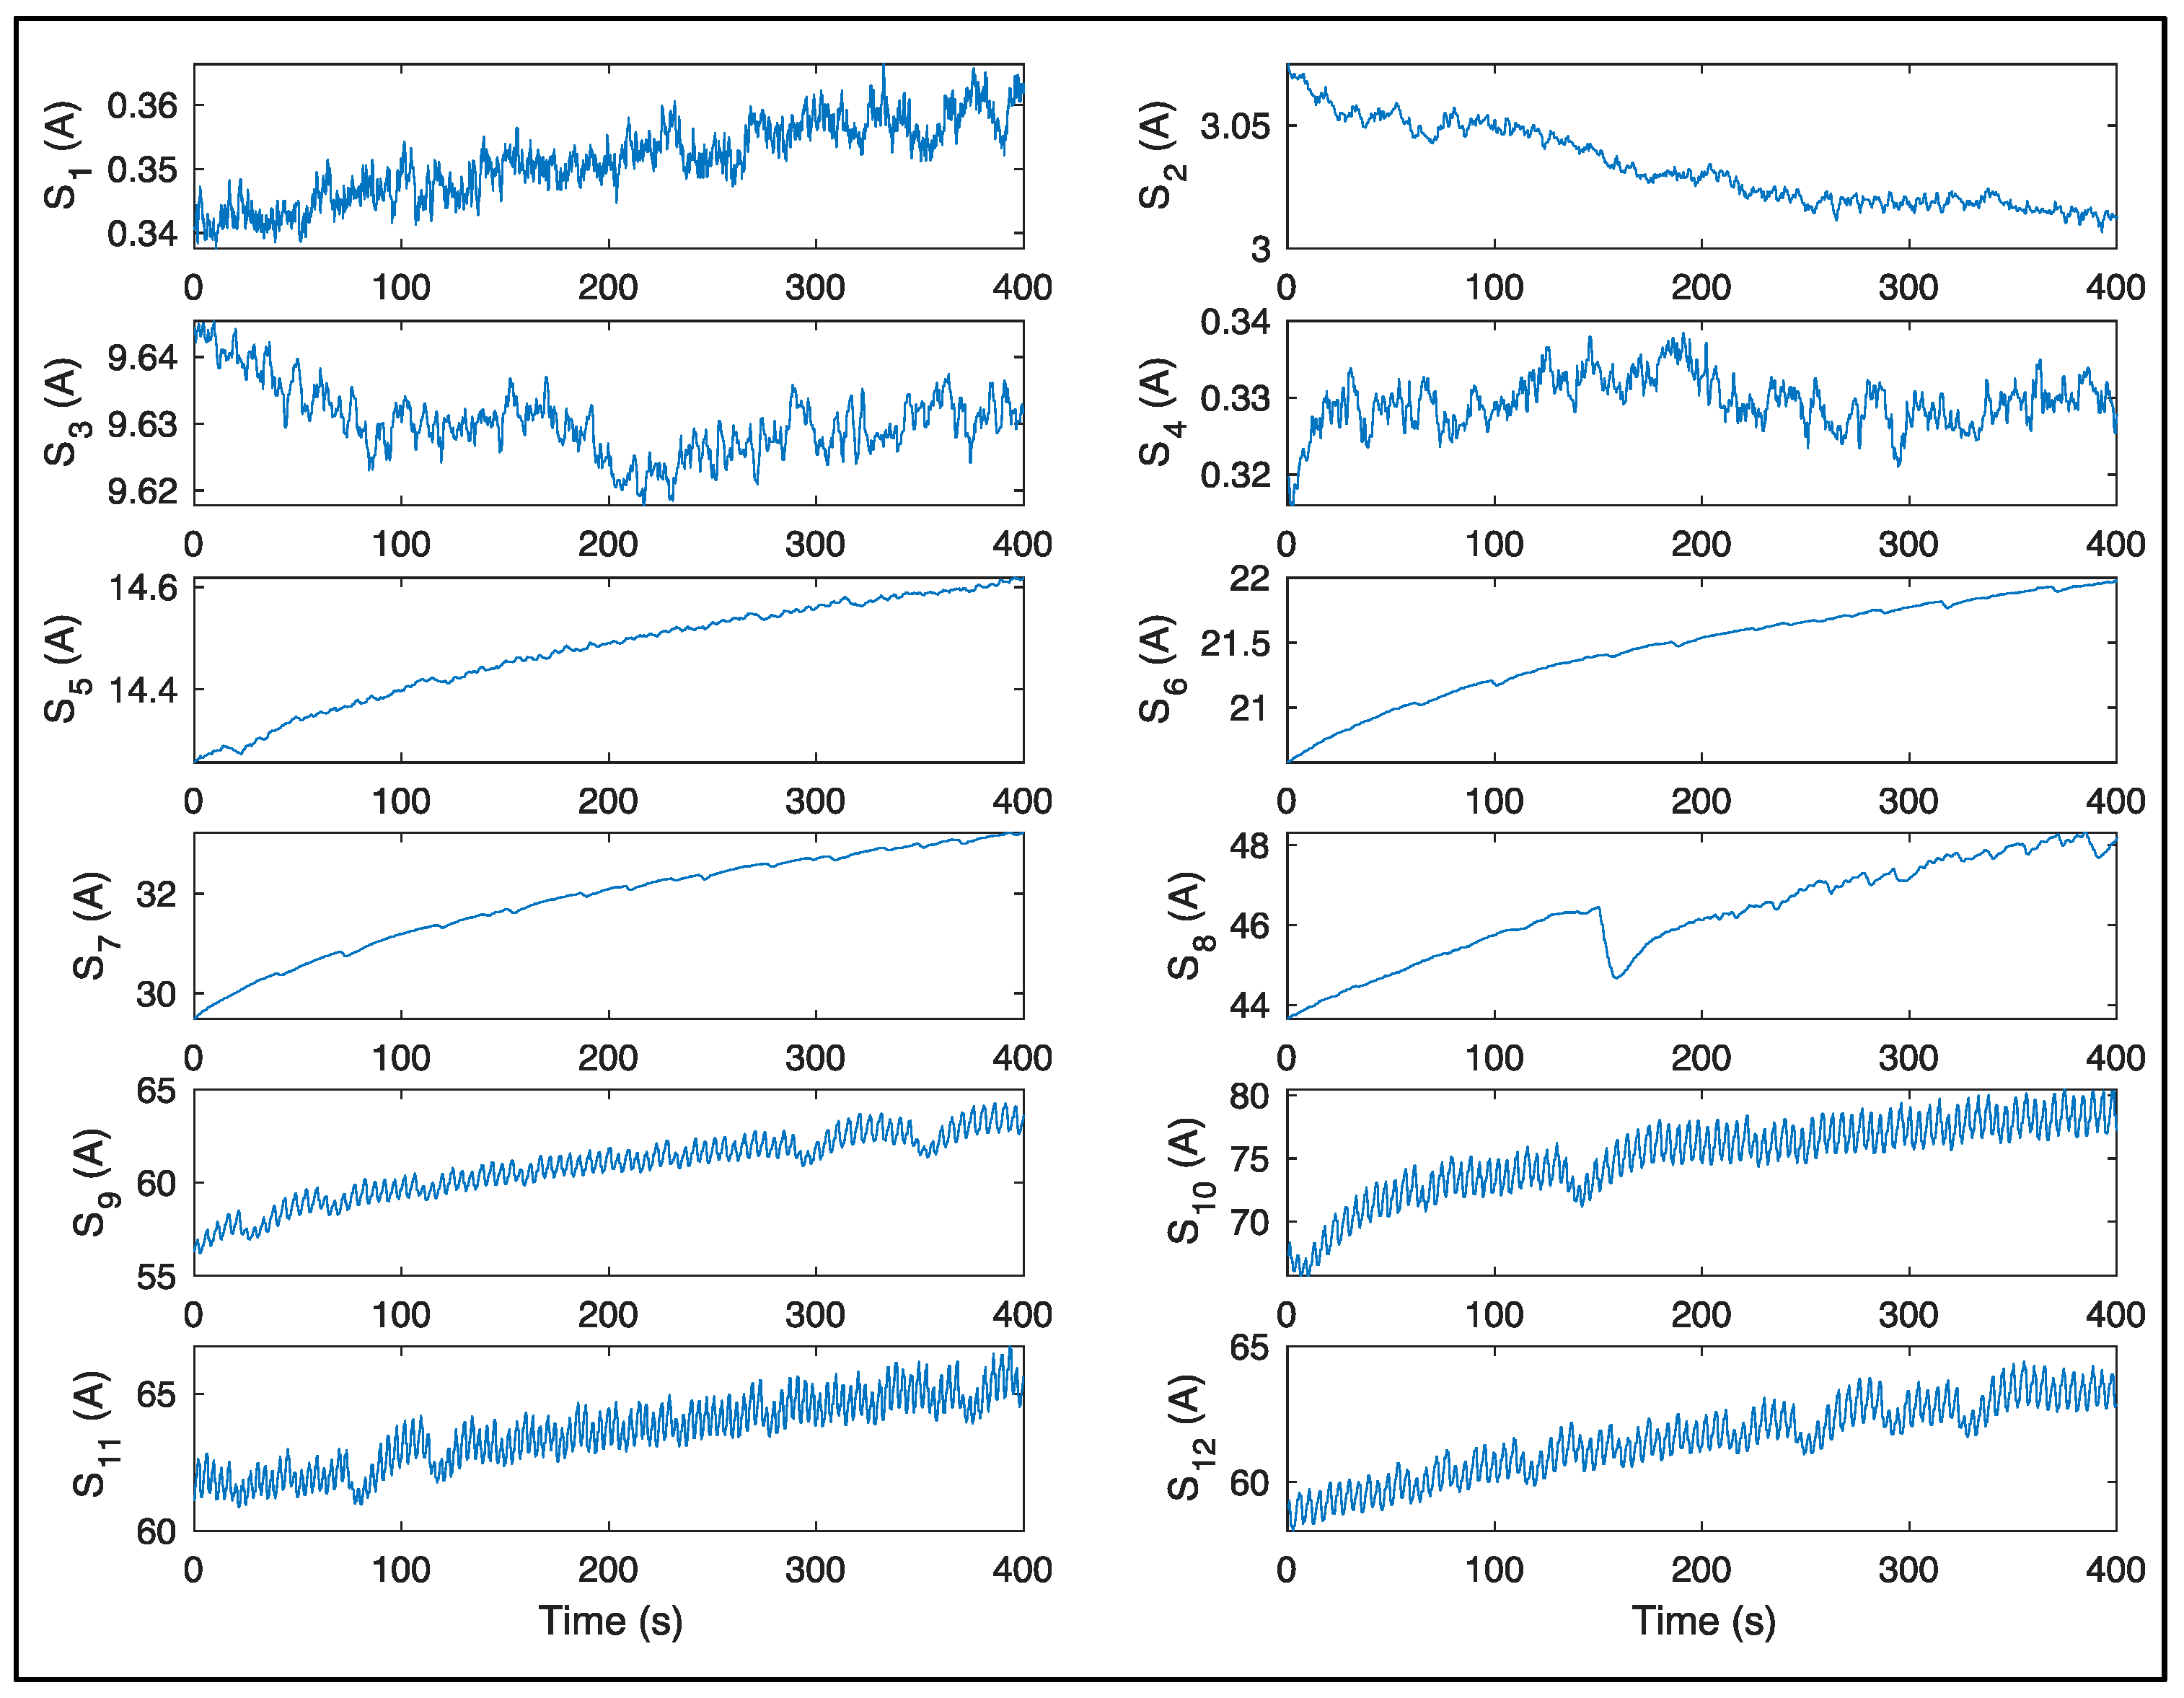
2.1.3. Chronoamperometry

Figure 2 exhibits the electrolyzer output current evolution for different values of water flow rate and applied voltage. The other monitored variables in this analysis are the cell voltage and the anode flow rate; the measurement is achieved with a time widows of 400 s (Table 2). The flow rate was chosen (ca. 0.15 L·min−1) to ensure nominal operating conditions (i.e., without fault). Formerly, to induce anode pump fault, experiments were carried out at high current density at a constant potential (2.7 V). Unambiguously, the effect of the anode flow rate on the occurrence of a pump fault was investigated using four different flow rates (0.03, 0.05, 0.07, 0.15 L·min−1). In the following, cases 1–9 represent proper operating conditions, whereas cases 10–12 are faulty operation conditions.

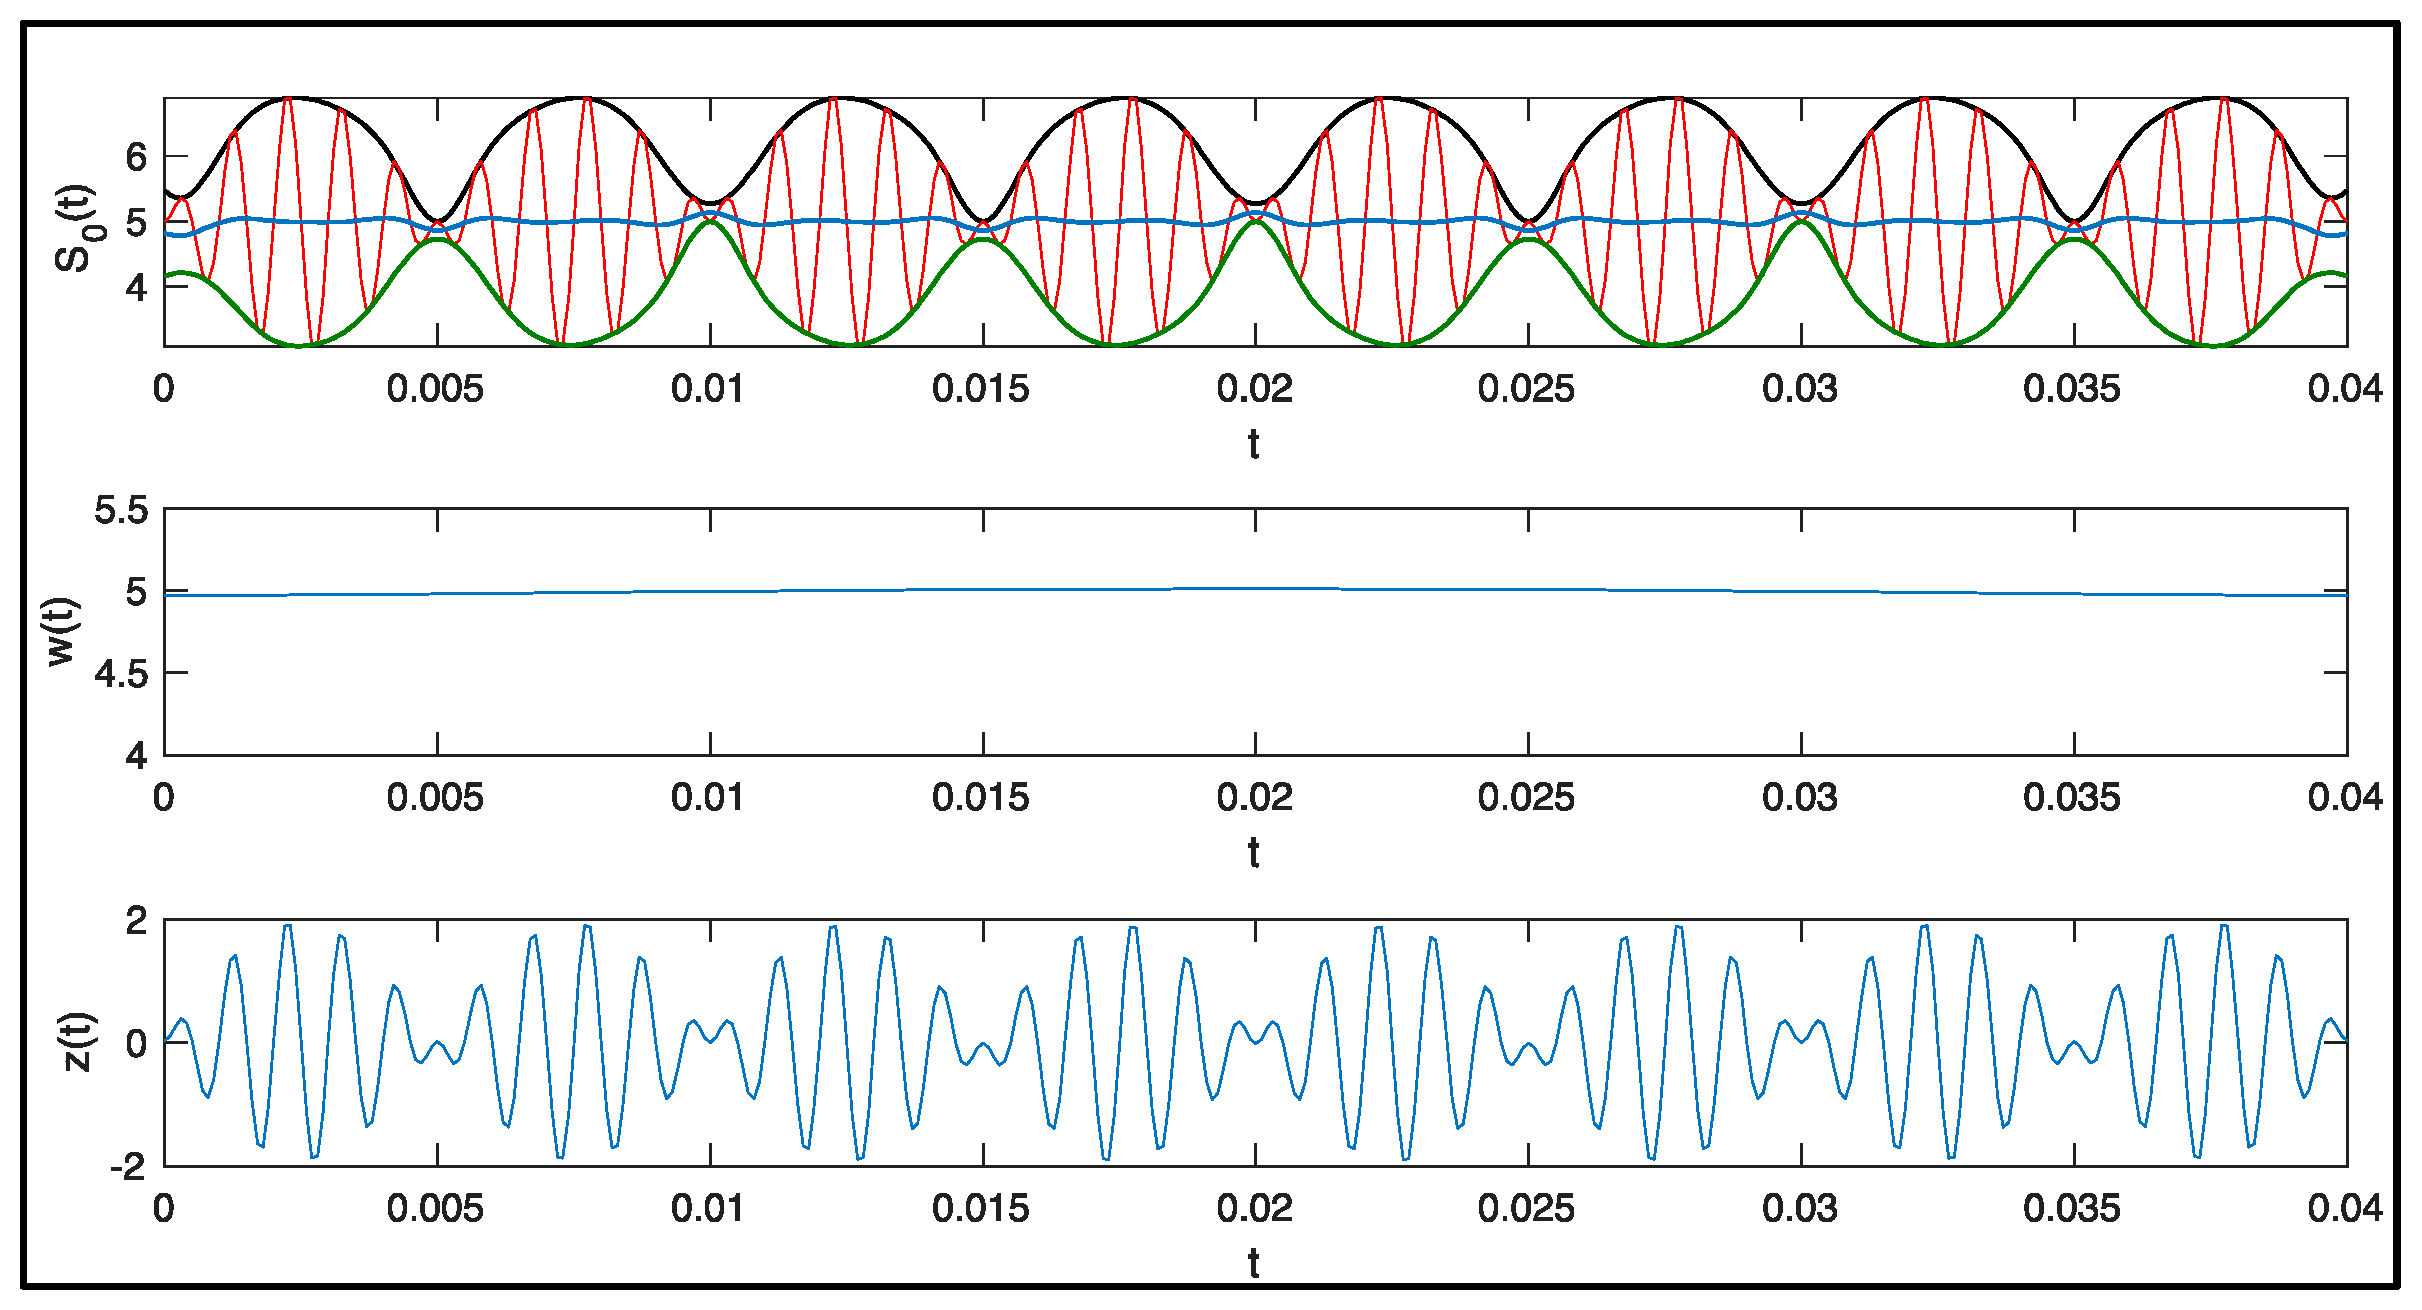
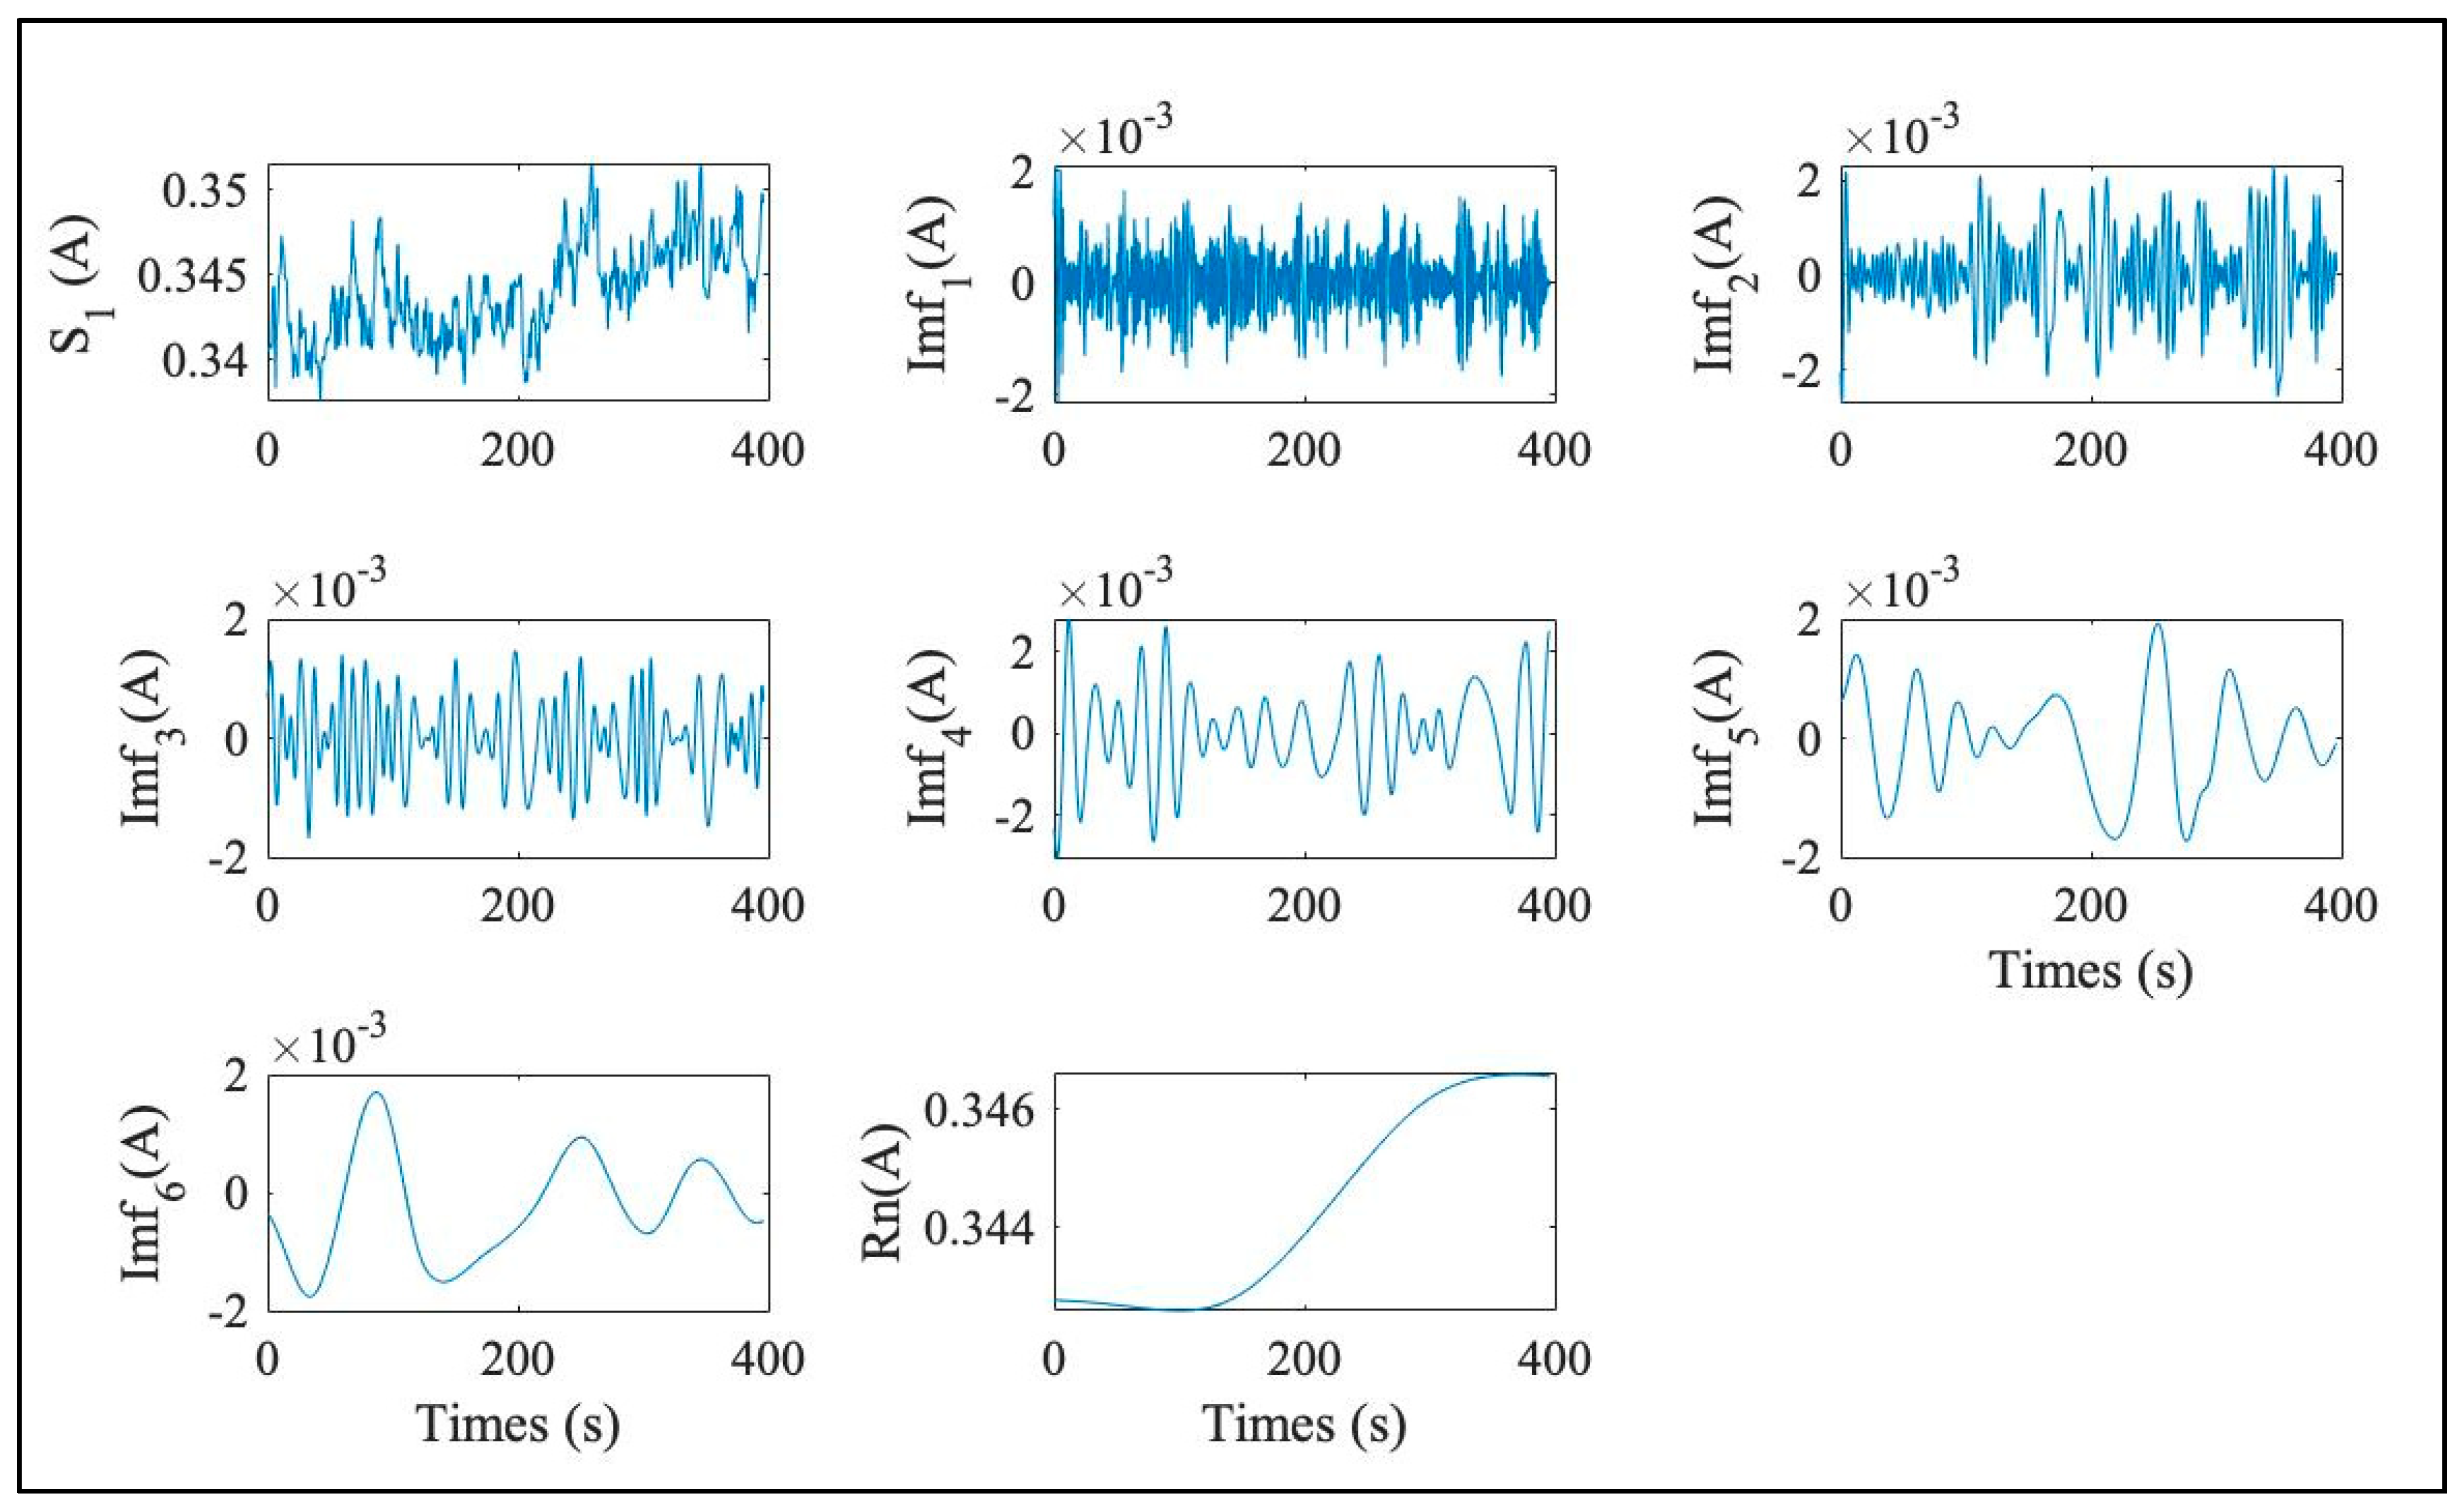
2.2. Signal Decomposition using EMD

Hang et al. [13] suggested that empirical mode decomposition relies on a sifting process. According to these authors, a signal can be decomposed into different modes of oscillations named the intrinsic mode functions (IMFs) that are mono-component signals. Based on the natural variation of the signal, the EMD permits the obtaining of a physical interpretation of the signal. In particular, for the electrochemical system, the natural variation of the current could permit us to understand the physical phenomena existing in the membrane electrode assembly and the channel such as the mass transfer, the electro-chemical reaction, and the two-phase flow regime at the anode side. In addition to being adapted to the non-stationary signal, the EMD approach is a simple, fast, and non-intrusive method with a low calculation cost. The EMD has no basic mathematical development and is defined by a simple algorithm.
The EMD is based on adaptive decomposition, which considers a signal as a sum of a quick fluctuation’s contribution and a trend contribution. To illustrate this decomposition, let us consider a simple signal S0(t) defined by:
s 0 ( t ) = 5 + 2 s i n   ( 2 π 100 t )   s i n ( 2 π 1000 t )
S0(t) can be decomposed into two contributions:
s 0 ( t ) = z ( t ) + w ( t )
where z(t) represents the quick fluctuations contribution and w(t) the trend contribution. w(t) represents the trend of the signal.
The decomposition process illustrated in Figure 3 is called geometrical decomposition, and allows the signal to be reconstructed by the sum of the two curves (z(t) and w(t)) point by point.
As mentioned previously, the original signal is decomposed into a sum of amplitude modulation and frequency modulation (AM-FM) mono-components. EMD considers oscillations at a local level and relies on the sum of a specified number of high and low-frequency distributions called intrinsic mode functions (IMFs). IMFs work as the basis functions and constitute the natural oscillatory mode embedded in the signal. Consequently, EMD is a self-adaptive method.
As stated by Huang et al. [13], an IMF must satisfy the two conditions below:
  • For a subset, the number of extrema and the number of zero-crossings must either be equal or differ at most by one.
  • At any point, the local average of the envelope defined by the local maxima and the envelope defined by the local minima is close to zero.
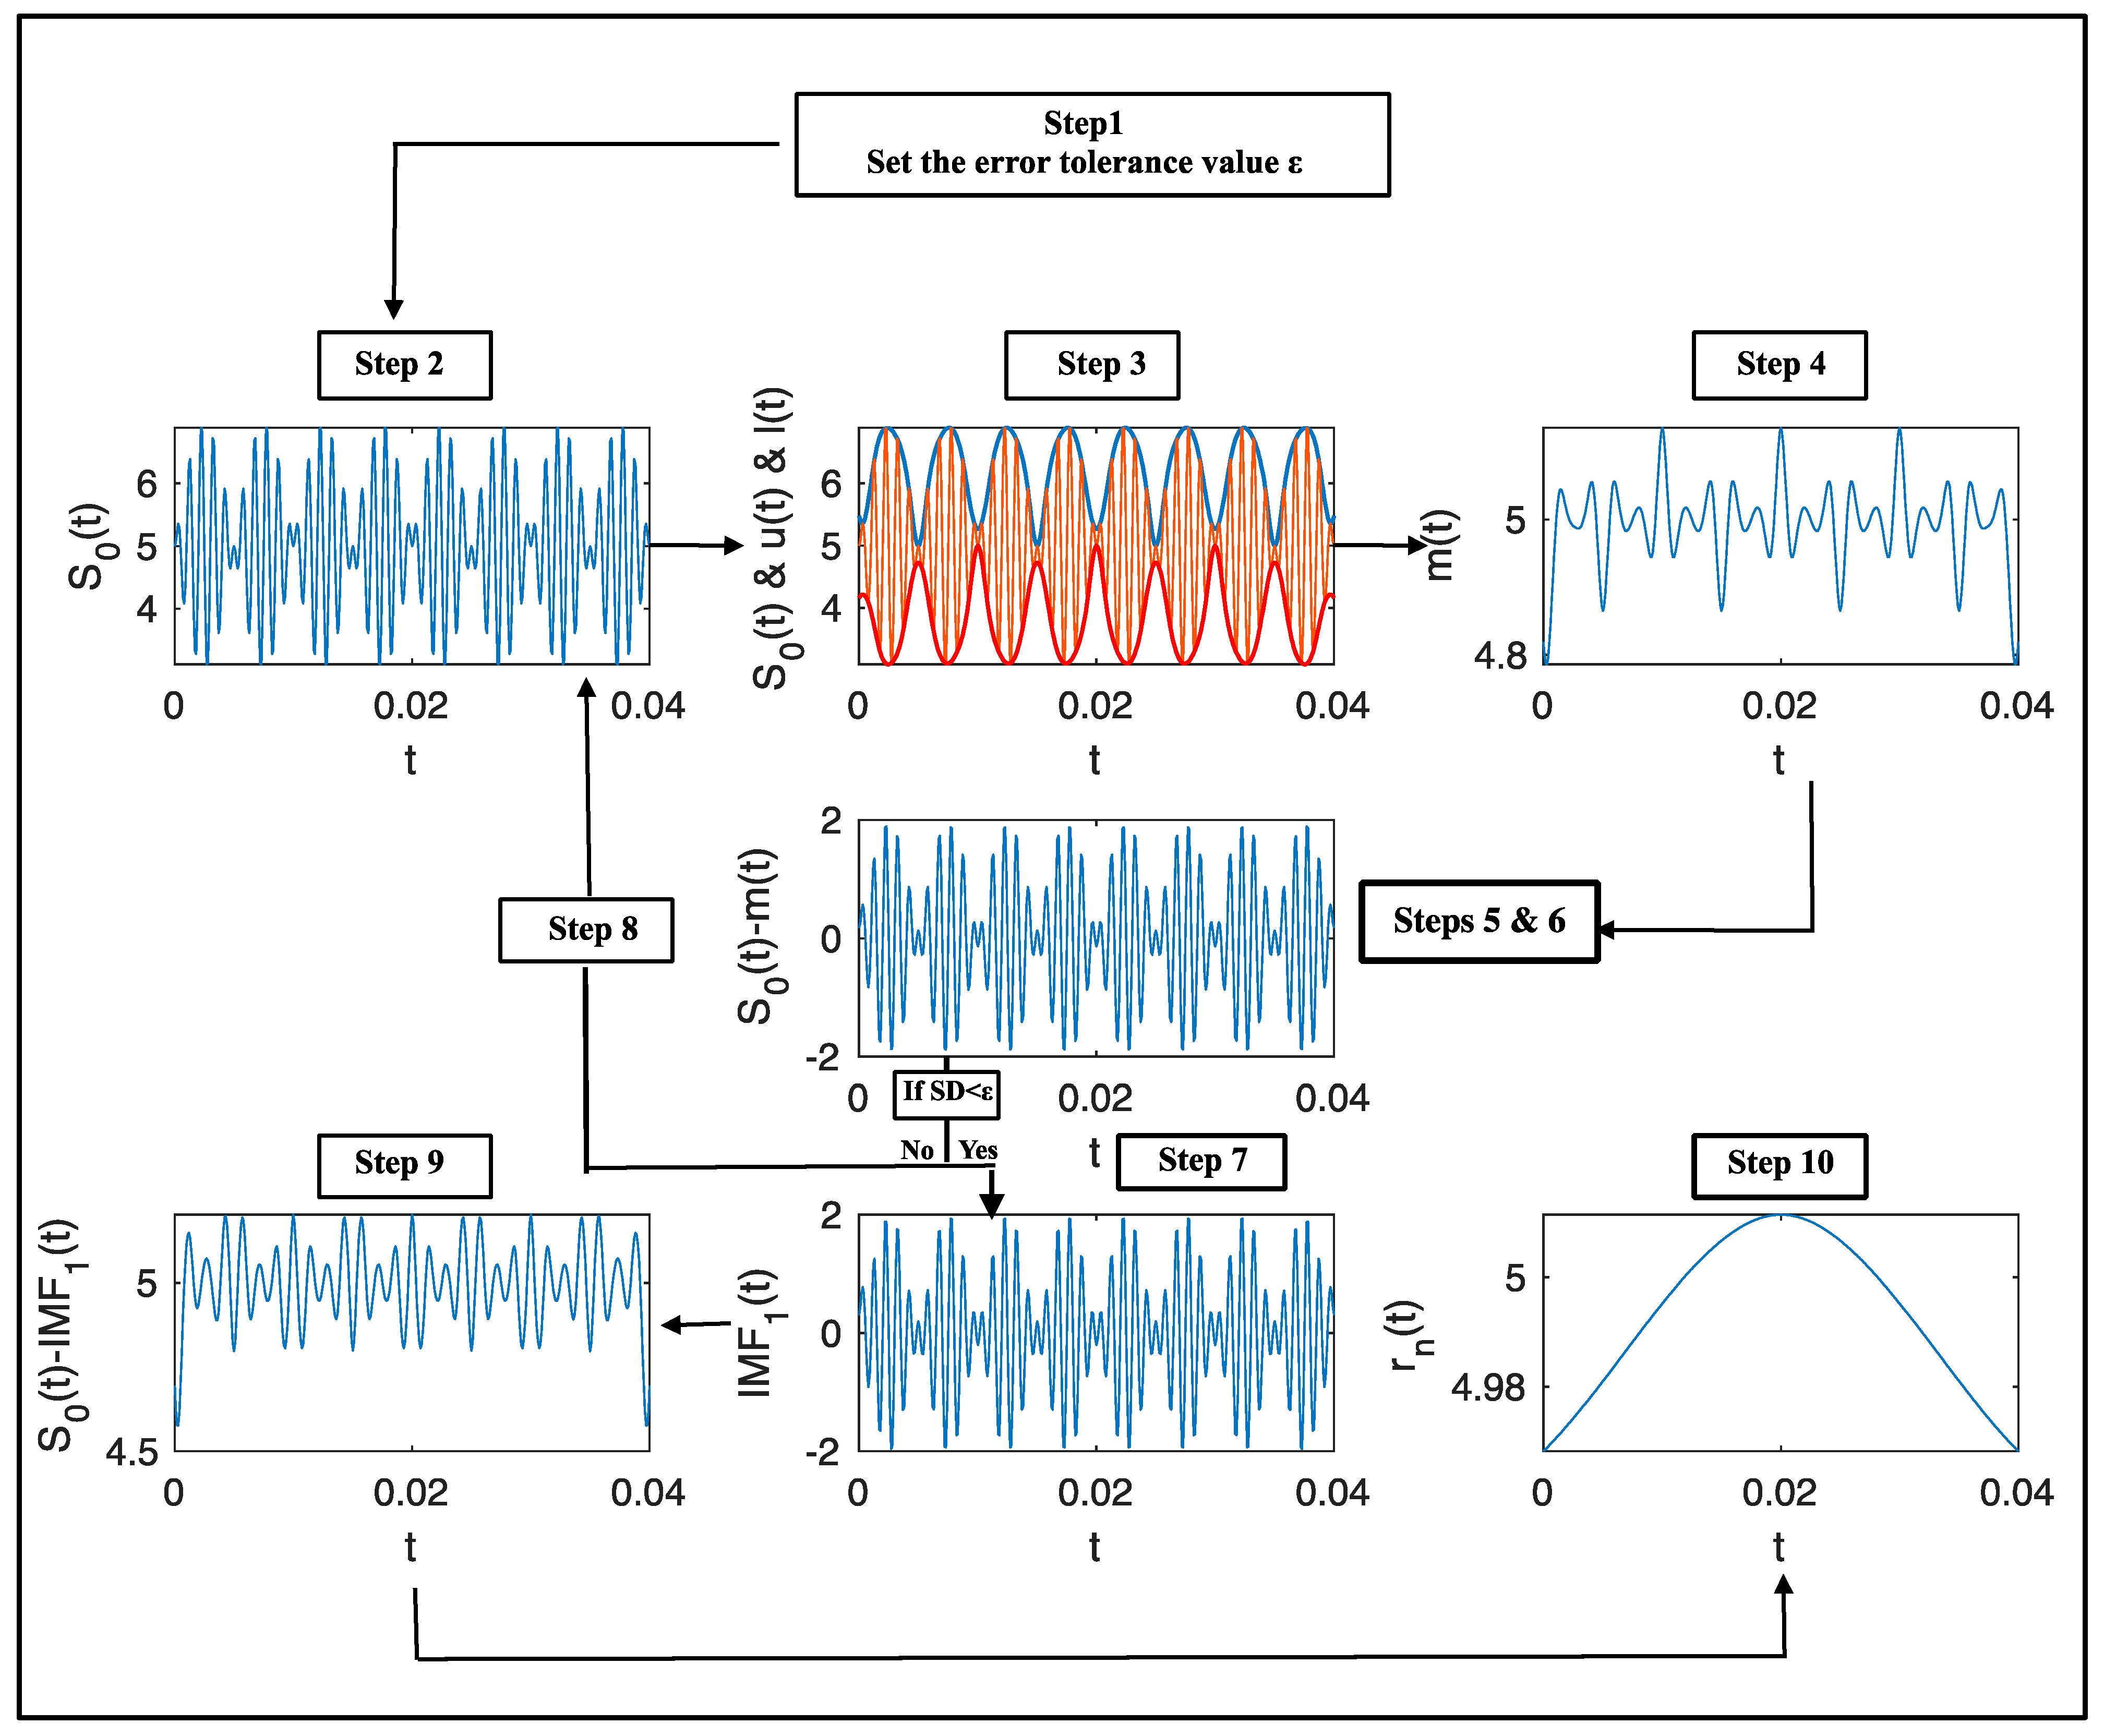
The latter technique is iterated n times in order to obtain n IMFs.
The original signal can then be decomposed into n intrinsic mode functions and a residue r n ( t ) that represents the mean trend of the signal:
x ( t ) = i = 1 n i m f i ( t ) + r n ( t )
IMFs are obtained using a so-called sifting process.
The different steps of the sifting process are defined using the following algorithm (Figure 4):
  • Set the-tolerance value ε ().
  • Identify all extrema of x(t) (peaks and troughs).
  • Calculate of the upper and the lower envelopes of x(t) to generate u(t) and l(t).
  • Calculate the mean signal m(t), average of u(t) and l(t):
    m ( t ) =   u ( t ) + l ( t ) 2
  • Subtract m(t) from x(t) to obtain the detail h1(t) = s(t) − m(t):
    h 1 ( t ) = s ( t ) m ( t )
  • Calculate the standard deviation SD:
    S D ( i ) = t = 0 T | h 1 , i 1 ( t ) h 1 , ( i 1 ) ( t ) | 2 h 1 , ( i 1 ) ( t ) 2
  • If h1(t) verifies IMF conditions SD < ε , assignment of h1(t) as the first component of s(t), imf1(t).
  • If not, h1(t) is treated as the original signal, i.e., steps (2)–(7) are iterated k times until the first IMF is obtained, and assignment of the component h1k(t) − h1(k−1)(t) − m1k(t) as the first IMF, imf1(t).
  • Remove the imf1(t) from the original signal to get the first residue r1(t) = s(t) − imf1(t).
  • Use the residue r1(t) as an original signal and iterate the steps (2) to (8) to obtain the others IMFs.
The decomposition process is ended when rn(t) becomes a monotonic function and no more IMF are produced (number of extrema of the signal becomes lower than 2). It is important to notice that the decomposition is entirely data-driven, which implies that the number of IMFs depends on the number of frequency contributions contained in the original signal.
The empirical mode decomposition of experimental data (Figure 2) is achieved on a sliding window of 400 s with a sampling rate of 3 Hz. Using the EMD, six intrinsic mode functions and the residue are obtained from the output cell current (Figure 5 and Figures S2–S12 show the IMFs obtained by the EMD). Figure 5 shows the six IMFs and the residue for case 1 (presented in Table 1 and Figure 2). Note that the decomposition for all cases are presented in Supplementary Materials).
Based on these IMFs, various analysis methods are employed to obtain fault diagnosis criteria. Damour et al. [20] proposed to use the energetic contribution of each IMF to determine the state of health of a proton exchange membrane fuel cell. This methodology using calculation of the energy contributions of the different IMFs is commonly used to extract features [14,17]. In this work, the energy of the different IMFs was used to diagnose the state of health of the electrolyzer.

3. Results and Discussion

The signal-based diagnosis method is implemented in Matlab® environment. The EMD of the cell current is obtained on a sliding window of 400 s with a sampling rate of 3 Hz and with the tolerance value ε set to 0.3.
Regarding diagnosis purposes, the energy of the IMFs is commonly used to determine which IMFs contain the most information on the considered faults. The main objective is to relate the variation of the energy of these specific IMFs to the state of health of the system [9].
The energy of each IMF is computed as follows:
E i = + U c e l l I c e l l | i m f i ( t ) | 2 d t
where Ei is the energy of the ith IMF, I c e l l is the average current at voltage U c e l l in Table 2.
A comparison of the energy of each IMF is highlighted in Figure 6. As Equation (7) shows, a continuous component ( U c e l l I c e l l ) is associated with the IMF to normalize energy level Ei. In addition, concerning abscission, the logarithmic scale is chosen to take into account the different energy levels Ei.
In this study, as presented in Section 2, cases 1–9 represent proper operating conditions, whereas cases 10–12 are faulty operation conditions.
The comparison of the entropy energy value (Figure 6) of each IMF demonstrates that the energy value of IMF 5 is significantly correlated to the state of health of the electrolyzer. Indeed, IMF 5 shows a close energy value for the cases 10–12 with a gap between the energy value associated to healthy cases (cases 1–9). More broadly, it seems that the energy of IMF 5 is sensitive to the operating conditions of the system.
Indeed, cases 1 and 4 (operating conditions related to low current values and voltage below 1.5 V) have a high energy values. This could be explained by the large control of water electrolysis by the overvoltage, i.e., electrochemically irreversible process. In usual operating mode (cases 7–9), the values of energy remain high but lower than the energy values of case 1 and 4.
Cases 10–12 highlight high operating voltage (2.7 V) with a low range of flow rate (0.05–0.03 L·min−1). As expected, most of the losses are driven by mass transport phenomena at the anode of the system, i.e., decrease of the anodic active surface area of the MEA. According to Ito et al. [6], the decrease of the anode flow rate (0.15 L·min−1 to 0.03 L·min−1) improves the electrochemical performance (Figure 1), and this phenomenon could be correlated to the decreasing values of IMF 5 energy for cases 10–12. In addition, according to Immerz et al. [27] the flow rate variation affects the thermal behavior of PEM WE. At low flow rate the temperature increases and the performances improve but the durability of the cell is impacted. This phenomenon (heat balance) has a characteristic time close to 1 min; thus, for this reason IMFs 5 and 6 corresponding to low frequency behavior highlighted the pump flow fault.
Therefore, EMD energy is very sensitive to anodic flow rate and could be employed as a diagnostic tool for pump default to avoid drastic efficiency decrease of water splitting or damage of electrolysis cell. It is very attractive to operate water electrolysis in the PEM system with low anodic flow rate, as reported in Figure 1. However, at low flow rate the changing efficiency of water electrolysis could appear very quickly and damage the cell to operate at low flow rate, which requires the presence of a robust control system. EMD strategy does not need consuming time computing, and it is a strong candidate for fault diagnosis.

4. Conclusions

In this work, a non-intrusive signal-based fault diagnosis technique has been designed and validated to identify the state of the health of a PEM WE. Based on empirical mode decomposition (EMD), the proposed approach can be performed online using only the PEM WE output current and without disturbing the system. Thus, the electrolyzer remains continuously available, even while performing the diagnosis. This method stands out from existing procedures by its few requirements, excluding any excitation signal or stabilization period. Indeed, the decomposition is entirely data-driven. Moreover, it lowers the computational costs, which fits industrial needs. Various kinds of current signals are recorded from a PEM WE cell in different operating conditions, such as the voltage and the anodic flow rate. The empirical mode decomposition has been applied for each dynamic signal and has permitted the obtaining of intrinsic mode functions (IMFs). The energy of each IMF has been calculated and it turned out that the variation of the energy of IMF 5 highlights a specific signature for the abnormal operating conditions. Indeed, the energy value of IMF 5 appears to be an excellent candidate to perform an online fault diagnosis. The proposed fault diagnosis approach is also robust since the feature extraction can be performed in the presence of non-linear and non-stationary data.

Supplementary Materials

The following are available online at https://www.mdpi.com/article/10.3390/en14154458/s1, Figure S1: ETB system control, Figure S2: Imf decomposition for a tension of 1.6 V and an anode flow rate of 0.15 L·min−1 (case 2), Figure S3: Imf decomposition for a tension of 1.8 V and an anode flow rate of 0.15 L·min−1 (case 3), Figure S4: Imf decomposition for a tension of 1.26 V and an anode flow rate of 0.15 L·min−1 (case 4), Figure S5: Imf decomposition for a tension of 2 V and an anode flow rate of 0.15 L·min−1 (case 5), Figure S6: Imf decomposition for a tension of 2.2 V and an anode flow rate of 0.15 L·min−1 (case 6), Figure S7: Imf decomposition for a tension of 2.4 V and an anode flow rate of 0.15 L·min−1 (case 7), Figure S8: Imf decomposition for a tension of 2.6 V and an anode flow rate of 0.15 L·min−1 (case 8), Figure S9: Imf decomposition for a tension of 2.7 V and an anode flow rate of 0.15 L·min−1 (case 9), Figure S10: Imf decomposition for a tension of 2.7 V and an anode flow rate of 0.03 L·min−1 (case 10), Figure S11: Imf decomposition for a tension of 2.7 V and an anode flow rate of 0.05 L·min−1 (case 11), Figure S12: Imf decomposition for a tension of 2.7 V and an anode flow rate of 0.07 L·min−1 (case 12).

Author Contributions

Conceptualization, F.A. and C.D.; methodology, F.A., C.D. and J.D.; software, F.A. and C.D.; validation, F.A., C.D., J.D. and A.J.-J.K.; formal analysis, F.A. and C.D.; resources S.B. and F.A.; writing—original draft preparation, F.A., C.D., J.D., A.J.-J.K. and M.B. (Michel Benne); writing—review and editing, M.B. (Michel Benne), B.G.-P., M.B. (Miloud Bessafi) and A.J.-J.K.; supervision, A.J.-J.K. and B.G.-P.; project administration; funding acquisition, M.B. (Michel Benne), A.J.-J.K. and M.B. (Milud Bessafi). All authors have read and agreed to the published version of the manuscript.

Funding

The authors would like to acknowledge the Regional Council of La Reunion, the local management authority for the European Regional Development Fund (ERDF), and the SIDELEC trough the SPACE project, GRANT N D2018026063/GURDTI/SN/SU/EM/MI. The experiments are led in the frame of the European project SYSPACREV (FEDER 2014–2020, N/REF N°D2018017312/GURDTI/SN/SU/AR).

Institutional Review Board Statement

Not applicable.

Informed Consent Statement

Not applicable.

Conflicts of Interest

The authors declare no conflict of interest.

Abbreviations

AM-FMAmplitude modulation and frequency modulation
EMDEmpirical mode decomposition
IMF Intrinsic mode function
PEM WEproton exchange membrane water electrolyzer

References

  1. Barreto, L.; Makihira, A.; Riahi, K. The hydrogen economy i.n the 21st century: A sustainable development scenario. Int. J. Hydrogen Energy 2003, 28, 267–284. [Google Scholar] [CrossRef] [Green Version]
  2. Barbir, F. PEM electrolysis for production of hydrogen from renewable energy sources. Sol. Energy 2005, 78, 661–669. [Google Scholar] [CrossRef]
  3. Carmo, M.; Fritz, D.L.; Mergel, J.; Stolten, D. A comprehensive review on PEM water electrolysis. Int. J. Hydrogen Energy 2013, 38, 4901–4934. [Google Scholar] [CrossRef]
  4. Lettenmeier, P.; Wang, R.; Abouatallah, R.; Helmly, S.; Morawietz, T.; Hiesgen, R.; Kolb, S.; Burggraf, F.; Kallo, J.; Gago, A.S.; et al. Durable Membrane Electrode Assemblies for Proton Exchange Membrane Electrolyzer Systems Operating at High Current Densities. Electrochim. Acta 2016, 210, 502–511. [Google Scholar] [CrossRef] [Green Version]
  5. Majasan, J.O.; Cho, J.I.S.; Dedigama, I.; Tsaoulidis, D.; Shearing, P.; Brett, D.J.L. Two-phase flow behaviour and performance of polymer electrolyte membrane electrolyzers: Electrochemical and optical characterization. Int. J. Hydrogen Energy 2018, 33, 15659–15672. [Google Scholar] [CrossRef]
  6. Ito, H.; Maeda, T.; Nakano, A.; Hasegawa, Y.; Yokoi, N.; Hwang, C.M.; Ishida, M.; Kato, A.; Yoshida, T. Effect of flow regime of circulating water on a proton exchange membrane electrolyzer. Int. J. Hydrogen Energy 2010, 18, 9550–9560. [Google Scholar] [CrossRef]
  7. Dedigama, I.; Angeli, P.; Ayers, K.; Robinson, J.B.; Shearing, P.R.; Tsaoulidis, D.; Brett, D.J.L. In situ diagnostic techniques for zcharacterization of polymer electrolyte membrane water zelectrolyzers–Flow zvisualization and electrochemical impedance spectroscopy. Int. J. Hydrogen Energy 2014, 39, 4468–4482. [Google Scholar] [CrossRef]
  8. Selamet, O.F.; Pasaogullari, U.; Spernjak, D.; Hussey, D.S.; Jacobson, D.L.; Mat, M.D. Two-phase flow in a proton exchange membrane electrolyzer visualized in situ by simultaneous neutron radiography and optical imaging. Int. J. Hydrogen Energy 2013, 38, 5823–5835. [Google Scholar] [CrossRef]
  9. Aubras, F.; Deseure, J.; Kadjo, J.J.; Dedigama, I.; Majasan, J.; Grondin-Perez, B.; Chabriat, J.-P.; Brett, D.J.L. Two-dimensional model of low-pressure PEM electrolyser: Two-phase flow regime, electrochemical modelling and experimental validation. Int. J. Hydrogen Energy 2017, 42, 26203–26216. [Google Scholar] [CrossRef]
  10. Yuan, X.; Wang, H.; Sun, J.C.; Zhang, J. AC impedance technique in PEM fuel cell diagnosis—A review. Int. J. Hydrogen Energy 2007, 32, 4365–4380. [Google Scholar] [CrossRef]
  11. Lebbal, M.; Lecøeuche, S. Identification and monitoring of a PEM zelectrolyzer based on dynamical modelling. Int. J. Hydrogen Energy 2009, 34, 5992–5999. [Google Scholar] [CrossRef] [Green Version]
  12. Olivier, P.; Bourasseau, C.; Bouamama, B. Dynamic and multiphysic PEM electrolysis system modelling: A bond graph approach. Int. J. Hydrogen Energy 2017, 42, 14872–14904. [Google Scholar] [CrossRef]
  13. Huang, N.E.; Shen, Z.; Long, S.R.; Wu, M.C.; Shih, H.H.; Zheng, Q.; Yen, N.; Tung, C.C.; Liu, H.H. The empirical mode decomposition and the Hilbert spectrum for nonlinear and non-stationary time series analysis. Proc. R. Soc. Lond. Ser. A Math. Phys. Eng. Sci. 1998, 454, 903–995. [Google Scholar] [CrossRef]
  14. Lei, Y.; Lin, J.; He, Z.; Zuo, M.J. A review on empirical mode decomposition in fault diagnosis of rotating machinery. Mech. Syst. Signal Process. 2013, 35, 108–126. [Google Scholar] [CrossRef]
  15. Wu, S.-D.; Wu, P.-H.; Wu, C.-W.; Ding, J.-J.; Wang, C.-C. Bearing Fault Diagnosis Based on Multiscale Permutation Entropy and Support Vector Machine. Entropy 2012, 14, 1343–1356. [Google Scholar] [CrossRef] [Green Version]
  16. Zanin, M.; Zunino, L.; Rosso, O.A.; Papo, D. Permutation Entropy and Its Main Biomedical and Econophysics Applications: A Review. Entropy 2012, 14, 1553–1577. [Google Scholar] [CrossRef]
  17. Rostaghi, M.; Azami, H. Dispersion Entropy: A Measure for Time-Series Analysis. IEEE Signal Process. Lett. 2016, 23, 610–614. [Google Scholar] [CrossRef]
  18. Zheng, Z.; Pe_ra, M.-C.; Hissel, D.; Becherif, M.; Agbli, K.-S.; Li, Y. A double-fuzzy diagnostic methodology dedicated to online fault diagnosis of proton ex- change membrane fuel cell stacks. J. Power Sources 2014, 271, 570–581. [Google Scholar] [CrossRef]
  19. Yu, F.T.; Lu, G. Short-time Fourier transform and wavelet transform with Fourier-domain processing. Appl. Opt. 1994, 33, 5262–5270. [Google Scholar] [CrossRef] [PubMed]
  20. Rafiee, J.; Tse, P.W. Use of autocorrelation of wavelet coefficients for fault diagnosis. Mech. Syst. Signal Process. 2009, 23, 1554–1572. [Google Scholar] [CrossRef]
  21. Garcia-Navarro, J.C.; Schulze, M.; Friedrich, K.A. Measuring and modeling mass transport losses in proton exchange membrane water electrolyzers using electrochemical impedance spectroscopy. J. Power Sources 2019, 431, 189–204. [Google Scholar] [CrossRef]
  22. Damour, C.; Benne, M.; Grondin-Perez, B.; Bessafi, M.; Hissel, D.; Chabriat, J.-P. Polymer electrolyte membrane fuel cell fault diagnosis based on empirical mode decomposition. J. Power Sources 2015, 299, 596–603. [Google Scholar] [CrossRef]
  23. Li, Y.; Li, G.; Wei, Y.; Liu, B.; Liang, X. Health condition identification of planetary gearboxes based on variational mode decomposition and generalized composite multi-scale symbolic dynamic entropy. ISA Trans. 2018, 81, 329–341. [Google Scholar] [CrossRef] [PubMed]
  24. Yoo, D.J.; Hyun, S.H.; Kim, A.R.; Kumar, G.G.; Nahm, K.S. Novel sulfonated poly (arylene biphenylsulfone ether) copolymers containing bisphenylsulfonyl biphenyl moiety: Structural, thermal, electrochemical and morphological characteristics. Polym. Int. 2011, 60, 85–92. [Google Scholar] [CrossRef]
  25. Vinothkannan, M.; Kim, A.R.; Yoo, D.J. Potential carbon nanomaterials as additives for state-of-the-art Nafion electrolyte in proton-exchange membrane fuel cells: A concise review. RSC Adv. 2021, 11, 18351–18370. [Google Scholar] [CrossRef]
  26. Kim, A.R.; Vinothkannan, M.; Song, M.H.; Lee, J.Y.; Lee, H.K.; Yoo, D.J. Amine functionalized carbon nanotube (ACNT) filled in sulfonated poly (ether ether ketone) membrane: Effects of ACNT in improving polymer electrolyte fuel cell performance under reduced relative humidity. Compos. Part B Eng. 2020, 188, 107890. [Google Scholar] [CrossRef]
  27. Immerz, C.; Schweins, M.; Trinke, P.; Bensmann, B.; Paidar, M.; Bystroň, T.; Bouzek, K.; Hanke-Rauschenbach, R. Experimental characterization of inhomogeneity in current density and temperature distribution along a single-channel PEM water electrolysis cell. Electrochim. Acta 2018, 260, 582–588. [Google Scholar] [CrossRef]
Figure 1. Effect of the anode inlet water flow rate on the I–V characteristics for an anode pressure of 1 bar, a cathode pressure of 2 bars and room temperature (-- Qa = 0.01 L·min−1, ··· Qa = 0.03 L·min−1, -•- Qa = 0.07 L·min−1, -+- Qa = 0.15 L·min−1).
Energies 14 04458 g001
Figure 2. Electrolyzer output current (A) for cases 1–12, gathered in Table 2.
Energies 14 04458 g002
Figure 3. EMD principle with the signal, u(t) (the upper) and l(t) (the lower) envelopes of S0(t) (the signal), and m(t) (the mean signal), where z(t) (the quick fluctuations) and w(t) (the trend contribution) are the decomposition of S0(t).
Energies 14 04458 g003
Figure 4. Sifting process.
Energies 14 04458 g004
Figure 5. Decomposition for a tension of 1.4 V and an anode flow rate of 0.15 L·min−1 (case 1).
Energies 14 04458 g005
Figure 6. EMD energy of each IMFs for different operating conditions ( Energies 14 04458 i001 case1, Energies 14 04458 i002 case 2, Energies 14 04458 i003 case 3, Energies 14 04458 i004 case 4, Energies 14 04458 i005 case 5, Energies 14 04458 i006 case 6, Energies 14 04458 i007 case 7, Energies 14 04458 i008 case 8, Energies 14 04458 i009 case 9, Energies 14 04458 i010 case 10, Energies 14 04458 i011 case 11, Energies 14 04458 i012 case 12).
Energies 14 04458 g006
Table 1. Cell specification and nominal operating conditions.
ParameterValue
Cell temperature25 °C
Anode pressure1 bar
Cathode pressure2 bar
Active area28 cm2
Membrane thickness0.127 mm
LGDL thickness1.68 mm
Grill thickness1.02 mm
Table 2. Range of variation of the operational parameters of the E-PEM.
Case123456789101112
< U c e l l > Voltage (V)1.41.61.81.2622.22.42.62.72.72.72.7
Anode flow rate (L·min−1)0.150.150.150.150.150.150.150.150.150.030.050.07
Cathode Flow rate (L·min−1)0.150.150.150.150.150.150.150.150.150.150.150.15
< I c e l l > Mean Current (A) (400 s)0.353.019.630.3314.6121.9533.0848.3662.8578.8165.5463.35
Mean Current density (A·cm−2)0.010.100.340.010.520.781.181.722.242.812.342.26
Publisher’s Note: MDPI stays neutral with regard to jurisdictional claims in published maps and institutional affiliations.

