
Gas Permeability Model for Porous Materials from Underground Coal Gasification Technology

1
Institute of Technology and Life Sciences, National Research Institute, Falenty, 3 Hrabska Avenue, 05-090 Raszyn, Poland
2
Department of Renewable Energy, 67 Biskupinska Street, 60-463 Poznan, Poland
Energies 2021, 14(15), 4462; https://doi.org/10.3390/en14154462
Submission received: 23 June 2021
/
Revised: 14 July 2021
/
Accepted: 21 July 2021
/
Published: 23 July 2021
(This article belongs to the Special Issue Modeling and Control of Energy Conversion during Underground Coal Gasification Process)
Abstract
:Underground coal gasification (UCG) technology converts deep coal resources into synthesis gas for use in the production of electricity, fuels and chemicals. This study provides an overview of the systematic methods of the in situ coal gasification process. Furthermore, the model of the porous structure of coal has been presented and the gas movement taking place in the carbon matrix—which is part of the bed—has been described. The experimental tests were carried out with the use of air forced through the nozzle in the form of a gas stream spreading in many directions in a porous bed under bubbling conditions. The gas flow resistance coefficient was determined as a function of the Reynolds number in relation to the diameter of the gas flow nozzle. The proprietary calculation model was compared to the models of many researchers, indicating a characteristic trend of a decrease in the gas flow resistance coefficient with an increase in Reynolds number. The novelty of the study is the determination of the permeability characteristics of char (carbonizate) in situ in relation to melted waste rock in situ, taking into account the tortuosity and gas permeability factors for an irregularly shaped solid.
1. Introduction
In situ thermal coal processing technology is currently a significant alternative to traditional coal gasification technologies in various aspects, both technical and technological. The in situ processing takes place in a natural deposit, which does not require the use of highly expensive and energy-consuming technological installations. Furthermore, as an UCG (underground coal gasification) process, it has the potential to obtain processed gas, related only to the scale of thermal gasification of the coal deposit. In both cases, the technology of in situ processing brings with it great production possibilities, also in the aspect of environmental protection and increasingly determined by unconventional techniques of processing minerals for energy purposes. The great advantage of UCG technology is that under the conditions of underground coal processing, all possible processes and reduction stages (obtaining syngas) are dealt with in one place and one bed, during which, after partial or complete gasification of the bed, a porous material in the form of a char is formed [1,2,3].
1.1. Systematics of Method of Gasification Process of Coal In Situ
It is possible to perform in-depth (30–200 m) processing, applying underground coal gasification (UCG) technology at a length of about 100 m (Table 1) [4].
In UCG technology, in fields excluded or for the farthest exploitation of uneconomic use, this method is applicable for the utilization of the most common shaft, excavations and mining pavements. Shallow boards applied in the case of this technique are streamlined (shallow deposits), opened or blind (on average shallow; Figure 1).
In this technology, a mixture of water, steam and air is pressed with a hole injection, below which gassification of the zone has been initiated. A receipt of raw gas follows on (step) from the contrarily placed productive hole. The georeactor is iniated in the course of this enduring process of freezing, which leads the geochamber in a result of the revolt cavern.
Performed analysis of the foundation of this technology indicates UCG technology, in that the shaft method presents the potential for coal seams which have not yet been exhausted in mines. An innovative project of the European Coal and Steel Community under the title “HUGE” (Hydrogen-oriented underground coal gasification for Europe) [6] is being fulfilled in Poland by the Main Institute of the Mining. The purpose of the project is the conduct of research over hydrogen production technology on underground coal gasification. Project “HUGE I” was brought to completion in the years 2007–2010. In carrying experimental research in the surface reactor ex situ [7], it conditions the processes in coal block gasification—Figure 2. It carries an attempt on a semi-technical scale in the Experimental Mine “Barbara”—in a coalfield, at a depth of 30 m at seam 310 (testing time of 16 days). The project “HUGE II” was completed in 2015, which includes structures of piloting installation localized in conditions in the coal mine stone mining seam 501 “Wieczorek”.
Next was the un-shaft method on the so-called CRIP technique (Controlled Retractable Injection Point). It takes advantage of the direction of boreholes in generation I in Figure 3a. This method presently developed into generation II of the step, of which characteristic features are presented in Figure 3b. It is an additional (third) hole example of injection-ignition in the process for the characteristic revolt of phenomenon underground gasification. It is described as “knife edge”, which causes the efficient conversion of coal along with raw gas in front of the withdrawing fire [8].
Numerous international experiences take advantage of the indicating methods of fabricating, within a range, the possession of underground coal gasification for commercial projects, for methods of producing syngas (Figure 4) [9]. However, arbitrated choice is a compound question under UCG process technology; it benefits to take into consideration the basic criteria of maximum energy proficiency within range.
Although it is possible to achieve the top depth of the field, at 2000 m it is possible to reach the top of this depth, along with creating, in this case, an exploitation field diameter of about 4000 m as in Complex Energy Extraction technology for Coal (CEEC) [8].
This technology takes advantage of the so-called Jet-Stinger (J-S) technique in operation with the method-based “Super Daisy Shaft” (SDS)—Figure 5. In essence, the system presents an armed main mineshaft SDS, in which, tube type direction boreholes are executed through the field under pressure drived in 8.1 MPa. Multiplicity of all of the system of a pipeline relies on a (J-S) concentric, with at least three tubes in the tube matching to create a“pipe in the pipe”.
System multifunctionality of the pipe of the type (J-S) is shown in Figure 6. Among others it is related with, this is made possible through the induction of detonation propylants with a seismic wave. The agent performs the oxidizing injection to process coal, and to perform the pre-gasification and hydrogenation of the deposit. Moreover, the functional CO2 sequestration, in receipt of procedural products, contains geothermal sources coming from liquid products which have a processing, as well as an overcrowding material to give a leg up for the filling-incurred cavern [10].
A technical foundation is presented for the described methods of underground coal gasification and decides the manner of translation of the process. However, they indicate the same range of application of UCG or CEEC technology. Utalitarian features of these technologies present big capabilities for practical application and for purposes of underground natural conversions of fuels, and for the considerable process range of raw gas.
1.2. Gas Movement in a Porous Structure
In this case, the hydrodynamic phenomena of the flow depend highly significantly on the pore structure as well as the forces and mechanisms causing the gas flow. As an example (Figure 7), following Seewald end Klein [11], it is possible to point to a diagram of the porous structure of carbon with the designation of the expected process mechanisms. In this case, the gas movement takes place in twisted and complicated microchannels—also in a system of interconnected channels with a different geometry. Filtration transport in a macropore system in such a structure [12] is associated with a significant modification of the pore pressure, which determines the course of diffusion in such a porous medium. In in situ conditions, the influence of external pressure (rock mass) and gas pressure may change the pore structure of the deposit. This is due to the fact that carbon can be treated as a biporous system, i.e., as microporous areas compressed by the high pressure of pore fluids (CO2, CH4, H2O). As a consequence, the geometry of the macropores may change, or the macropores may become narrower due to the adsorption-absorption phenomena. Moreover, the structure of the medium significantly affects the permeability of the bed [11].
The gas in a porous medium, due to the degree of its connection with the medium, can be divided into free gas (filling pores and crevices) and gas associated with the medium through sorption processes. Topolnicki et al. [12] state that from the physical point of view, a porous medium with submicro-, micro-, meso- and macropores can be treated as a sorbent with a structure in which the share of meso- and macropore surfaces is small. The porous bed system in which the gas flow takes place may be compact, uniform and containing fractures and fractures for which the permeability increases. Gas as a compressible medium occupies a volume dependent on pressure, and there is an equilibrium in the decompressed or disturbed seams. In an intact bed, free gas and adsorbed gas remain in equilibrium, while the violation of this equilibrium leads to the activation of gas filtration transport, mainly along the macropores. The outflow of gas from the fracture-porous medium reduces the pressure in the bed and is characterized by a specific bed permeability coefficient.
Several studies focused on in the fractured porous systems, the type of porosity systems is of significant importance for the gas flow in the porous structure [13,14,15,16]. The solutions proposed by the authors of these works are based on the following assumptions:
- (1)
- For a single porous structure, the calculations are based on models of cylindrical capillaries:
- –
- Burdini—one capillary of equal radius;
- –
- Mualema—two bound capillaries with different radii;
- –
- The specific shape of the capillary in which the skin effect occurs.
- (2)
- A double structure, in which there is a dominant gas flow through a porous matrix and fractures with negligible permeability.
- (3)
- A multiple structure, in which a transient is created in the process of gas flow from the porous matrix to the fractures; these states determine the nature of the flow over relatively long periods of time (years).
In fact, gas flow in a coal seam occurs in a much more complex form that binds all of the above mechanisms together. This is due to the fact that in the process of gas release and flow in a fractured porous medium, the following phases of pressure reduction, desorption, diffusion and slotted flow can be distinguished. The phenomena of desorption and filtration are closely related in the mechanical and energetic sense [11]. The gas flow rate may also be determined by the desorption rate, independent of the permeability through the bed [17], for example, in Figure 8, the gas movement patterns resulting from the so-called rock matrix [18].
Gas transport mechanisms that can only occur under specific pore geometry and under specific thermodynamic conditions are presented in Wyrwał [19].
This author distinguishes the movement of fluid in the bed according to the flow:
- –
- Subcapillary—movement takes place only at increased temperature and pressure;
- –
- Capillary—movement occurs under the influence of capillary forces and surface tension;
- –
- Hypercapillary—motion according to the general laws of hydraulics and under the action of gravity.
On the other hand, Werner and Gertis [20] distinguish forms of transport as follows:
- –
- Laminar flow occurs when the collisions of molecules occur in frequently changing capillary radii;
- –
- Diffusion—occurs as a process of self-mixing of gas particles until full equalization;
- –
- Knudsen transport—defined as the number of collisions of a molecule with the pore walls, related to the number of mutual collisions between molecules [21].
Considering the importance of coal porosity on syngas formation, the porosity and permeability of various ranks of coal seam with the coal bed methane (CBM) potential have been investigated widely [22,23,24,25,26,27].
In the literature, you can find a description of the fluid flow process in cylindrical capillaries, but the occurring phenomenon cannot be presented in the form of an unambiguous mathematical description. The main reason is the significant differentiation of the geometry and its variability in the longitudinal shape of individual pores, cross-section, connections between individual channels participating in the gas flow, etc.
Presented is a review of systematic methods of the coal gasification process in situ, thanks to which, concepts and tendencies for the use of unconventional clean energy technologies are determined. Such activities are aimed at rationalizing the use of fuels characterized by a model of porous-structure coal. An attempt was made to describe the gas movement taking place in the carbon matrix, which is part of the deposit.
Quite often, theoretical considerations of gas flow through a porous medium are based on models of flow through straight-axis channels (capillaries), flow laws—e.g., Poiseuille—and indications of flow resistance, often with some simplifying assumptions. In each case, however, these models are based on the quantities describing the physical properties of the porous medium. These include, among others, parameters such as: the shape of the pores, their size, interconnections, porosity of the system, both real and effective, characterizing the permeability of the porous bed.
With regard to the porous structure of coal and its chars considered in this study, the additional complexity of hydrodynamics results from the fact that the chars are skeletal structures, and therefore they are compact and in no way loosened during the increase in pressure in the system.
An original model of the total gas flow resistance through a porous medium was proposed, which takes into account the bed parameter related to the gas permeability coefficient and porosity.
1.3. Scope and Research Methodology
The aim of the research was to evaluate the gas permeability of materials with an irregular, fractured porous structure. The experimental tests were carried out with the use of air forced through the nozzle in the form of a gas stream spreading in many directions in a porous bed under bubbling conditions. The gas flow resistance coefficient was determined as a function of the Reynolds number, depending on the diameter of the gas flow nozzle. The total value of the gas permeability coefficient was determined experimentally, taking into account the authors’ own model of the gas permeability coefficient and with the use of auxiliary functions in the context of tortuosity and porosity. As a consequence, the gas flow resistance coefficient as a function of the Reynolds number was determined for porous skeletal materials with bed velocity.
2. Materials and Methods
The study was based on various types of frame structures derived from UCG technology. Char (carbonizate) in situ—Figure 9a, and melted waste rock in situ—Figure 9b, was created as a result of thermal processing of hard coal in the deposit and comes from the “Barbara” Experimental Mine in Mikołów, Poland.
Research Position
The research was conducted on the laboratory position, as can be seen in Figure 10, the essential element of which was a vessel used to assess the phenomenon of aeration through a porous char material—Figure 11. The stand has been equipped with a rotameter for measuring the gas stream and a pressure-melted waste rock. The reference pressure related to the aeration process was determined with a reducer in the range (0.1–0.4) MPa.
Figure 11 shows the applied system of powering the sample for the free flow of gas (with emphasizing agreed parameters) and illustrates the flow of gas in these conditions.
The shape of the sample of this type along with the visible additive tube (see photographs) is showed in Figure 11—images refer to the volume sample of char (indefinable shape). The connection of the nozzle with the porous material is made through a hole, and then a special glue (binder) is applied—Figure 12.
3. Results and Discussion
3.1. Results of Porosity and Gas Permeability
In quantification, the following parameters were assessed: porosity, porosity index and density—Table 2, permeability as a measure of pressure drop and a surrogate coefficient of flow resistance. Regardless of the measurement of the aeration flow, the permeability and the equivalent flow resistance coefficient were determined on the basis of the pressure drop across the bed of porous material. The determined parameters for the tested materials (samples) are presented in Table 3.
In order to achieve the aim of the study, detailed experimental studies were carried out to assess gas permeability in the structure of the porous material, and the results are presented in Table 3.
3.2. Results of Coefficient of Gas Flow Resistances
The results for the determined flow resistance coefficient Equation (1)
for the volumetric sample are given in Figure 13.
The reference of the value of this coefficient to the Reynolds number Equation (2) was used at a gas speed of wo resulting from the d diameter of the feeding nozzle—Figure 12.
These results indicate a decrease in changes in the value of the drag coefficient as a result of an increase in the Reynolds number, which is consistent with the physics of the analyzed phenomena, but the scale of these changes is sometimes extremely large. This proves that the flow resistance is highly influenced by the dynamics of gas flow through the porous material, in particular, the disturbance of the velocity profile. This trend and measuring range both indicate that for coal char and melted waste rock (Figure 13a), the turbulent nature of the gas movement is noted, which is proven by the non-linear nature of this coefficient. It may be noted that melted waste rock has the minimum flow resistance, relative to coal char (Figure 13). Undoubtedly, this is due to the fact that this material—with a low porosity (average 31.5%)—has a highly extensive system of pores and channels closed to gas flow. On the other hand, the char with higher porosity (average 40.3%) has a highly extensive system of pores and open channels for gas flow. Figure 13 proves the change in the value of the drag coefficient proportional to the Reynolds number, that when modeling the hydrodynamic conditions of gas flow through the porous material of the skeleton, the relationship is as follows Equation (3):
This also applies to the Reynolds number, which in this case may take a different form (Table 4).
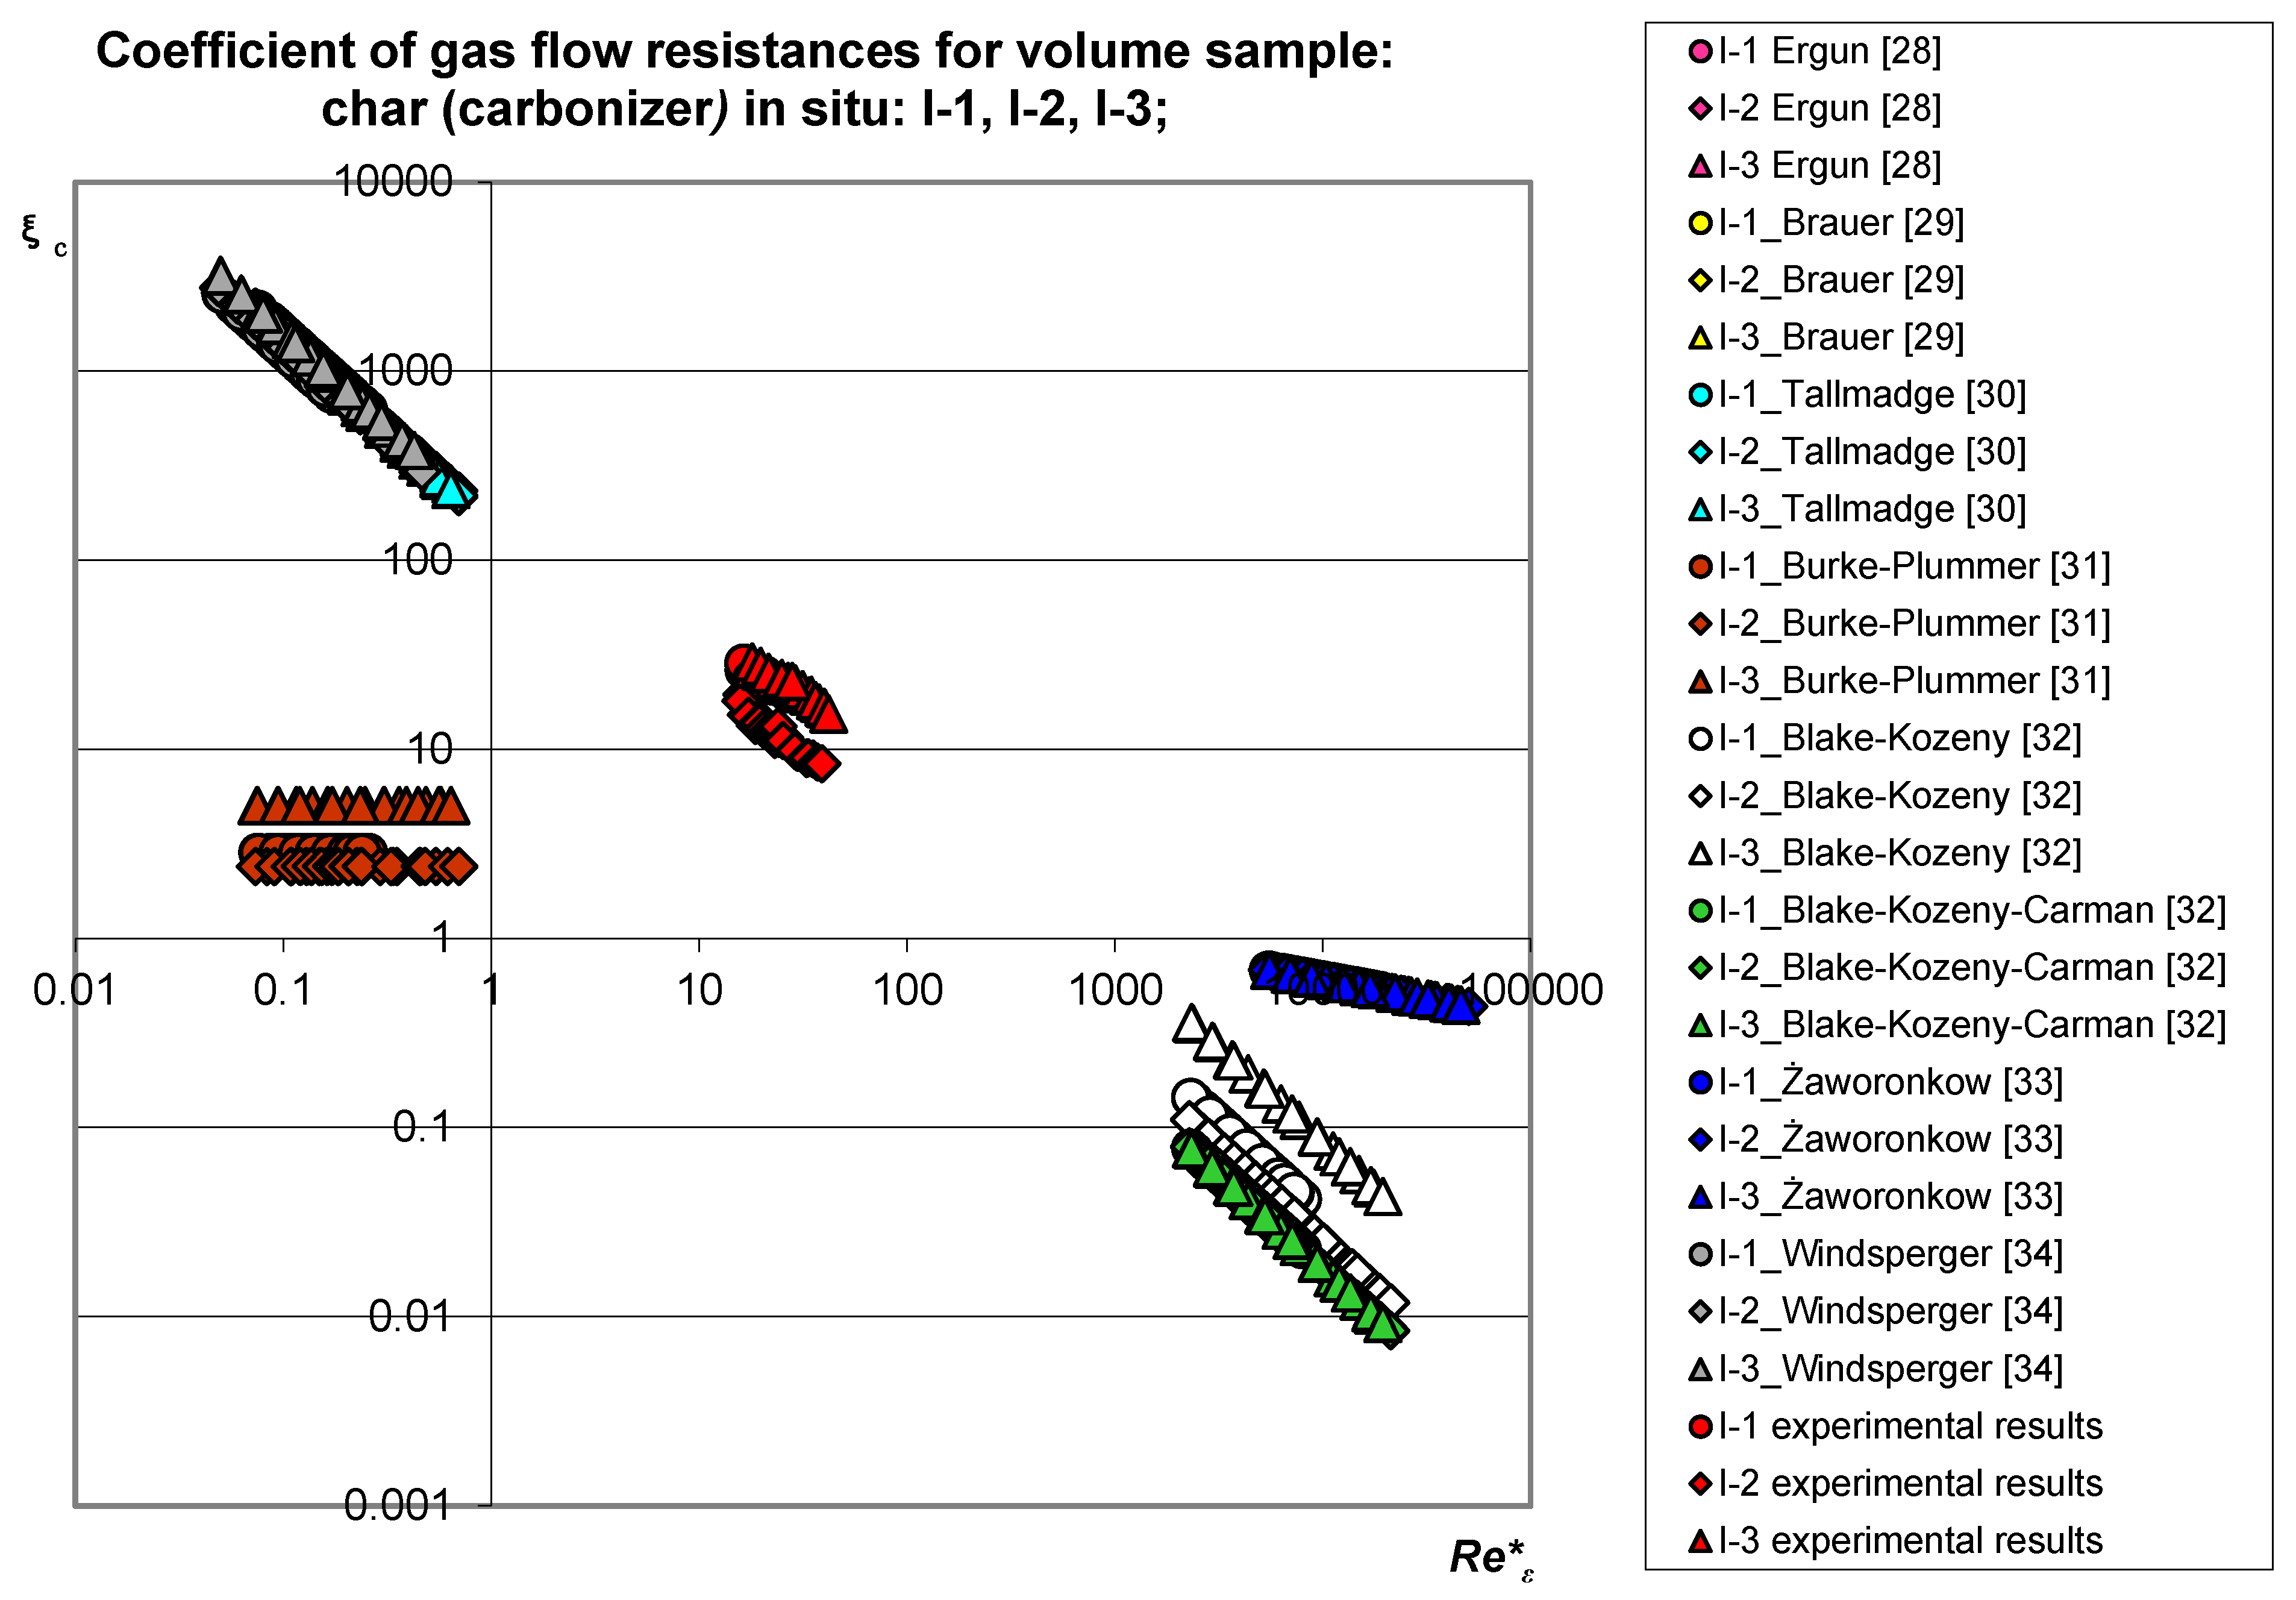
The presented exemplary gas flow characteristic for char (carbonize) in Figure 14 indicates a discrepancy in relation to other calculation models included in Table 4. Figure 14 relates to the Reynolds number depending on the substitute coefficient of flow resistance calculated for the full flow of the supply nozzle. The discrepancies may result from the lack of identification of model solutions for the specific structure of the tested materials. The structure of these materials shows the features of numerous closed and blind pores for gas flow. This indicates a diversified permeability and high randomness of the structure of this type of materials, depending on the type and conditions of in situ thermal processing of coal. When interpreting Figure 14, it should be noted that the mean equivalent flow resistance coefficient does not depend on the shape of the solid, but on the internal structure, as shown by the distribution of experimental points in Figure 14 for all analyzed models. In Table 4, the equations are not adequate to describe the hydrodynamics of the tested materials. The results of the comparison of the models according to the authors show that the possible adaptation of the computational methods (models-coefficient of resistances of the flow through granular porous structures) characteristic for porous granular beds does not give sufficient results for the use of these models in the description of the gas flow hydrodynamic criteria. The main reason for such a situation is the influence of pressure losses on the bed of the tested material, related to friction losses and losses resulting from the disturbance of the velocity profile—especially the local resistance of the skeleton material.
There is still a debate [35] on how to best describe this criteria number to identify the flow through frame-structured porous materials. In the case of these materials, it is extremely difficult or even impossible to assess the diameters of pores and capillaries and their actual flow velocity; Bear and Cheng [36] suggest that, in this case, the Reynolds number Equation (16) to be determined for the total volume of the porous material is related to the flow path:
The characteristic linear measurement is calculated as an alternative diameter, resulting from the volume of the porous material and the section active for the flow, viz. Equation (17):
Furthermore, velocity is a result of the deposit porosity and is associated with an apparent velocity (calculated for the entire cross-section of the deposit; Equation (18)):
The conducted analyses show that the method resulting from Equations (16)–(18), and the definition of the criteria, the Reynolds number, does not best reflect any of the hydrodynamic conditions in which a low porous frame material gas is present. This is due to the fact that the subject of the research was a sample of a different shape. Particularly in the case of the volume of a solid, the determination of the cross-sections for the direction of flow is extremely difficult and imprecise. In order to solve these problems, an attempt was made to develop an alternative model based on the change of kinetic energy characteristics for all gas flow oppositions through the porous medium. According to Equation (1), this may be as follows Equation (19):
3.3. Results of Gas-Permeability Coefficient
When pointing to the problem, the diversified shape of the material and the characteristic structural features resulting from its porosity and permeability were taken into account. Equation (19) can be modified by introducing a correction coefficient in the form of the so-called tortuosity parameter Equation (20):
Assuming the gas flow rate, pressure drop across the bed, porosity of the bed and the type of gas, the value of the gas permeability coefficient Equation (21) can be determined experimentally and determined [37]:
Results of the measurement being characteristic of a permeability coefficient of the gas of the tested sample of char were shown on Figure 15.
The measured gas flow through the char from the total pressure drop is greater the higher the aeration pressure, i.e., the reference pressure. On the other hand, the carbon permeability is constantly increasing by the value of a given Reynolds number.
3.4. Own Model of Coefficient of Gas Flow Resistances
Taking into account dependence Equation (20), the equation for the total coefficient of resistance is as follows Equation (22):
With reference to Equation (22), compensation calculations were performed for a sample in the form of a solid body of a different shape (volume). The arithmetic analysis shows that for a volumetric solid, the tortuosity parameter should be calculated on the basis of the relationship Equation (23):
The auxiliary function for the exponent: a is −0.22 for char and a is −0.20 for melted waste rock; at the base of power is the coefficient of bed formation (24) related to the gas permeability coefficient and porosity:
While the Reynolds number Equation (25) in the auxiliary function for the exponent b is 0.4, char and melted waste rock take into account the defined apparent velocity Equation (26):
The apparent velocity Equation (26) refers to the entire space of the volume sample feeding as the cross-section resulting from the frontal and lateral area of the feeding nozzle (Figure 12).
Cross-sectional area of nozzle feeding the porous material Equation (27):
Based on our own model, the obtained results of the resistance coefficient function as a function of the Reynolds number are shown in Figure 16.
The dependence presented in Figure 16, corrected by parameters resulting from the authors’ own research, was compared to the points resulting from other calculation models [28,29,30,31,32,33,34]. In this way, the developed area was obtained in line with the porous sediment permeability trend–char in situ is presented as an example Figure 17.
The distribution of experimental points proves that the expectation for the proprietary model for all other models, according to the authors (Table 4), shows the same trend of changes in the total flow resistance coefficient in the relation of the modified Reynolds number, which confirms the adequacy of the assumptions. It should be noted that for the methodology adopted in this way for the use of the authors’ own model, it is possible to develop an area that is not yet recognized, especially in the context of gas flow under UCG conditions.
In this research, direct measurements were taken, and for this purpose, instruments for measuring gas flow, pressure (pressure difference) and temperature were used. These instruments have been properly calibrated, for which the results in relation to the gas flow meters used are given in Table 5.
The subject of my own considerations was also the analysis of the measurement error. It was found that in relation to the measured values, this analysis did not bring a significant improvement in the estimation of the measurement error. Therefore, a detailed description of the measurement error analysis was omitted.
As an example, the algorithm for calculating the error and uncertainty of the air volume flow measurement is presented, which results from the analysis of measurement errors. The results of the calculations according to the algorithm are presented in Table 6.
As can be seen from Table 6, the expected (average) value for the adopted measurement is 3.74 × 10⁻⁴ m3/s, at the result of (at the confidence level 0.99) 3.74 × 10⁻⁴ ± 3.29 × 10⁻⁵ m3/s, which gives an average measurement error for the analyzed series of 8.7%. The average relative mistake for the entire scope of the flow of gas amounted to ±5.3%.
4. Conclusions
Gas permeability tests of materials from UCG were carried out in bubbling conditions. This made it possible to evaluate materials with a slit-porous structure characterized by irregular shapes. The evaluation showed that the models available in the literature have a limited scope of application to skeletal media, characterized by a significant internal structure of the porous material. The test results show that under bubbling conditions, it is possible to accurately assess the gas permeability, which makes it possible to comprehensively assess the properties of the porous material in terms of the process for UCG technology. Based on the research carried out so far, it can be concluded that:
- (1)
- Char (carbonizer) in situ and melted waste rock in situ research materials are characterized by a large variety of structures;
- (2)
- The structural features of materials derived from underground processing can be attributed to many porosity patterns;
- (3)
- Char (carbonizer) in situ—a fractured medium, it is more permeable in relation to melted waste rock in situ—a less-porous medium (low proportion of open pores);
- (4)
- Average transmittance does not depend on the shape of the sample, but on the internal structure;
- (5)
- The appropriate adaptation of the model equations allowed for a confrontation with the authors’ own model, pointing to the need to interpret gas permeability in an unconventional way, especially for materials derived from UCG technology.
In the utilitarian aspect, it is possible to use the developed gas-permeability in the context of underground fermentation of coal seams with the use of an appropriate polydisperse substrate.
Funding
The study was carried out in the framework of: (1) The project under the program BIOSTRATEG founded by the National Centre for Research and Development “BIO-STRATEG1/269056/5/NCBR/2015 11 August 2015. (2) The Research Task (statutory) No. 11/79/2019 “Developing a model describing the gas permeability of anisotropic porous materials in the aspect of adhesive hydrodynamics for agroenergetic applications” implemented by the Renewable Energy Department in the Poznan Branch, Institute of Technology and Life Sciences in Falenty. The APC was funded by Institute of Technology and Life Sciences-National Research Institute, Falenty, Poland.
Institutional Review Board Statement
Not applicable.
Informed Consent Statement
Not applicable.
Data Availability Statement
The data presented in this study are available on request from the corresponding author.
Conflicts of Interest
The authors declare no conflict of interest. The funders had no role in the design of the study; in the collection, analyses, or interpretation of data; in the writing of the manuscript; or in the decision to publish the results.
Abbreviations
| A | total cross-section of the flow channel | m2 |
| K | permeability coefficient | m2 |
| P | pressure gauge | Pa |
| Q | volumetric flow | m3/s |
| Re | Reynolds number | |
| T | thermometer | °C |
| V | volume | m3 |
| e | indicator porosity | |
| d | diameter | m |
| f | function | |
| w | velocity | /s |
| ΔP | pressure drop, resistance flow | Pa |
| Ψ | tortuosity | |
| ε | porosity | |
| η | fluid viscosity | Pa·s |
| ξ | coefficient of flow resistance | |
| π | Pi number | |
| ρ | fluid density | kg/m3 |
| χ | coefficient of tortuosity | |
| Upper indices refer to | ||
| a | exponent | |
| b | exponent | |
| * | own model | |
| Lower indices refer to | ||
| B | acc. Brauer | |
| B-K | acc. Blake-Kozeny | |
| B-K-C | acc. Blake-Kozeny–Carman | |
| B-P | cc. Burke-Plummer | |
| E | acc. Ergun | |
| T | acc. Tallmadge | |
| V | own model | |
| W | acc. Windsperger | |
| Z | acc. Zaworonkow | |
| a | apparent | |
| b | absolute | |
| c | total | |
| ef | effective | |
| g | gas | |
| o | value calculated on the total deposit section-apparent value | |
| r | nozzle | |
| re | reference | |
| s | skeleton | |
| zm | measured | |
| ε | value calculated relative to the porosity |
References
- Stańczyk, K.; Kapusta, K. Underground coal gasification. Karbo 2007, 2, 98–102. [Google Scholar]
- Kreinnin, E.V.; Zorya, A.Y. Underground Coal Gasification Problems. Springer Solid Fuel Chem. 2009, 43, 215–218. [Google Scholar] [CrossRef]
- Shafirovich, E.; Mastalerz, M.; Rupp, J.; Varma, A. The Potential for Underground Coal Gasification in Indiana. Phase I. Report to the Indiana Center for Coal Technology Research (CCTR); Purdue University: West Lafayette, IN, USA, 2008. [Google Scholar]
- Wałowski, G.; Filipczak, G. Technical and Technological Aspects of “In Situ” Coal Processing. In Proceedings of the XXI School of Underground Exploitation, Cracow, Poland, 20–24 February 2012; pp. 389–396. [Google Scholar]
- Younger, P.L. Hydrogeological and Geomechanical Aspects of Underground Coal Gasification and its Direct Coupling to Carbon Capture and Storage. Springer Mine Water Environ. 2011, 30, 127–140. [Google Scholar] [CrossRef]
- Stańczyk, K.; Świądrowski, J.; Kapusta, K.; Howaniec, N.; Cybulski, K.; Rogut, J.; Smoliński, A.; Wiatowski, M.; Kotyrba, A.; Krause, E.; et al. Hydrogen-Oriented Underground Coal Gasification for Europe (HUGE); EUR 25044 EN; Final Report 2012. Research Found for Coal and Steel; European Commission: Brussels, Belgium, 2012. [Google Scholar]
- Stańczyk, K.; Smoliński, A.; Kapusta, K.; Wiatowski, M.; Świądrowski, J.; Kotyrba, A.; Rogut, J. Dynamic experimental simulation of hydrogen oriented underground coal gasification of lignite. Fuel 2007, 89, 3307–3314. [Google Scholar] [CrossRef]
- Wałowski, G. Wałbrzych from the Poor Shafts to Underground Gasification of Hard Coal; Publishing House of the Catholic Action of the Archdiocese of Lublin: Lublin, Poland, 2009; ISBN 978-83927527-8-3. [Google Scholar]
- Wałowski, G. Technical Condition and Prospects for the Development of Underground Coal Gasification Technology. The Influence of Young Scientists on the Achievements of Polish Science; CREATIVETIME: Cracow, Poland, 2012. [Google Scholar]
- Wałowski, G. Nowa Ruda: From Poor Shafts to Underground Hard Coal Hydrogenation; Poligraf Publishing House: Brzezia Łąka, Poland, 2011; ISBN 978-83-62752-68-3. [Google Scholar]
- Seewald, H.; Klein, I. Methansorption an Stainkohle und Kennzeichnung der Porenstrukture. Gluckauf Forsch. 1985, 47, 149. [Google Scholar]
- Topolnicki, J.; Wierzbicki, M.; Skoczylas, N. Tests of apparatus for measuring the kinetics of CO2 release from hard coal samples. Work. Strat. Mech. Inst. PAN 2004, 6, 71–78. [Google Scholar]
- Szott, W.; Gołąbek, A. Simulations of the exploitation process of natural gas deposits in shale gas formations. Naft. Gaz 2012, 12, 923–936. [Google Scholar]
- Burdine, N.T. Relative permeability calculation from pore size distribution data. Trans. Am. Inst. Min. Eng. 1953, 198, 71–78. [Google Scholar] [CrossRef]
- Mualem, Y. Modeling the Hydraulic Conductivity of Unsaturated Porous Media, in Indirect Methods for Estimating the Hydraulic Properties of Unsaturated Soils; van Genucthen, M.T., Leij, F.J., Lund, L.J., Eds.; University of California: Riverside, CA, USA, 1992; pp. 15–36. [Google Scholar]
- Gonet, A.; Nagy, S.; Rybicki, C.; Siemek, J.; Stryczek, S.; Wiśniowski, R. Coal bed methane extraction technology (CBM). Gor. Geol. 2010, 5, 5–25. [Google Scholar]
- Krause, E.; Karbownik, M. Tests of methane desorption and emission from samples of hard coal in the context of mine closures through flooding. J. Sustain. Min. 2019, 18, 127–133. [Google Scholar] [CrossRef]
- Hagoort, J. Fundamentals of Gas Reservoir Enginnering. Developments in Petroleum Science 23; Elsevier: Amsterdam, The Netherlands, 1988. [Google Scholar]
- Wyrwał, J. Moisture Movement in Porous Materials and Building Partitions, WSI in Opole, Studies and Monographs; WSI: Opole, Poland, 1989; p. 31. [Google Scholar]
- Werner, H.; Gertis, K. Energetische Kopplung von Feuchte- und Wärmeübertragung an Außenflächen; Hygrische Transportphänomene in Baustoffen, Deutscher Ausschuß für Stahlbeton: Berlin, Germany, 1976; Volume 258. [Google Scholar]
- Pogorzelski, J. Thermal Physics of Buildings; PWN: Warsaw, Poland, 1976. [Google Scholar]
- Busch, A.; Gensterblum, Y.; Krooss, B.M.; Littke, R. Methane and carbon dioxide adsorption–diffusion experiments on coal: Upscaling and modeling. Int. J. Coal Geol. 2004, 60, 151–168. [Google Scholar] [CrossRef]
- Bustin, R.M.; Bustin, A.M.M.; Cui, A.; Ross, D.; Pathi, V.M. Impact of Shale Properties on Pore Structure and Storage Characteristics. Presented at the SPE Shale Gas Production Conference, Fort Worth, TX, USA, 16–18 November 2008. Paper Number: SPE-119892-MS. [Google Scholar] [CrossRef]
- Mastalerz, M.; He, L.; Melnichenko, Y.B.; Rupp, J.A. Porosity of coal and shale: Insights from gas adsorption and SANS/USANS techniques. Energy Fuels 2012, 26, 5109–5120. [Google Scholar] [CrossRef]
- Karayiğit, A.İ.; Mastalerz, M.; Oskay, R.G.; Gayer, R.A. Coal petrography, mineralogy, elemental compositions and palaeoenvironmental interpretation of Late Carboniferous coal seams in three wells from the Kozlu coalfield (Zonguldak Basin, NW Turkey). Int. J. Coal Geol. 2018, 187, 54–70. [Google Scholar] [CrossRef]
- Karayigit, A.İ.; Bircan, C.; Oskay, R.G.; Türkmen, İ.; Querol, X. The geology, mineralogy, petrography, and geochemistry of the Miocene Dursunbey coal within fluvio-lacustrine deposits, Balıkesir (Western Turkey). Int. J. Coal Geol. 2020, 228, 103548. [Google Scholar] [CrossRef]
- Liu, X.; Nie, B.; Wang, W.; Wang, Z.; Zhang, L. The use of AFM in quantitative analysis of pore characteristics in coal and coal-bearing shale. Mar. Pet. Geol. 2019, 105, 331–337. [Google Scholar] [CrossRef]
- Ergun, S. Fluid flow through packed columns. Chem. Eng. Prog. 1952, 48, 89–94. [Google Scholar]
- Brauer, H. Grundlagen der Einphasen—Und Mehrphasenströmungen; Säuerländer: Frankfurt am Main, Germany, 1971. [Google Scholar]
- Tallmadge, J.A. Packed bed pressure drop—An extension to higher Reynolds numbers. AIChE J. 1970, 16, 1092–1093. [Google Scholar] [CrossRef]
- Burke, S.P.; Plummer, W.B. Gas Flow through Packed Columns. Ind. Eng. Chem. 1928, 20, 1196–1200. [Google Scholar] [CrossRef]
- Kembłowski, Z.; Michałowski, S.; Strumiłło, C.; Zarzycki, R. Theoretical Foundations of Chemical and Process Engineering; WNT: Warszawa, Poland, 1985. [Google Scholar]
- Zaworonkow, M.N. Gidrawliczeskije Osnowy Skrubbernogo Processa i Tiepłopieredacza w Skrubberach; Izd. Sow. Nauka: Moscow, Russia, 1944. (In Russian) [Google Scholar]
- Windsperger, A. Abschätzung von spezifischer Oberfläche und Lückengrad bei biologischen Abluftreinigungsanlagen durch Vergleich von berechneten und experimentell erhaltenen Druckverlustwerten. Chem. Eng. Technol. 1991, 63, 80–81. [Google Scholar] [CrossRef]
- Peszyńska, M.; Trykozko, A. Pore-to-Core simulations of flow with large velocities using continuum models and imaging data. Comput. Geosci. 2013, 17, 623–645. [Google Scholar] [CrossRef]
- Bear, J.; Cheng, A. Modeling Groundwater Flow and Contaminant Transport; Springer: New York, NY, USA, 2010. [Google Scholar]
- Wałowski, G. Model of Flow Resistance Coefficient for a Fragment of a Porous Material Deposit with Skeletal Structure. Energies 2021, 14, 3355. [Google Scholar] [CrossRef]
Figure 1.
UCG shaft method: (a) streamlined, (b) open, (c) blind, (d) legend, acc. to [5]. Reproduced from [5], the publisher: Springer Nature Switzerland AG. 2011.
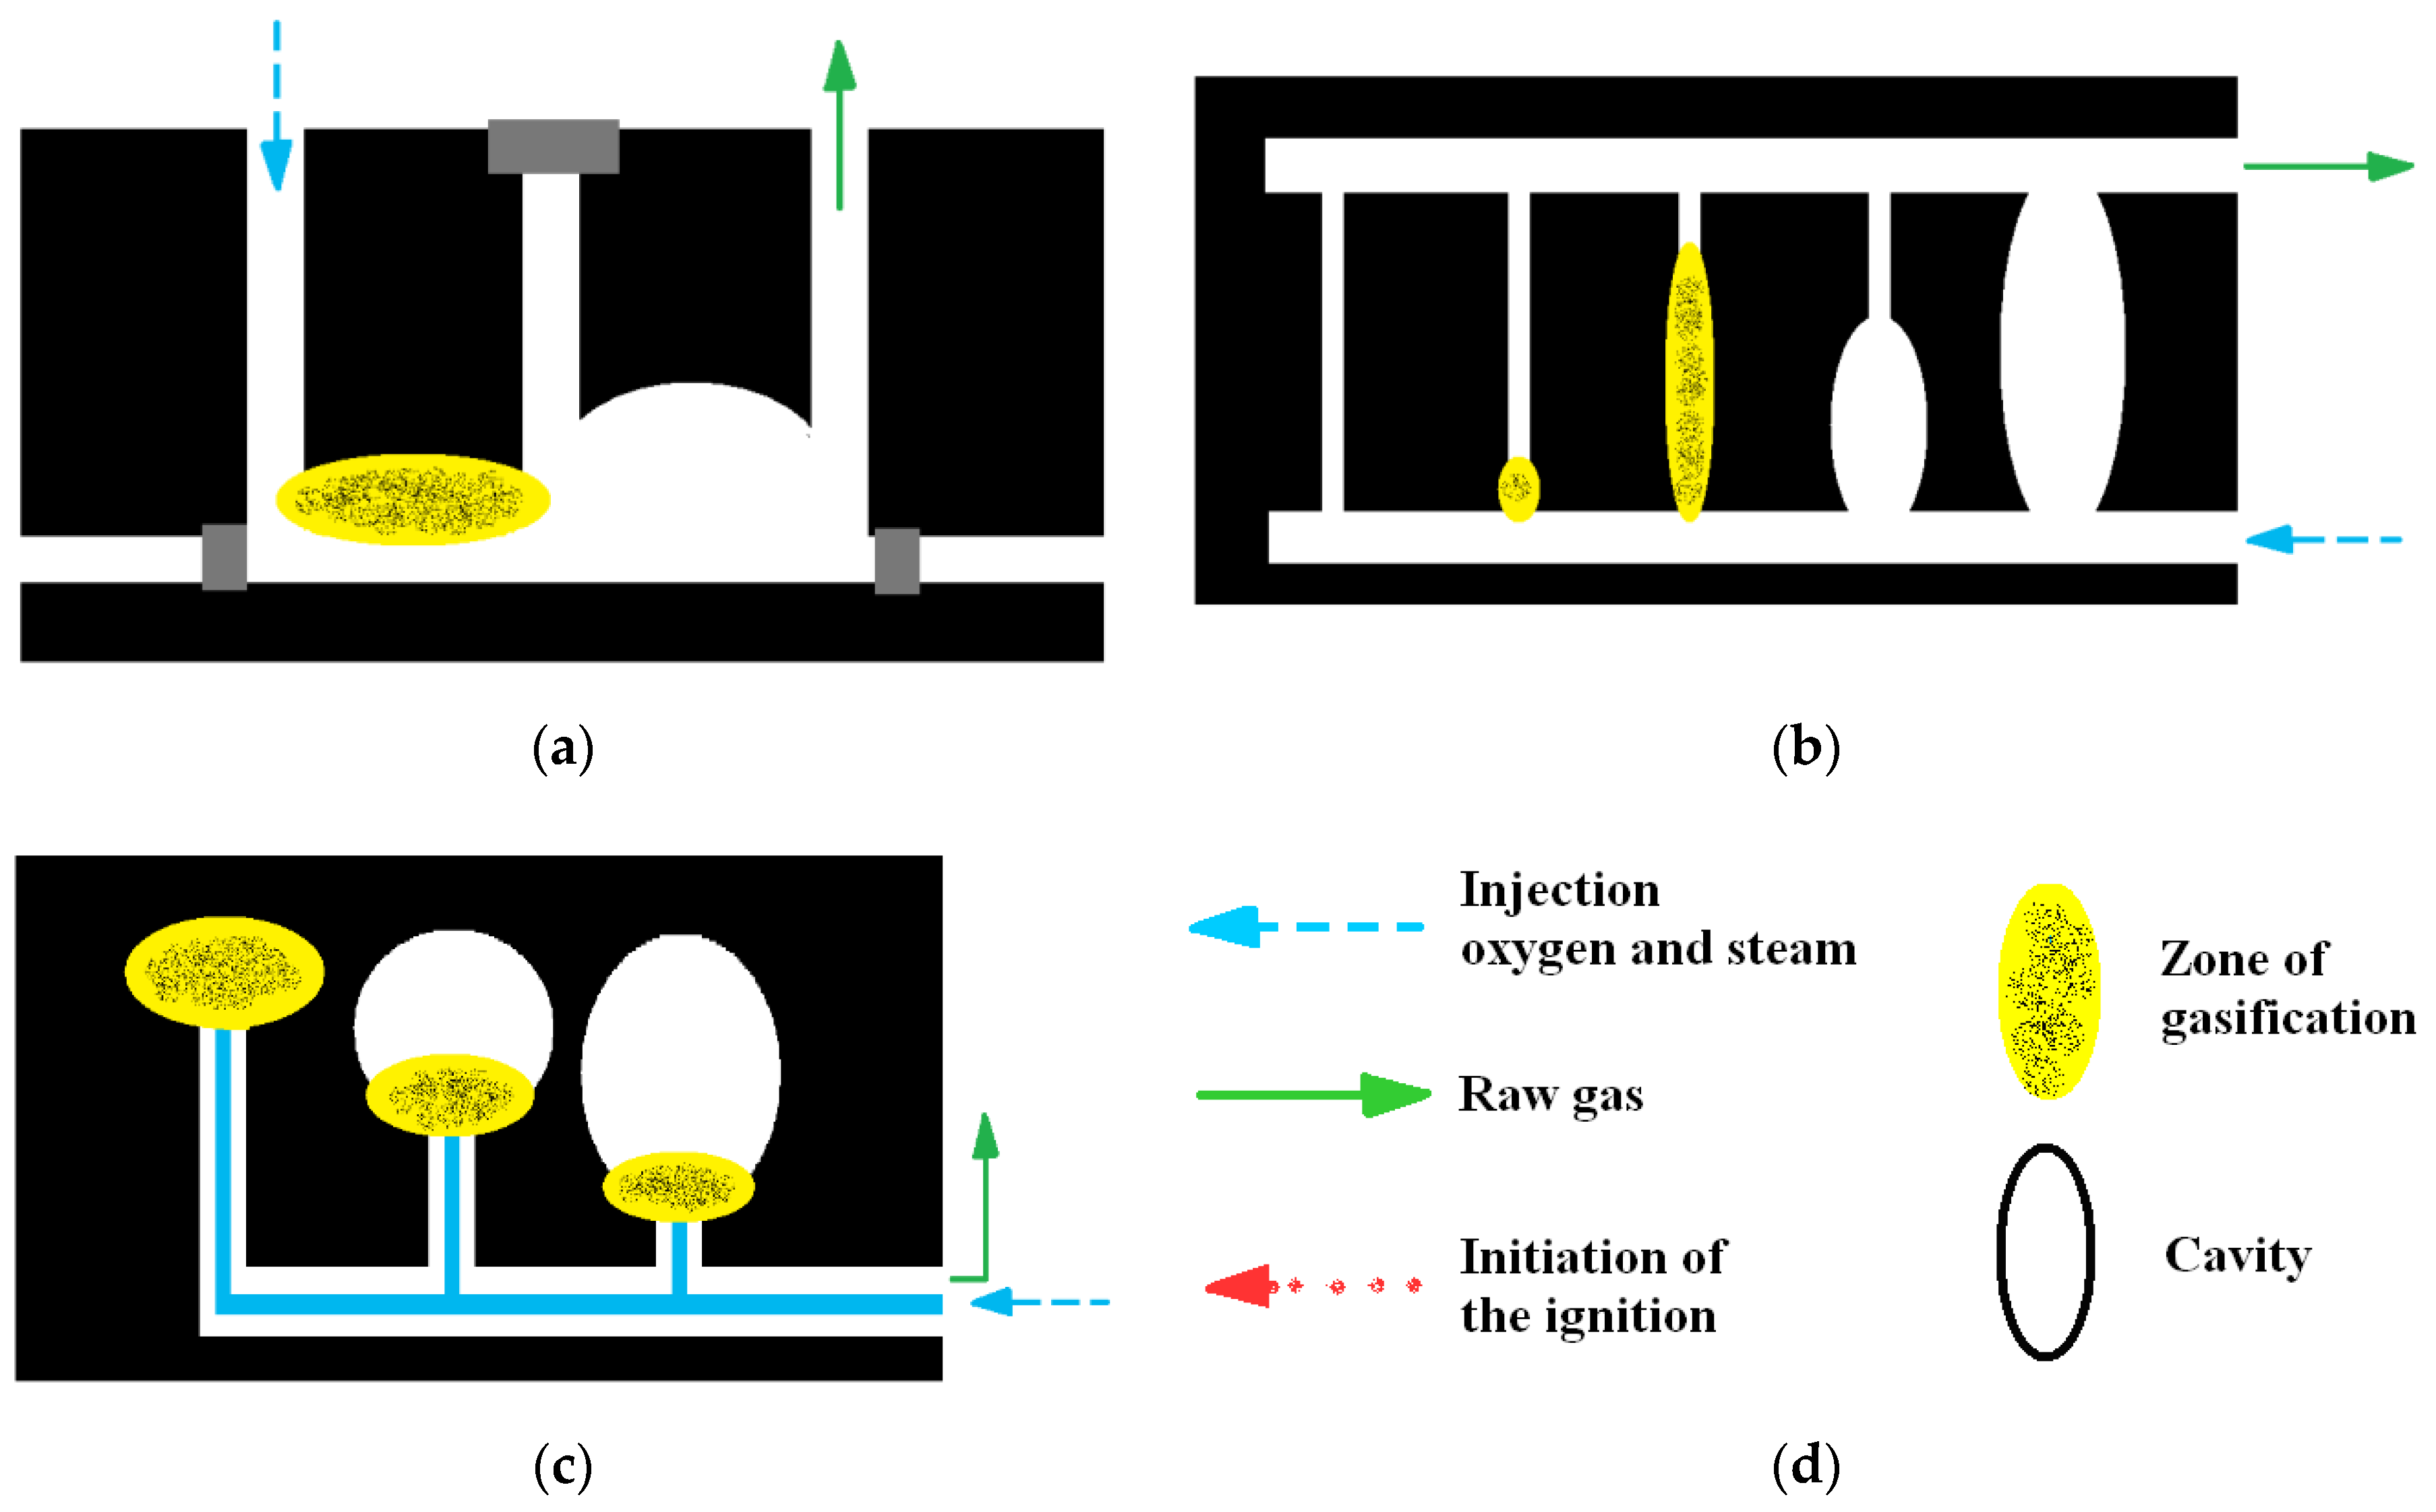
Figure 2.
Experiment of the gasification coal: (a) reactor ex situ, (b) block of the hard bituminous coal, [6]. Reproduced from [6], the publisher: Publications Office of the European Union2012.
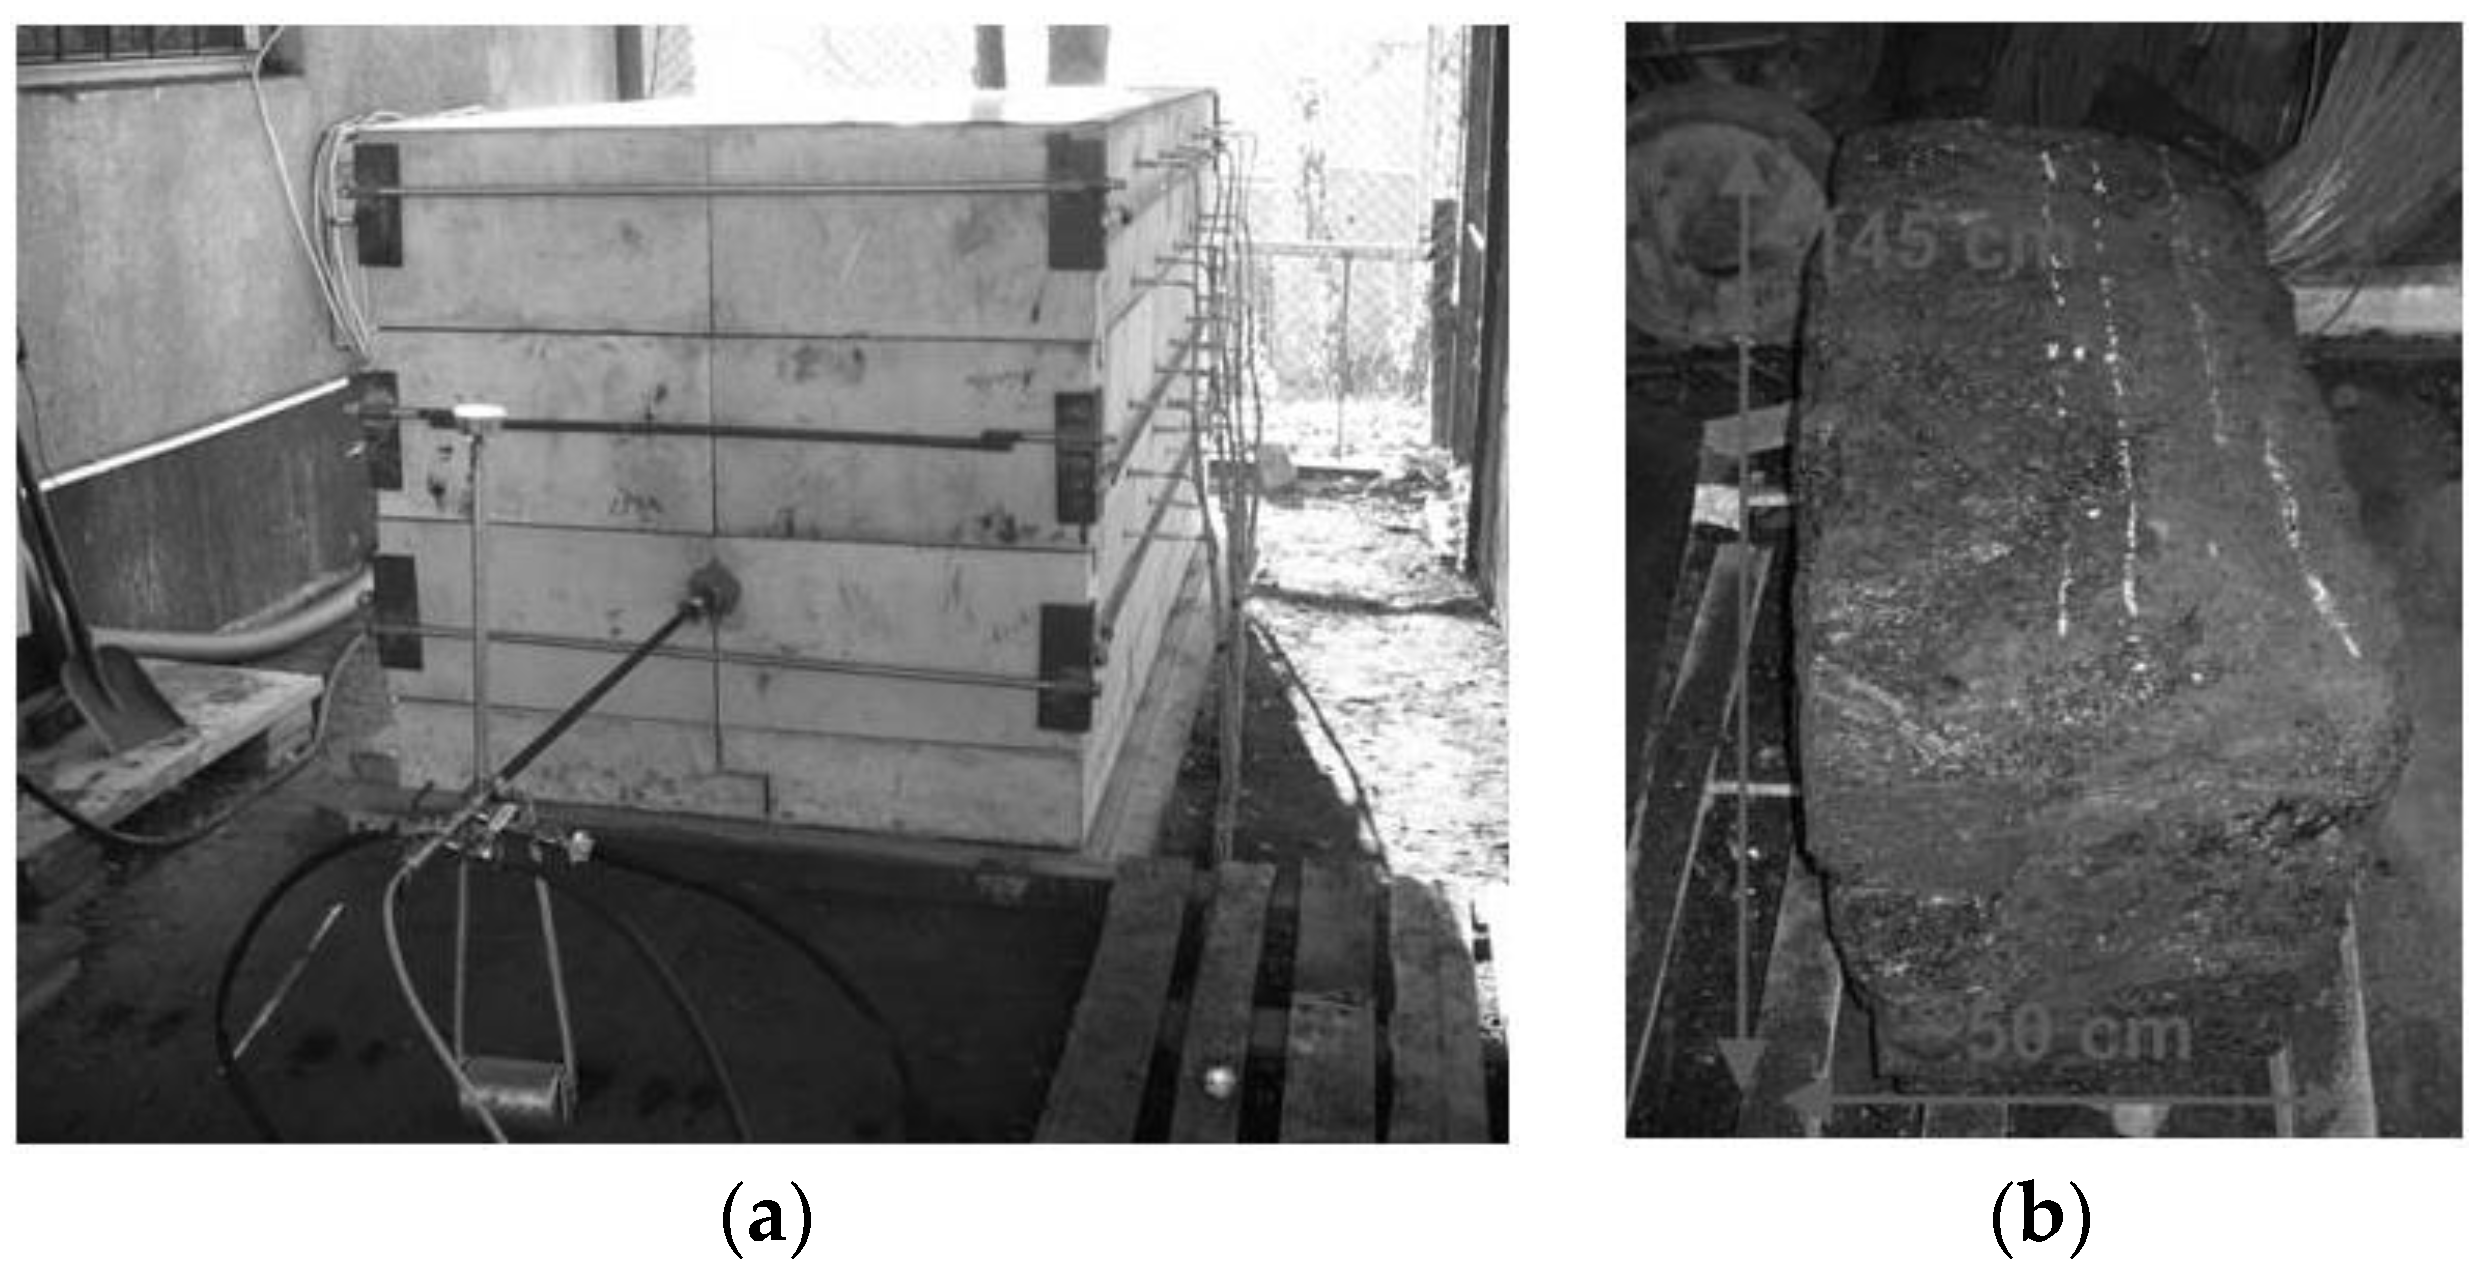
Figure 3.
CRIP un-shaft method: (a) I—th generation, (b) II—second generation “Knife Edge”, (own elaboration).
Figure 3.
CRIP un-shaft method: (a) I—th generation, (b) II—second generation “Knife Edge”, (own elaboration).
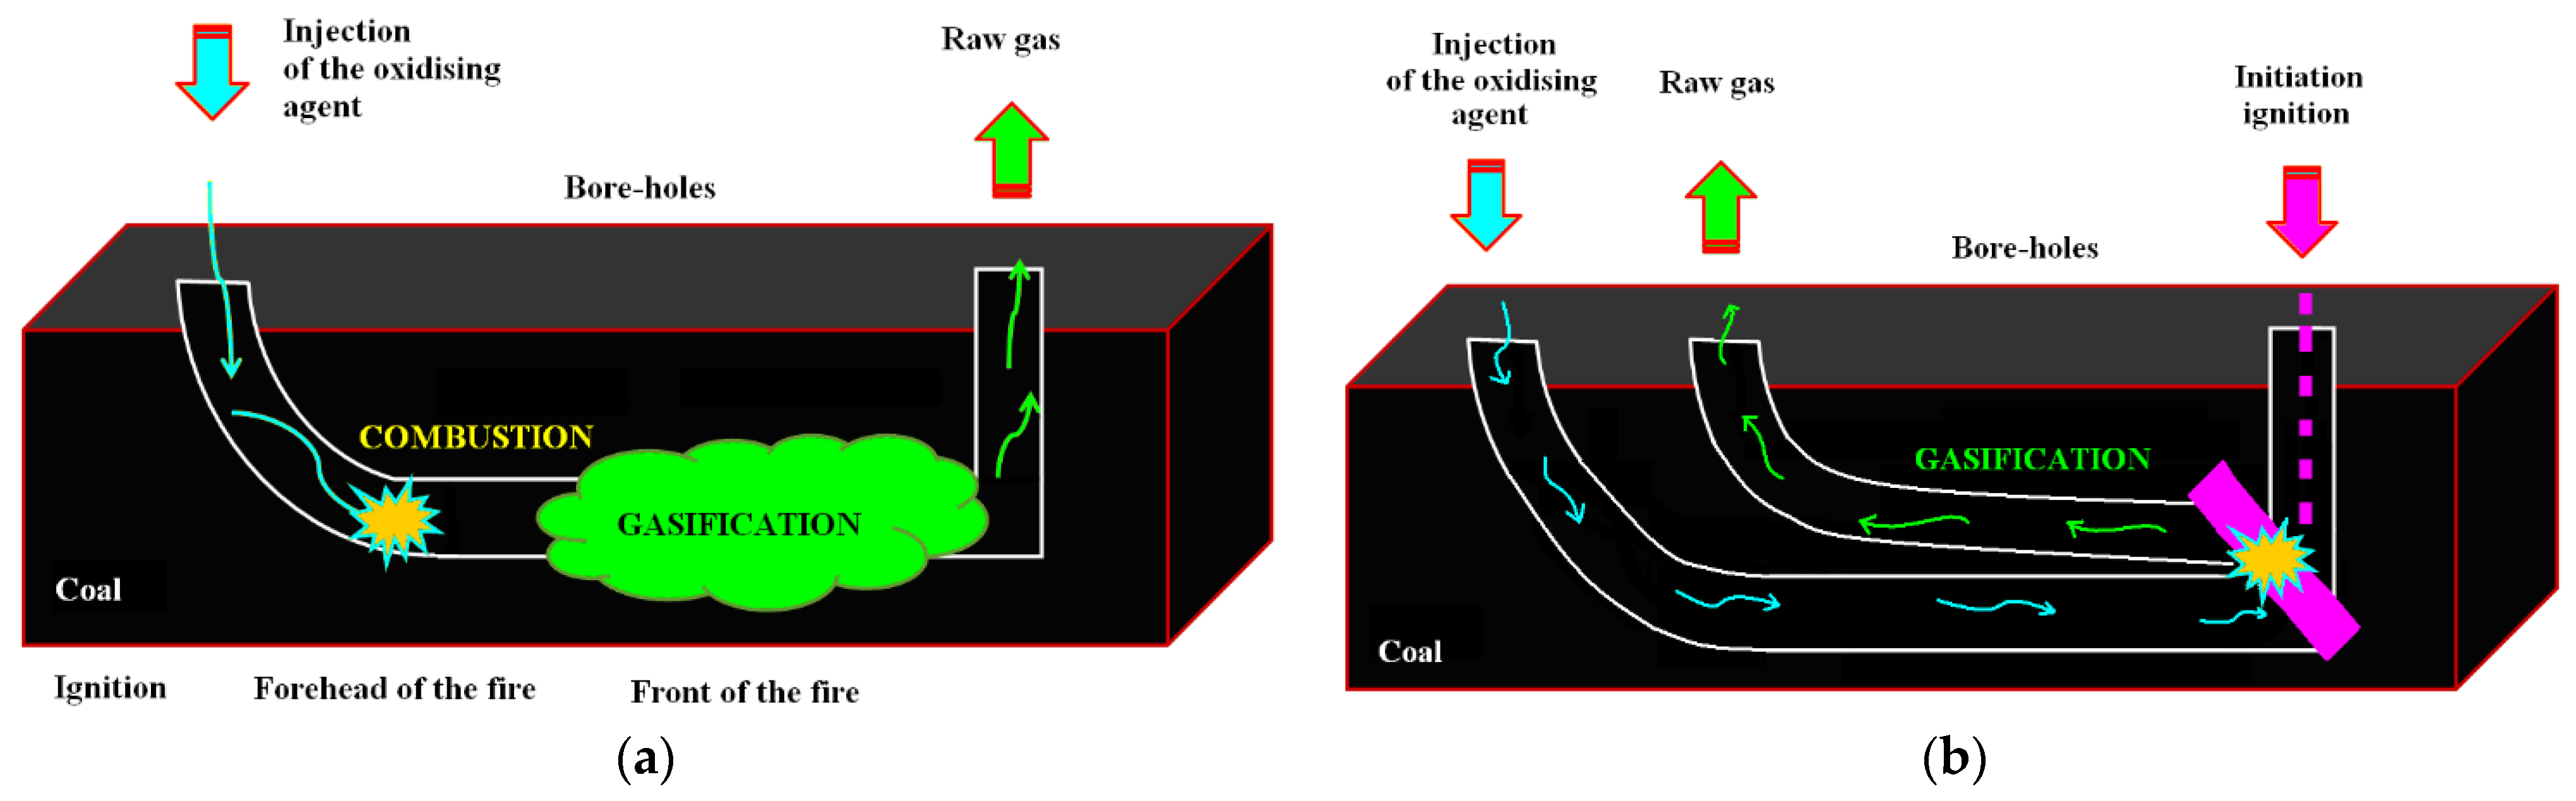
Figure 4.
UCG trial: (a) Rocky Mountainn, Wyoming (USA), (b) Chinchila (Australia), (c) El Tremedal (Spain), [9]. Reproduced from [9], the publisher: CREATIVETIME 2012.

Figure 5.
Method SDS of processing in georeactor, [10]. Reproduced from [10], the publisher: Poligraf 2011.

Figure 6.
Part of the cycle of processing in SDS georeactor system, [10]. Reproduced from [10], the publisher: Poligraf 2011.
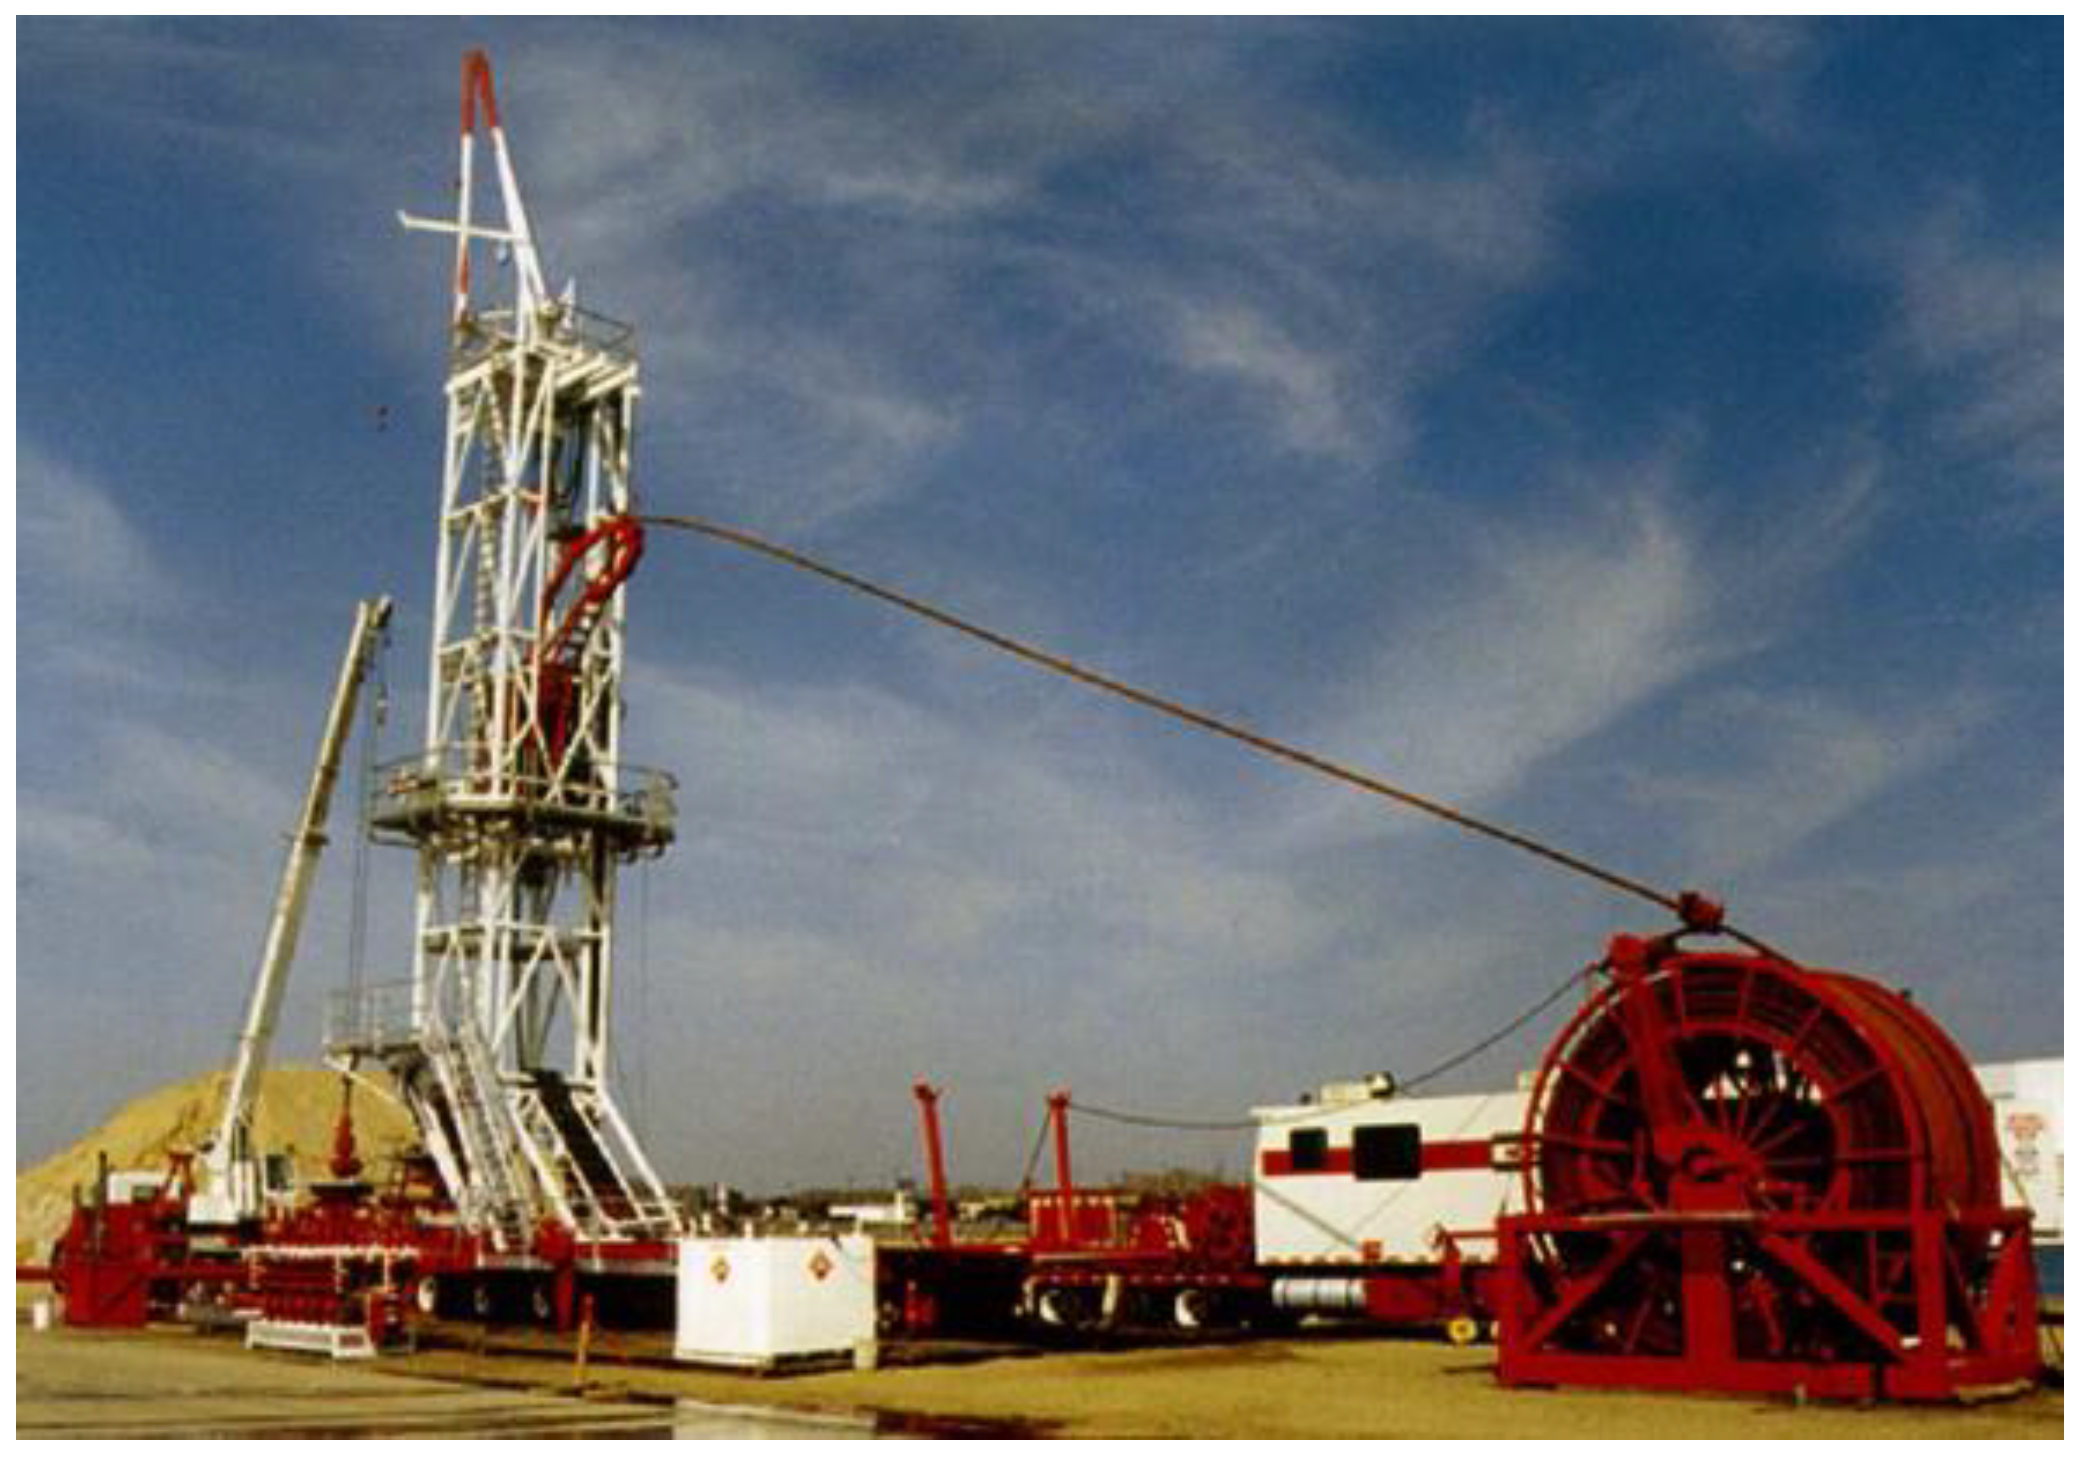
Figure 7.
Model of the porous structure of coal according to Seewald, acc. to [11]. Reproduced from [11], the publisher: Gluckauf Forsch 1985.
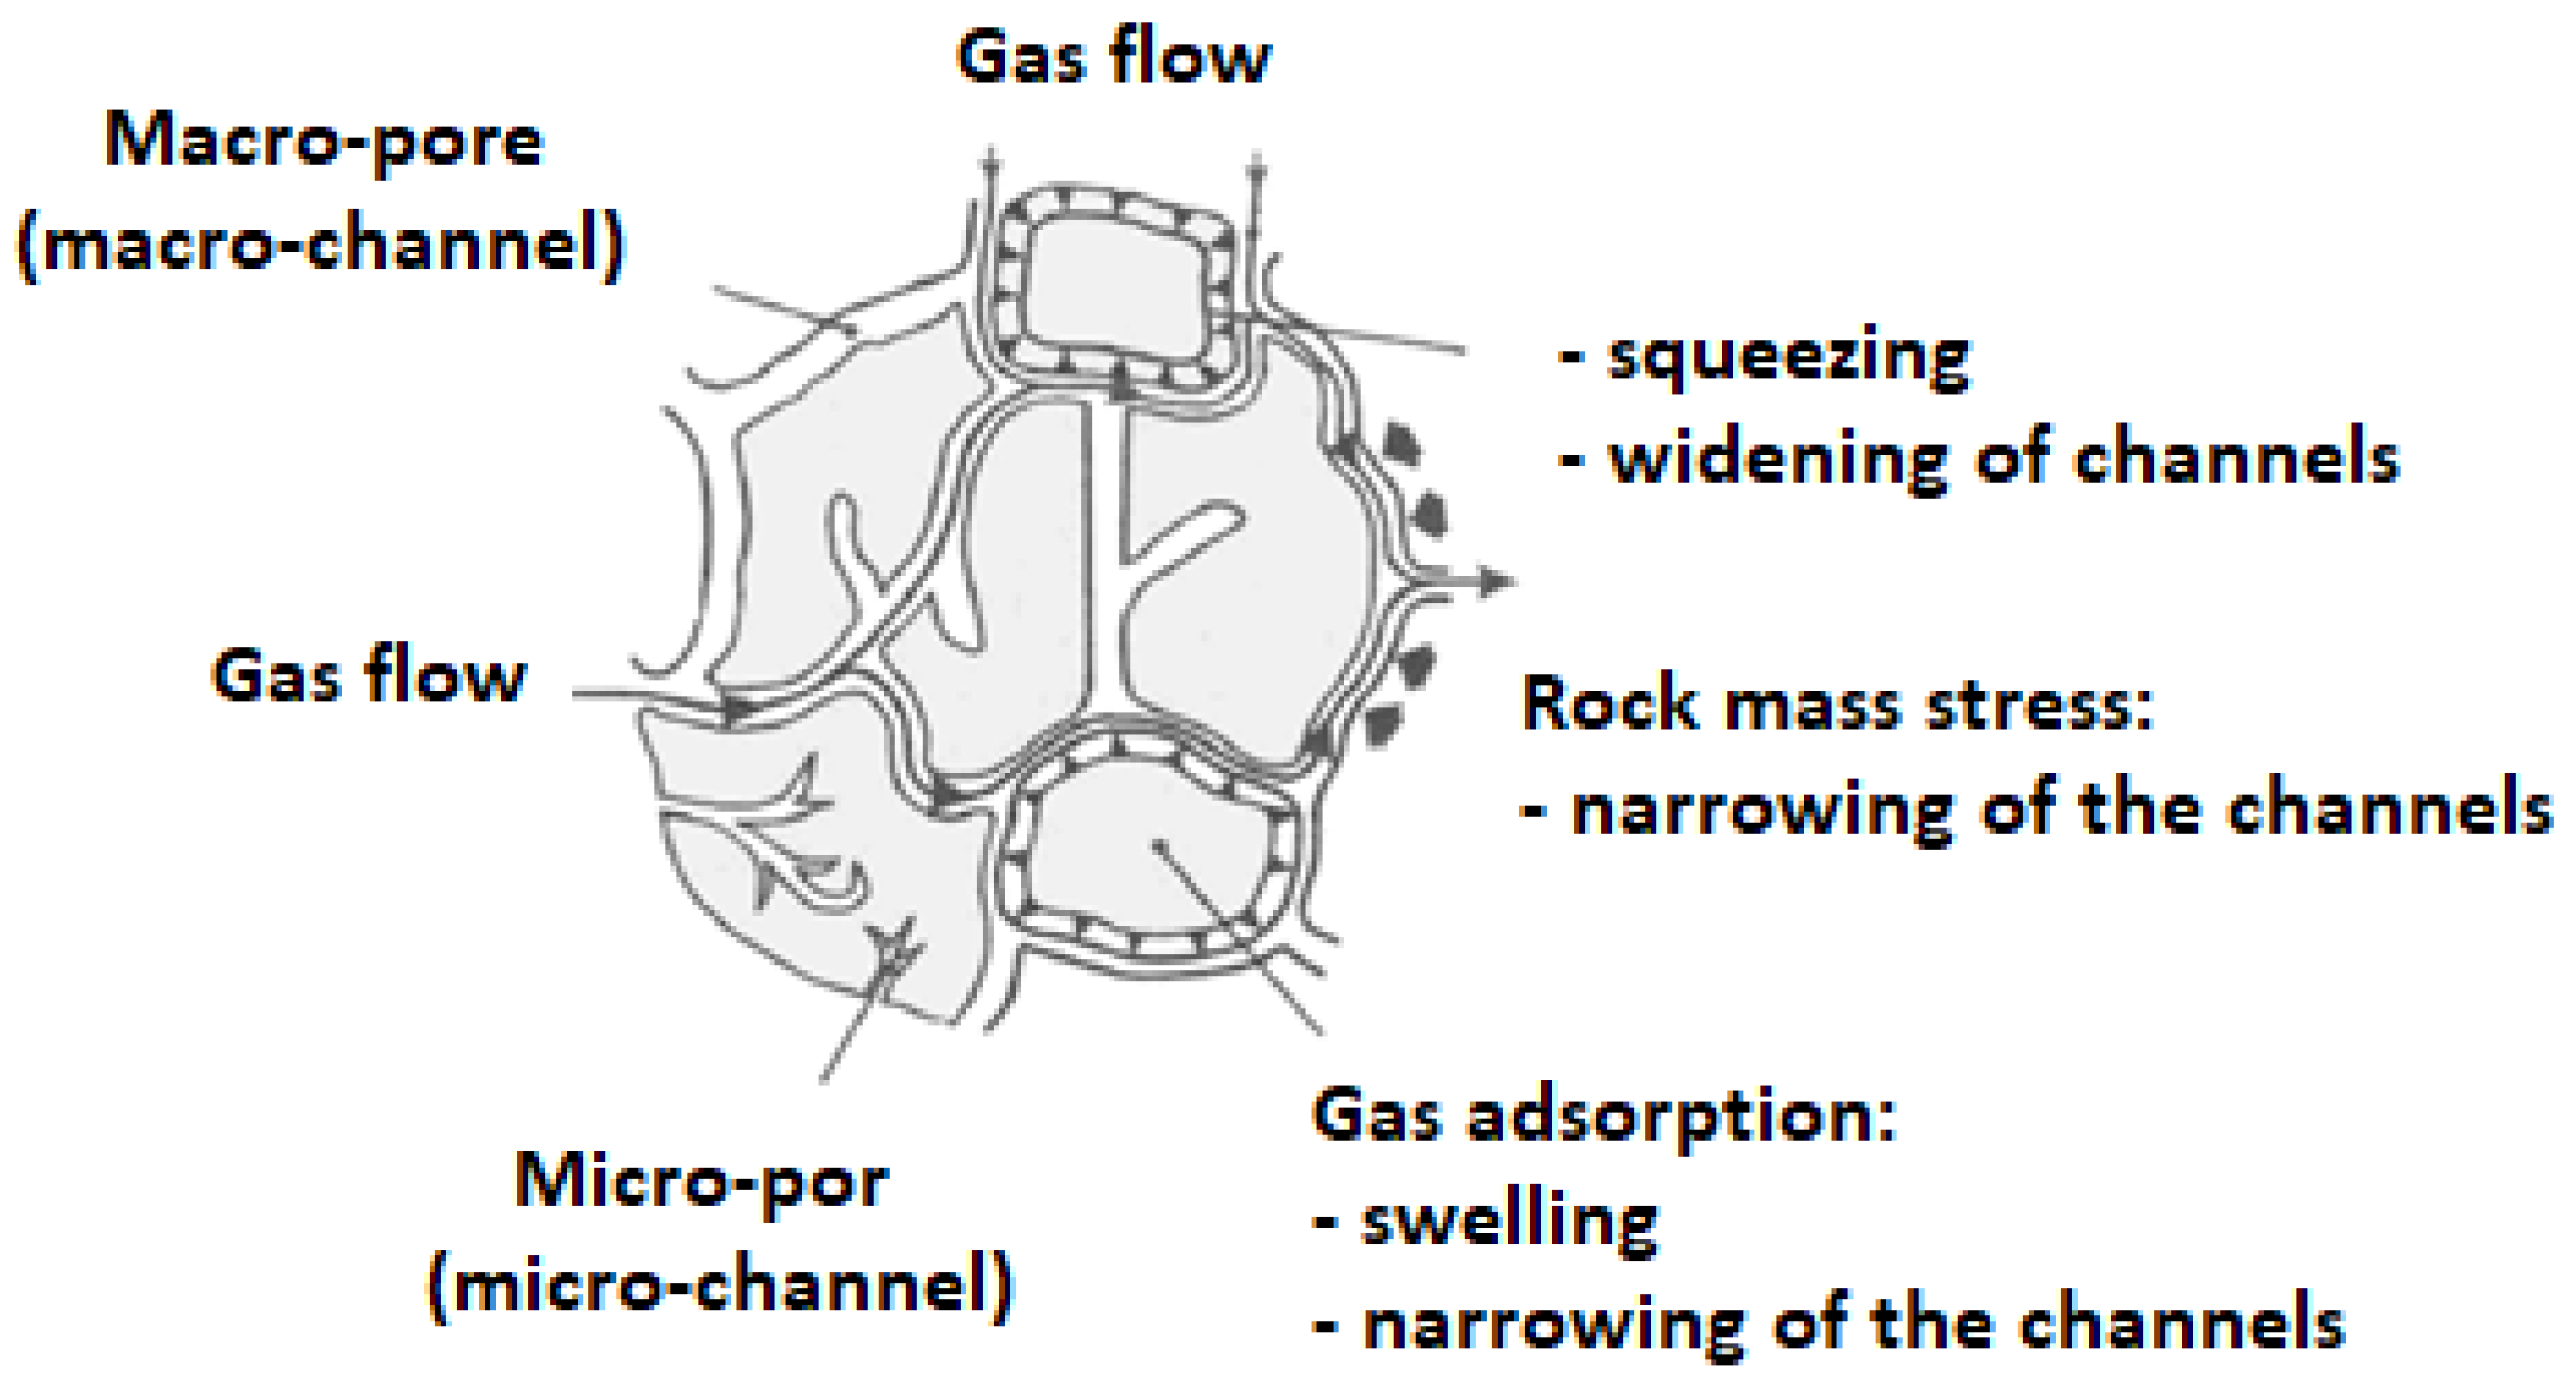
Figure 8.
Models of gas movement in a fractured porous medium, acc. to [18]. Reproduced from [18], the publisher: Elsevier Science 1988.
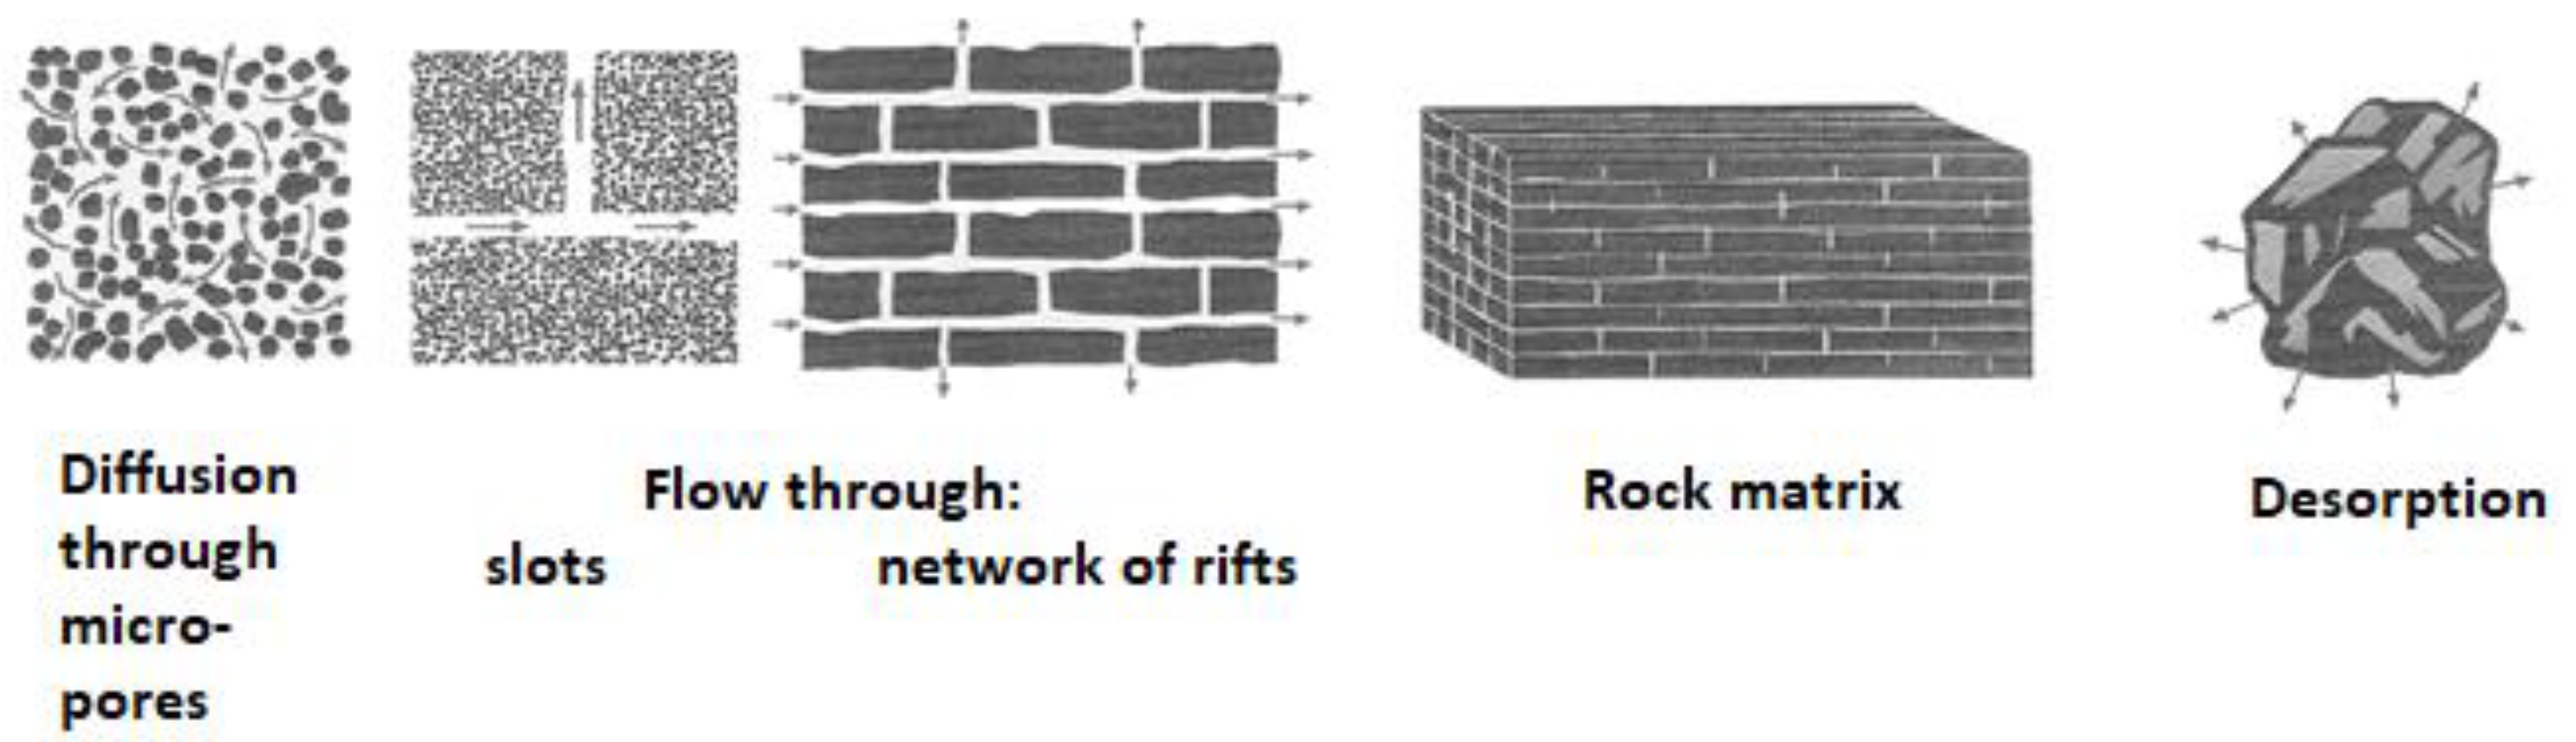
Figure 9.
Research material samples: (a) char (carbonizate) in situ, (b) melted waste rock in situ (Photography by Grzegorz Wałowski).
Figure 9.
Research material samples: (a) char (carbonizate) in situ, (b) melted waste rock in situ (Photography by Grzegorz Wałowski).
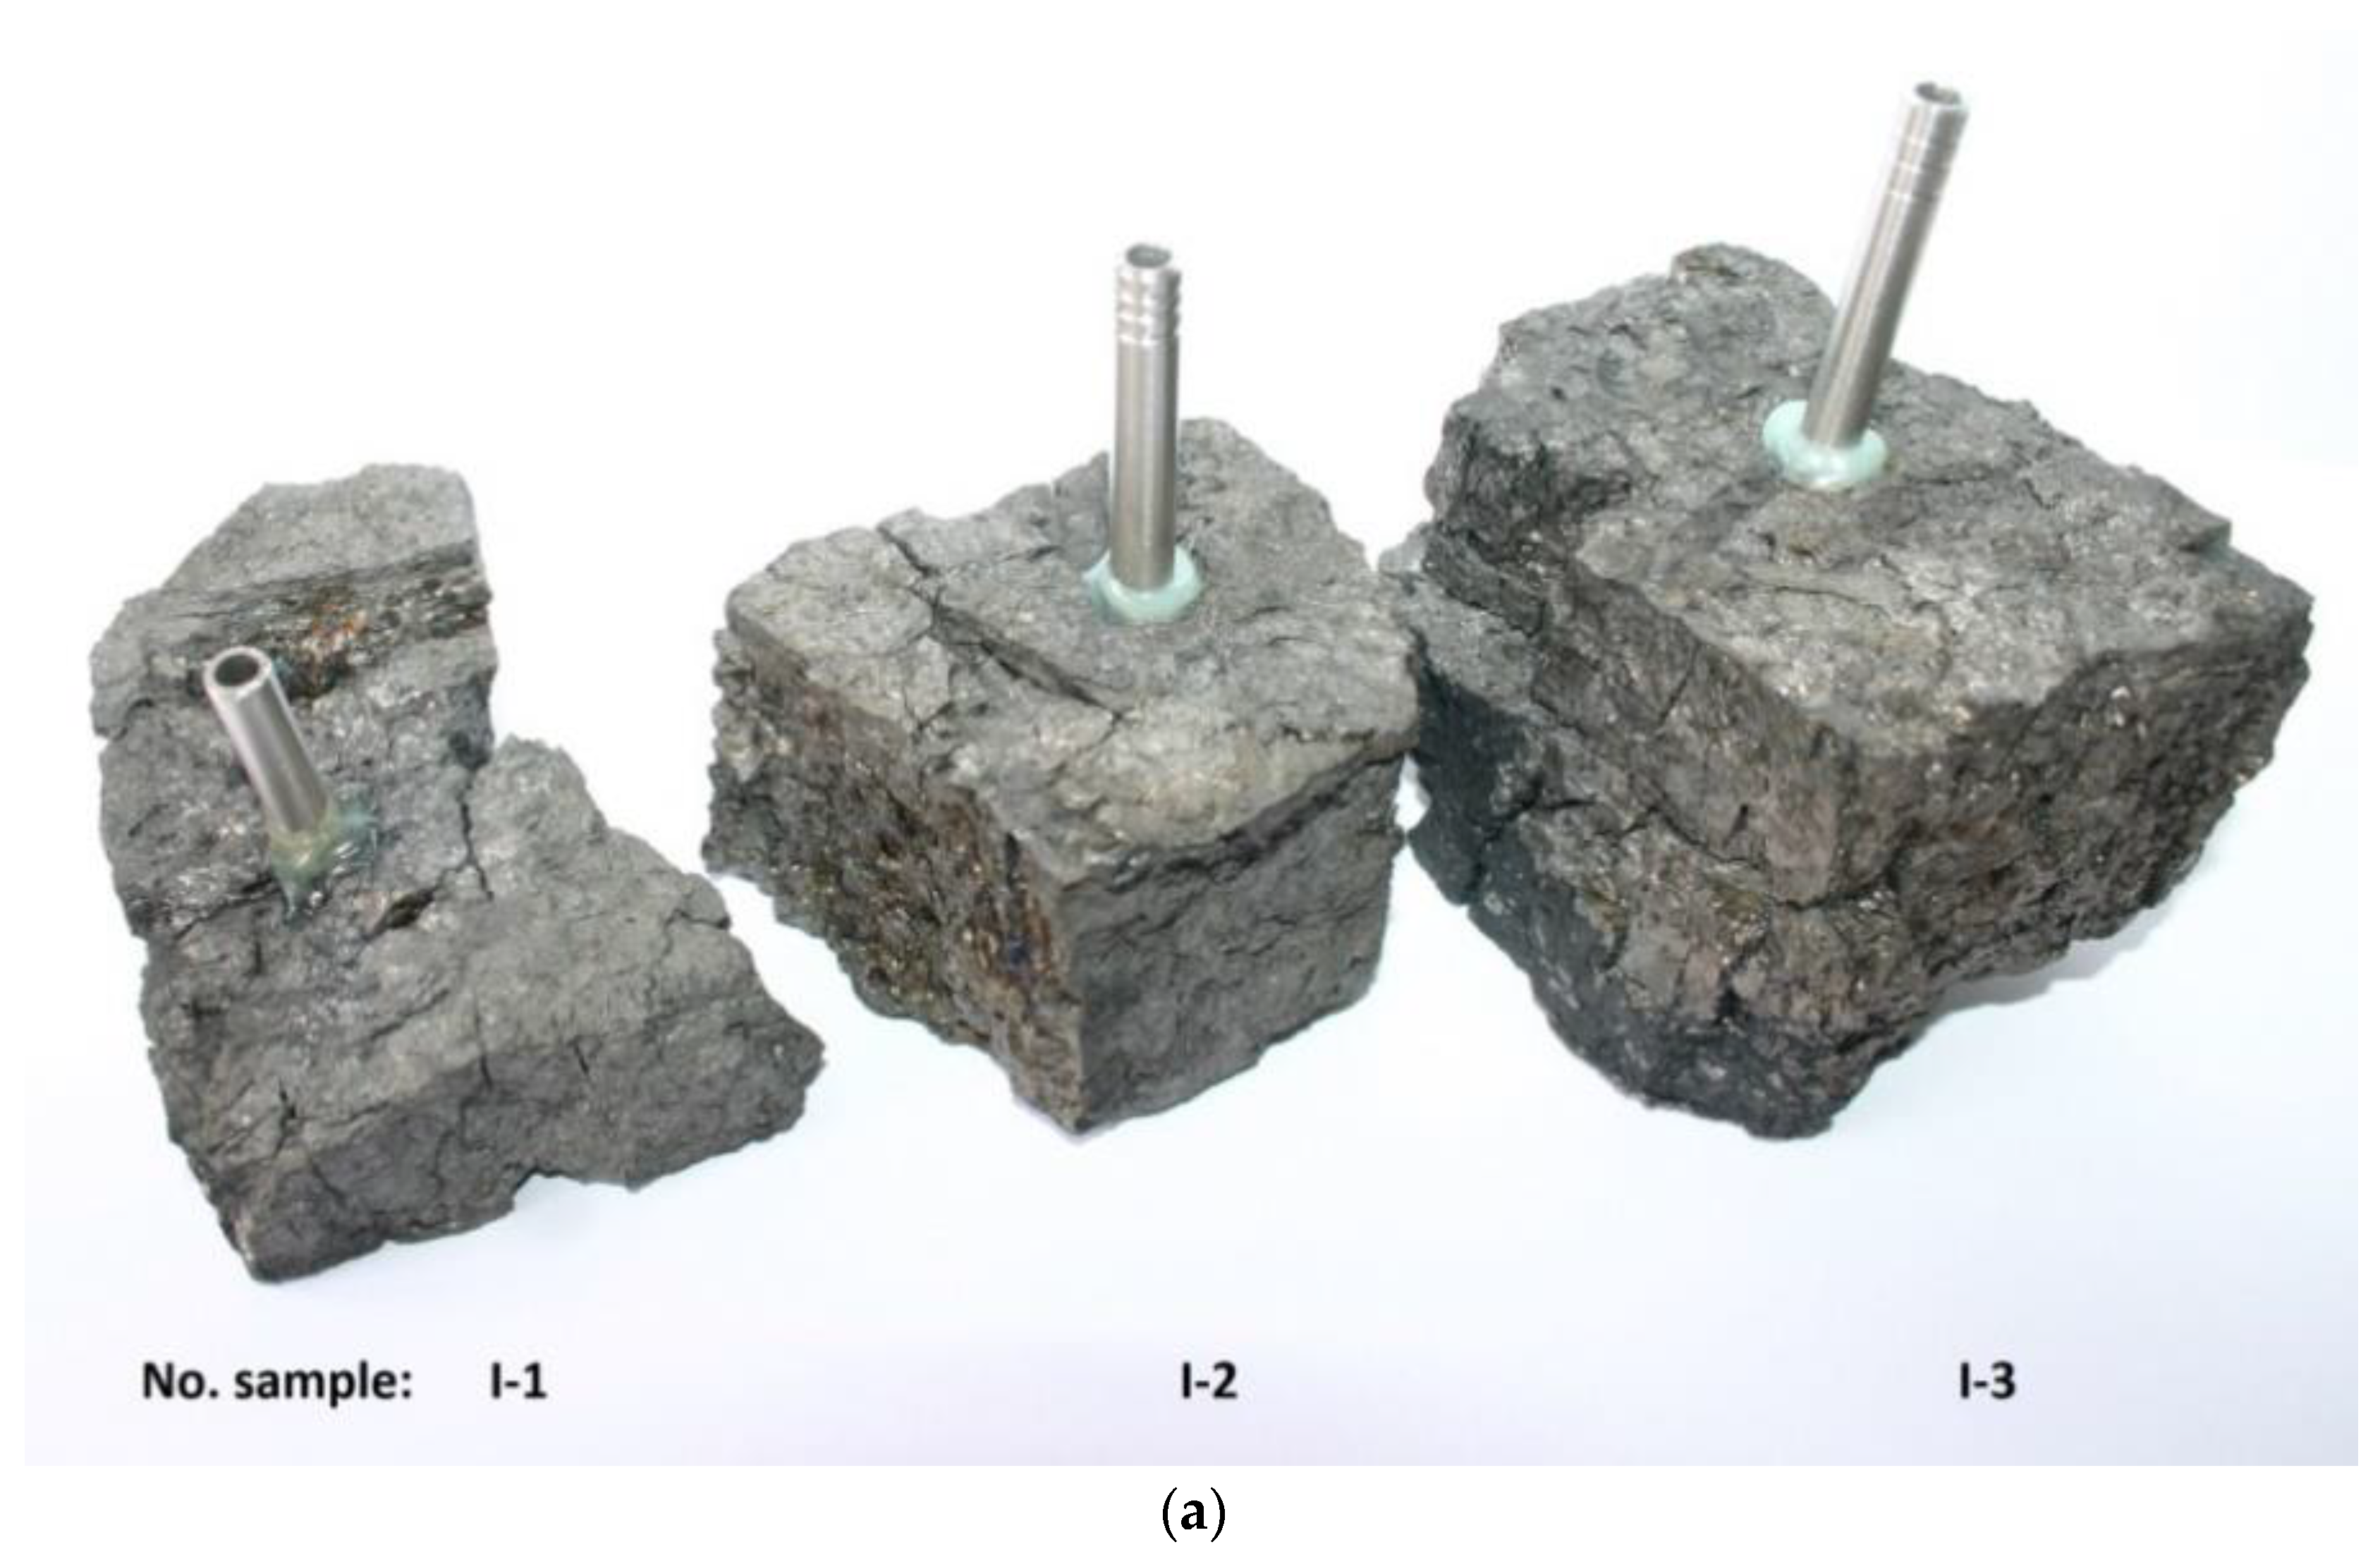
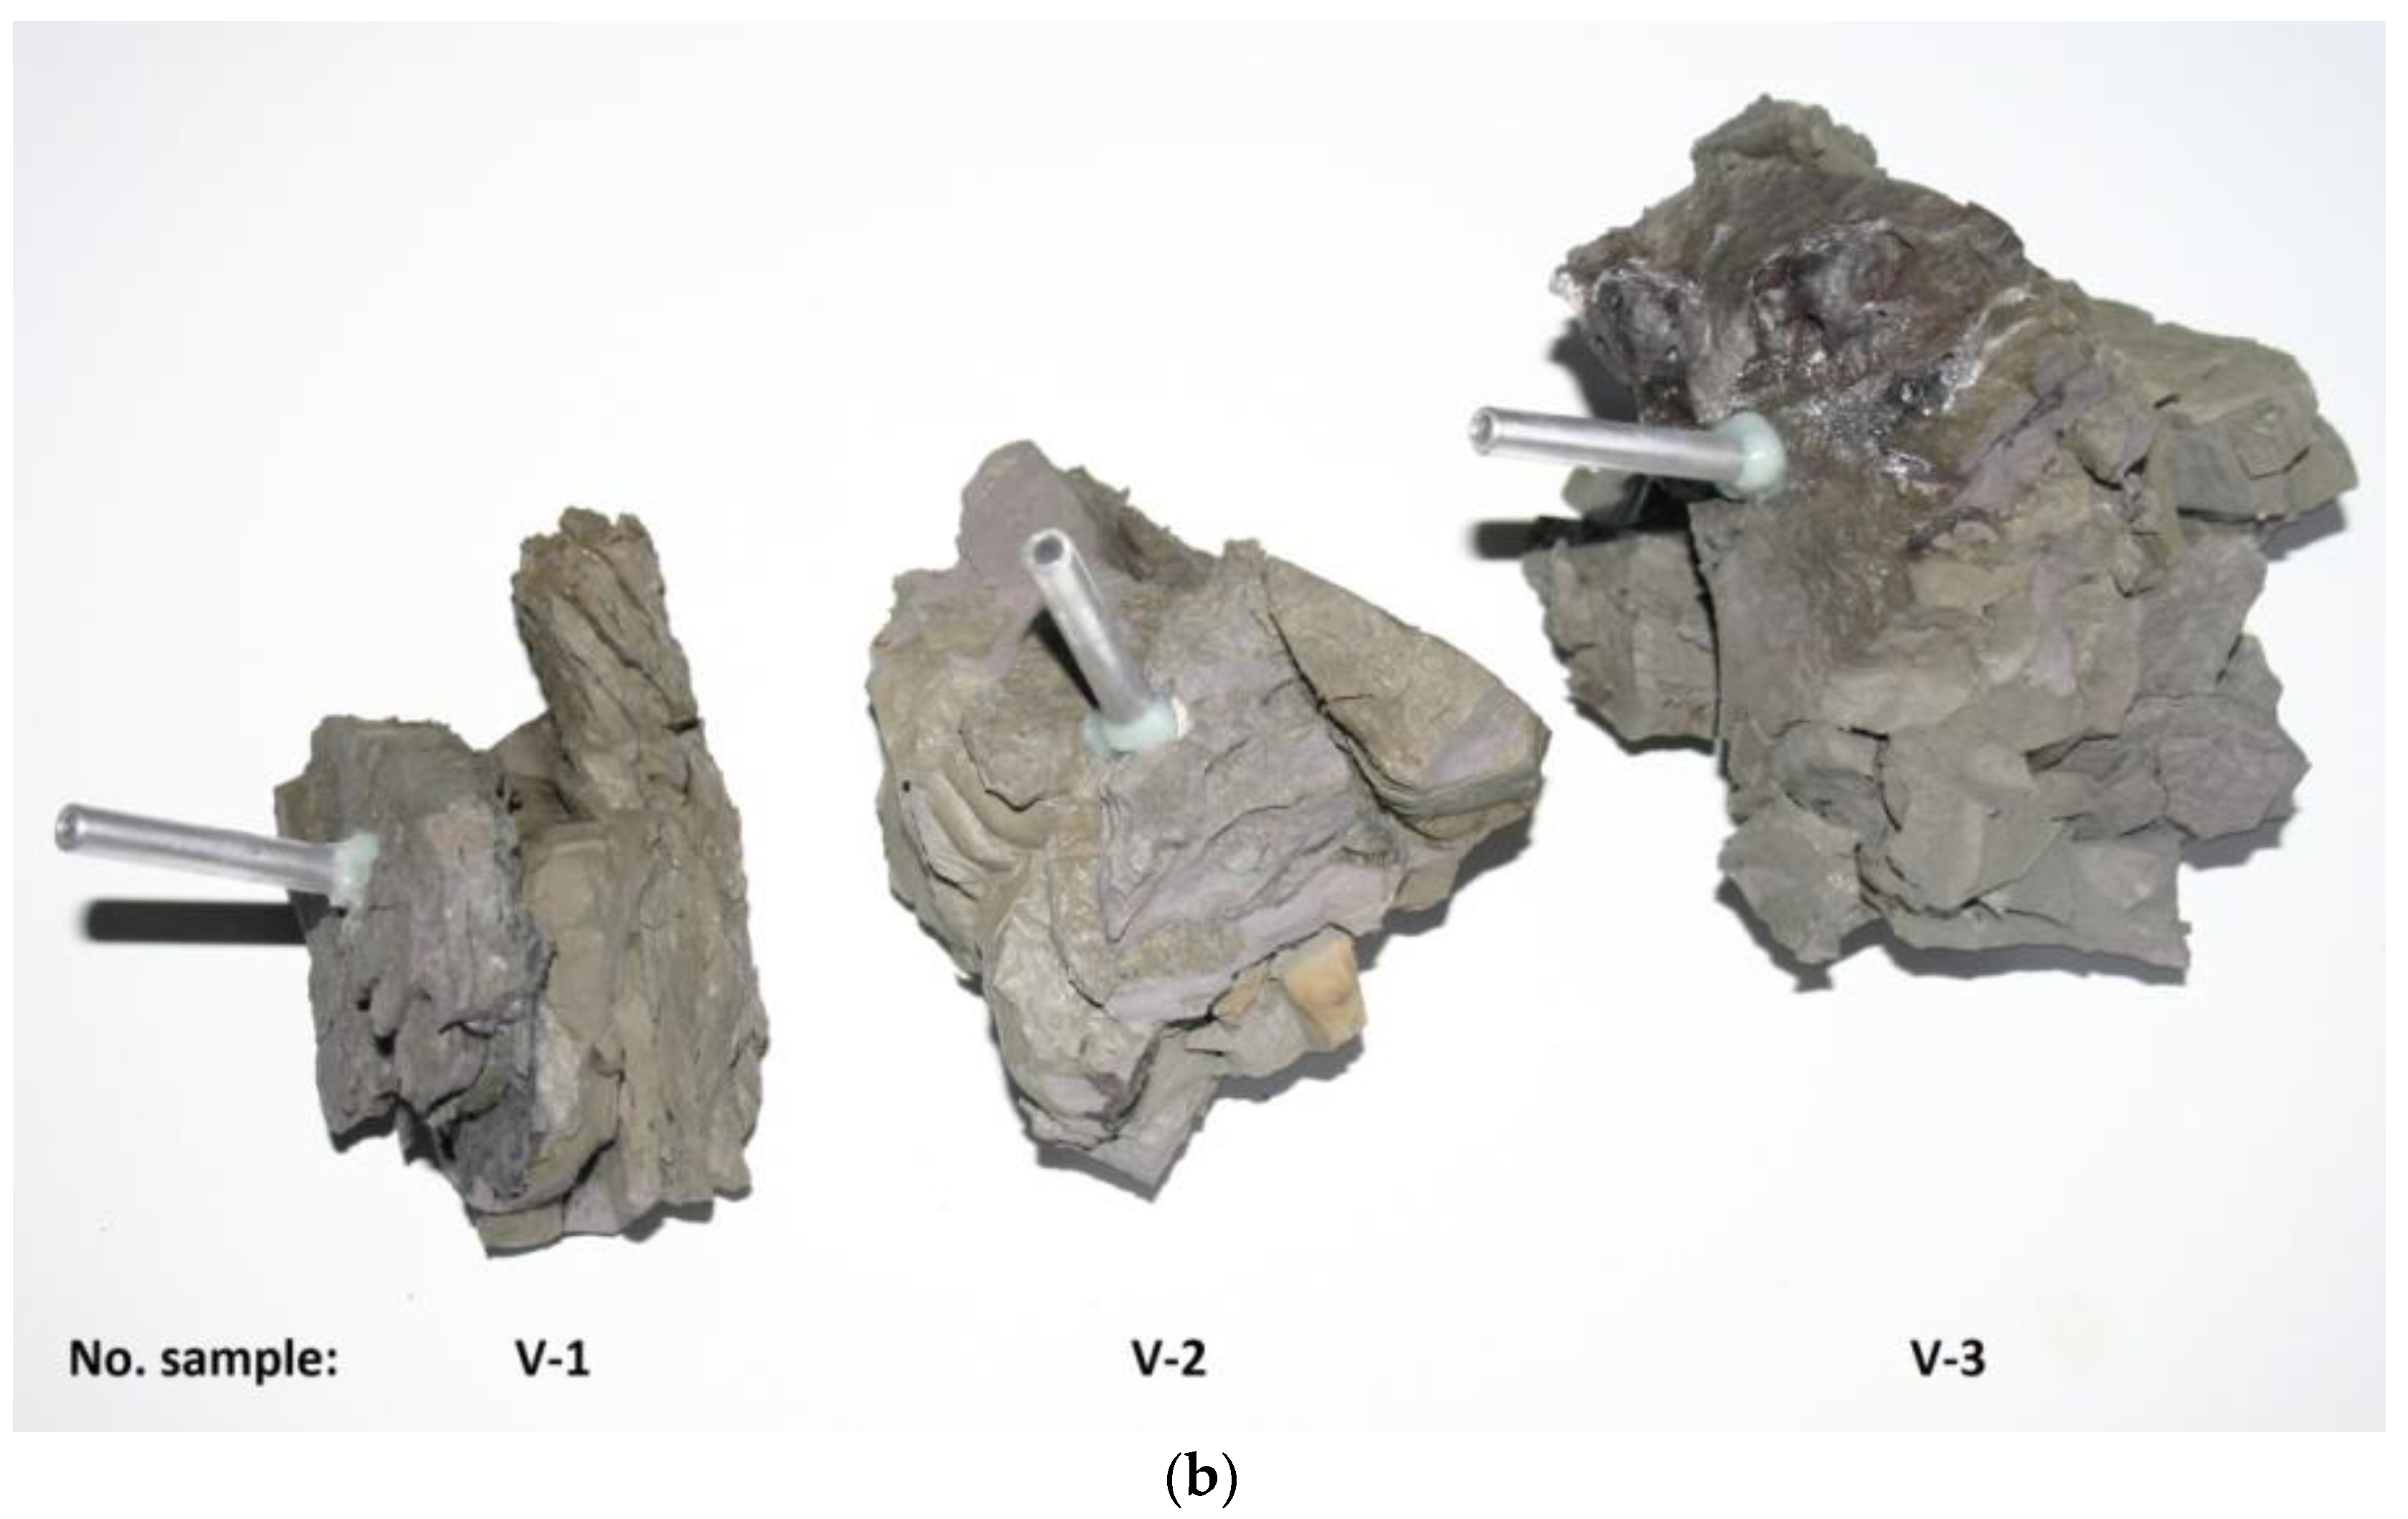
Figure 10.
Scheme of the measuring system for testing the permeability of a porous material in bubble conditions (own elaboration): 1—porous material (sample), 2—differential pressure manometer, 3—rotameter (3 and bubble flow meter), 4—pressure reducers, 5—control valve, P—pressure gauge, T—thermometer.

Figure 11.
Flow of gas in bubbling conditions (Photo by Grzegorz Wałowski): (a) char (carbonizer) I-1; (b) melted waste rock V-3.
Figure 11.
Flow of gas in bubbling conditions (Photo by Grzegorz Wałowski): (a) char (carbonizer) I-1; (b) melted waste rock V-3.
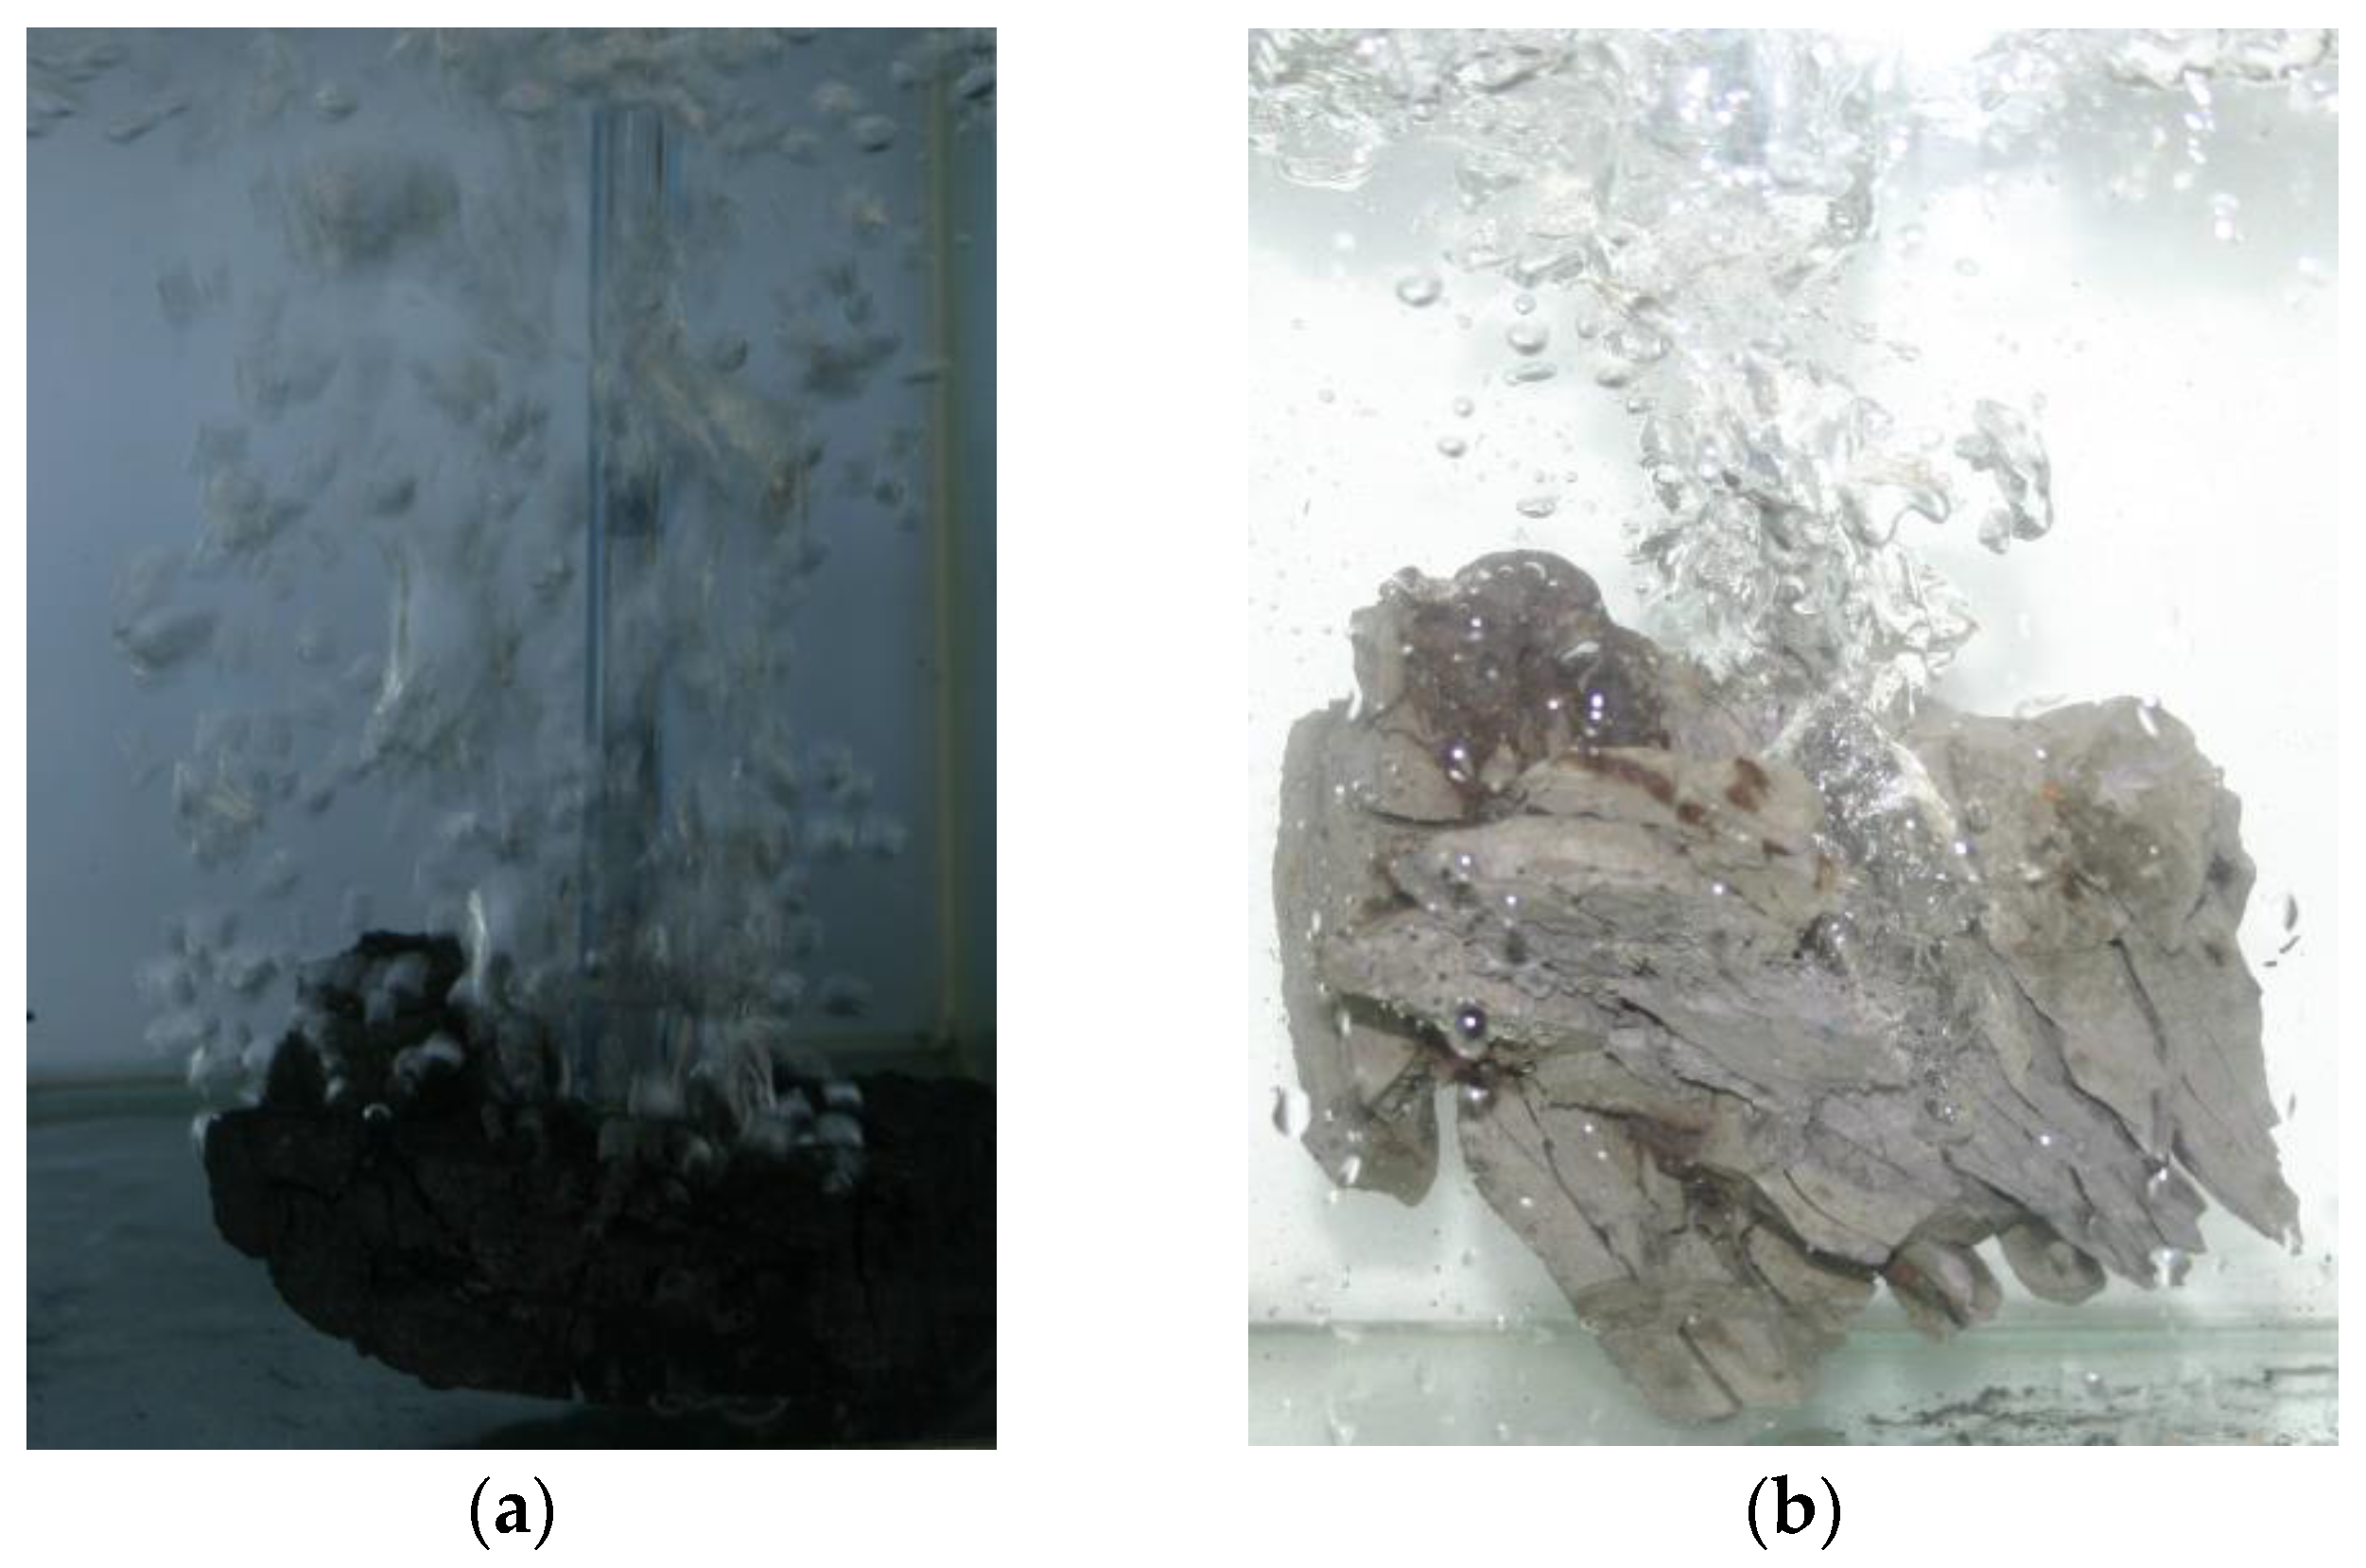
Figure 12.
Volumetric sample feed system (own elaboration).
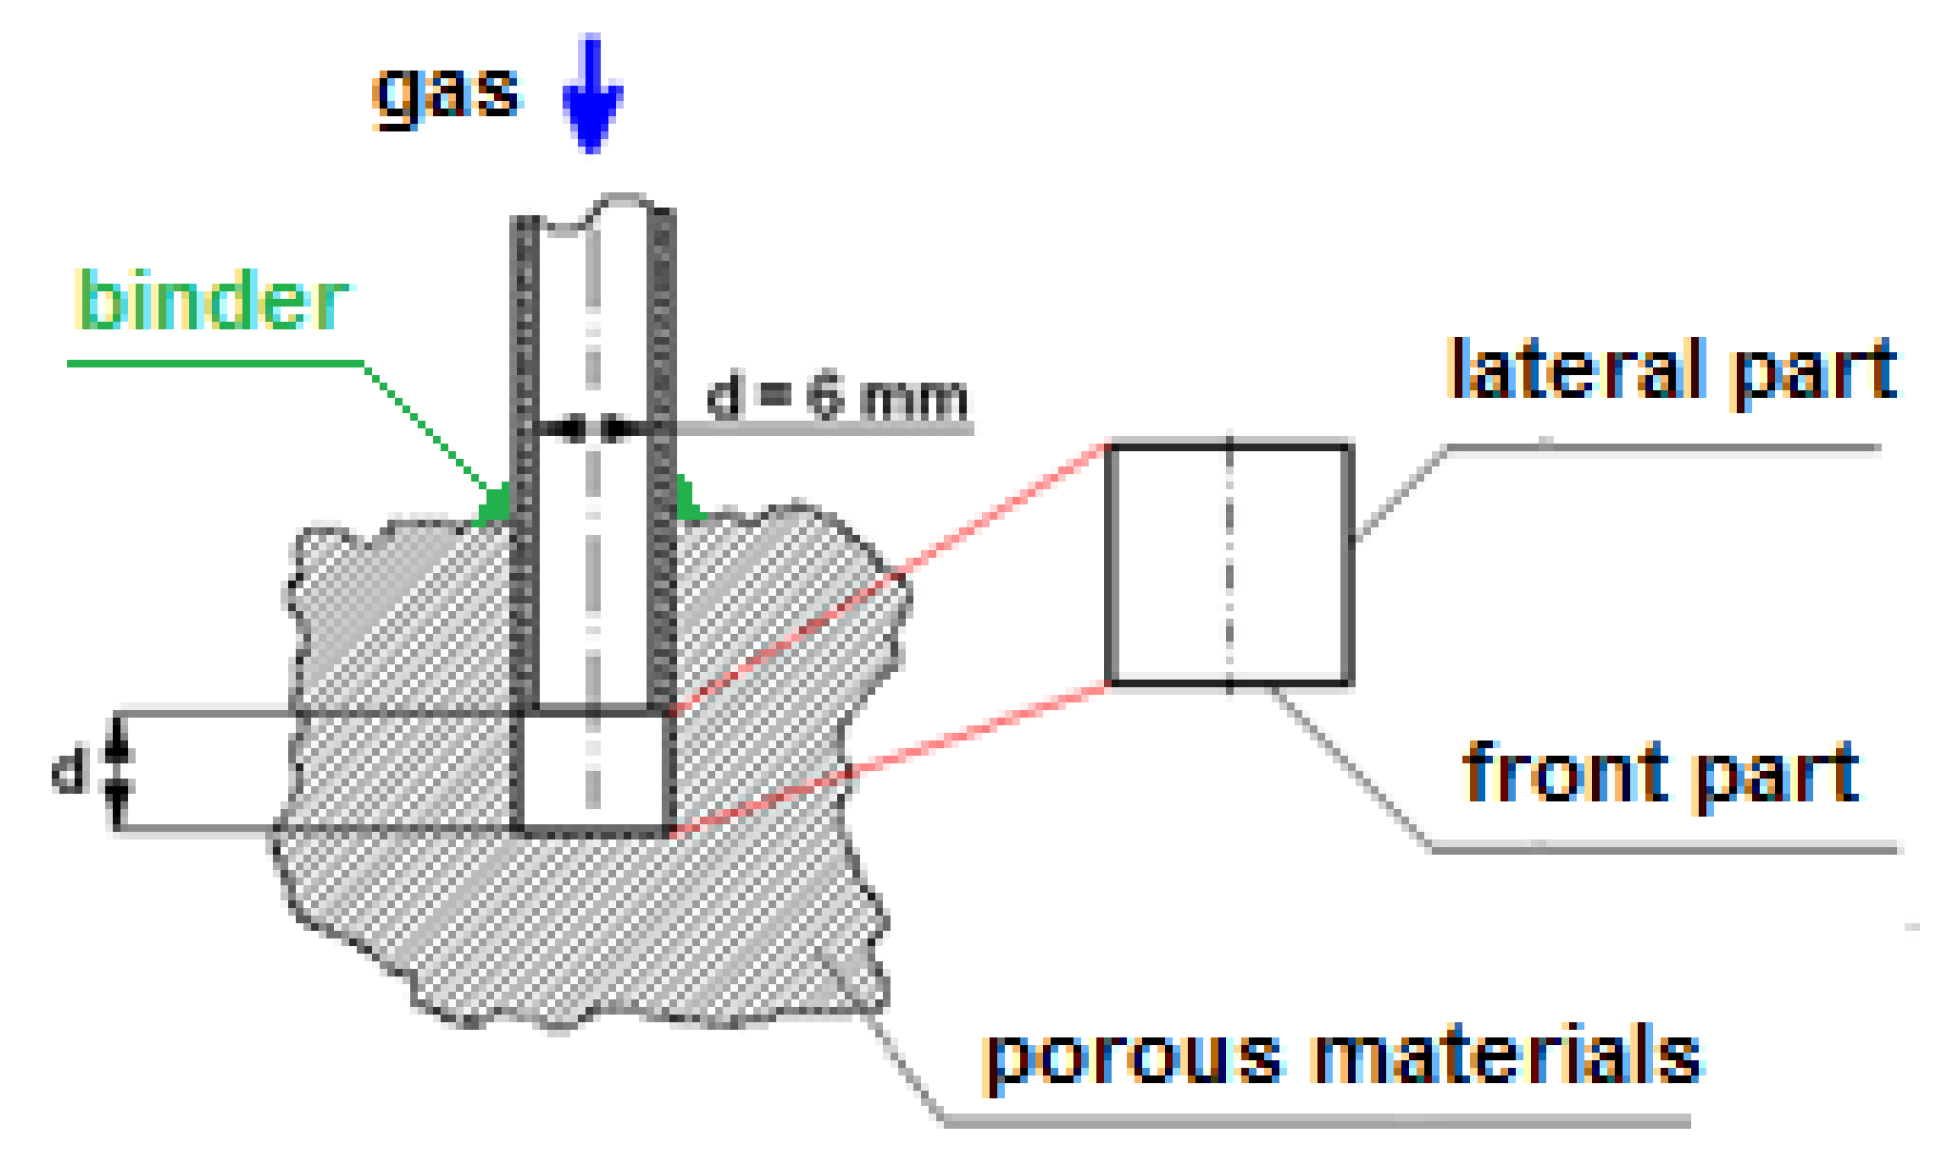
Figure 13.
Coefficient of gas flow resistances for volume sample (own elaboration): coal char (carbonizer) in situ: I-1, I-2, I-3; melted waste rock in situ: V-1, V-2, V-3.
Figure 13.
Coefficient of gas flow resistances for volume sample (own elaboration): coal char (carbonizer) in situ: I-1, I-2, I-3; melted waste rock in situ: V-1, V-2, V-3.
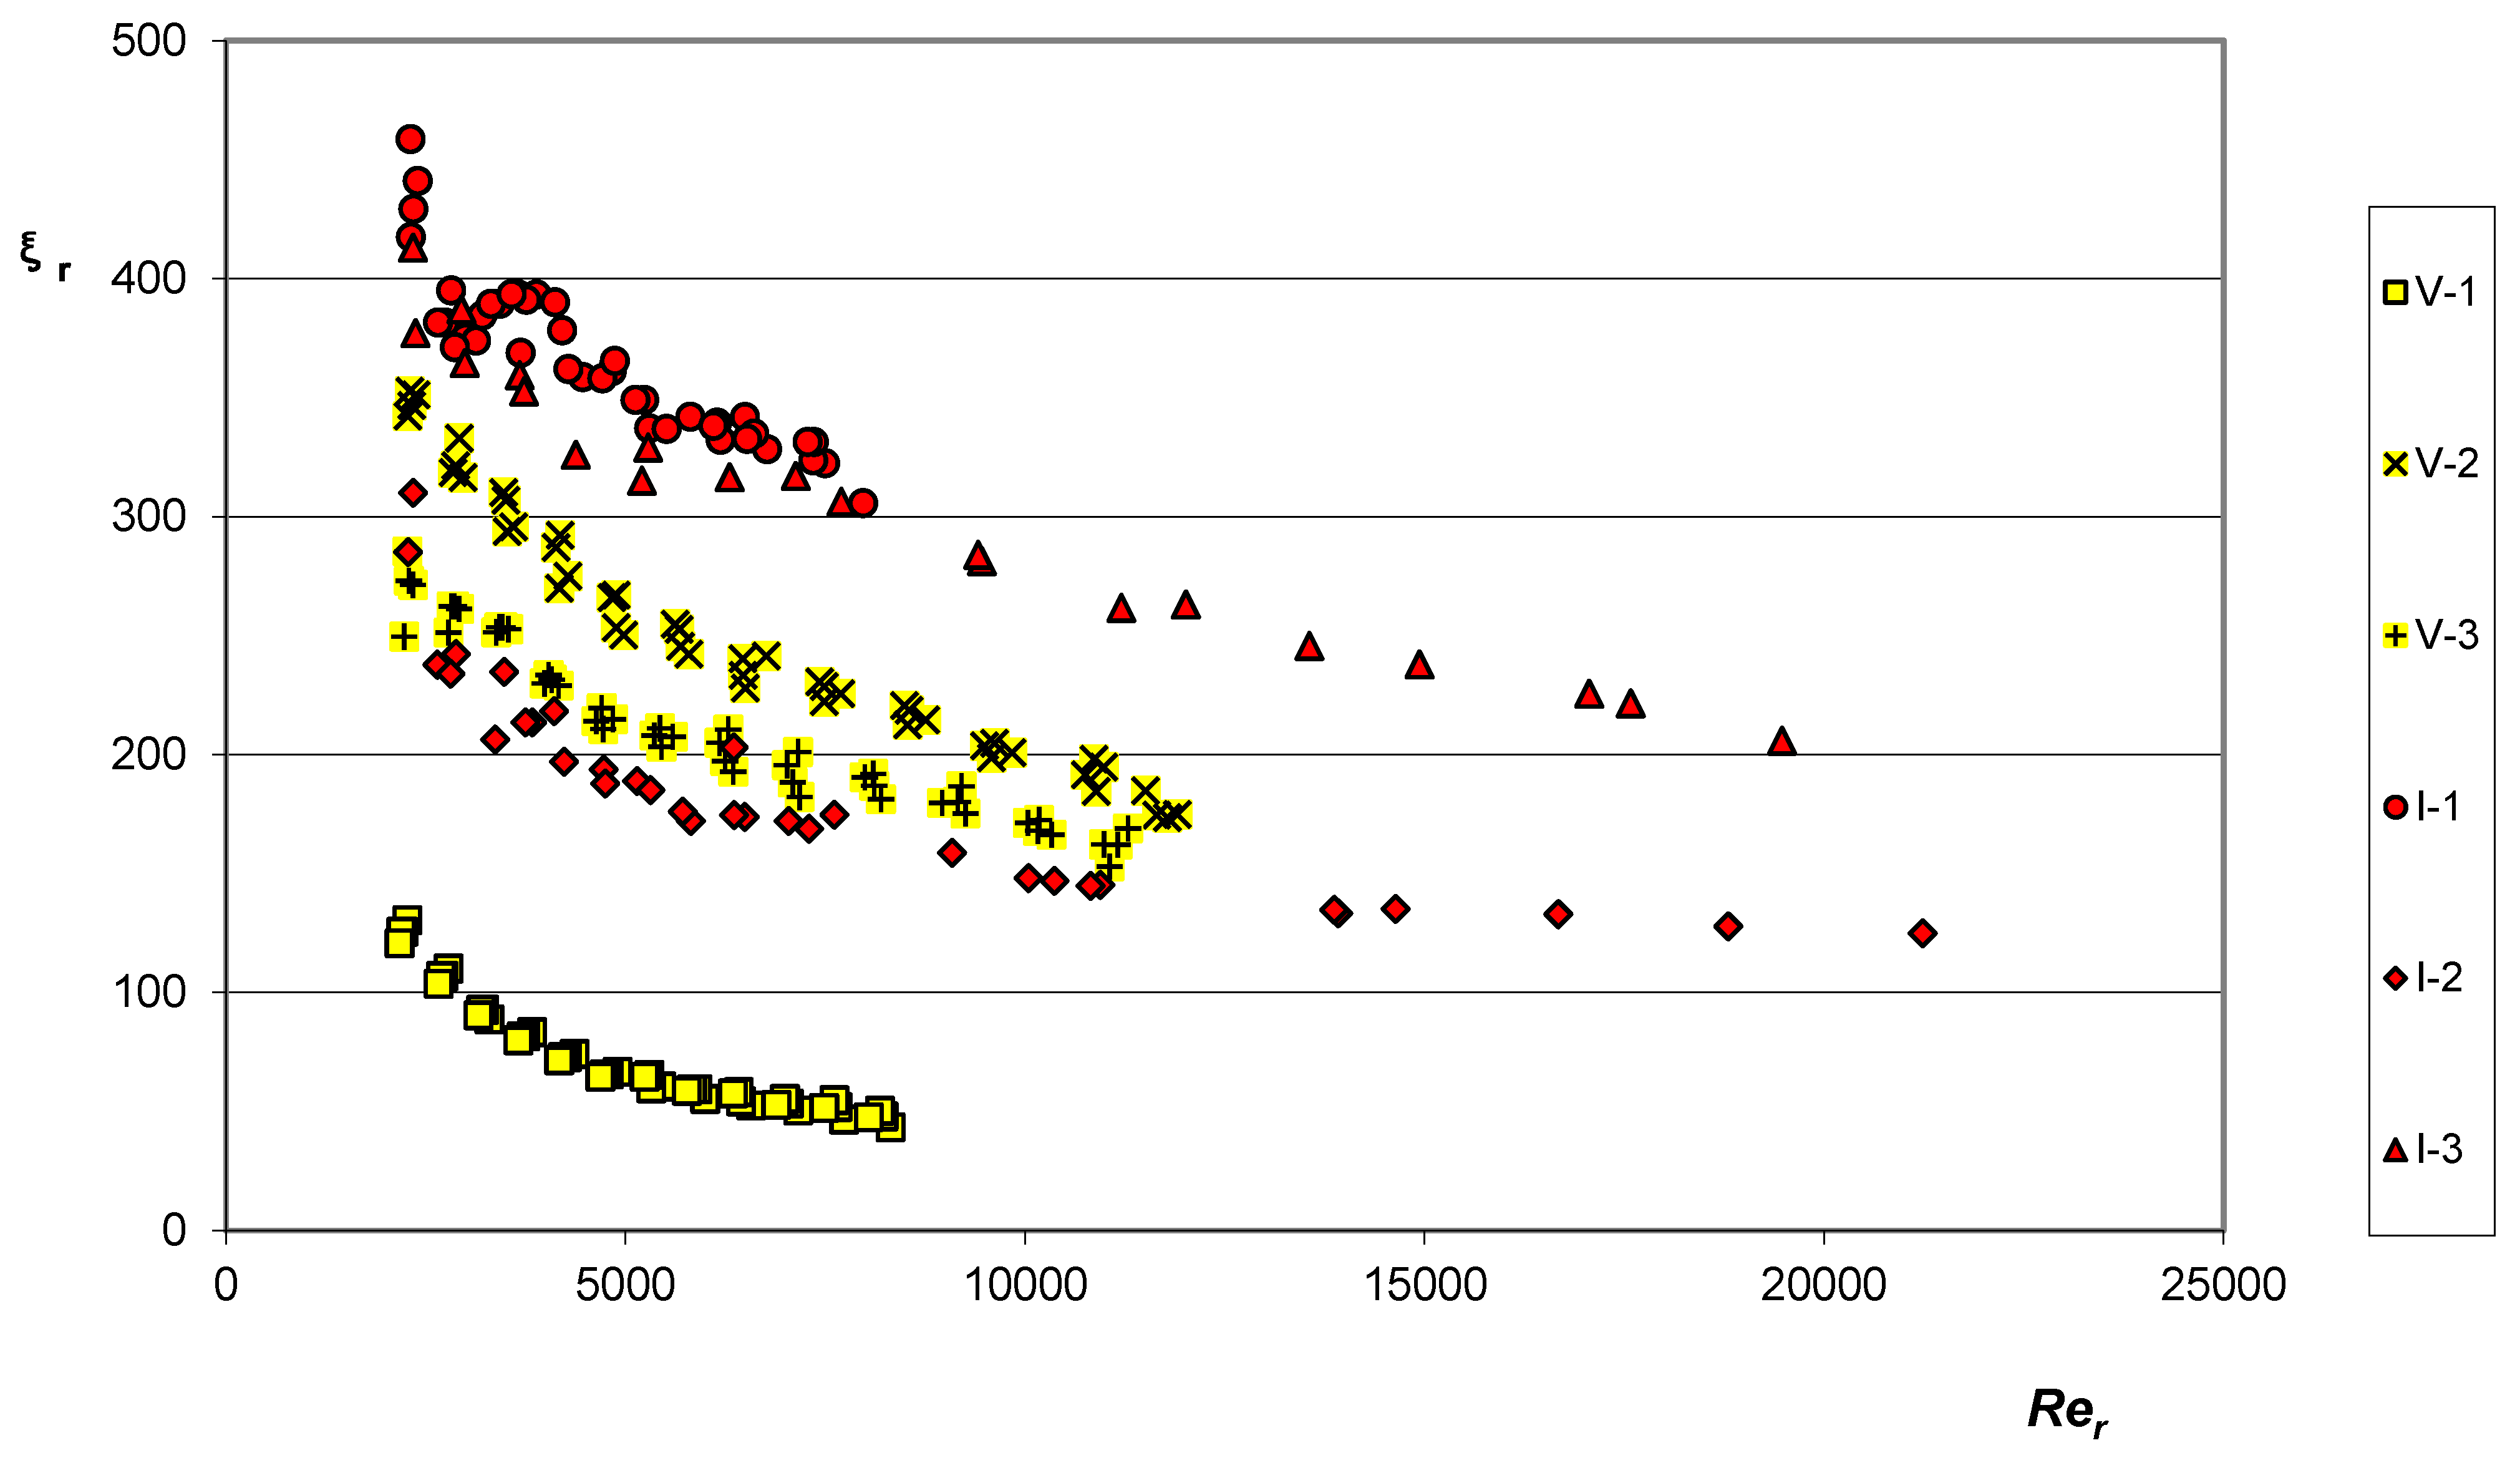
Figure 14.
Correlation referred to other authors in acc. with Table 4 a coefficient of resistances for volume sample char.
Figure 14.
Correlation referred to other authors in acc. with Table 4 a coefficient of resistances for volume sample char.
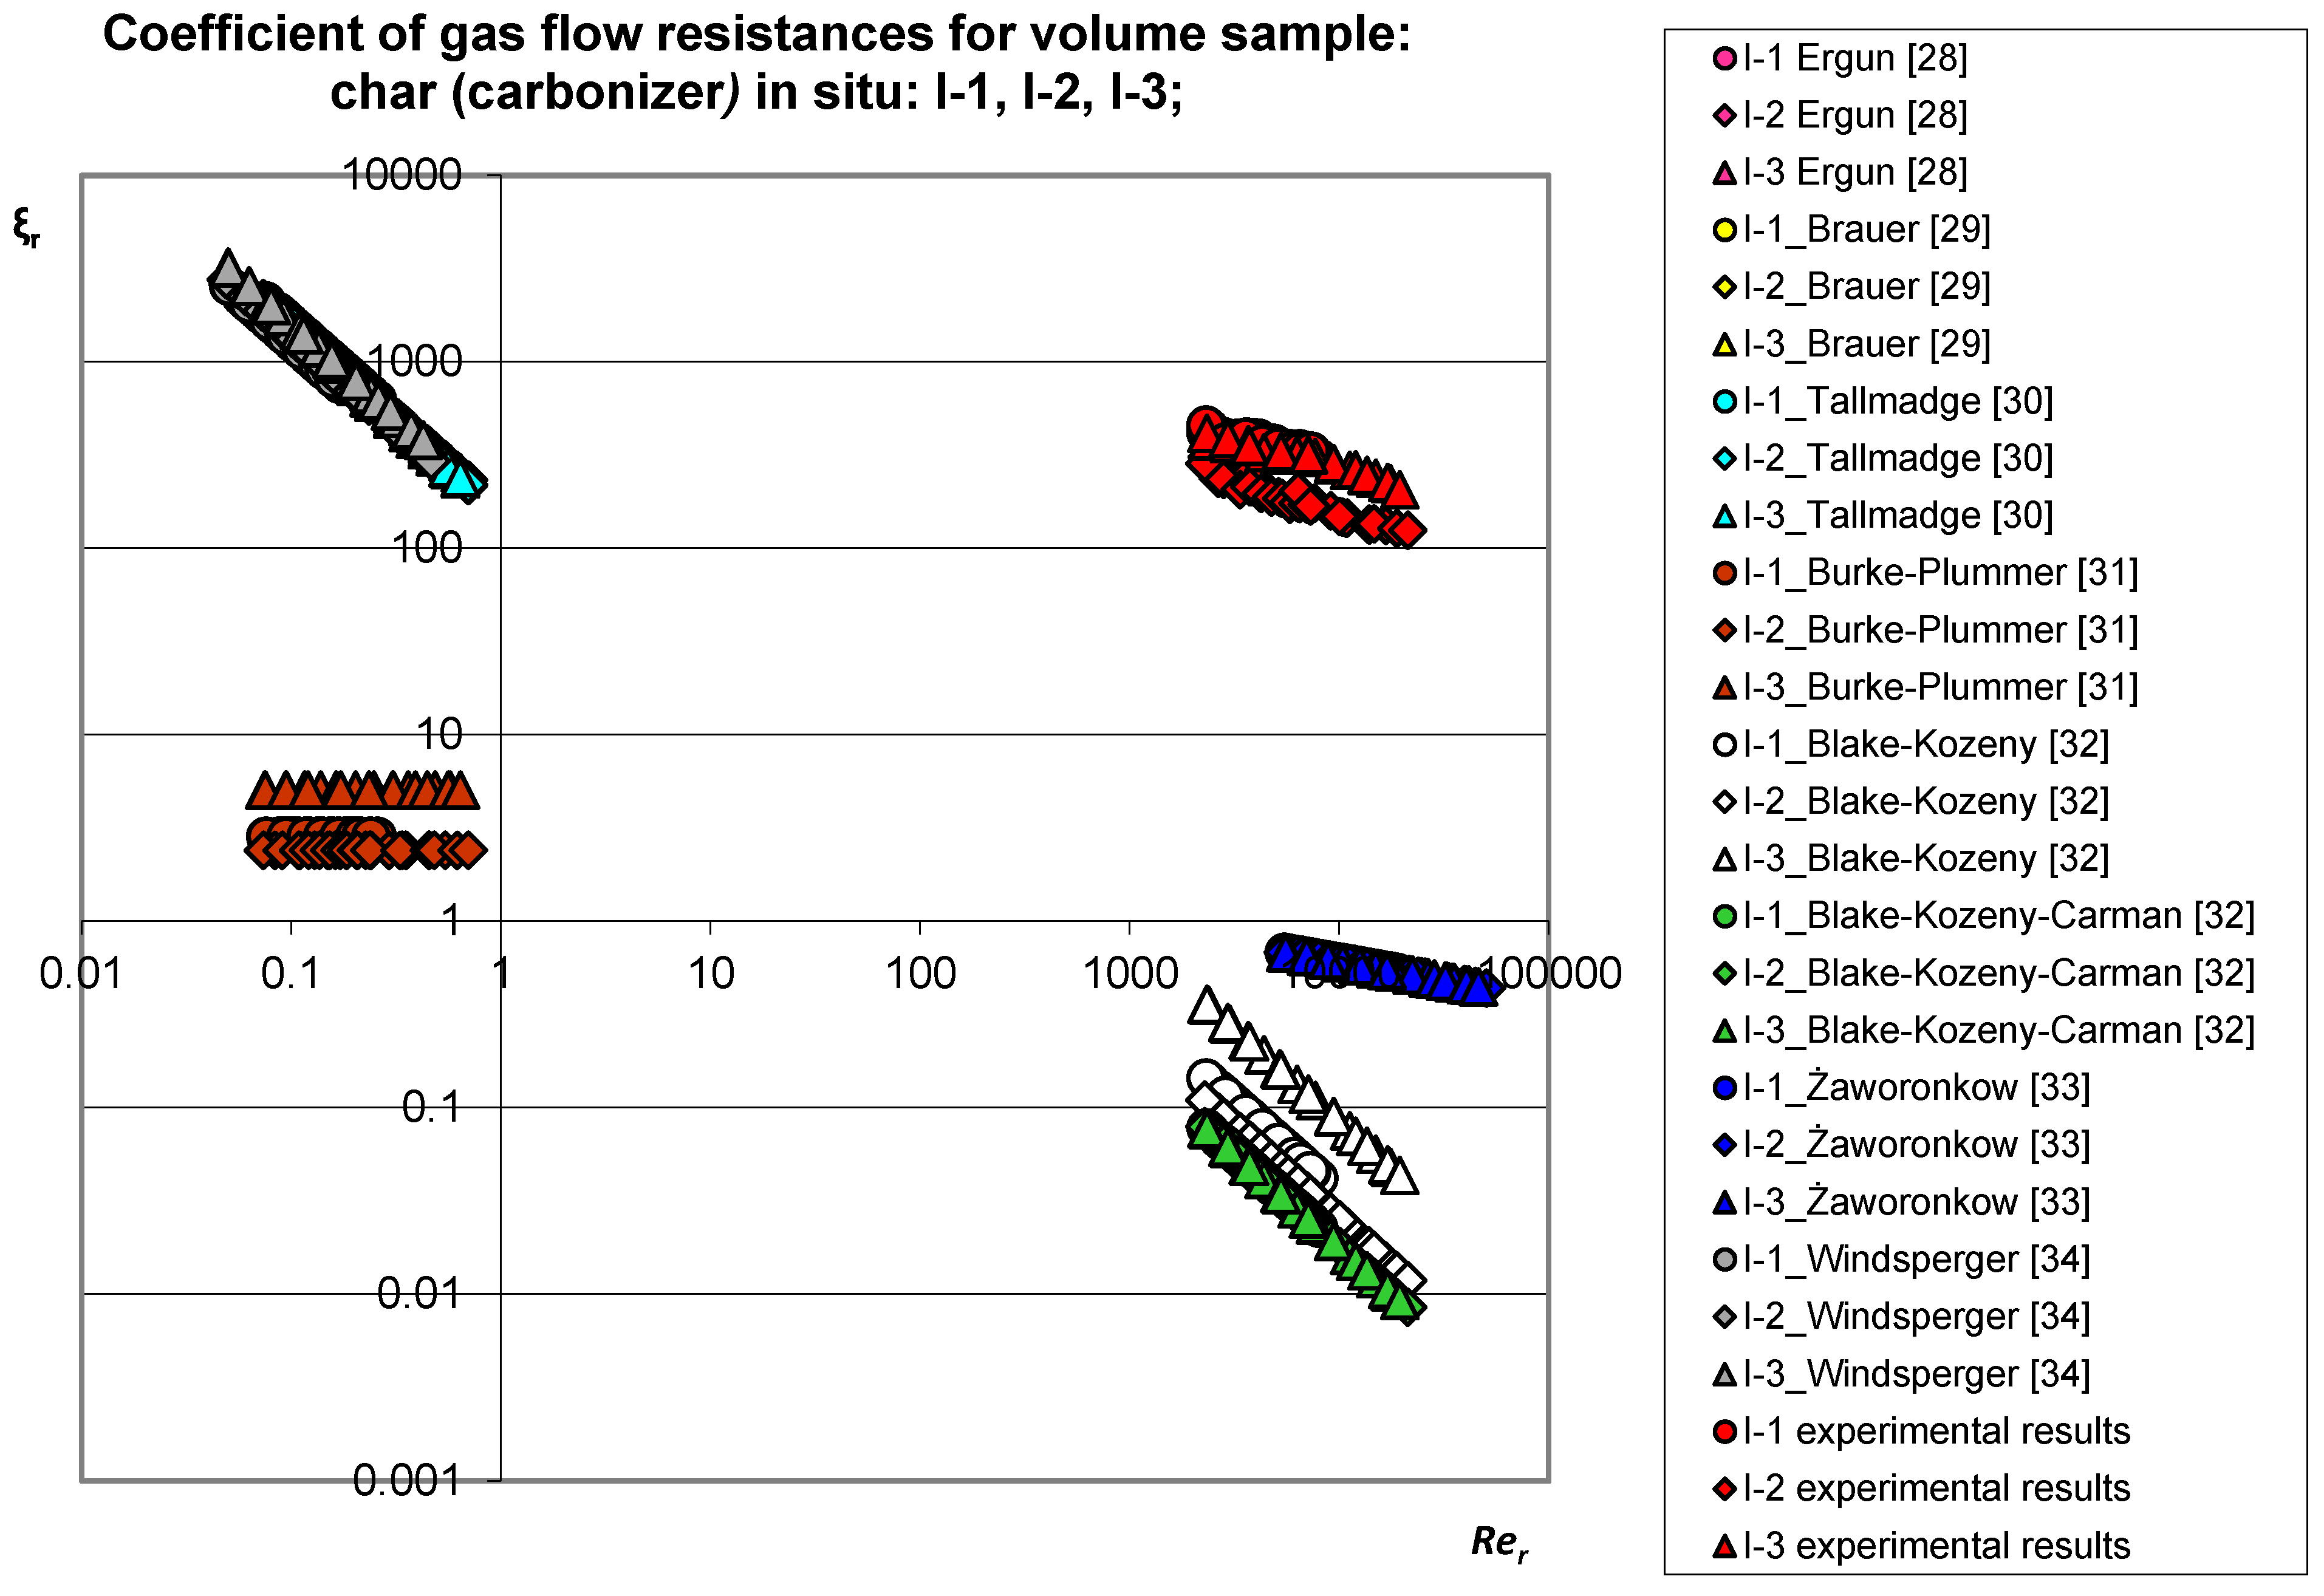
Figure 15.
Gas-permeability coefficient (own elaboration): char (carbonizer) in situ: I-1, I-2, I-3; melted waste rock in situ: V-1, V-2, V-3.
Figure 15.
Gas-permeability coefficient (own elaboration): char (carbonizer) in situ: I-1, I-2, I-3; melted waste rock in situ: V-1, V-2, V-3.

Figure 16.
Coefficient of resistances of gas flow through: (a) char in situ; (b) melted waste rock in situ—own models (own elaboration).
Figure 16.
Coefficient of resistances of gas flow through: (a) char in situ; (b) melted waste rock in situ—own models (own elaboration).

Figure 17.
Coefficient of resistances of gas flow through coal char acc. Authors’ models (Table 4)—the reference of the authors’ own model to the computational models of other authors (own elaboration).
Figure 17.
Coefficient of resistances of gas flow through coal char acc. Authors’ models (Table 4)—the reference of the authors’ own model to the computational models of other authors (own elaboration).

Table 1.
Techniques for technology of processing coal in situ [4]. Reproduced from [4], the publisher: AGH University of Science and Technology 2012.
| Underground Coal Gasification | |||||
|---|---|---|---|---|---|
| Method of processing | Process holes | Channel | Technique | ||
| Injective (inflow) | Productive (outflow) | Conective | |||
| Shaft | Vertical | Horizontal | Streamline | ||
| Vertical | Drooping | Point | |||
| Horizontal | Horizontal | Vertical | Open | ||
| Horizontal | Blind | ||||
| Un-shaft | Directional | Vertical | Pointing | CRIP (I) | |
| Vertical | Vertical (ignition) | Vertical | Horizontal | CRIP (II) “Knife edge” | |
Table 2.
Characteristics of the research material (own elaboration).
| Material (Designation and Source Origin of Raw Material) | Porosity | Indicator Porosity | Density | |||
|---|---|---|---|---|---|---|
| Absolute | Effective | Apparent | Skeleton | |||
| Name | No. Sample | εb, % | εef, % | e | ρa, kg/m3 | ρs, kg/m3 |
| char (carbonizer) in situ KD Barbara, Mikolow | I-1 | 42.2 | 21.1–33.7 | 0.7 | 1300 | 2250 |
| I-2 | 44.9 | 22.5–35.9 | 0.8 | 1239 | ||
| I-3 | 33.9 | 17.0–27.1 | 0.5 | 1487 | ||
| I-average | 40.3 | 20.2–32.2 | 0.7 | 1342 | 2250 | |
| melted waste rock in situ KD Barbara, Mikolow | V-1 | 15.4 | 7.7–12.3 | 0.2 | 1438.4 | 1700 |
| V-2 | 36.4 | 18.2–29.1 | 0.6 | 1080.8 | ||
| V-3 | 42.8 | 21.4–34.2 | 0.7 | 973.0 | ||
| V-average | 31.5 | 15.8–25.2 | 0.5 | 1164.1 | 1700 | |
Table 3.
Test results in conditions: air, 21.7 °C (own elaboration).
| Research Material: Char (Carbonizer) in Itu KD Barbara, Mikolow No. Sample: I-1 | |||||||
|---|---|---|---|---|---|---|---|
| No. | Reference Pressure Pre, MPa | Gas Stream Qg∙103, m3/s | Resistance Flow Measured ΔPzm, kPa | No. | Reference Pressure Pre, MPa | Gas Stream Qg∙103, m3/s | Resistance Flow Measured ΔPzm, kPa |
| 1 | 0.1 | 0.161 | 10.241 | 26 | 0.3 | 0.161 | 9.709 |
| 2 | 0.1 | 0.182 | 11.305 | 27 | 0.3 | 0.182 | 11.305 |
| 3 | 0.1 | 0.196 | 12.901 | 28 | 0.3 | 0.217 | 16.625 |
| 4 | 0.1 | 0.203 | 13.832 | 29 | 0.3 | 0.238 | 20.482 |
| 5 | 0.1 | 0.217 | 16.625 | 30 | 0.3 | 0.259 | 23.940 |
| 6 | 0.1 | 0.231 | 17.955 | 31 | 0.3 | 0.287 | 29.393 |
| 7 | 0.1 | 0.238 | 20.615 | 32 | 0.3 | 0.315 | 33.516 |
| 8 | 0.1 | 0.266 | 23.940 | 33 | 0.3 | 0.350 | 44.023 |
| 9 | 0.1 | 0.280 | 27.265 | 34 | 0.3 | 0.371 | 51.205 |
| 10 | 0.1 | 0.301 | 29.925 | 35 | 0.3 | - | - |
| 11 | 0.1 | 0.329 | 37.905 | 36 | 0.3 | - | - |
| 12 | 0.1 | 0.350 | 42.826 | 37 | 0.3 | - | - |
| 13 | 0.1 | 0.371 | 49.210 | 38 | 0.3 | - | - |
| 14 | 0.2 | 0.161 | 9.75 | 39 | 0.4 | 0.161 | 10.640 |
| 15 | 0.2 | 0.189 | 12.635 | 40 | 0.4 | 0.196 | 12.768 |
| 16 | 0.2 | 0.210 | 15.295 | 41 | 0.4 | 0.231 | 19.285 |
| 17 | 0.2 | 0.231 | 19.285 | 42 | 0.4 | 0.266 | 24.206 |
| 18 | 0.2 | 0.252 | 23.275 | 43 | 0.4 | 0.301 | 31.255 |
| 19 | 0.2 | 0.280 | 26.999 | 44 | 0.4 | 0.336 | 39.900 |
| 20 | 0.2 | 0.301 | 31.255 | 45 | 0.4 | 0.350 | 43.624 |
| 21 | 0.2 | 0.322 | 36.176 | 46 | 0.4 | 0.371 | 51.205 |
| 22 | 0.2 | 0.336 | 38.969 | 47 | 0.4 | - | - |
| 23 | 0.2 | 0.343 | 42.826 | 48 | 0.4 | - | - |
| 24 | 0.2 | 0.371 | 49.476 | 49 | 0.4 | - | - |
| 25 | 0.2 | 0.392 | 53.466 | 50 | 0.4 | - | - |
| Research material: Char (carbonizer) in situ KD Barbara, Mikolow No. Sample: I-2 | |||||||
| No. | Reference Pressure Pre, MPa | Gas Stream Qg∙103, m3/s | Resistance Flow Measured ΔPzm, kPa | No. | Reference Pressure Pre, MPa | Gas Stream Qg∙103, m3/s | Resistance Flow Measured ΔPzm, kPa |
| 1 | 0.1 | 0.161 | 7.448 | 26 | 0.3 | 0.378 | 28.196 |
| 2 | 0.1 | 0.182 | 7.315 | 27 | 0.3 | 0.427 | 30.324 |
| 3 | 0.1 | 0.196 | 8.512 | 28 | 0.3 | 0.539 | 46.683 |
| 4 | 0.1 | 0.231 | 11.305 | 29 | 0.3 | 0.553 | 49.210 |
| 5 | 0.1 | 0.252 | 12.236 | 30 | 0.3 | 0.637 | 66.633 |
| 6 | 0.1 | 0.266 | 13.965 | 31 | 0.3 | 0.686 | 85.386 |
| 7 | 0.1 | 0.301 | 15.960 | 32 | 0.3 | - | - |
| 8 | 0.1 | 0.322 | 17.955 | 33 | 0.3 | - | - |
| 9 | 0.1 | 0.357 | 20.349 | 34 | 0.3 | - | - |
| 10 | 0.1 | 0.385 | 24.472 | 35 | 0.3 | - | - |
| 11 | 0.1 | 0.427 | 31.654 | 36 | 0.3 | - | - |
| 12 | 0.1 | - | - | 37 | 0.3 | - | - |
| 13 | 0.1 | - | - | 38 | 0.3 | - | - |
| 14 | 0.2 | 0.161 | 6.916 | 39 | 0.4 | 0.532 | 45.486 |
| 15 | 0.2 | 0.196 | 8.246 | 40 | 0.4 | 0.637 | 67.830 |
| 16 | 0.2 | 0.231 | 9.975 | 41 | 0.4 | 0.651 | 73.283 |
| 17 | 0.2 | 0.252 | 12.236 | 42 | 0.4 | 0.728 | 99.085 |
| 18 | 0.2 | 0.280 | 13.965 | 43 | 0.4 | 0.763 | 114.513 |
| 19 | 0.2 | 0.308 | 16.226 | 44 | 0.4 | - | - |
| 20 | 0.2 | 0.336 | 19.285 | 45 | 0.4 | - | - |
| 21 | 0.2 | 0.357 | 20.881 | 46 | 0.4 | - | - |
| 22 | 0.2 | 0.385 | 24.605 | 47 | 0.4 | - | - |
| 23 | 0.2 | 0.413 | 28.595 | 48 | 0.4 | - | - |
| 24 | 0.2 | 0.490 | 39.900 | 49 | 0.4 | - | - |
| 25 | 0.2 | 0.553 | 49.343 | 50 | 0.4 | - | - |
| Research material: Char (carbonizer) in situ KD Barbara, Mikolow No. Sample: I-3 | |||||||
| No. | Reference Pressure Pre, MPa | Gas Stream Qg∙103, m3/s | Resistance Flow Measured ΔPzm, kPa | No. | Reference Pressure Pre, MPa | Gas Stream Qg∙103, m3/s | Resistance Flow Measured ΔPzm, kPa |
| 1 | 0.1 | 0.161 | 8.911 | 26 | 0.3 | 0.308 | 30.856 |
| 2 | 0.1 | 0.196 | 12.635 | 27 | 0.3 | 0.434 | 65.436 |
| 3 | 0.1 | 0.231 | 17.556 | 28 | 0.3 | 0.490 | 86.982 |
| 4 | 0.1 | 0.266 | 21.546 | 29 | 0.3 | 0.546 | 108.661 |
| 5 | 0.1 | 0.301 | 27.664 | 30 | 0.3 | 0.588 | 128.079 |
| 6 | 0.1 | - | - | 31 | 0.3 | - | - |
| 7 | 0.1 | - | - | 32 | 0.3 | - | - |
| 8 | 0.1 | - | - | 33 | 0.3 | - | - |
| 9 | 0.1 | - | - | 34 | 0.3 | - | - |
| 10 | 0.1 | - | - | 35 | 0.3 | - | - |
| 11 | 0.1 | - | - | 36 | 0.3 | - | - |
| 12 | 0.1 | - | - | 37 | 0.3 | - | - |
| 13 | 0.1 | - | - | 38 | 0.3 | - | - |
| 14 | 0.2 | 0.161 | 9.709 | 39 | 0.4 | 0.371 | 48.146 |
| 15 | 0.2 | 0.196 | 13.433 | 40 | 0.4 | 0.525 | 99.085 |
| 16 | 0.2 | 0.238 | 18.354 | 41 | 0.4 | 0.581 | 126.350 |
| 17 | 0.2 | 0.343 | 38.703 | 42 | 0.4 | 0.623 | 140.980 |
| 18 | 0.2 | 0.385 | 50.939 | 43 | 0.4 | - | - |
| 19 | 0.2 | 0.434 | 64.505 | 44 | 0.4 | - | - |
| 20 | 0.2 | 0.476 | 77.672 | 45 | 0.4 | - | - |
| 21 | 0.2 | - | - | 46 | 0.4 | - | - |
| 22 | 0.2 | - | - | 47 | 0.4 | - | - |
| 23 | 0.2 | - | - | 48 | 0.4 | - | - |
| 24 | 0.2 | - | - | 49 | 0.4 | - | - |
| 25 | 0.2 | - | - | 50 | 0.4 | - | - |
| Research material: Melted waste rock in situ KD Barbara, Mikolow No. Sample: V-1 | |||||||
| No. | Reference Pressure Pre, MPa | Gas Stream Qg∙103, m3/s | Resistance Flow Measured ΔPzm, kPa | No. | Reference Pressure Pre, MPa | Gas Stream Qg∙103, m3/s | Resistance Flow Measured ΔPzm, kPa |
| 1 | 0.1 | 0.161 | 2.660 | 26 | 0.3 | 0.161 | 2.660 |
| 2 | 0.1 | 0.196 | 3.325 | 27 | 0.3 | 0.196 | 3.325 |
| 3 | 0.1 | 0.231 | 3.724 | 28 | 0.3 | 0.231 | 3.990 |
| 4 | 0.1 | 0.266 | 4.655 | 29 | 0.3 | 0.266 | 4.655 |
| 5 | 0.1 | 0.301 | 5.320 | 30 | 0.3 | 0.301 | 5.320 |
| 6 | 0.1 | 0.336 | 5.985 | 31 | 0.3 | 0.336 | 5.985 |
| 7 | 0.1 | 0.371 | 6.650 | 32 | 0.3 | 0.371 | 7.315 |
| 8 | 0.1 | 0.406 | 7.315 | 33 | 0.3 | 0.406 | 7.980 |
| 9 | 0.1 | 0.441 | 8.246 | 34 | 0.3 | 0.441 | 9.310 |
| 10 | 0.1 | 0.476 | 9.310 | 35 | 0.3 | 0.476 | 10.374 |
| 11 | 0.1 | 0.511 | 9.975 | 36 | 0.3 | 0.511 | 11.970 |
| 12 | 0.1 | 0.546 | 10.640 | 37 | 0.3 | 0.546 | 12.635 |
| 13 | 0.1 | - | - | 38 | 0.3 | - | - |
| 14 | 0.2 | 0.161 | 2.660 | 39 | 0.4 | 0.161 | 2.660 |
| 15 | 0.2 | 0.196 | 3.325 | 40 | 0.4 | 0.196 | 3.325 |
| 16 | 0.2 | 0.231 | 3.990 | 41 | 0.4 | 0.231 | 3.990 |
| 17 | 0.2 | 0.266 | 4.655 | 42 | 0.4 | 0.266 | 4.655 |
| 18 | 0.2 | 0.301 | 5.320 | 43 | 0.4 | 0.301 | 5.320 |
| 19 | 0.2 | 0.336 | 5.985 | 44 | 0.4 | 0.336 | 5.985 |
| 20 | 0.2 | 0.371 | 6.650 | 45 | 0.4 | 0.371 | 7.315 |
| 21 | 0.2 | 0.406 | 7.980 | 46 | 0.4 | 0.406 | 7.980 |
| 22 | 0.2 | 0.441 | 8.645 | 47 | 0.4 | 0.441 | 9.310 |
| 23 | 0.2 | 0.476 | 9.975 | 48 | 0.4 | 0.476 | 9.975 |
| 24 | 0.2 | 0.511 | 11.305 | 49 | 0.4 | 0.511 | 11.305 |
| 25 | 0.2 | 0.546 | 11.970 | 50 | 0.4 | 0.546 | 11.970 |
| Research material: Melted waste rock in situ KD Barbara, Mikolow No. Sample: V-2 | |||||||
| No. | Reference Pressure Pre, MPa | Gas Stream Qg∙103, m3/s | Resistance Flow Measured ΔPzm, kPa | No. | Reference Pressure Pre, MPa | Gas Stream Qg∙103, m3/s | Resistance Flow Measured ΔPzm, kPa |
| 1 | 0.1 | 0.161 | 7.315 | 26 | 0.3 | 0.161 | 7.448 |
| 2 | 0.1 | 0.196 | 9.975 | 27 | 0.3 | 0.196 | 10.241 |
| 3 | 0.1 | 0.231 | 13.300 | 28 | 0.3 | 0.231 | 13.965 |
| 4 | 0.1 | 0.266 | 16.891 | 29 | 0.3 | 0.266 | 18.221 |
| 5 | 0.1 | 0.301 | 20.216 | 30 | 0.3 | 0.301 | 21.945 |
| 6 | 0.1 | 0.336 | 25.403 | 31 | 0.3 | 0.336 | 26.866 |
| 7 | 0.1 | 0.371 | 32.58. | 32 | 0.3 | 0.371 | 31.255 |
| 8 | 0.1 | 0.406 | 37.95 | 33 | 0.3 | 0.406 | 38.703 |
| 9 | 0.1 | 0.441 | 44.55 | 34 | 0.3 | 0.441 | 45.885 |
| 10 | 0.1 | 0.476 | 50.540 | 35 | 0.3 | 0.476 | 52.136 |
| 11 | 0.1 | 0.511 | 55.195 | 36 | 0.3 | 0.511 | 58.520 |
| 12 | 0.1 | 0.539 | 59.185 | 37 | 0.3 | 0.532 | 62.909 |
| 13 | 0.1 | - | - | 38 | 0.3 | - | - |
| 14 | 0.2 | 0.161 | 7.315 | 39 | 0.4 | 0.161 | 7.315 |
| 15 | 0.2 | 0.196 | 10.640 | 40 | 0.4 | 0.196 | 10.241 |
| 16 | 0.2 | 0.231 | 13.300 | 41 | 0.4 | 0.231 | 14.231 |
| 17 | 0.2 | 0.266 | 16.625 | 42 | 0.4 | 0.266 | 17.955 |
| 18 | 0.2 | 0.301 | 20.615 | 43 | 0.4 | 0.301 | 21.945 |
| 19 | 0.2 | 0.336 | 25.935 | 44 | 0.4 | 0.336 | 27.265 |
| 20 | 0.2 | 0.371 | 30.324 | 45 | 0.4 | 0.371 | 32.585 |
| 21 | 0.2 | 0.406 | 37.240 | 46 | 0.4 | 0.406 | 39.235 |
| 22 | 0.2 | 0.441 | 44.023 | 47 | 0.4 | 0.441 | 46.550 |
| 23 | 0.2 | 0.476 | 49.875 | 48 | 0.4 | 0.476 | 51.870 |
| 24 | 0.2 | 0.511 | 60.116 | 49 | 0.4 | 0.511 | 61.845 |
| 25 | 0.2 | 0.546 | 62.510 | 50 | 0.4 | 0.546 | 62.510 |
| Research material: Melted waste rock in situ KD Barbara, Mikolow No. Sample: V-3 | |||||||
| No. | Reference Pressure Pre, MPa | Gas Stream Qg∙103, m3/s | Resistance Flow Measured ΔPzm, kPa | No. | Reference Pressure Pre, MPa | Gas Stream Qg∙103, m3/s | Resistance Flow Measured ΔPzm, kPa |
| 1 | 0.1 | 0.161 | 5.586 | 26 | 0.3 | 0.161 | 5.985 |
| 2 | 0.1 | 0.196 | 8.113 | 27 | 0.3 | 0.196 | 8.246 |
| 3 | 0.1 | 0.231 | 11.172 | 28 | 0.3 | 0.231 | 11.305 |
| 4 | 0.1 | 0.266 | 13.699 | 29 | 0.3 | 0.266 | 14.098 |
| 5 | 0.1 | 0.301 | 16.891 | 30 | 0.3 | 0.301 | 17.423 |
| 6 | 0.1 | 0.336 | 21.014 | 31 | 0.3 | 0.336 | 21.546 |
| 7 | 0.1 | 0.371 | 24.472 | 32 | 0.3 | 0.371 | 27.398 |
| 8 | 0.1 | 0.406 | 28.595 | 33 | 0.3 | 0.406 | 32.585 |
| 9 | 0.1 | 0.441 | 35.245 | 34 | 0.3 | 0.441 | 38.171 |
| 10 | 0.1 | 0.476 | 41.496 | 35 | 0.3 | 0.476 | 45.486 |
| 11 | 0.1 | 0.511 | 47.215 | 36 | 0.3 | 0.511 | 49.875 |
| 12 | 0.1 | 0.532 | 54.530 | 37 | 0.3 | 0.539 | 53.466 |
| 13 | 0.1 | − | − | 38 | 0.3 | − | − |
| 14 | 0.2 | 0.161 | 5.719 | 39 | 0.4 | 0.161 | 5.320 |
| 15 | 0.2 | 0.196 | 8.246 | 40 | 0.4 | 0.196 | 7.980 |
| 16 | 0.2 | 0.231 | 11.305 | 41 | 0.4 | 0.231 | 11.305 |
| 17 | 0.2 | 0.266 | 13.965 | 42 | 0.4 | 0.266 | 13.965 |
| 18 | 0.2 | 0.301 | 16.625 | 43 | 0.4 | 0.301 | 17.024 |
| 19 | 0.2 | 0.336 | 20.615 | 44 | 0.4 | 0.336 | 21.280 |
| 20 | 0.2 | 0.371 | 25.270 | 45 | 0.4 | 0.371 | 26.600 |
| 21 | 0.2 | 0.406 | 29.925 | 46 | 0.4 | 0.406 | 31.521 |
| 22 | 0.2 | 0.441 | 36.841 | 47 | 0.4 | 0.441 | 37.905 |
| 23 | 0.2 | 0.476 | 43.225 | 48 | 0.4 | 0.476 | 43.225 |
| 24 | 0.2 | 0.511 | 48.013 | 49 | 0.4 | 0.511 | 49.476 |
| 25 | 0.2 | 0.546 | 50.806 | 50 | 0.4 | 0.546 | 55.594 |
Table 4.
Correlation equations for calculating the coefficient of flow resistance through granular porous structures (own elaboration).
Table 4.
Correlation equations for calculating the coefficient of flow resistance through granular porous structures (own elaboration).
| Autor | Model Equation | Criteria Number | ||
|---|---|---|---|---|
| Ergun [28] | (4) | (5) | ||
| Brauer [29] | (6) | |||
| Tallmadge [30] | (7) | |||
| Burke-Plummer [31] | (8) | |||
| Blake-Kozeny [32] | (9) | (10) | ||
| Blake-Kozeny–Carman [32] | (11) | |||
| Żaworonkow [33] | (12) | (13) | ||
| Windsperger [34] | (14) | (15) |
Table 5.
Parameters of gas flow meters calibration (own elaboration).
| Flow Meter Type | Measurement Range | Scaling Equation—The Value of the Air Stream, dm3/min | Accuracy of Scaling |
|---|---|---|---|
| RDN 06–03 | 0–1.9 | Qg = (0.0137 scala) − 0.30086 | 0.97 |
| R 10a | 0–38 | Qg = (0.2836 scala) + 9.9091 | 0.99 |
| RDN 06–03 | 0–48 | Qg = (0.216 · scala) + 1.4112 | 0.99 |
| R 10m | 0–51 | Qg = (0.4264 scala) + 9.5 | 0.99 |
| R | 0–1.5 | Qg = (10 mL/ measurement time) | ±5% |
Table 6.
An algorithm concerning the analysis of measurement error (own elaboration).
| Algorithm | Score |
|---|---|
| Expected value as an arithmetic mean. | 3.74 × 10⁻⁴ |
| Measure of dispersion as the variance of the arithmetic mean. | 1.07 × 10⁻¹⁰ |
| Standard deviation. | 1.03 × 10⁻⁵ |
| The component of the measurement error limit: — systematic limit error, where the absolute error of the measuring instrument (rotameter RDN06–03) is 5%. | 1.87 × 10⁻⁶ |
| The component of the measurement error limit: — accidental random error. | 3.01 × 10⁻⁵ |
| Measurement error limit at the probability confidence level p ~ 0.99. | 3.29 × 10⁻⁵ |
| The measurement result at the confidence level p ~ 0.99 | 3.74 × 10⁻⁴ ± 3.29 × 10⁻⁵ |
Publisher’s Note: MDPI stays neutral with regard to jurisdictional claims in published maps and institutional affiliations. |
© 2021 by the author. Licensee MDPI, Basel, Switzerland. This article is an open access article distributed under the terms and conditions of the Creative Commons Attribution (CC BY) license (https://creativecommons.org/licenses/by/4.0/).
Share and Cite
MDPI and ACS Style
Wałowski, G. Gas Permeability Model for Porous Materials from Underground Coal Gasification Technology. Energies 2021, 14, 4462. https://doi.org/10.3390/en14154462
AMA Style
Wałowski G. Gas Permeability Model for Porous Materials from Underground Coal Gasification Technology. Energies. 2021; 14(15):4462. https://doi.org/10.3390/en14154462
Chicago/Turabian StyleWałowski, Grzegorz. 2021. "Gas Permeability Model for Porous Materials from Underground Coal Gasification Technology" Energies 14, no. 15: 4462. https://doi.org/10.3390/en14154462
Note that from the first issue of 2016, this journal uses article numbers instead of page numbers. See further details here.