1. Introduction
Gear pumps belong to a group of positive displacement pumps. They are commonly used in stationary and mobile hydraulic drives because of their cost-effectiveness and simple design [
1]. Due to the very wide industrial use of gear pumps, numerous studies are being conducted, mainly aimed at increasing their efficiency. In the experimental studies of fluid flow phenomena in gear pumps, advanced optical methods are used [
2]. The conducted visualization tests indicate the existence of areas during the flow where cavitation and turbulence, especially in the meshing and input zones, are possible.
The CFD method has been used initially for flow dynamic analysis in the meshing zone and suction chamber as well as for identifying cavitation in external gear pumps [
3,
4]. In [
5], the results of flow visualization in the meshing zone of the gear pump have been presented. Due to the fluid volume changes in the spaces between the gear teeth in the meshing zone, the phenomenon of cavitation can occur. There are relatively few papers concerning the 3D modelling of the flow in the lubrication gaps inside the gear pumps. An interesting study has been done by Frosina [
6] regarding the pressure inside the chambers of both driving and driven gears underlining cavitation in the meshing zone of the pump. All leakages have been taken into account to estimate the volumetric efficiency of the pump.
The volumetric efficiency of the pump decreases because of the fluid flow occurring in the axial and radial gaps [
7,
8]. In paper [
9], a 2D modeling approach with deforming mesh and remeshing has been proposed.
Houzeaux [
10] presented a methodology in which the flow area is divided into a series of configurations where the transient Navier–Stokes equations are solved. These models cannot predict the internal flow phenomena in gear pumps. Wahab [
11] used a simple orifice equation to predict the leakage flow rate at different inlet/outlet pressure differences. The effect of eccentricity on leakages was assessed in [
12]. Strasser [
13] used a moving-deforming grid approach in a commercial computational CFD solver, ANSYS Fluent.
Yoon [
14] used the three-phase fully compressible model with an immersed boundary model for predicting cavitation under high rotational speed. Furthermore, Castilla [
15] has studied the flow in a suction chamber using a Lagrangian–Eulerian (ALE) formulation. Zhou [
12] introduced the mathematical model for the description of the flow rate and leakages in a circular arc gear pump.
The 3D models are mainly used to analyze the volumetric efficiency and to calculate the pressure distribution in the flow field of the gear pump as well as evaluating the occurrence of cavitation and the effect of clearances in the meshing area on the pump’s performance [
16,
17]. Moreover, the influence of the geometry of relief grooves to avoid the pressure overdue in the trapped volumes has been investigated [
6].
In this paper, a 3D CFD model has been developed to analyze the leakages in the axial and radial gaps inside an external gear pump. In [
18], a similar model assuming some additional simplifications has been developed. The challenge is to define the complex relationship between volumetric losses from the radial gap and those resulting from the axial gap. Because of the eccentric position on gears, losses in the axial gaps have a greater influence on the total volumetric efficiency of the gear pump than the radial gaps. The influence of the gears’ eccentricity in the bores inside the housing on the leakages in the radial gaps is innovative and has not been investigated in detail. In [
18] the eccentricity of gears position has been determined based on pressure loads in the sliding bearings.
To verify the CFD results, experimental investigations of the volumetric efficiency have been carried out. The simulation results obtained for various operating parameters of the pump were compared with the experimental results and good agreement was found.
2. CFD Model of an External Gear Pump
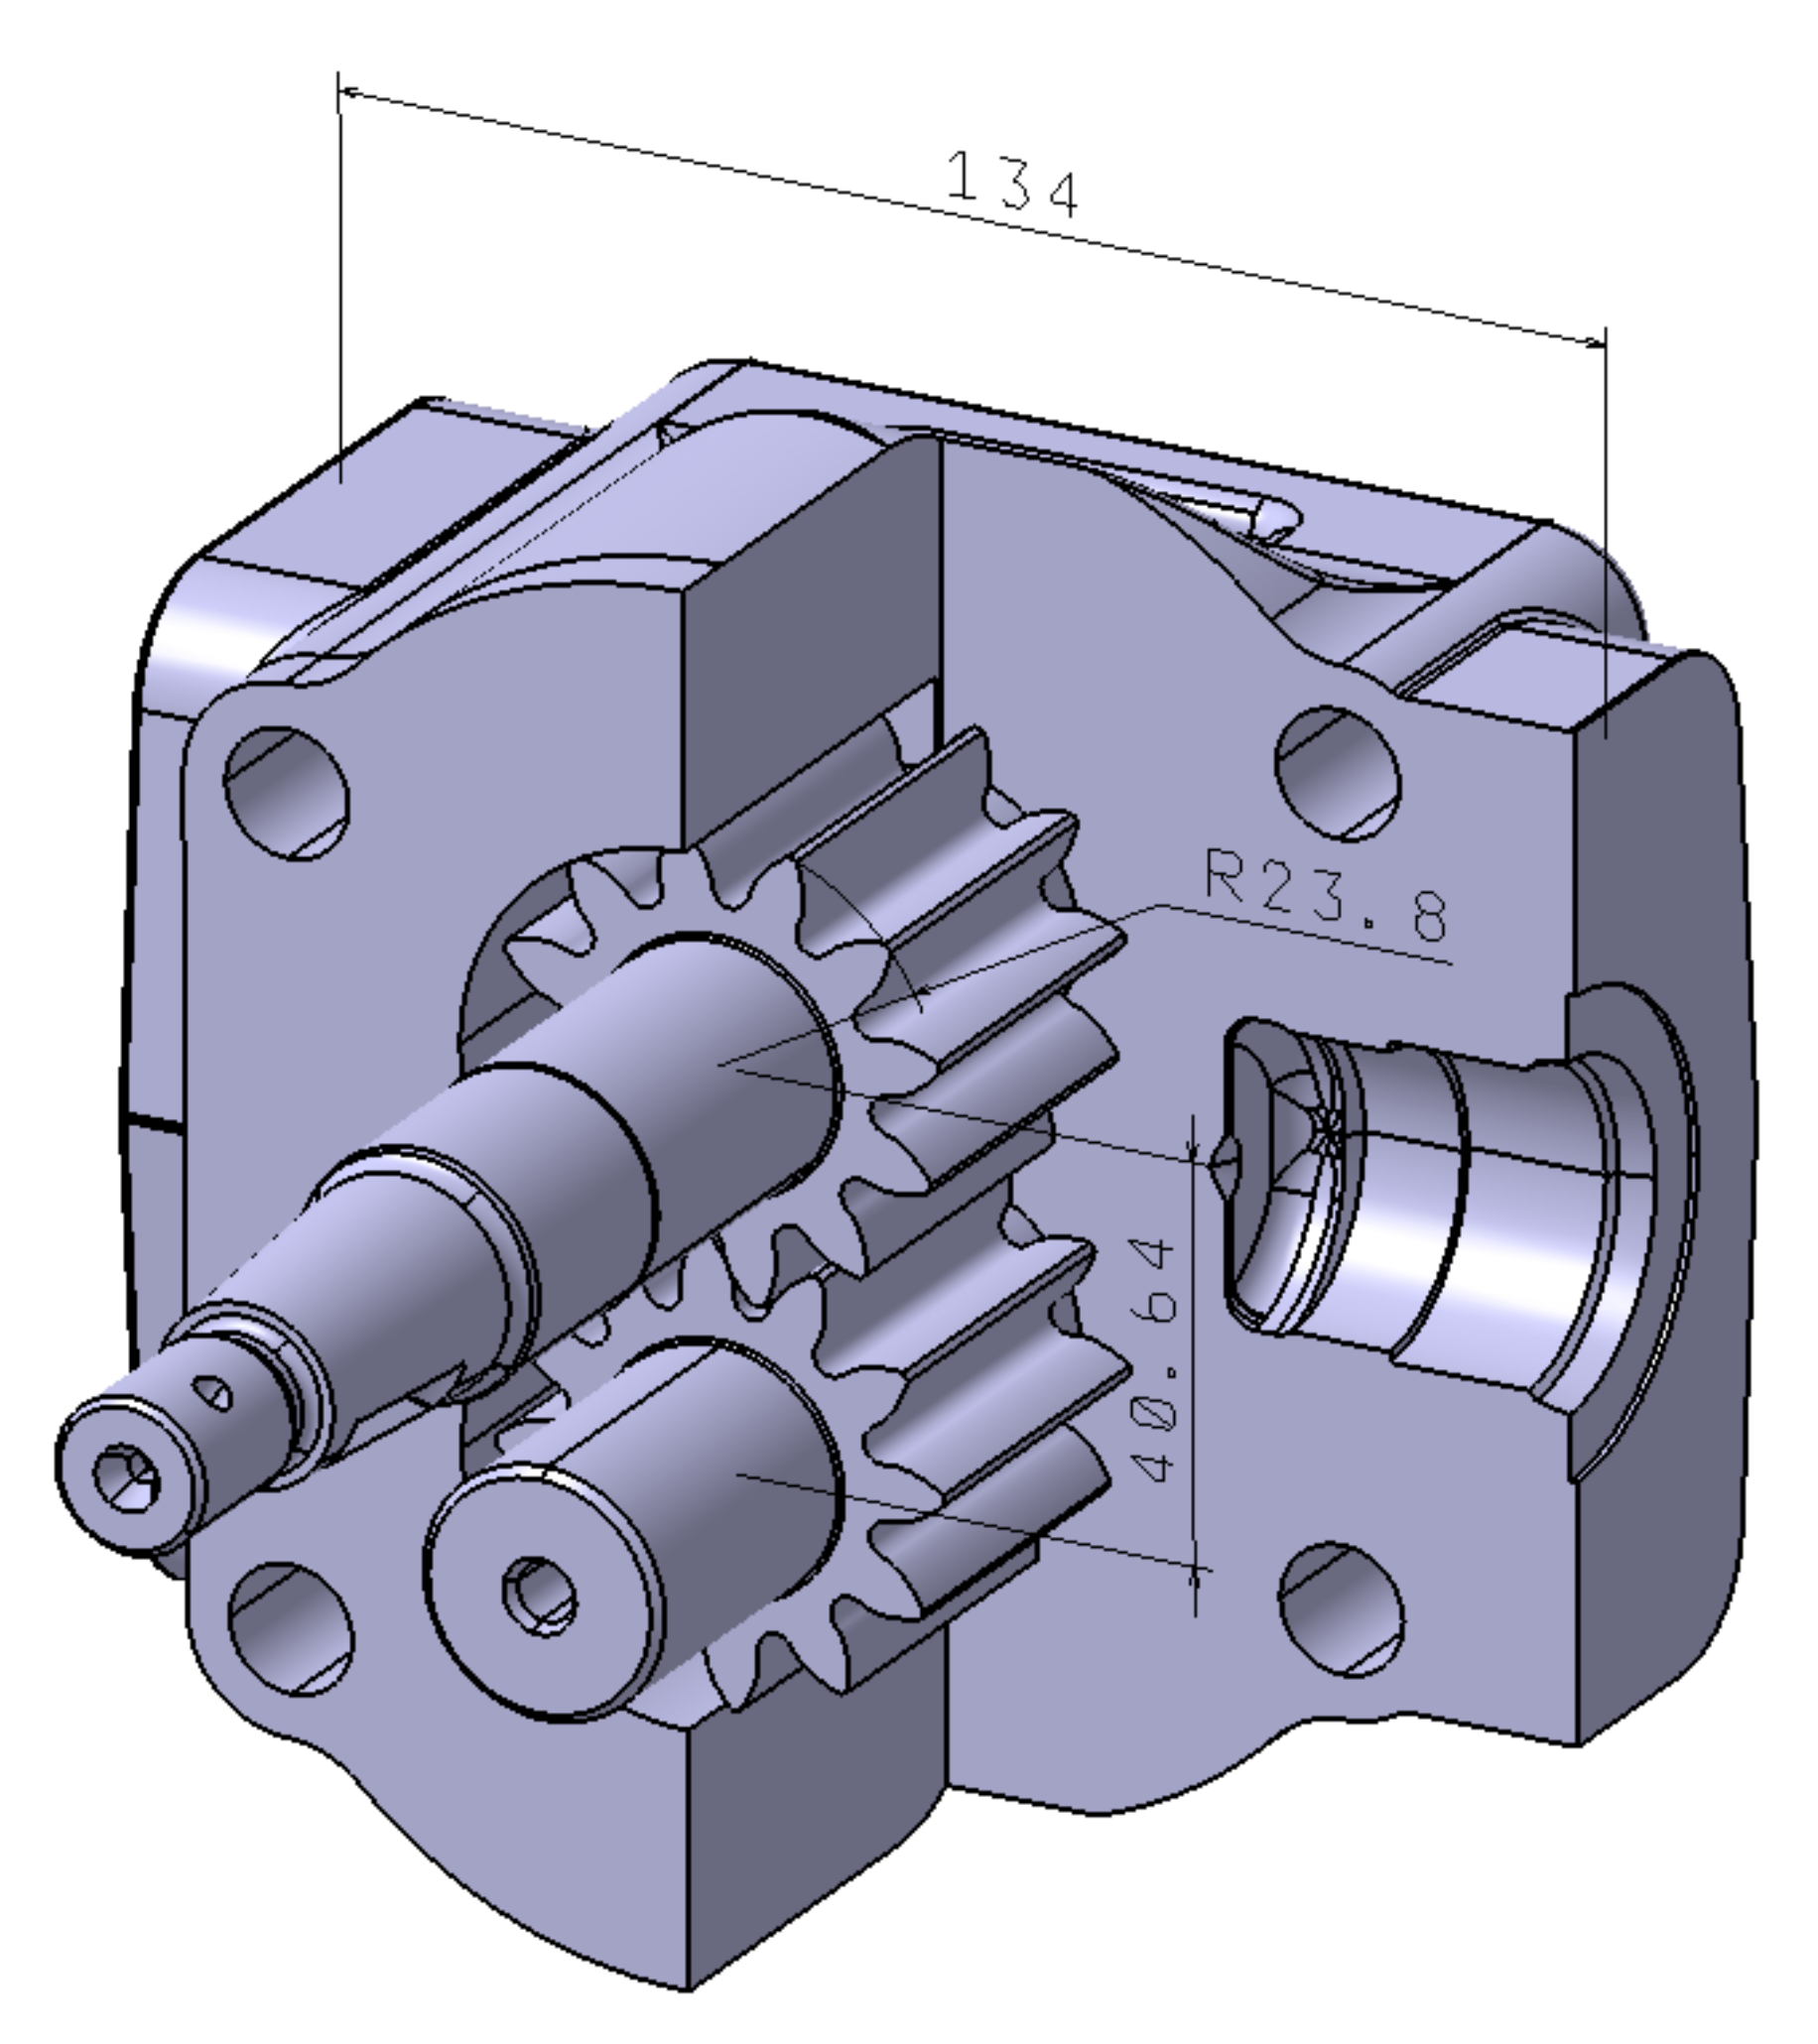
For the analysis, an external gear pump PGP620 with a displacement of 33 cm
3/rev manufactured by Parker Hannifin has been chosen. The pump consists of three main elements: driving gear, driven gear and housing. The investigated pump operates at speeds from 500 to 3500 rpm and continuous pressures of up to 275 bar.
Figure 1 presents the geometrical model of the pump.
Based on the pump geometry, the fluid volume of the pump was created (
Figure 2). It is the basis for preparing the computational domain for the CFD simulations. Because of the complexity of the geometry, simplification of the inlet and outlet channels has been introduced. All modifications were designed to facilitate finite element mesh generation, improve its quality and reduce the computation time. A similar CFD approach has been used in [
7,
8].
Because the flow must be generated from a stationary fluid, it is necessary to use transient flow analysis in the numerical calculations. There are two ways to represent a moving solid:
Previously, the CFD model of the pump has been created using an “immersed solid” approach, which enables simulation of the rigid motion of solid objects through fluid regions avoiding any mesh deformation or remeshing. It has been used to determine the effect of the pump’s operating parameters on the intensity of cavitation. The results were presented in a publication [
19]. As well as its many advantages, the “immersed solid” technique also has some limitations which may affect the results. One of the most important is the fact that the immersed solid surfaces are not explicitly resolved by the mesh. Furthermore, a wall function cannot be applied to this boundary, which means that the quality of such simulation may be lower than that based on dynamic mesh technique. Therefore, in this paper, ANSYS Fluent software was used for the calculations as it allows transient analysis with moving mesh and remeshing options to be performed.
At first, the analysis with a 2D model was performed. For this purpose, a simple surface model consisting of gears, casing, and part of the inlet and outlet ports was created. The simplified 2D model allowed the verification of the correctness of the boundary conditions used and the applied assumptions as well as shortening the processing time. An important issue when creating a CFD model is the sizing of the gap between teeth. As is well-known, the gears are in contact in a real working pump. However, to use dynamic mesh technique, a small gap in this area needs to be created. If this gap is too large, significant losses in the flow will occur. On the other hand, a very small gap forces the use of a very fine grid, which increases the calculation time. For this reason, simulations have been run for three gap sizes to achieve the best accuracy of the model and reasonable computation time.
In the CFD method, the size and quality of the generated mesh significantly affect the simulation results. To define the best grid for further numerical calculations, a mesh sensitivity analysis has been done. This type of analysis is very important as it allows preparation of a model that will correctly predict the real working conditions of the pump. The fluid domain has been divided into three parts: inlet port, outlet port and gear fluid. The gear fluid region is crucial in the meshing process due to the presence of small gaps. It was required to link all regions together so that a conformal mesh was created. To use a remeshing option in simulations, the area of gear fluid was meshed with triangular elements. For the remaining parts, a multi-zone method was used. Efforts were made to obtain good quality mesh; therefore, average skewness of the cells was below 0.12. Using the ANSYS Meshing module, 4 different meshes have been created by changing the grid size in the boundary layers. The models have been called Mesh 1, Mesh 2, Mesh 3 and Mesh 4 and each subsequent has a finer grid size. The first, basic mesh generated for the 2D model contained approximately 80,000 cells, while in the last one this number increased to around 300,000 cells.
In
Figure 3, the values of the flow rate obtained for the models are presented. The simulations have been run at 1500 rpm and delivery pressure of 15 MPa. The diagram shows that increasing the number of cells increases the flow rate at the outlet. The difference visible between the first two meshes is significant and decreases with subsequent cases. The flow rate value stabilizes from the
Mesh 3 indicating that further mesh refinement only slightly affects the results. For this reason, the
Mesh 3 model has been chosen for further simulation studies that were carried out using software and hardware available at the Wroclaw University of Science and Technology.
Simulations have been run on an Intel® Xeon® E5-2667 v4 CPU 3.20 GHz (two processors) with 128 GB RAM. As is known, the increase in the number of cells causes an increase in computation time. For the selected model (Mesh 3), this time was close to 6 h per revolution. Thus, the best compromise between accuracy and computational time was achieved.
Before starting the simulation, the selected surfaces were named (
Figure 4), and the boundary conditions were applied to them (
Table 1). The analyzed case is a transient flow problem due to the rotating movement of gears. This motion was described by the user-defined function (UDF) which defines the movement of mesh nodes according to the given rotational speed.
The analysis was performed taking into account the following assumptions:
By considering the above assumptions, numerical simulations are based on the system of equations that contains [
9]:
Flow continuity equation:
Two scalar equations of the Navier–Stokes equation:
CFD calculations were conducted using a pressure-based solver. The realizable
k-ε turbulence model that contains a new formulation for the turbulent viscosity and a new transport equation for the dissipation rate was used. This model more accurately predicts the spreading rate of the jets, and it is likely to provide higher performance for flows involving rotation, boundary layers under strong adverse pressure gradients and recirculation. The modeled transport equations for
k and
ε in the realizable
k-ε model can be represented as follows:
where:
In these equations,
Gk and
Gb represent the generation of turbulence kinetic energy due to the mean velocity gradients and buoyancy, respectively.
Gk and
Gb are calculated based on the formulas:
C
2 and C
1ε are constants while
σk and
σε are the turbulent Prandtl numbers for k and ε. The model constraints are:
As in other
k-ε models, the eddy viscosity µ
t is computed from:
Contrary to a standard k-ε model, the Cµ value is no longer constant, and it is a function of the mean strain and rotation rates, the angular velocity of the system rotation, and the turbulence fields. The method of determining the Cµ is described in detail in the ANSYS Fluent documentation.
As mentioned earlier, a dynamic mesh approach was used in the simulations. The gear fluid area was assigned as a deforming zone with smoothing and remeshing options enabled. To ensure good mesh quality, the grid was remeshed at each successive time step keeping the skewness below 0.6.
In all simulations, the SIMPLE scheme was used to solve the pressure-velocity coupling calculations. The convergence of the solution was judged by examining the residual levels and additional quantities such as the mass flow rate. The convergence criterion for the analysis has been reduced from the default value of 1 × 10⁻³ for residual to 1 × 10⁻⁶. The size of the time step was set to 1 × 10⁻⁶ s.
The CFD analysis carried out for the 2D model provided information on the velocity and pressure distribution of the fluid, the intensity of the turbulence and local fluid flow swirls. In addition, it allowed verification of the correctness of the simulation model. To verify whether the model properly shows the fluid flow phenomena occurring in the gear pump, the pressure and velocity distributions from one of the simulations were analyzed. The generated pressure and velocity maps presented in
Figure 5 and
Figure 6 correctly reflect the fluid flow behavior occurring in the external gear pump.
Validation of the CFD model was performed by comparing the results from the simulation and experimental studies presented in [
5] for the same gear positions. In
Figure 7, the velocity vectors obtained from the simulation and the photo taken with a fast camera during the visualization research of an experimental gear pump are presented.
In both cases, a characteristic vortex appears in the gear engagement area. Its localization depends on the stage of the involute gearing in the pump. It can be seen that the directions of the velocity vectors are consistent for the compared position of the gears. In the analyzed cases, in addition to changing the flow direction, the flow velocity significantly increases. Comparison of the results showed a significant similarity between the results of CFD calculations and visualization studies. For this reason, it can be assumed that the prepared simulation model correctly reflects the fluid flow phenomena occurring during the pump operation and can be used to conduct further research.
The resulting pressure distribution and vector plots in the gear engagement area show that the fluid flow turbulences and, thereby, the negative pressure increase with increasing rotational speed (
Figure 8 and
Figure 9) and decrease while reducing the outlet pressure (
Figure 10 and
Figure 11). It should be added that comparison of the results reveals that changes in the pressure in the outlet channel less than the rotational speed change affects the intensity of the cavitation phenomenon.
Using a single-phase CFD model, prediction of the cavitation phenomenon is based on the analysis of the pressure and velocity distributions. The high negative pressure values visible in the obtained results do not exist in reality because when the pressure drops below the vapor pressure value, air bubbles start to appear, and the pressure stops decreasing. To verify the fluid flow phenomena occurring in the gaps and to investigate their influence on the volumetric efficiency of the gear pumps, additional research has been carried out.
3. Analysis of Leakages in the Gaps
The volumetric efficiency of external gear pumps is reduced due to the flow inside the gaps, which are present due to clearances between the gears and adjacent components. The leakages that appear in the gear pump are shown in
Figure 12.
Volumetric losses result mainly from leakages of fluid due to the pressure difference and can be described in the form of the equation:
where:
—leakage losses
—losses in the axial gap
—losses in the radial gap
—bearing losses
—losses in the meshing zone
The most important in the context of volumetric losses are the flows occurring in the axial and radial gaps [
7,
18]. Leakages in the axial gap occur due to the pressure difference between the high- and low-pressure areas and due to the difference in the velocity in the axial gap resulting from the rotation of the gears.
More than 20 simulations were carried out using the CFD model. To analyze the results, a monitor point was defined at the outlet to show changes in the mass flow rate. The obtained data were converted in a suitable manner to receive the results in the form of flow rate (
Figure 13). It can be seen that an increase in the delivery pressure causes an increase in the amplitude of the flow ripples and the minimum flow rate reduces.
The model was used to analyze the influence of the radial gap on the pump flow rate (
Figure 14). For this purpose, for the chosen operating parameters of the pump (n = 1500 rpm, p = 15 MPa), numerical calculations for different sizes of the radial gap have been done. The results are presented in
Figure 15, where
Qa is the actual flow and
Qt is the product of pump displacement and rotational speed.
It can be seen (
Figure 15) that increasing the radial gap leads to a decrease in the flow rate of the pump. The higher the gap value, the greater the drop in the flow rate. If the radial gap is smaller than 0.02 mm, the changes in the flow rate are relatively small.
It is well-known that the gears during the pump operation are not centrally located in the bores of the housing. Depending on the pump’s operating parameters, there is an eccentricity of the position of the gears caused by the operation of the slide bearings (
Figure 16). At higher pressures, the eccentricity of the gear wheel position increases. In
Figure 17, the forces resulting from the pressure are assumed with angles α
1, α
2 of the inlet and outlet bores. During the pump operation, the directions of the pressure forces α
1, α
2 are slightly different and depend on the operational conditions of the pump.
Due to the clearance in the bearings and the pressure forces acting on the gears, the influence of the gears’ eccentricity on the pump’s efficiency was verified. During the construction of the geometric model, it was assumed that under the influence of high pressure, both gears move equally in the direction of the axis of the suction channel, which increases the radial gap size on the discharge side. Four different values (0, 0.002, 0.006, 0.01 mm) of the eccentricity (e) were considered, in the last case obtaining a minimum size of the radial gap equal to 0.01 mm. The direction of the gears’ movement considered in the simulation tests is shown in
Figure 17.
In
Figure 18, it is shown that an increase in the gear’s eccentricity leads to an increase in the flow rate and a decrease in leakages in the radial gap. The position of the gears also affects the pressure changes on the circumference of the gears, as shown in
Figure 19. It is visible that the pressure increase is faster with larger values of eccentricity.
To analyze the flow in axial gaps, the 3D CFD model containing relief grooves geometry was created (
Figure 20). To minimize the required computing power, the geometry used for the calculations was reduced to half. Appropriate interfaces for the surfaces in contact with each other were defined. All boundary conditions and simulation settings were copied from the previous model. Additionally, the symmetry condition was defined for the corresponding faces and interfaces between surfaces in contact were added.
The model (
Figure 20) allowed investigation of the influence of the axial gap size with regard to the flow rate. Twelve simulations were created for different operating parameters of the pump such as the discharge pressure and rotational speed. All analyzed cases are presented in
Table 3. The data obtained during the calculations were presented in the form of the pump volumetric efficiency dependence on the axial gap size. The presented plots show a significant influence of the axial gap value on the volumetric losses of the pump, which was also confirmed by the authors in [
11,
20]. The curves have the shape of a square function and show an increase in volumetric losses with an increase in the gap size. The identified increase is larger for higher discharge pressures.
Based on the simulation results, the pressure distribution in the axial gap for several positions of the gears was generated (
Figure 21). From the results, it can be seen that the pressure distribution inside the axial gap changes over time. It depends on the location of the contact points of the cooperating teeth pairs. Velocity distribution also varies depending on the stage of the involute gearing in the pump.
In the simulations, a value of the radial gap of 0.02 mm has been used. Additionally, it was assumed that the size of both the radial and axial gaps is constant and does not depend on the operating parameters of the pump. The results of the calculations made for the selected parameters and sizes of axial gap are presented in
Figure 22. The presented plots show a significant influence of the axial gap value on the volumetric losses of the pump. The curves have the shape of a square function and show that the flow rate and thus the volumetric efficiency of the pump decreases with the increasing value of the axial gap. The observed increase in volumetric losses is larger for higher discharge pressures.
4. Experimental Investigations
To verify the results obtained from the performed CFD calculations, experimental tests were carried out in laboratory at the Faculty of Mechanical Engineering of the Wroclaw University of Science and Technology. The external gear pump manufactured by Parker Hannifin Corporation has been tested on a dedicated test bench (
Figure 23). Previously performed simulations have been run for similar operating conditions tested in the lab. The pump flow rate for speeds of 920, 1500 and 2500 rpm and different delivery pressures was measured.
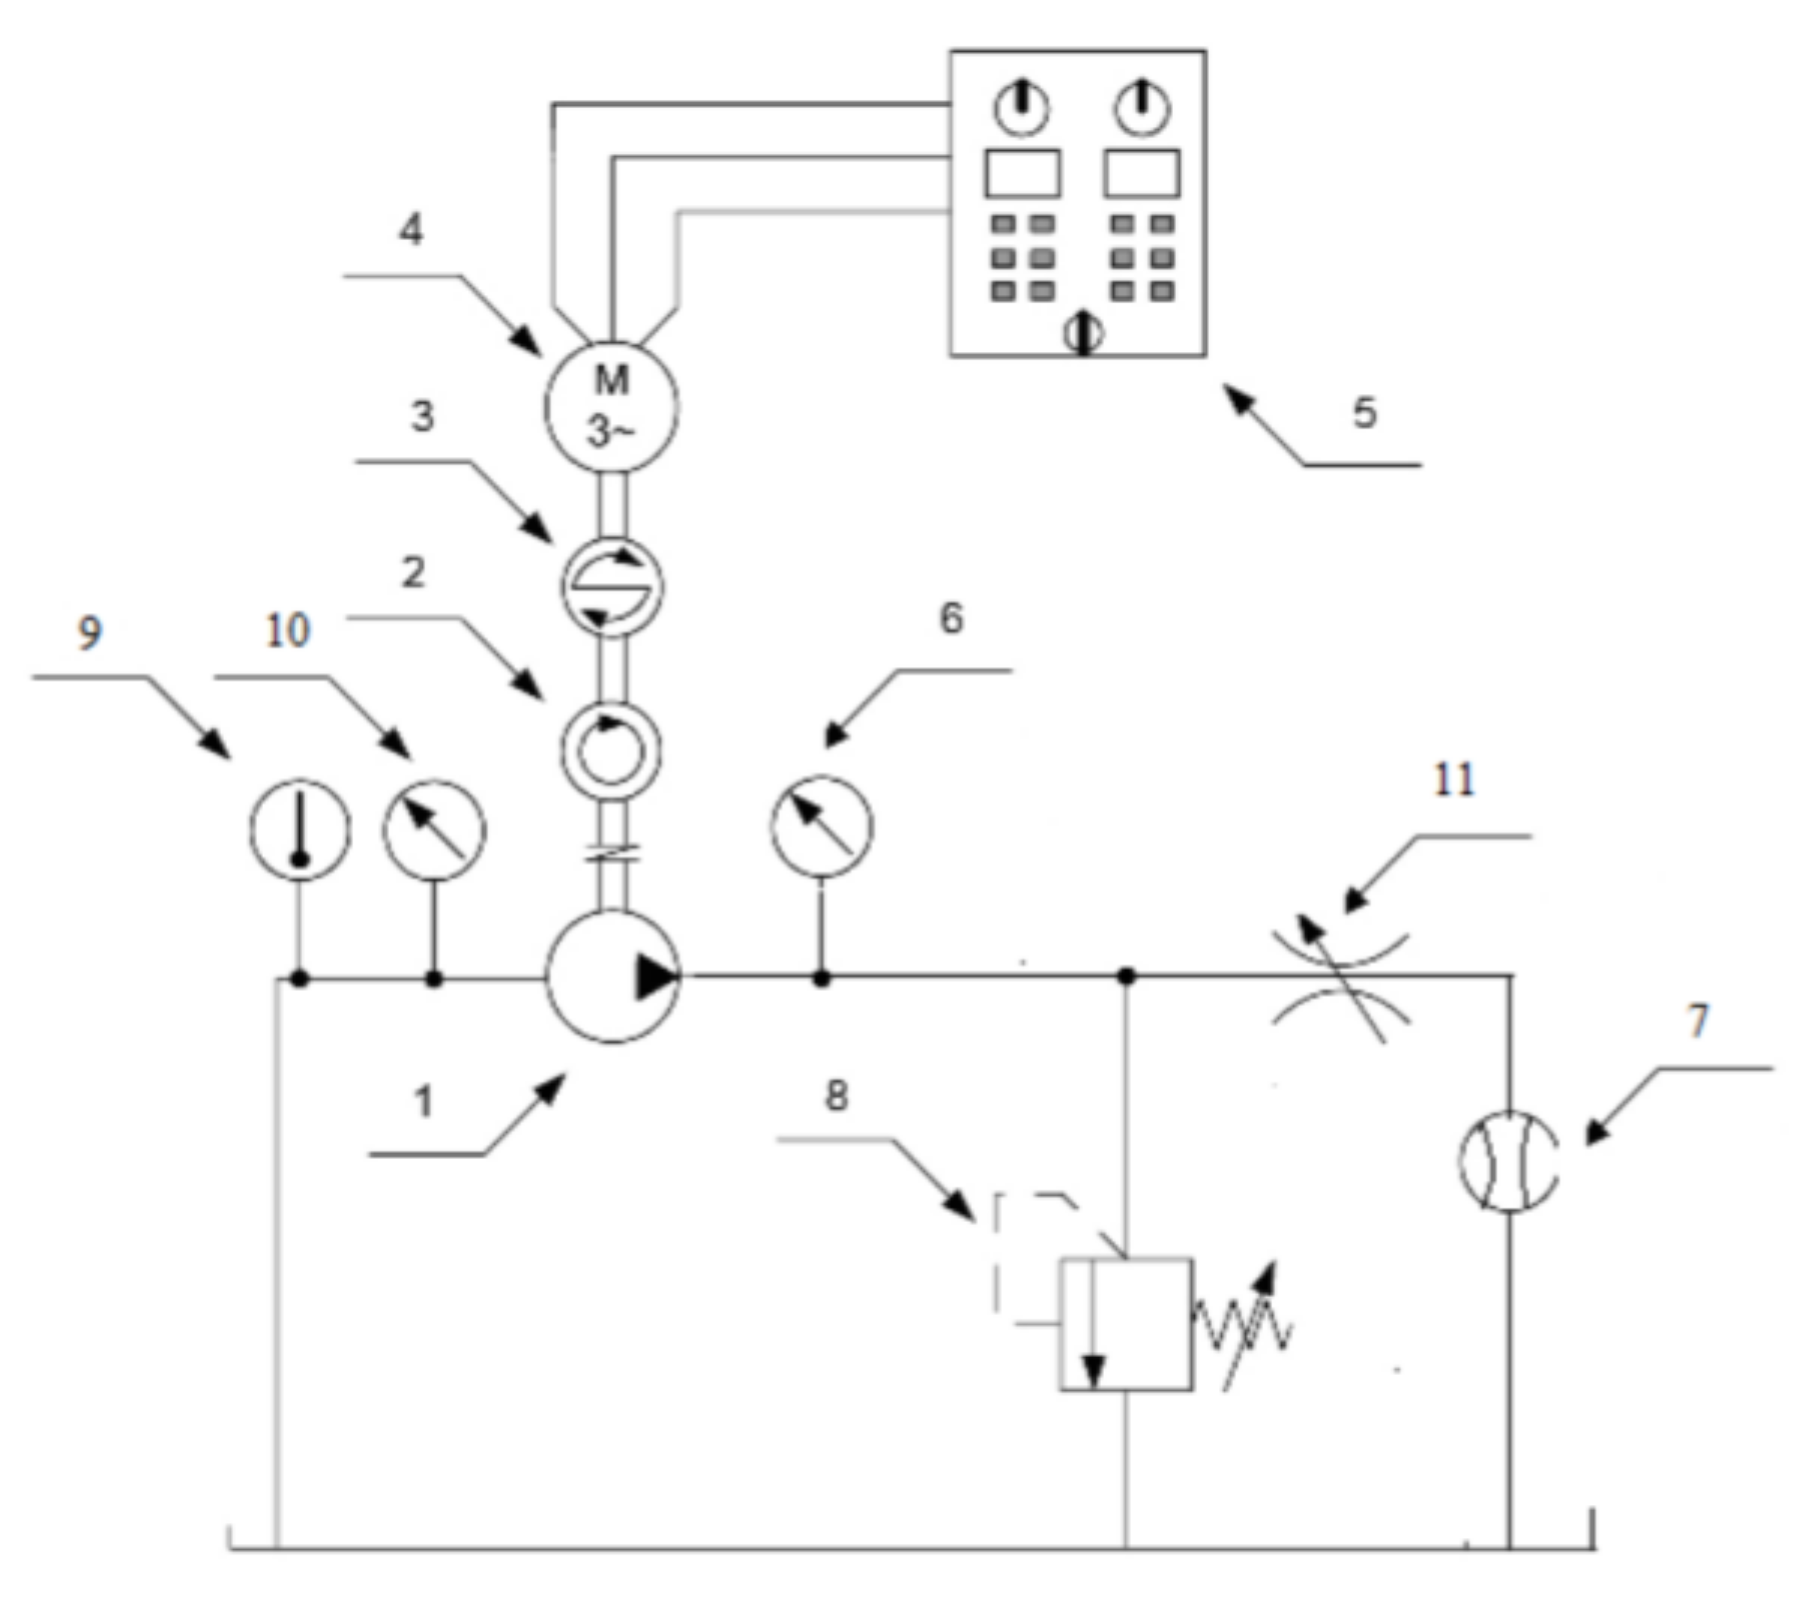
The test bench layout is shown in
Figure 24. It consists of the tested pump which is driven by an electric motor (4) and protected against overload by a safety valve (8). The load of the pump is realized by the throttle valve (11). At the output of the pump unit, the absolute pressure (6) and flow rate are measured (7). The pressure transducer SCP 400 from Parker (6) with a measuring range of 0–400 bar and accuracy of 0.5% was used. The turbine flow rate meter SCFT-060 (7) is from Parker (measuring range: 3–60 lpm, measured value accuracy +/−0.5%). The torque on the shaft is measured using a torque meter (3). The speed of the pump is measured on the pump shaft using a photoelectric sensor. The oil temperature is controlled using a temperature sensor (9).
The test bench (
Figure 23 and
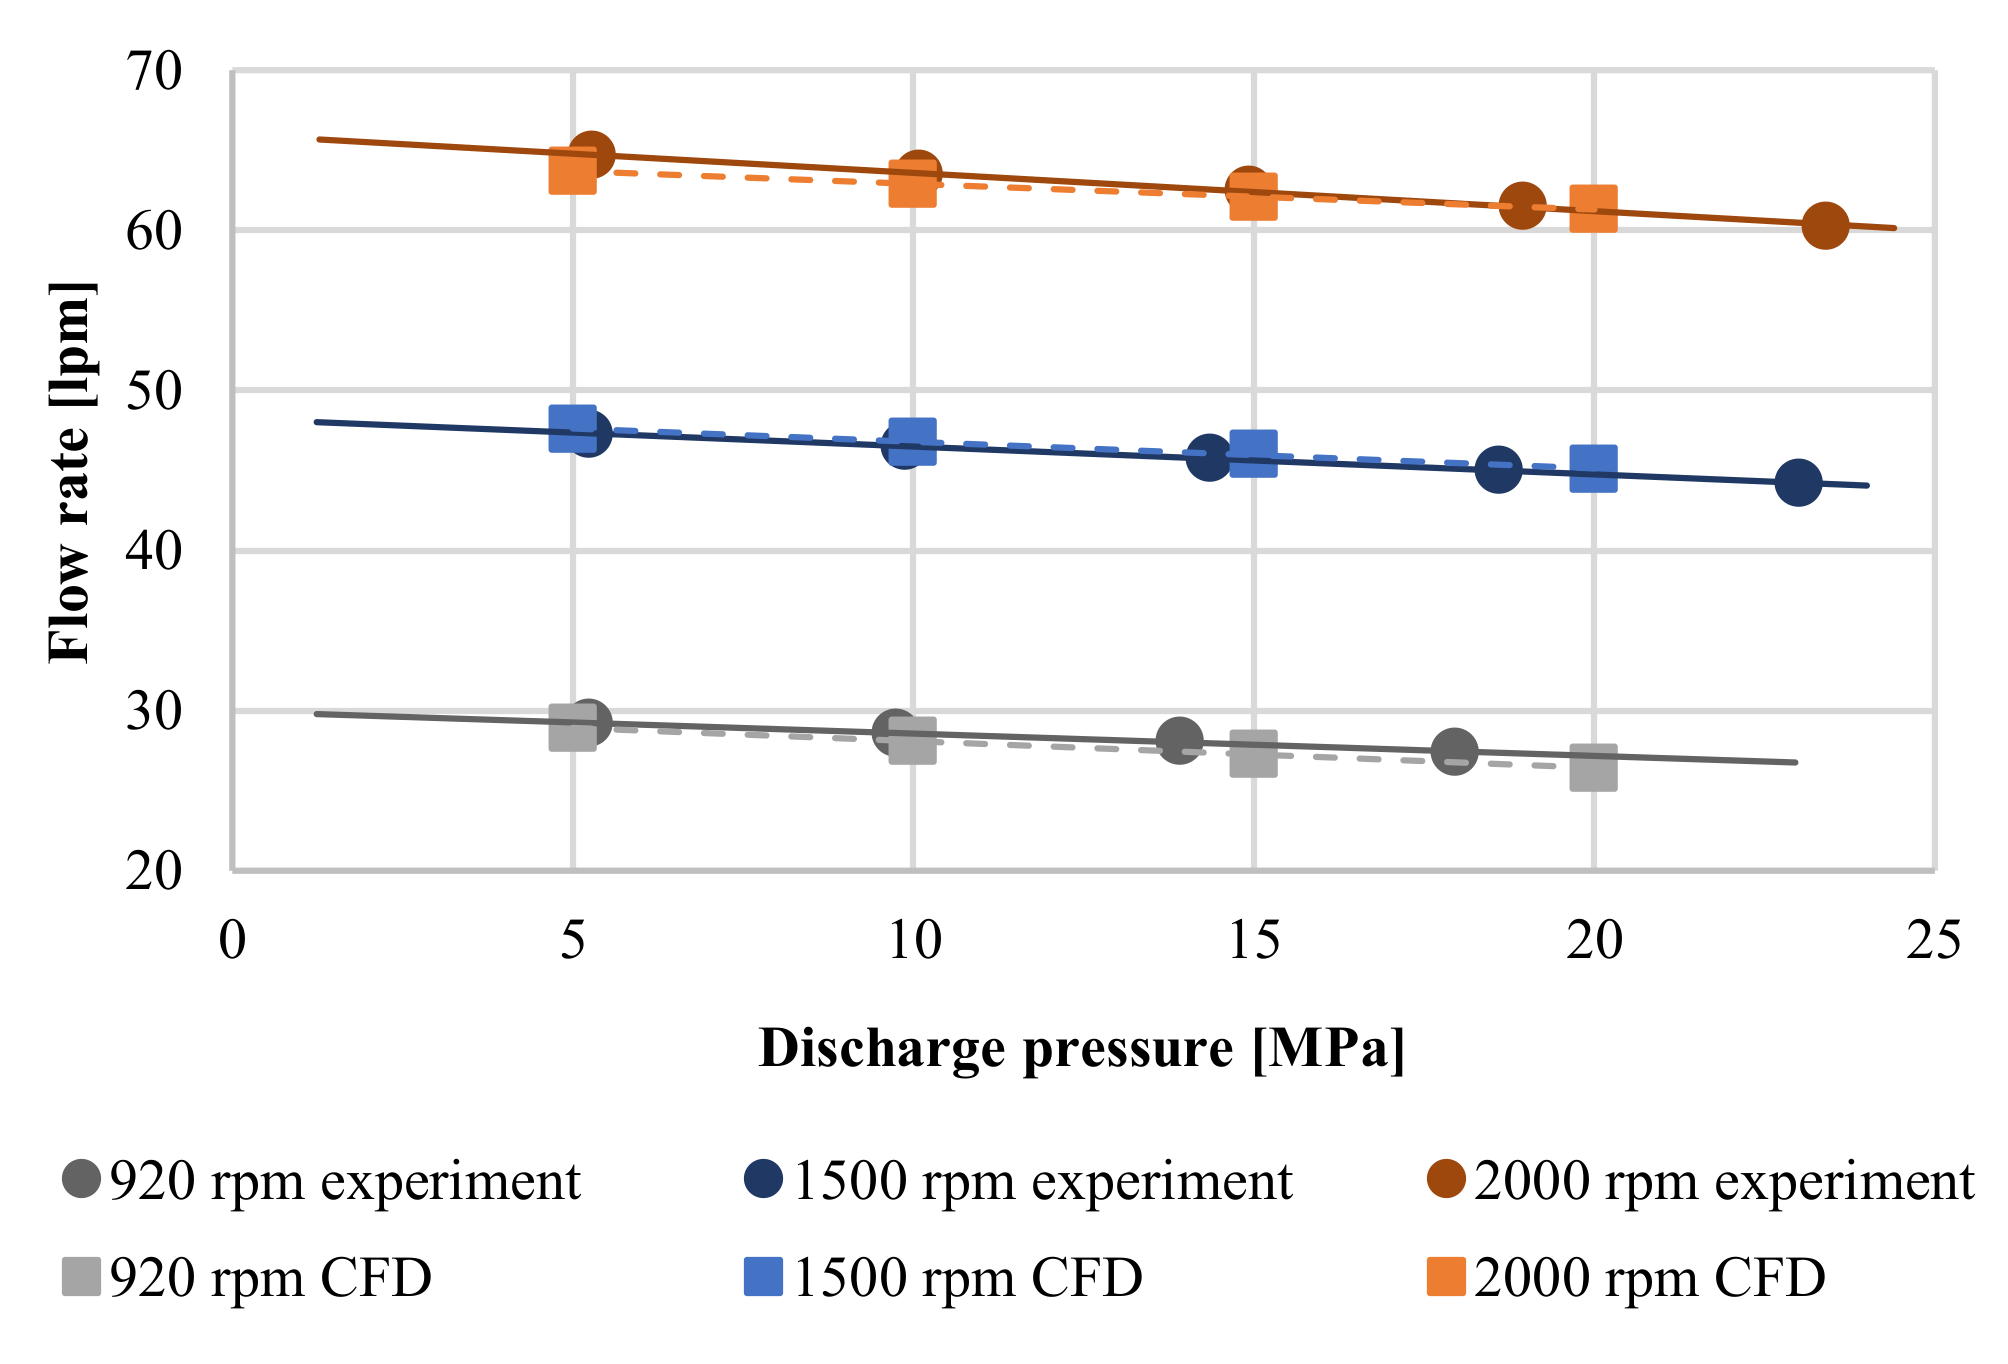
Figure 24) allows verification of the pump efficiency for different operational parameters and different oil temperatures. In
Figure 25, the pump flow characteristics for different rotational speeds are shown. The flow rate of the pump increases with the rotational speed and decreases with the delivery pressure.
For the chosen operation parameters of the pump (n = 1500 rpm, p = 15 MPa), the flow rate diagrams obtained from the experimental investigations, 2D (
Figure 26) and 3D (
Figure 27) model simulations were compared.
It can be concluded that there is a good coincidence between the experimental and simulation results. Differences between the efficiency obtained experimentally and from the simulation tests for the 2D model do not exceed 2%. For the 3D model, this value depends on the analyzed case and at higher rotational speeds, it did not exceed 3%, while at the lowest analyzed speed it was 8%.
Comparing the results obtained for both models, it can be seen that the axial gap significantly affects the value of leakages in the external gear pump (
Figure 28). The differences in volumetric losses between the 2D and 3D model grow with increasing discharge pressure. For low values of pressure, this difference is small. Visible discrepancies may result from the simplifications that were introduced to the simulation models.
5. Discussion of Results
As part of the study, a number of numerical simulations were carried out based on the developed CFD models. The results have shown that the operating parameters of the pump as well as the gaps between the gears and adjacent components have a significant influence on the fluid flow phenomena occurring during the pump operation and thus its volumetric efficiency.
Simulations based on the 2D model confirmed that increasing the radial gap value causes a decrease in the flow rate. While preparing the CFD model, the eccentric position of the gears was taken into account. The analysis of the results showed that the increase in eccentricity has a positive effect on the pump’s volumetric efficiency and leads to faster pressure build-up at the circumference of the gears.
The numerical calculations with the 3D model, which take into account the axial flow, have shown that increasing the axial gap value leads to a decrease in the flow rate which depends on the delivery pressure. Due to the fact that the eccentric position of the gears has a positive effect on the tightness of the pump, it is to state that the losses in the axial gaps have a greater influence on the total volumetric efficiency of the gear pump than the radial gaps.
Some simplifications were introduced during the construction of the 2D and 3D models. The sizes of axial and radial gaps were assumed to be constant. It is well-known that the values and shapes of these gaps strongly depend on the operating parameters of the pump. If the axial gap compensation is correctly selected, it can be assumed that the axial gap is parallel. Moreover, the assumed sizes of these gaps have not been yet confirmed experimentally.
Furthermore, any additional losses may occur in the prepared models due to the assumed gap between teeth. In real conditions, the gears are in contact, and this gap does not exist. To use dynamic meshing and at the same time decrease the computing time, a small gap in this area was created. This could reduce the flow rate as shown in [
15]. Use of the solid contact point could explain the disagreement with experimental results for lower rotational speeds and higher discharge pressures. For this reason, further research in this area is planned.


