1. Introduction
A building envelope plays a very important role not only in limiting heat losses, but also in limiting heat gains, which has impact on energy demand for space cooling [
1]. It can be affected by such factors as heat accumulation capacity of building partitions [
2], the impact of applied insulation materials [
3] or their damage [
4,
5]. Owing to constant improvements of thermal insulation of buildings, the significance of the relative share of energy losses involving air infiltration has increased [
6]. The impermeable enclosure of the building eliminates unintentional air infiltration, and by minimizing heat energy consumption, it reduces the operating costs of buildings [
7,
8]. Thus, the level of tightness is an important feature of building structures, and specifically that of residential buildings. It has been widely recognized that air leaks in buildings contribute significantly to energy losses in buildings where both heating and cooling are required.
The study by Orme [
9] on residential and service buildings in 13 industrialized countries estimated that due to the loss of conditioned air, unnecessary ventilation was responsible for over 60% of energy losses in commercial and residential buildings. Of course, the percentage of heat loss through ventilation may have changed over the years, but the conclusion offered in this work regarding the share of air exchange in heat loss is still valid. Besides, it is worth noting that the way the buildings are used is not irrelevant. The behavior of building users and the way they decide to control heating or ventilation affects the level of comfort they accept and the microclimate of the environment inside the building [
10,
11]. All these factors also have impact on energy efficiency in building construction.
The following methods are used to measure the tightness of buildings: fan pressurization test method (Blower Door Test BDT) [
12,
13,
14], pulse method [
6], oscillation method, decay method [
15] and acoustic method [
16,
17]. In acoustic tests, acoustic insulation of the building façade is measured, taking into account the reverberation time inside it [
18,
19]. In the BDT approach, the test is performed by measuring the air flow stream and pressure difference between the inside of the building and the outside environment. The pulse technique measures the tightness of the building at low pressures by releasing compressed air into the test space. The oscillation method and the decay method as well as the pulse method belong to the so-called unsteady pressurization methods, referred to as AC method [
20]. As early as in the 20th century, research studies were conducted on airtightness measuring techniques, especially fan pressurization, for modeling infiltration and to design ventilation systems [
21]. The most commonly applied measuring method of building airtightness is the fan pressurization test method. The method is described in the European standard EN 13829 [
22]. The test is carried out by quantifying air flow rate with the difference between the inside of the building and its outside environment being 50 Pa. The method consists of mechanical increase or decrease of pressure in the room using a blower door installed in the entrance doorway. The value of 50 Pa is not the actual pressure difference between the inside of the building and its outside environment, yet when the actual pressure difference is low, it is difficult to ensure a precise measurement of air flow rate. This pressure is sufficiently high for the obtained results to be independent of weather impact. Most countries define their airtightness requirements with the n
50 coefficient (a multiplication factor of air exchange in the building effected by pressure difference of 50 Pa) [
23].
Current research in many cases involves the analyses of places where leaks occur [
24,
25], which triggers the development of practical solutions such as: novel work execution details, technological or material solutions. Some authors focus on determining the impact of technical parameters on the tightness of a building envelope. The reviews of current works offer items focusing only on wooden constructions [
26], but most frequently, they are not devoted to determining what factors affect the tightness of single-family residential buildings made in the prefabricated wood frame technology. For example, in the collective work led by Dederich [
27] devoted to wooden constructions, we can find general rules for the construction of an airtight building envelope. And Kalamees [
26] presented airtightness tests of buildings with wooden structures, but he considered only air leaks through the joints of external walls. Although some of the authors [
28,
29,
30,
31] address the above-mentioned subject matter, they do it with reference to various execution technologies of building objects. It is believed that air tightness is strongly related to execution technology [
14,
29].
In traditional building construction (brick walls, prefabricated ceilings), the problems are different than those in wooden constructions, both in terms of the execution and design. Given that the market share of “finished wooden houses” is increasing, identifying the factors that have the greatest impact on the airtightness of buildings is, therefore, particularly valuable.
As shown in the work overview, the scientists present different research methods for building airtightness. However, the impact of a single factor or jointly of many factors on the parameters describing the tightness of a building has not been determined. Therefore, in this article, factors such as the number of installation holes through the walls, electrical installation points, the number of windows, the number of chimneys, the number of prefabricated elements or the total contact length of external walls with the foundation slab have been identified, and their impact on the tightness parameters of the building envelope was determined. The influence of the examined factors on the n50 parameter was verified by the statistical hypothesis stating the presence or absence of a relationship between them.
In the study, using a multivariate analysis, the authors determined to what extent the specific issues have a substantial impact on the tightness of single-family residential buildings made in the prefabricated wood frame technology, such as: structural solutions, architectural concept (building block), material solutions, routing methods of installation.
2. Materials and Methods
2.1. Examined Objects
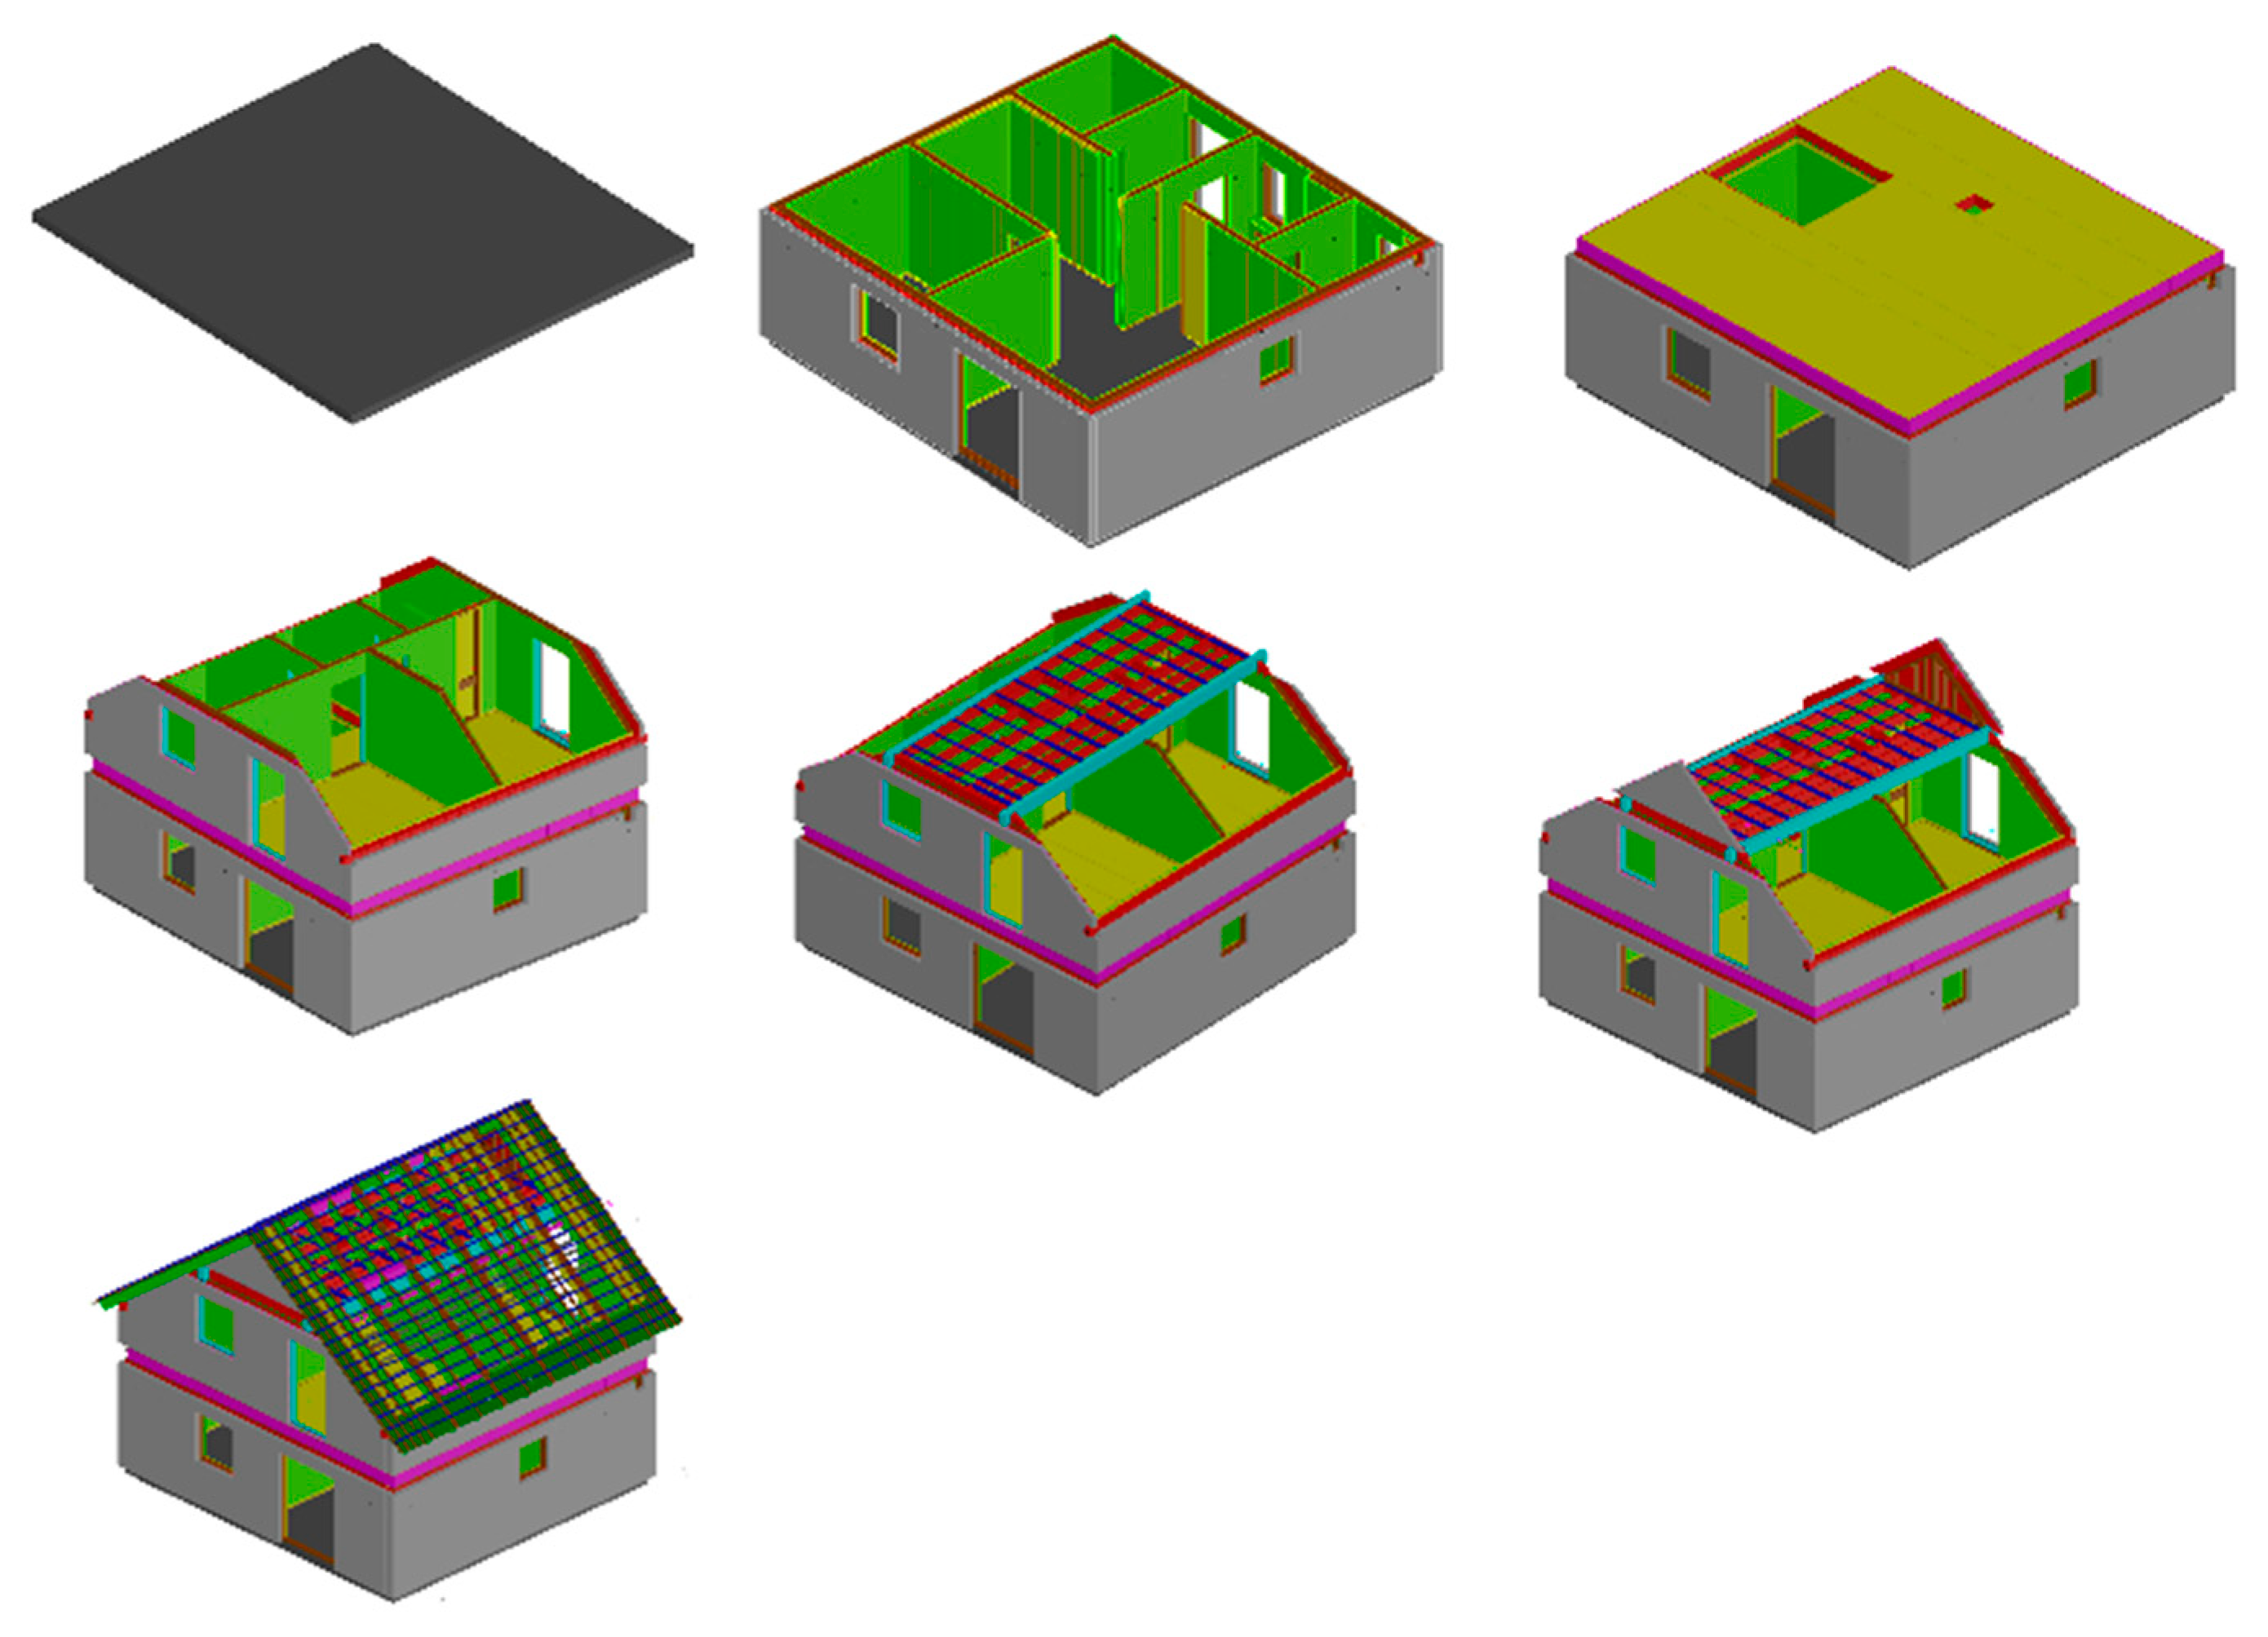
The examined objects were single-family residential buildings made in the prefabricated wood frame technology in line with the pattern presented below:
As the first stage of construction, reinforced concrete foundation slab is made on site.
After the concrete mix has reached its full strength, the object is assembled.
A schematic of the construction process of such a building is presented in
Figure 1 and
Figure 2.
All the examined objects were realized in the frame system with the use of Wolf prefabrication system. The Wolf prefabrication system is presented in
Table 1,
Table 2,
Table 3 and
Table 4. The tested residential buildings were built in line with individual designs and solutions dedicated to a given system.
The examined buildings differed, among others, in the number of storeys, roof structure, wall construction system, the presence or absence of garage in the building body, net floor area, cubature, number of window openings and porch area (see
Figure 3).
All the tested buildings were numbered from 1 to 40 in the order of measurements in a given building.
Table 5 presents the main data involving the listed buildings. The following
Table 6 presents the features of buildings corresponding to numbers 1–40 as in
Table 5.
There were two types of roof structure in the examined objects. The first of them is purlin roof presented in
Figure 4a. The second type of roof structure is roof truss presented in
Figure 4b.
The essential stage of statistical analyses involves the selection of a research sample. In order to select a statistical sample, it was decided to use the so-called targeted selection. The main assumption of the sample selection was to collect a similar number of objects with truss roof and objects with a fully prefabricated roof structure.
2.2. Parameters Describing Tightness
The parameters describing building tightness include the amount of air exchange
nΔpr (h
−1) under the conditions of pressure difference (the most commonly used Δ
pr = 50 Pa):
where:
VΔpr—value of the average air leak at a given pressure, [m
3·h
−1];
V—cubature of the interior—the cubature of the interior is calculated by multiplying the net floor area by the average net room height, [m
3].
This value determines how many times per hour the air filling the building can be exchanged at a pressure difference of 50 Pa. Another quantity, slightly less frequently used and not taken into account in this article, is q50 [m3/(hm2)], which defines the volume of air per 1 m2 of external envelope area of the building [m2] and can be introduced into the building within an hour under conditions when the difference pressures of 50 Pa is maintained.
2.3. Measurement Procedure
The measurements were carried out in Silesia, Poland. The location of the region is between 49°23′38″ N and 51°05′58″ N and between 18°02′05″ E and 19°58′26″ E. The measurements were carried out in the period March–May 2020. The average temperature was between 3.0 °C for the month of March and 13.4 °C for the month of May. And the average relative humidity of air was 76% in March and 69% in May.
Table 7 presents the measuring equipment used for the tests.
The tightness tests (Blower Door Tests) were performed on the basis of the standard [
22], according to which the measurements involve all rooms with mechanical ventilation or air-conditioning within the tested building. It was important during the tests that the tested object was tested for tightness after the completion of all works related to the creation of a tight coating of the object. These works mainly involved the application of vapor barrier foil overlaps from all prefabricated elements with Airstop tape, sealing the installation holes, making the roofing, and eliminating or securing places of potential uncontrolled air leaks. These places included electrical points in external envelopes, window ventilators, inlets or outlets of ventilation systems. The tests were carried out at various stages of finishing works, which do not affect the tightness of the building. The works include internal cladding of the building, painting works, tiling, façade works, etc.
Before the measurements, all openings in the building envelope made in compliance with the design, such as: windows, doors, chimney openings, air inlets, air outlets, installation elements and the like were plugged or closed. Each tested object was configured to respond to pressure as one zone. All internal doors in the building were opened so as to maintain even pressure of approx. ±10% of the measured pressure difference between the inside of the building and the outside environment. The visualization of the measurement is presented in
Figure 5.
The test was performed in line with the following procedure:
The measurements were made in compliance with the standard [
22] and all the conditions contained therein. The gauges have built-in patterns and perform auto-calibration after each switching on.
The measurements of temperature and wind speed were made. The product of the difference of temperatures (internal and external) and the height of the building is to be lower than 500 m·K. Wind speed is to be lower than 6 m/s.
Logging pressure difference under zero flow conditions.
Proper measurement—it was carried out by measuring the air flow stream and pressure difference between the interior of the building and the external environment within the applied pressure difference values at intervals not higher than 10 Pa. In the case of single-family houses with a cubature of less than 4000 m
3, the highest pressure difference was not lower than 50 Pa.
Figure 6 shows the installed measuring system, while
Figure 7 shows the sealing of places with a potential uncontrolled air leak.
The measurement was performed in two series of measurements, under negative pressure and overpressure conditions. In each test, at least five equidistant measuring points were determined between the highest and the lowest pressure value.
2.4. Statistical Methods
For the purpose of statistical analysis, scatterplots were made and then the H1 hypothesis was verified—there is no statistically significant relationship between the examined features against the alternative hypothesis H2 stipulating that such a relationship exists. The test of the hypothesis was carried out using the F statistic. An important element of this statistic is the “p” value of test probability.
Then, the H1 hypothesis, which stipulates that the examined characteristics are independent, was tested using the chi-square test.
3. Results and Discussion
3.1. Measurement n50
In line with the objective of the research, first, the results of measurements involving the exchange of internal air through the leaks of building envelope at a pressure difference of 50 Pa relative to the environment were compiled for 40 tested buildings.
Table 8 presents the results as the arithmetic mean of the measurements under overpressure and underpressure conditions together with the standard uncertainty. The results presented in
Table 8 will be used for further statistical analyses.
In line with the preset objective of the work, the impact of the selected features of the object on the value of parameter n50 was determined.
3.2. Statistical Analysis
Taking into account the current scientific achievements in the field of airtightness of building objects, as described in the introduction, further analyses included such quantitative and qualitative features/parameters of the object as: net floor area, cubature of the heated part, the number of window and door openings in external envelopes, the area of porch, the number of installation holes through external envelopes, the number of electrical installation points in the external envelopes, the number of windows and roof hatches, the number of prefabricated elements the building was made of, the number of storeys, the area of holes in the external envelopes (including windows, doors, garage gates), the total length of the connection of external walls with the foundation slab, roof structure and the applied wall system. Statistical analyses were performed using the program STATISTICA 13.3.
First, scatter plots were made (
Figure 8) to demonstrate whether there was a linear relationship between n
50 and the analyzed quantitative parameter describing the object. The analysis did not comprise two parameters presented in
Table 6, i.e., the number of roof windows (including roof access windows) and the number of chimneys. This results from the preliminary review of the results, which indicates that there is completely no influence of the indicated factors on the n
50 parameter.
In order to statistically verify the impact of the selected feature on the tightness of the building, the F dependence test was selected. We assume the significance level α = 0.05.
Hypothesis 1 (H1). There is no statistically significant linear relationship between n50 and the tested parameter.
Hypothesis 2 (H2). There is a statistically significant linear relationship between n50 and the tested parameter.
Let us consider the situations presented in
Figure 8a–h, as listed in
Table 9.
The qualitative characteristics include the type of roof structure (in this study, roofs with truss structure and purlin structure were applied), the number of storeys, the presence of a garage in the building body, wall system, the presence of chimneys, the number of roof windows. In order to test the variables, the independence test χ
2 was used. The results are summarized in
Table 10.
The statistical significance of the chi-square test for all examined qualitative features (p-value) is higher than the assumed significance level of α = 0.05. Therefore, there are no grounds to reject the H1 hypothesis.
In principle, it can be said that each examined factor does not affect the n
50 parameter individually. Yet we can state that air movement affects pressure measurement in the tested object. Similar findings were offered by Zheng et al. [
32] during their work at the test facility. In the same work, Zheng et al. [
32] stated that the ensuing studies should investigate the impact of uncertain conditions of external environmental factors on the measurements of building tightness. Also, the research conducted in this paper demonstrates that there are other factors influencing the measurement result, and therefore the research proposed by Zheng et al. [
32] seems to be justified. Other studies [
12] show that the value n
50 for buildings before thermomodernization is 30–42% higher than that after thermomodernization, which may be related to the tightness of frames after thermomodernization. Thus, it seems that the number of windows alone does not significantly affect the n
50 parameter, and the impact may be affected by the tightness of frames. This may be explained by the dispersion of results presented in
Figure 8c. In another publication [
24], the impact of the total length of the openable part of windows and doors on the n
50 parameter was estimated for single-family houses. A fairly high correlation at the level of 0.81 was obtained. But in this publication the impact of the width of the window sash was not investigated, but the number of windows was considered, so the results are not comparable. In addition, in this article, in-situ measurements were performed, which made it impossible to fully control the examined factors. Moreover, in Ji and Duanmuu [
24], the authors pointed out that the leaks related to various types of installation holes have a significant impact on the final result, but they did not investigate the scope of this impact in terms of numerical values. In the interesting studies, Ji et al. [
33] observed that the average share of windows and doors in air leak is small. It confirms the results of this article declaring that the number of windows is not the main factor determining the value of n
50 parameter. Further, Ji et al. [
33] concluded that more research was needed to draw reliable conclusions. The above conclusion also confirms the observations presented by the authors of this article.
Conclusions drawn by other researchers have been confirmed that in order to ensure airtightness of a building, it is necessary to coordinate the entire process, starting with the construction design, through the detailed implementation design, prefabrication stage, assembly, supervision of the assembly process and finishing with qualified executive staff. It would be interesting to continue the work by analyzing buildings erected in various technologies. The present article points to the conclusion that for timber frame buildings there is no significant statistical impact of the examined factors related to the building envelope on the n
50 parameter. This knowledge allows us to proceed to the next study, which is the geometric shape of the building. Interesting research on this subject with the use of the shape factor was carried out by Ji and Duanmuu [
24].
4. Conclusions
In conclusion, we can state that none of the examined quantitative and qualitative features has a statistically significant impact on building airtightness. Although the full statistical analysis was performed for a linear relationship, when we examine the scatter plots, we can accept that there is no statistical relationship.
Accordingly, the following conclusions can be drawn:
As to the quantitative features, the greatest dependence was observed between the average value of the n50 parameter and the features related to the routing method of installation, i.e., the number of holes in sanitary installations and the number of electrical installation points to external envelopes.
The impact of the above features on the parameter describing airtightness is, respectively, 6.6% and 4.7%. The remaining quantitative features have a negligible impact on n50.
A similar situation occurs in the correlations of qualitative features. In the case of qualitative features, significant relationships between the examined features and the mean value of the parameter n50 were rejected.
The group of the examined buildings included buildings with the roof having truss structure and prefabricated purlin structure. No impact of roof type on the tightness of the tested objects was observed. Thus, it was confirmed that there is no specific feature whereof number or presence in a prefabricated wooden building would significantly determine airtightness.
The next stage of the research may involve the influence of external factors such as wind, atmospheric pressure or temperature on the obtained results. In view of practical considerations obtained from the presented research results, we can recommend giving preferentiality to building designs with the smallest number of installation holes in the external envelopes.


