Article

Power Flow Management by Active Nodes: A Case Study in Real Operating Conditions

by
Stefano Bifaretti
1,*,
Vincenzo Bonaiuto
1,
Sabino Pipolo
2,
Cristina Terlizzi
1,
Pericle Zanchetta
2,3,
Francesco Gallinelli
4 and
Silvio Alessandroni
4
1
Department of Industrial Engineering, Tor Vergata University of Rome, 00133 Rome, Italy
2
Department of Electrical and Electronic Engineering, University of Nottingham, Nottingham NG7 2RD, UK
3
Department of Electrical, Computer and Biomedical Engineering, University of Pavia, 27100 Pavia, Italy
4
Areti S.p.A., Distributor System Operator, 00154 Rome, Italy
*
Author to whom correspondence should be addressed.
Energies 2021, 14(15), 4519; https://doi.org/10.3390/en14154519
Submission received: 8 June 2021 / Revised: 19 July 2021 / Accepted: 20 July 2021 / Published: 27 July 2021

Abstract

:
The role of distributor system operators is experiencing a gradual but relevant change to include enhanced ancillary and energy dispatch services needed to manage the increased power provided by intermittent distributed generations in medium voltage networks. In this context, the paper proposes the insertion, in strategic points of the network, of specific power electronic systems, denoted as active nodes, which permit the remote controllability of the active and reactive power flow. Such capabilities, as a further benefit, enable the distributor system operators to provide ancillary network services without requiring any procurement with distributed generation systems owners. In particular, the paper highlights the benefits of active nodes, demonstrating their capabilities in reducing the inverse power flow issues from medium to high voltage lines focusing on a network cluster including renewable energy resources. As a further novelty, this study has accounted for a real cluster operated by the Italian distributor system operator Areti. A specific simulation model of the electrical lines has been implemented in DigSilent PowerFactory (DIgSILENT GmbH–Germany) software using real operating data obtained during a 1-year measurement campaign. A detailed cost-benefit analysis has been provided, accounting for different load flow scenarios. The results have demonstrated that the inclusion of active nodes can significantly reduce the drawbacks related to the reverse power flow.

1. Introduction

The increasing proliferation of distributed generation systems (DGSs), mostly based on renewable energy resources connected through power electronic interfaces to medium voltage (MV) distribution networks, is going to create control, operation, protection and planning issues if they are not effectively addressed [1]. In such a scenario, the role of distributor system operators (DSOs) has been gradually grown to include enhanced ancillary and energy dispatch services by interacting with both DGSs and transmission system operators (TSOs) [2,3]. The recent Directive (EU) 2019/944 of the European Parliament, in Article 32 Incentives for the use of flexibility in distribution networks, promotes the use of ancillary services provided by DGSs for networks management, unless the procurement of such services is not economically efficient [4]. The ancillary services procurement certainly requires additional effort for DSOs that have to negotiate with multiple DGS owners [5]. Furthermore, as the interaction between DSO and TSO is currently still limited, the development of a more consolidated regulatory model is needed to enable interoperability [6,7]. Figure 1 illustrates an example of interactions between DSO and DGSs, even highlighting the connections of distributed energy storage systems (DESS) for which widespread diffusion is expected in the near future.
In order to provide wider flexibility to distribution networks, it is necessary to move gradually toward an intelligent grid type (Smart Grid) with enhanced services capabilities that will enable the Internet of Energy (IoE) [8,9,10]. New challenges include not only the balancing of volatile and distributed energy production and consumption but also the development of smart and integrated networks, which work as components of a holistic energy system. Such an evolution needs active networks able to provide interactive functionalities, integrate multiple energy sources and services, increase the local energy production and reduce energy transmission losses. This requires remote controlled actuators that will enable the management of available energy production and distribution on the local level. In this scenario, due to the recent availability of High-Voltage SiC devices [11] as well as the development of modern power converters and control structures, the replacement of MV/LV passive transformers with solid-state transformers (SSTs) is becoming more feasible [12,13,14]. Such systems can provide remote power flow control and ancillary services at a secondary substations level. However, the power electronic converters of an SST have to be sized for the entire power level of a substation, resulting in a more complex design and costly construction, in addition to a more demanding maintenance. As an example, it is sufficient to consider that the current ratings required at the low voltage (LV) side can be produced only with parallel connections of multiple power converters. A different solution to implement the IoE relies on active networks based on the usage of several power active nodes: specific and reliable power electronic interfaces, installed by the DSO in strategic sites, which enable the direct routing of electricity through the link of different MV lines. Figure 2 schematically shows, through an example, the concept of active nodes employed for the management of the IoE; in addition, the figure illustrates the possibility to interface DESS to the grid through an active node providing an AC or a DC link. The inclusion of DC sub-networks is becoming attractive in recent years due to the possibility to integrate, at a different power level, RES and energy storage, enabling a meshed hybrid AC/DC distribution grid [15]. The DC sub-networks can be operated in LV [16], MV [17,18] or both [19,20] and can be connected to the AC network via multi-port power electronics converters [21,22]. A hybrid configuration can further improve the flexibility of the entire system in terms of active and reactive power flow controllability [20]. However, at present, regulations and standards for MVDC grids have been developed only with reference to ship [23] or railway (IEC 60850) power systems. An overview of the main issues, in particular related to safety operation and protection of DC grids, which have to be still addressed, can be found in [24]. Until standards are defined, the release of new commercial products enabling MVDC will be quite difficult. On the other hand, it is worth noticing that the use of active nodes, based on AC interfaces, does not require the definition of new standards and permits a straightforward interconnection between existing electrical infrastructures.
In comparison to SST-based solutions, active nodes can be sized with a power level significantly lower than required for electronic transformers in secondary substations. Furthermore, in contrast to SSTs, the energy routing permits mitigating the negative effects, e.g., increased losses and reduced energy available for selling, produced by the current injection in high voltage (HV) networks due to reverse power flow [25].
Different topologies of power converters, such as modular multilevel converters [26] and matrix-based converters [27,28,29], have been developed over the last few years to permit the direct connection to two MV lines. On the other hand, active nodes based on multiport converters [30,31] integrate different power interfaces in both AC and DC, allowing, as shown in Figure 2, easier integration of DESS and introducing additional flexibility for DSOs.
In the context of the European project “UNIversal and FLEXible Power Management” (UNIFLEX-PM), a promising structure to manage the energy exchanges between three different electricity networks with a high-power quality has been developed [32,33]. The main objective of the UNIFLEX-PM system is to provide a flexible and modular power electronic interface able to connect different kinds of sources and loads, including MV electrical networks and energy storage systems. The main benefit of such a structure consists of the capability to enable network services traditionally provided with the usage of different FACTS devices [34,35].
Most of the studies have been focused on the converter control techniques. In particular, basic control structures in stationary [36] and rotating [37] reference frames have been initially proposed, but due to their limited tracking current capabilities, model-based strategies have been preferred. Amongst them, dead-beat controllers [38] provide a current control with a wide dynamic but, due to the cascaded control loops, they present worse performance on DC voltage tracking. Recent studies have demonstrated the superior dynamic performance, amongst the other strategies, of the modulated model predictive controller [39,40].
However, a fundamental aspect for DSOs is related to the real-time regulation of the active and reactive power flow. In [41], the control of power flow profiles has been studied in different network conditions, but the UNIFLEX converter has been allowed to operate with only two ports. In [42], the active and reactive power control capabilities of the three-port UNIFLEX configuration have been investigated, highlighting the conditions that permit to operate at a unitary power factor.
The aim of the paper is to demonstrate the benefits for DSOs obtained by the usage of active nodes on MV networks. For the first time in literature, a detailed case study, which considers a significant network cluster operated by the local DSO Areti under real operating conditions, is illustrated. An in-depth cost-benefit evaluation has been reported to prove the effectiveness of the proposed solution in terms of power flow real-time controllability. Additional benefits for DSOs include the possibility to provide ancillary network services without requiring any procurement with DGSs owners. The paper is structured as follows: Section 2 describes the UNIFLEX converter structure configured as an active node while, in Section 3 and Section 4, the Areti network cluster with the related model and the UNIFLEX model have been respectively illustrated; Section 5 reports significant simulation results based on real operating conditions; finally, in Section 6, conclusions are drawn.

2. UNIFLEX Converter

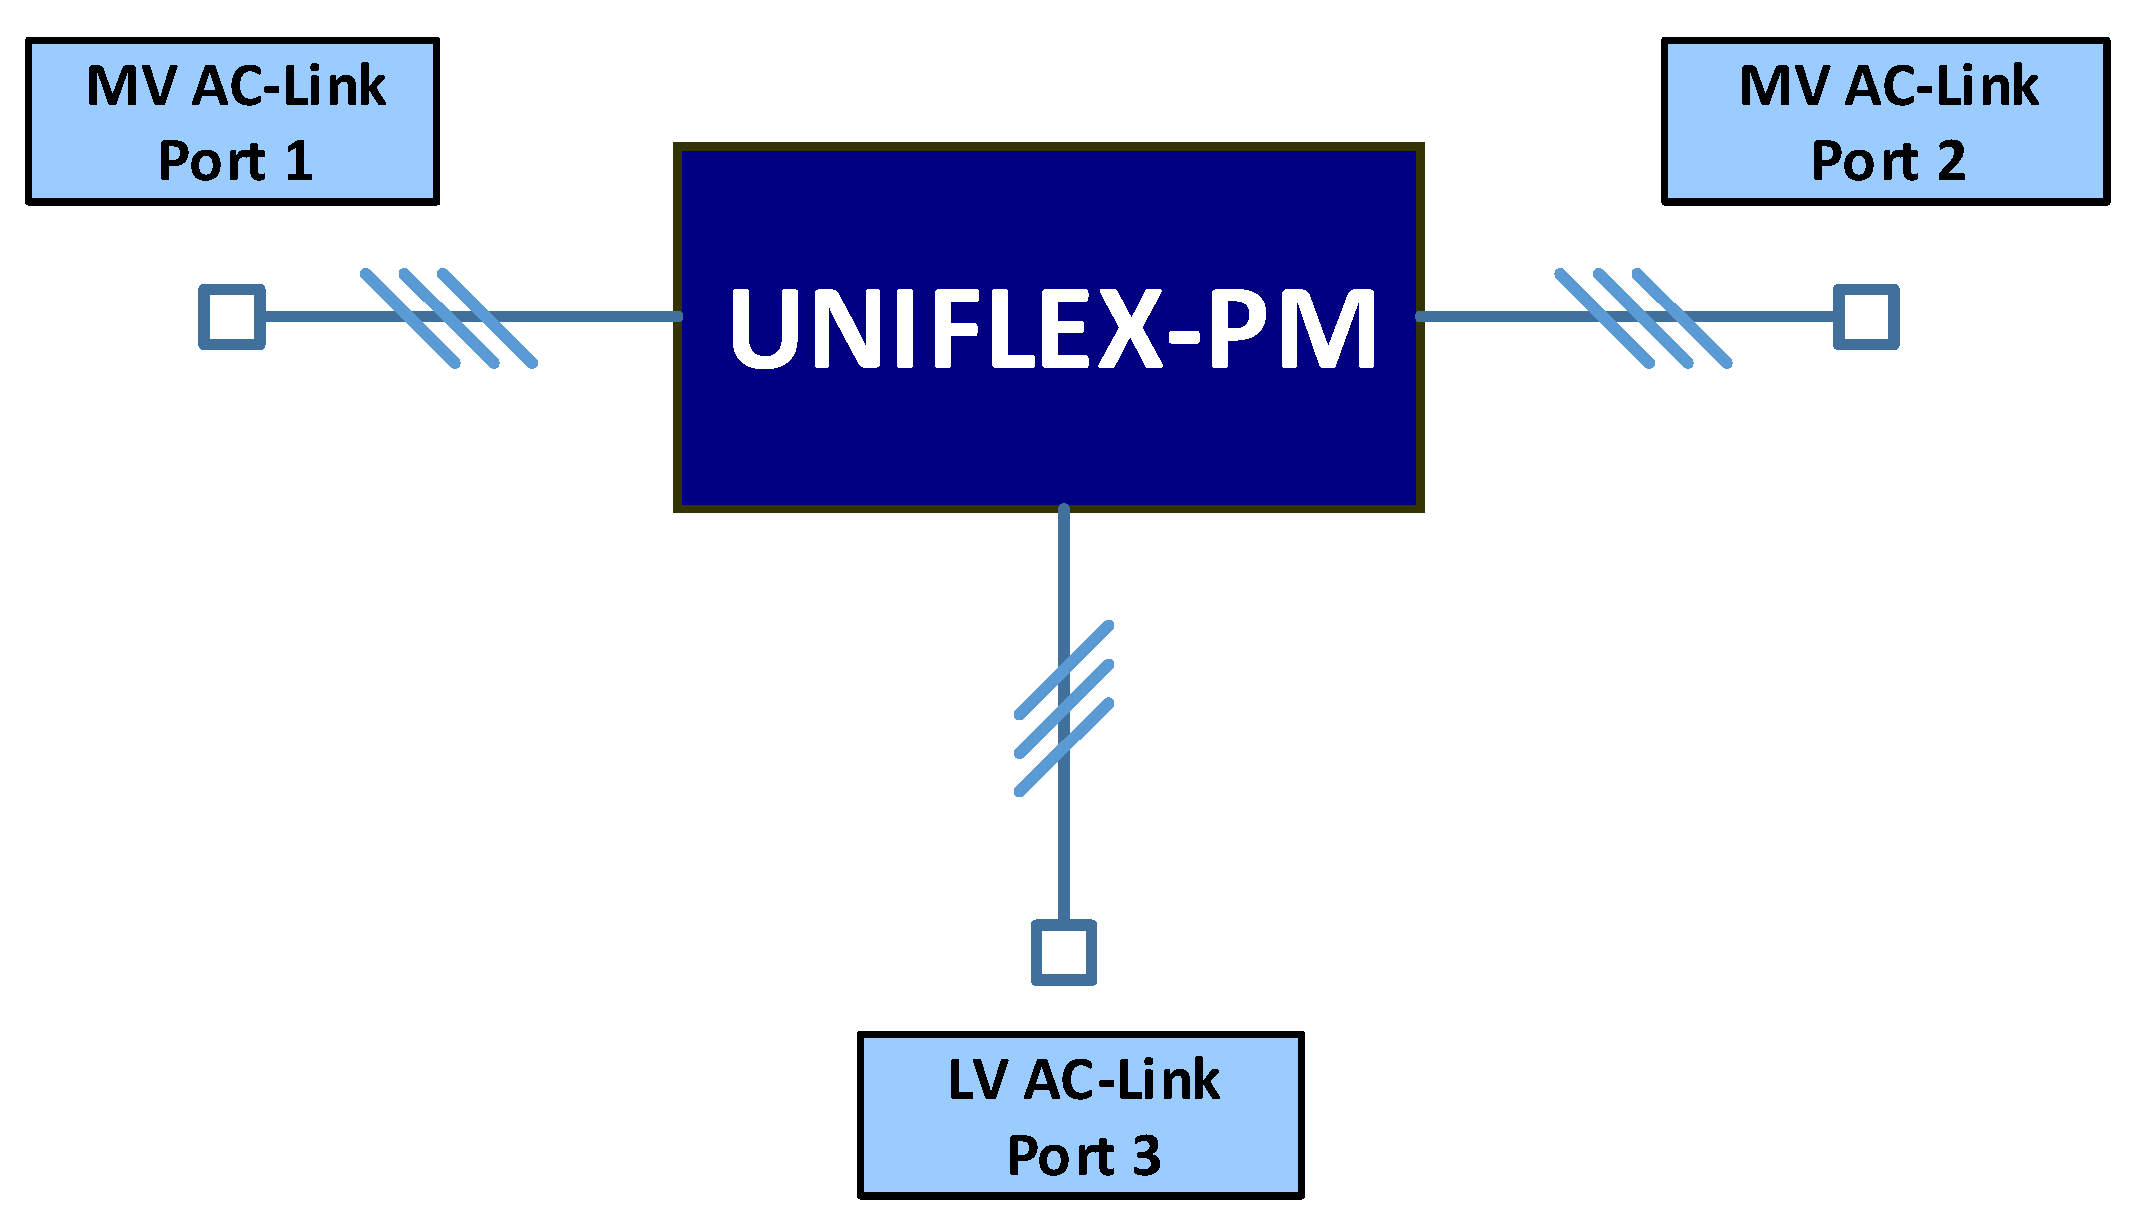
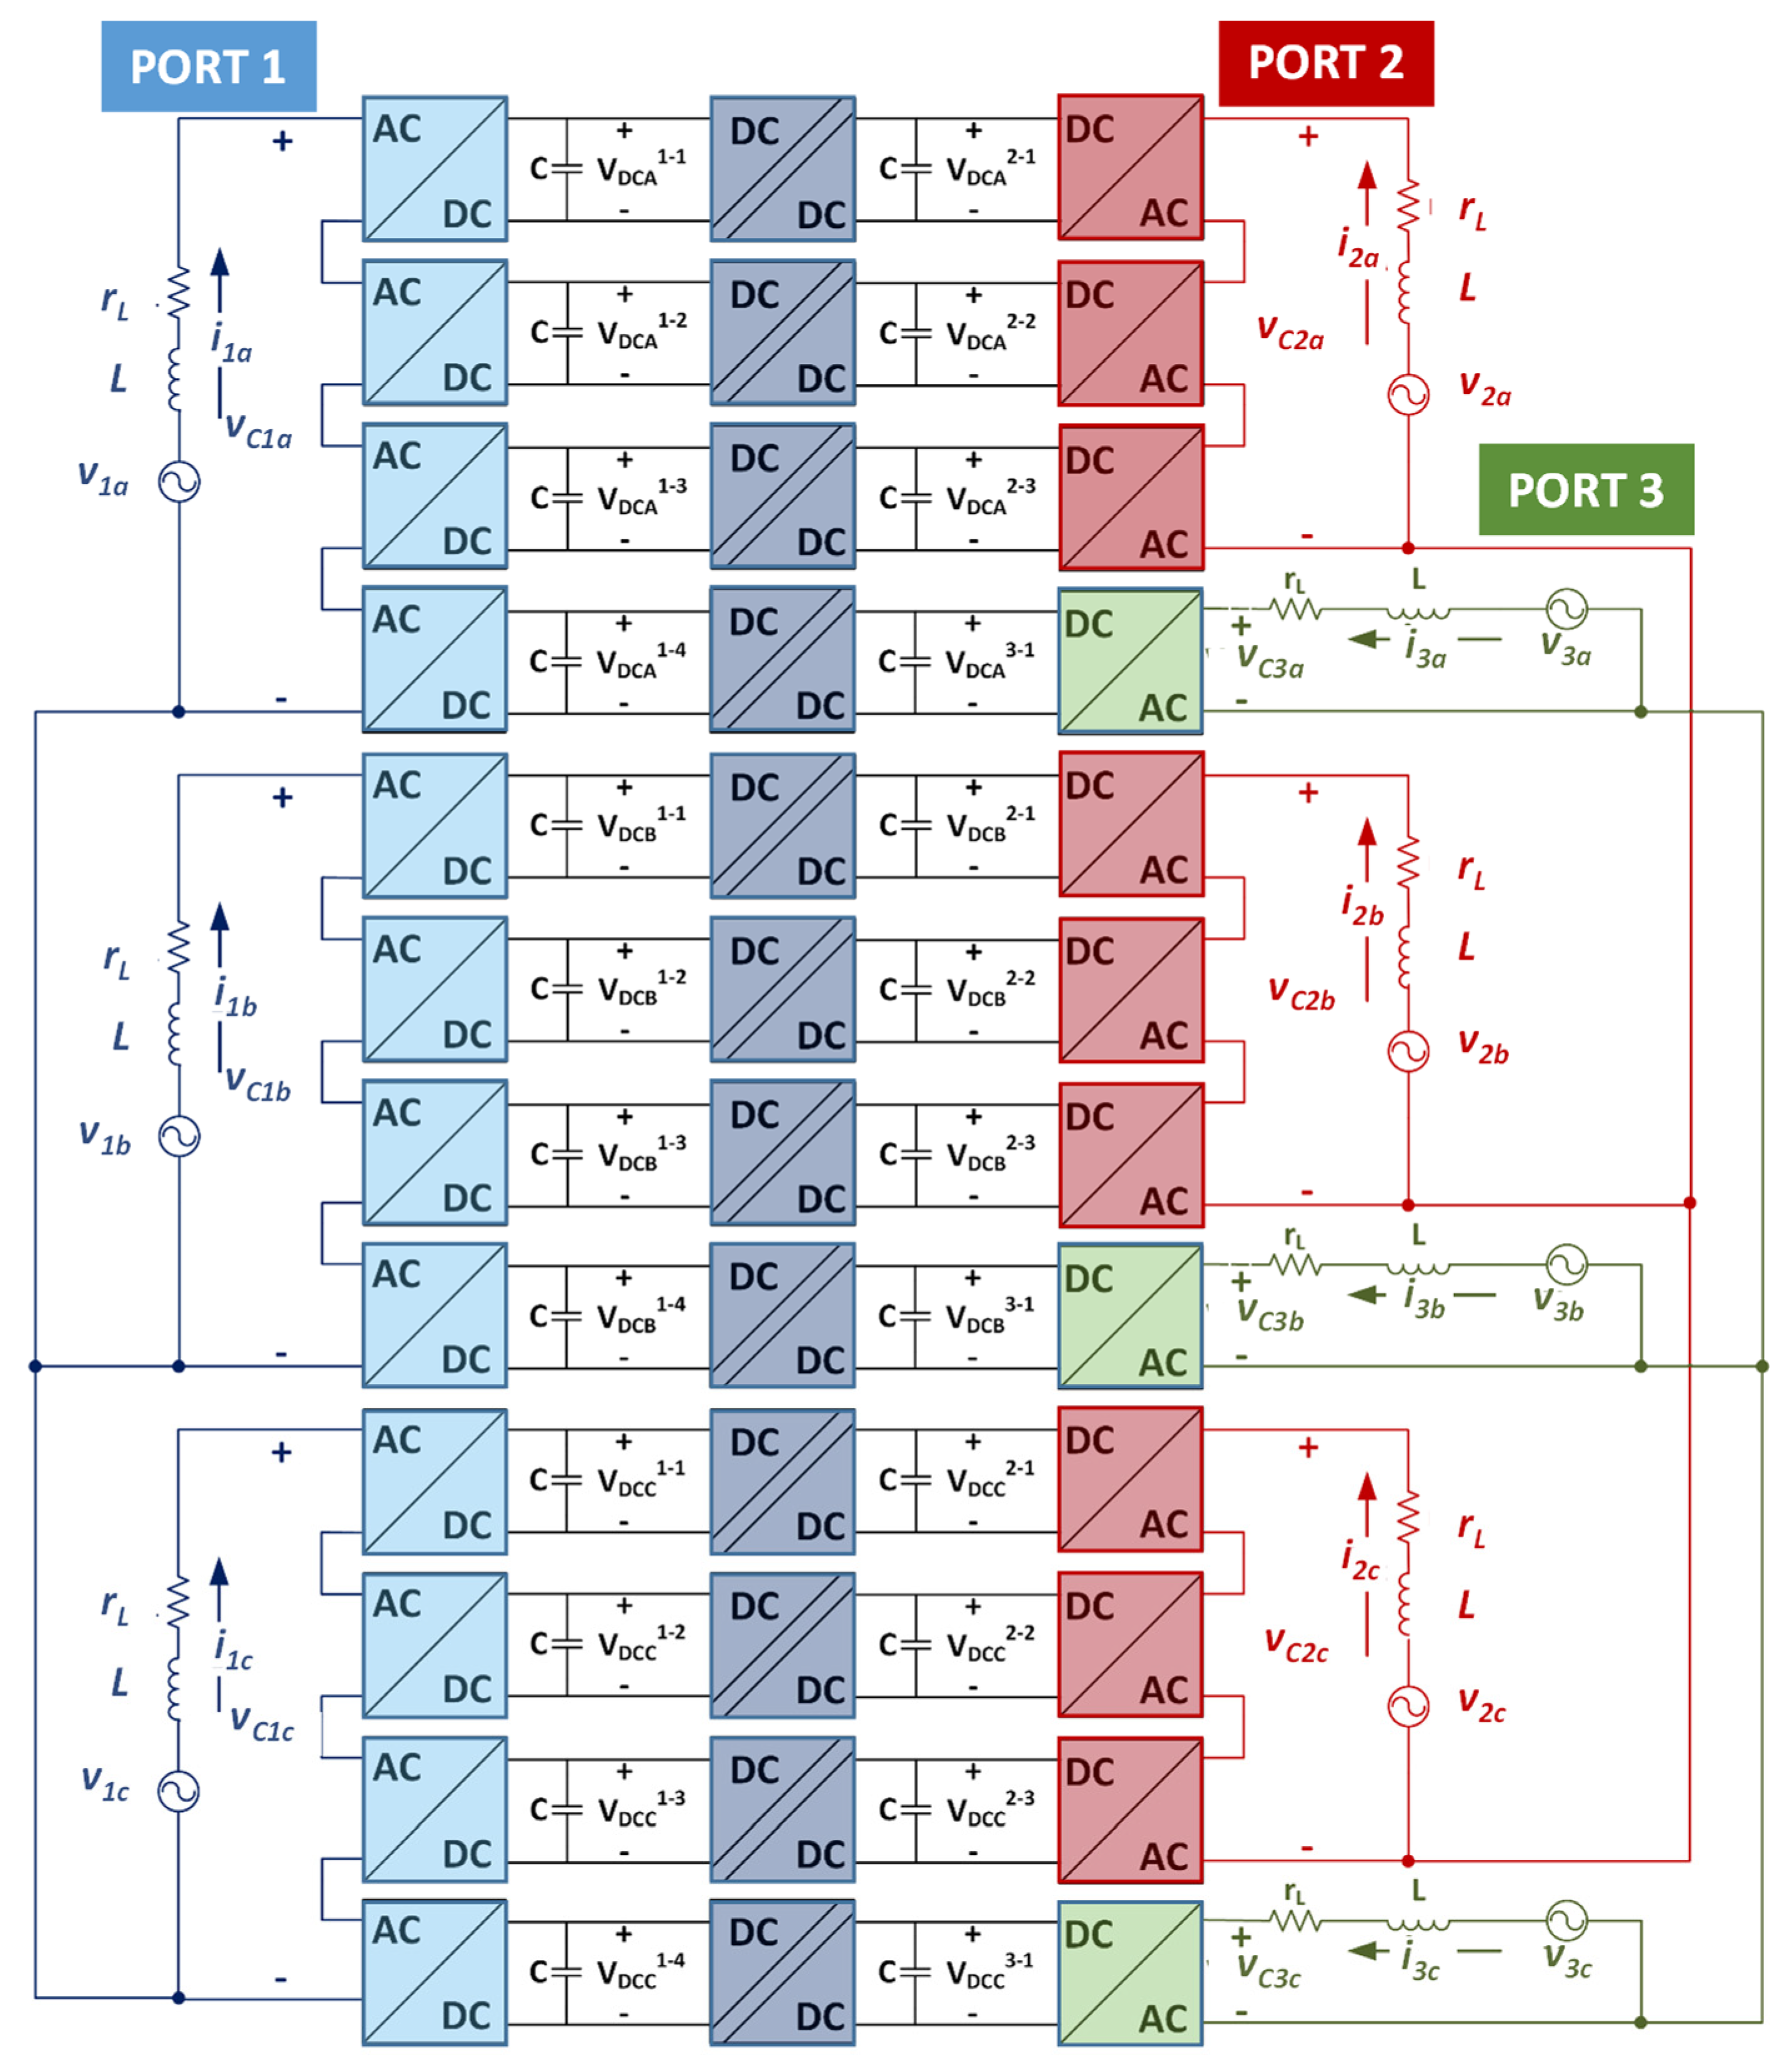
The UNIFLEX converter structure is able to connect to a variety of loads and/or sources, including renewable energy sources or energy storage systems, and interconnect multiple utilities in AC. The UNIFLEX three-port configuration concept is illustrated in Figure 3, while a more detailed structure is shown in Figure 4. For example, one of the possibilities is to connect Port 1 and Port 2 at a medium voltage and Port 3 at low voltage.
The nominal parameters of the UNIFLEX-PM converter are shown in Table 1. As mentioned above, the UNIFLEX-PM converter is expected to control the power flow between the three ports at any power factor. A detailed analysis has shown some boundaries on the power flow capability [41]. However, such constraints can be overcome by employing specific strategies to control the reactive power flow [30,42].

3. Network Clusters Description

The electrical network operated by Areti has been subdivided into 329 subnetworks, indicated hereafter as clusters; about 58% of the clusters include at least one DGS. The first part of this work has been devoted to the selection of the most critical clusters to be considered in the study. The excess power generation on a cluster has been evaluated by the ratio S.
S = PDGS/PU
between the power PDGS generated by DGSs and the power demand PU of the cluster users. As a result, clusters belonging to seven different primary substations (PS) have shown values of S larger than 38%; however, only for the PS denoted as RFF, the excess of power generation produces a significant inverse power flow on the HV line. This phenomenon is mainly due to the high penetration of DGS in RFF, as shown in Table 2, where a list of the main generators connected to RFF is presented.
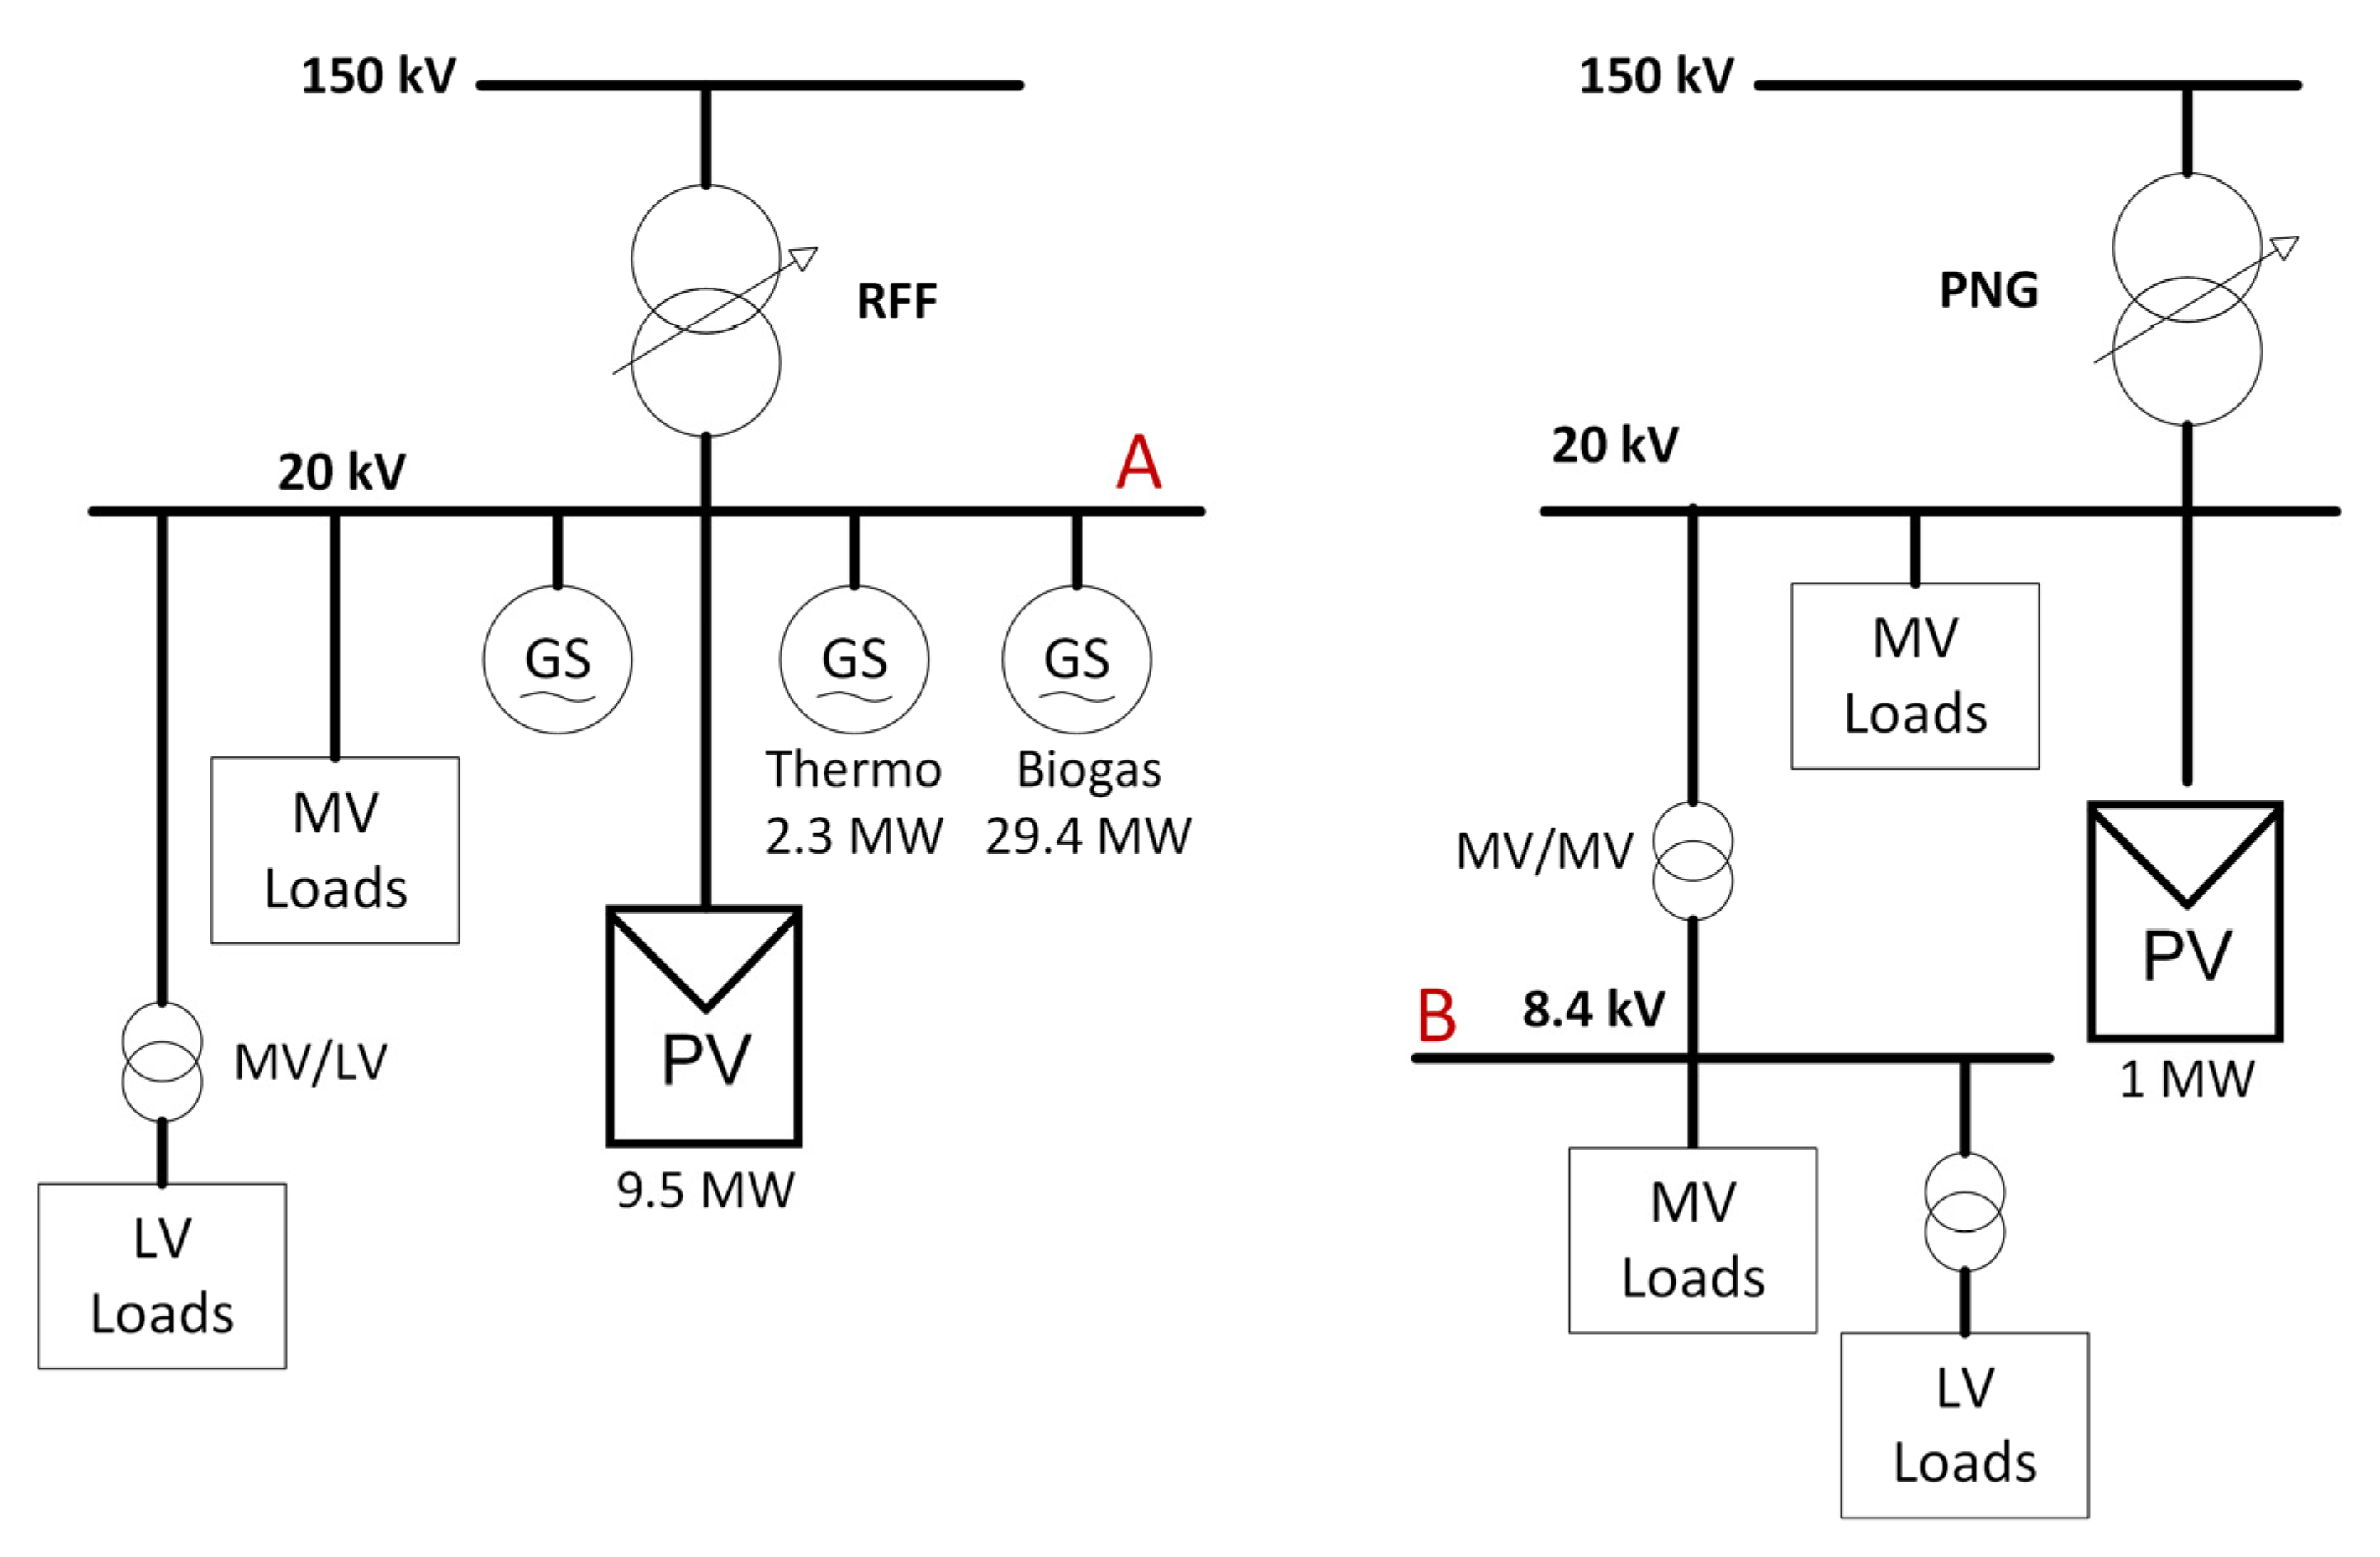
Seventy-six secondary substations (SS) are connected to RFF and to the adjacent PS denoted as PNG; 29 of them are operated at 20 kV while the remaining 47 at 8.4 kV. RFF feeds seven lines denoted as Smart, equipped with real-time automatic monitoring systems as well as remote control. To these clusters are connected different DGS with about 49 MW total rated power.
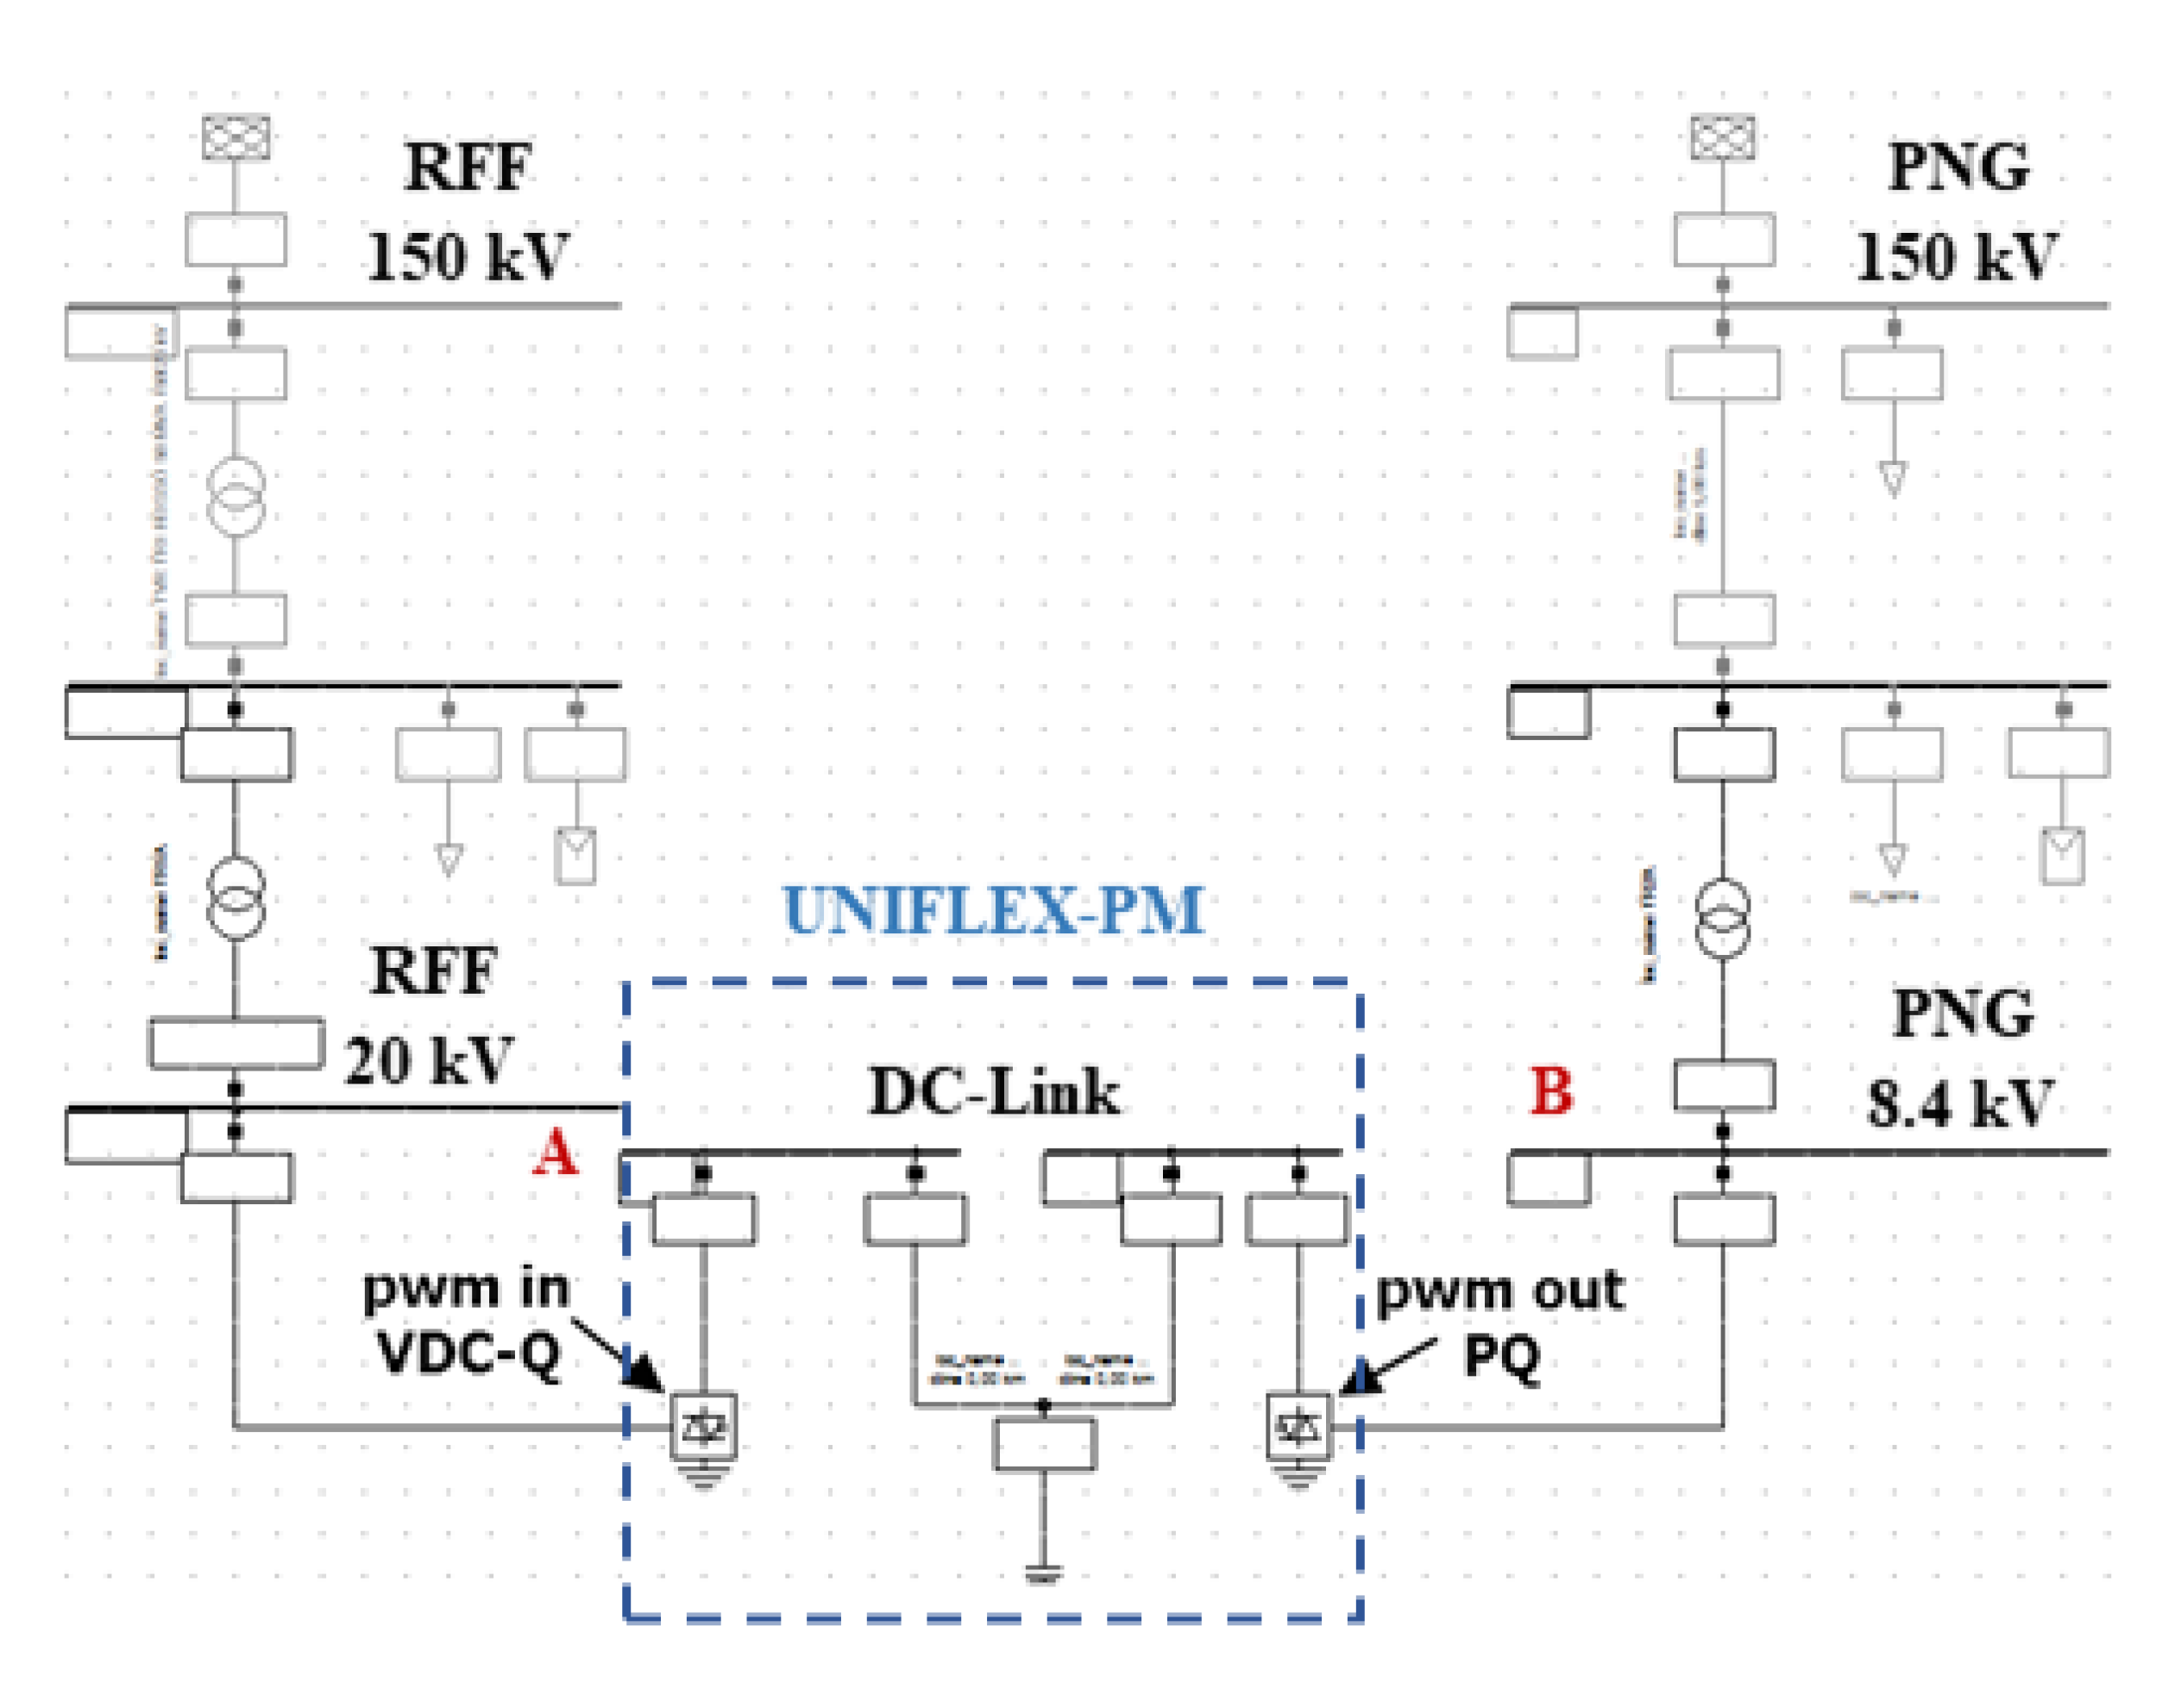
Therefore, this study will consider the possibility to mitigate the inverse power flow that affects RFF by the usage of an active node permitting the link between one SS belonging to RFF and another SS of the adjacent PS denoted as PNG, characterized by a high density of passive loads. The equivalent schematic diagram of the considered network cluster is illustrated in Figure 5, where the two busbars at 20 and 8.4 kV to be interconnected via an active node have been, respectively, indicated with A and B.

4. Simulation Model

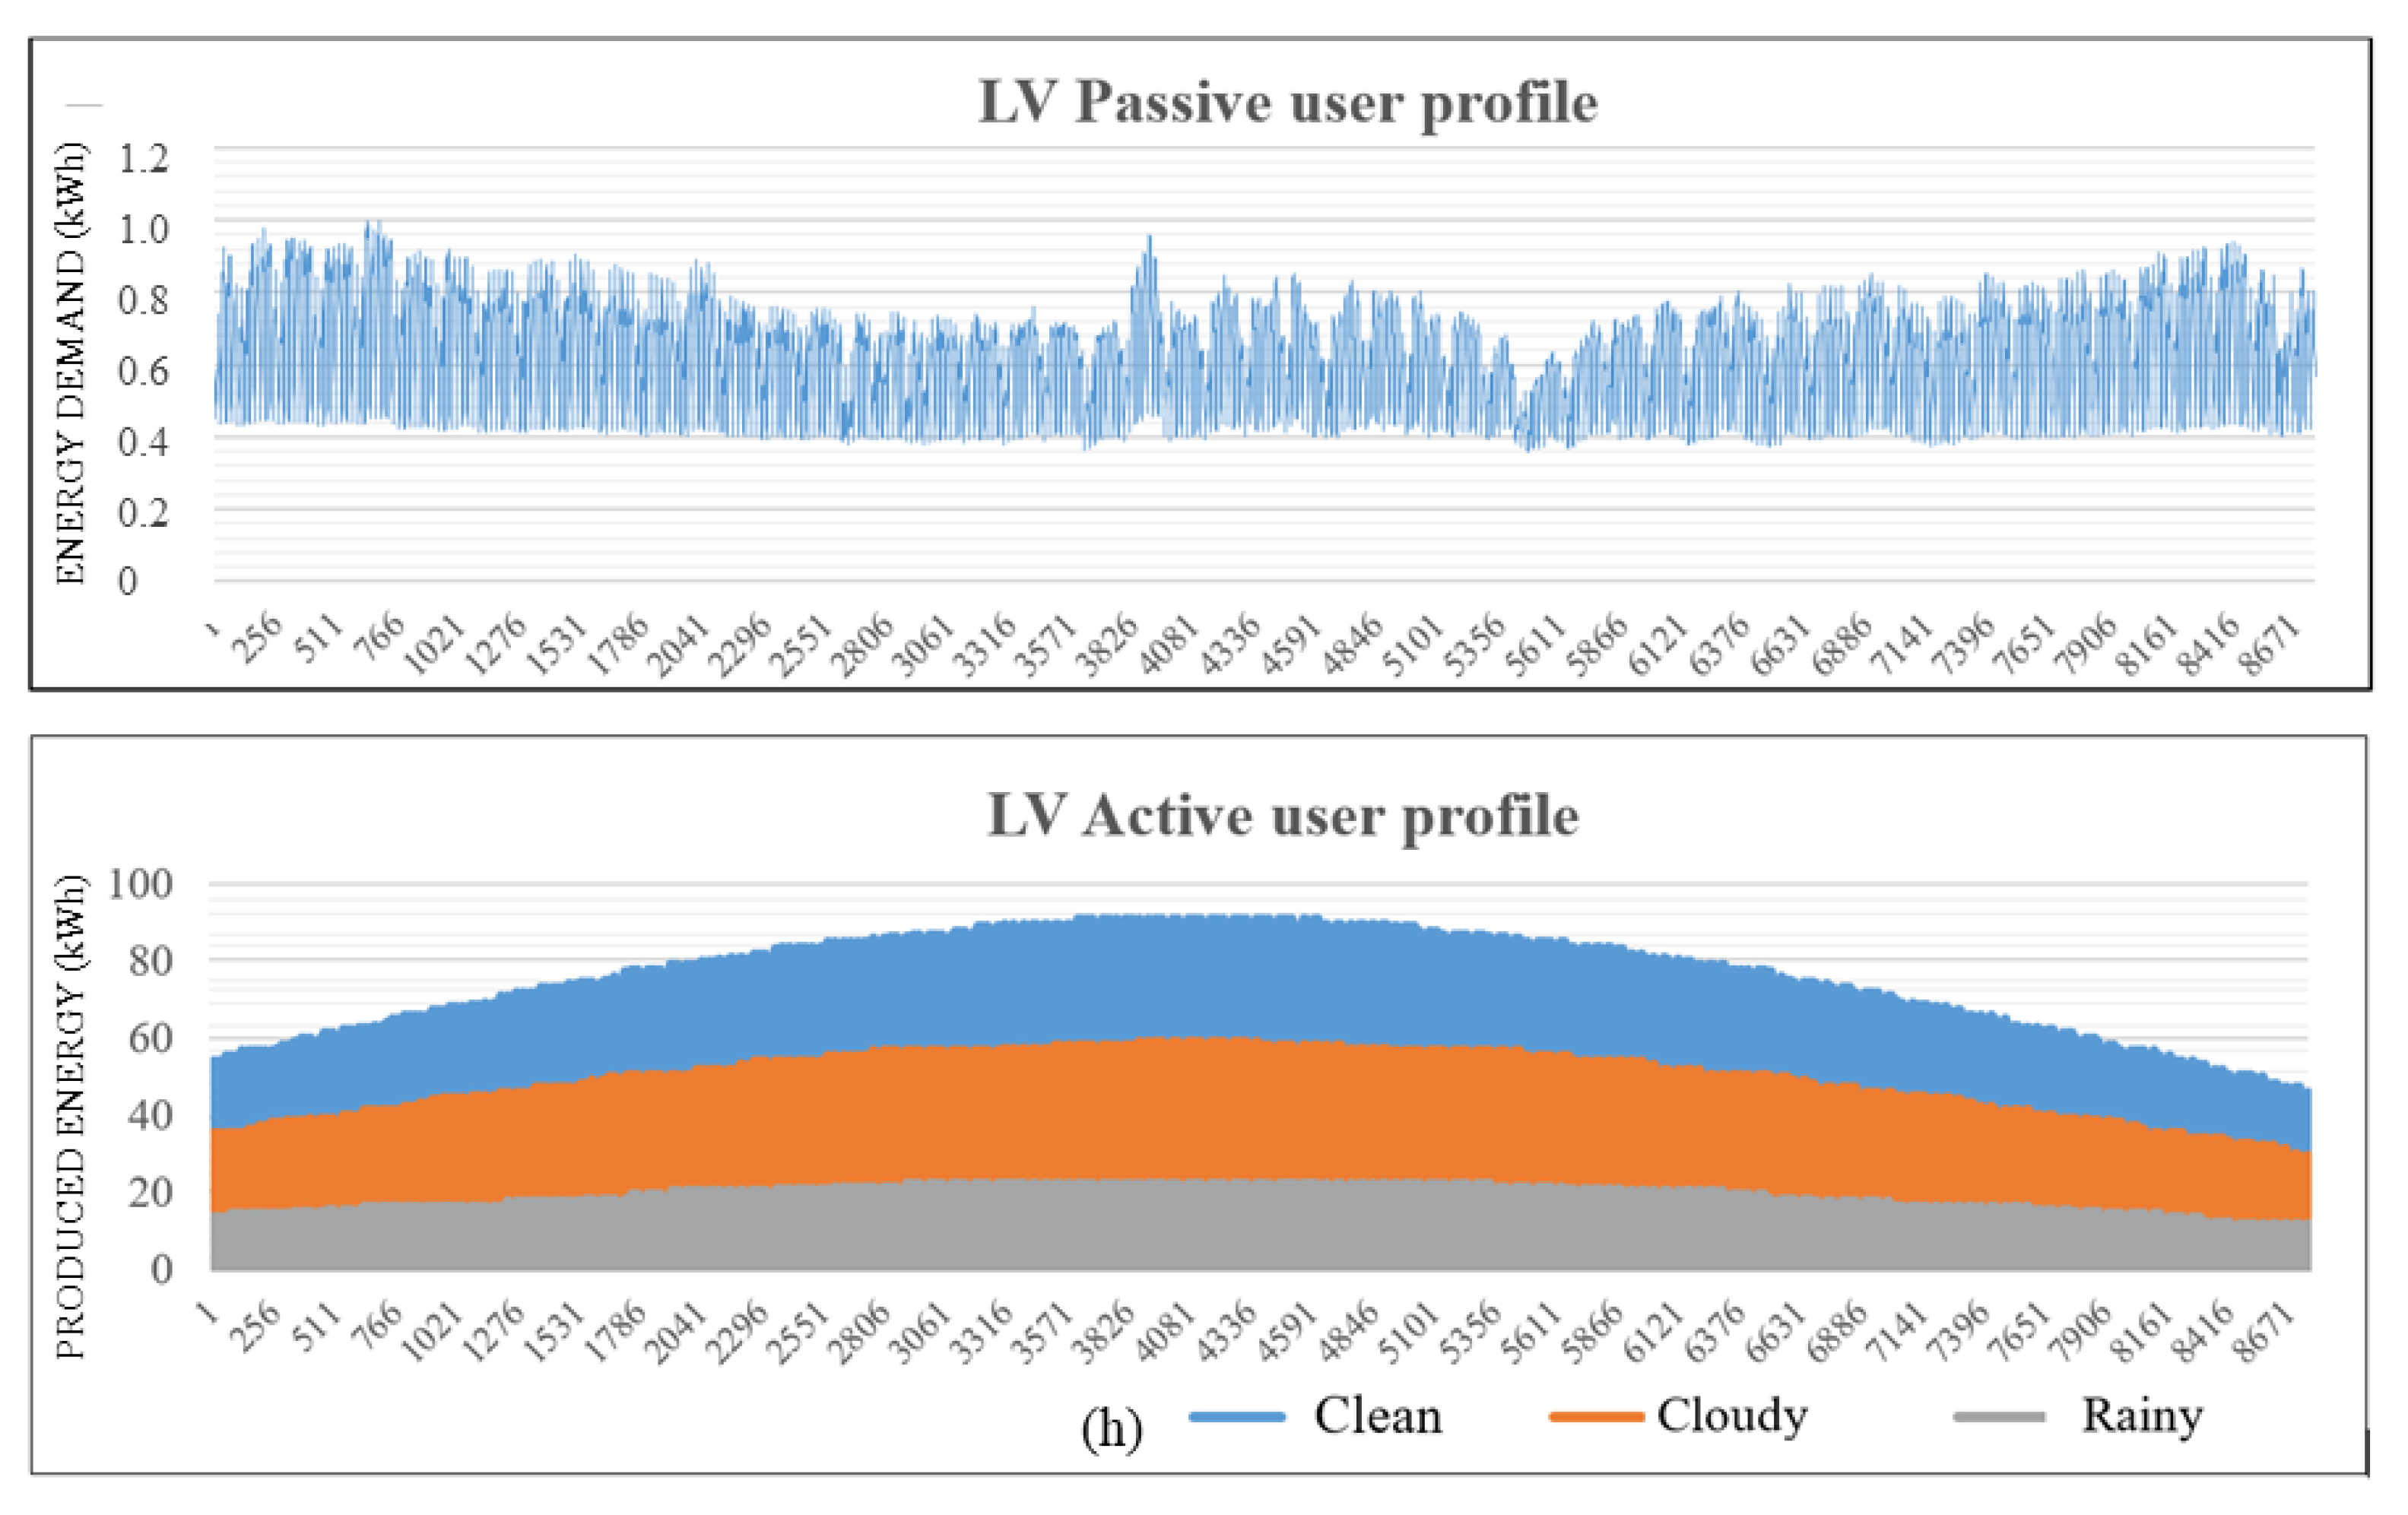
An accurate simulation model of the clusters has been implemented in DigSILENT PowerFactory, based on real data measurements provided by Italian DSO Areti. As the considered lines are equipped with real-time monitoring systems, the generators and load profiles of MV and LV users have been modeled based on real measurements performed every 15 min throughout a 1-year campaign. The data have been aggregated per hour; therefore, the simulations have been performed on 8760 operating points covering all the activity throughout the year. A total amount of 115 MV users (38 active and 77 passive) and 11,515 LV users (542 active and 10.973 passive) have been included in the study.
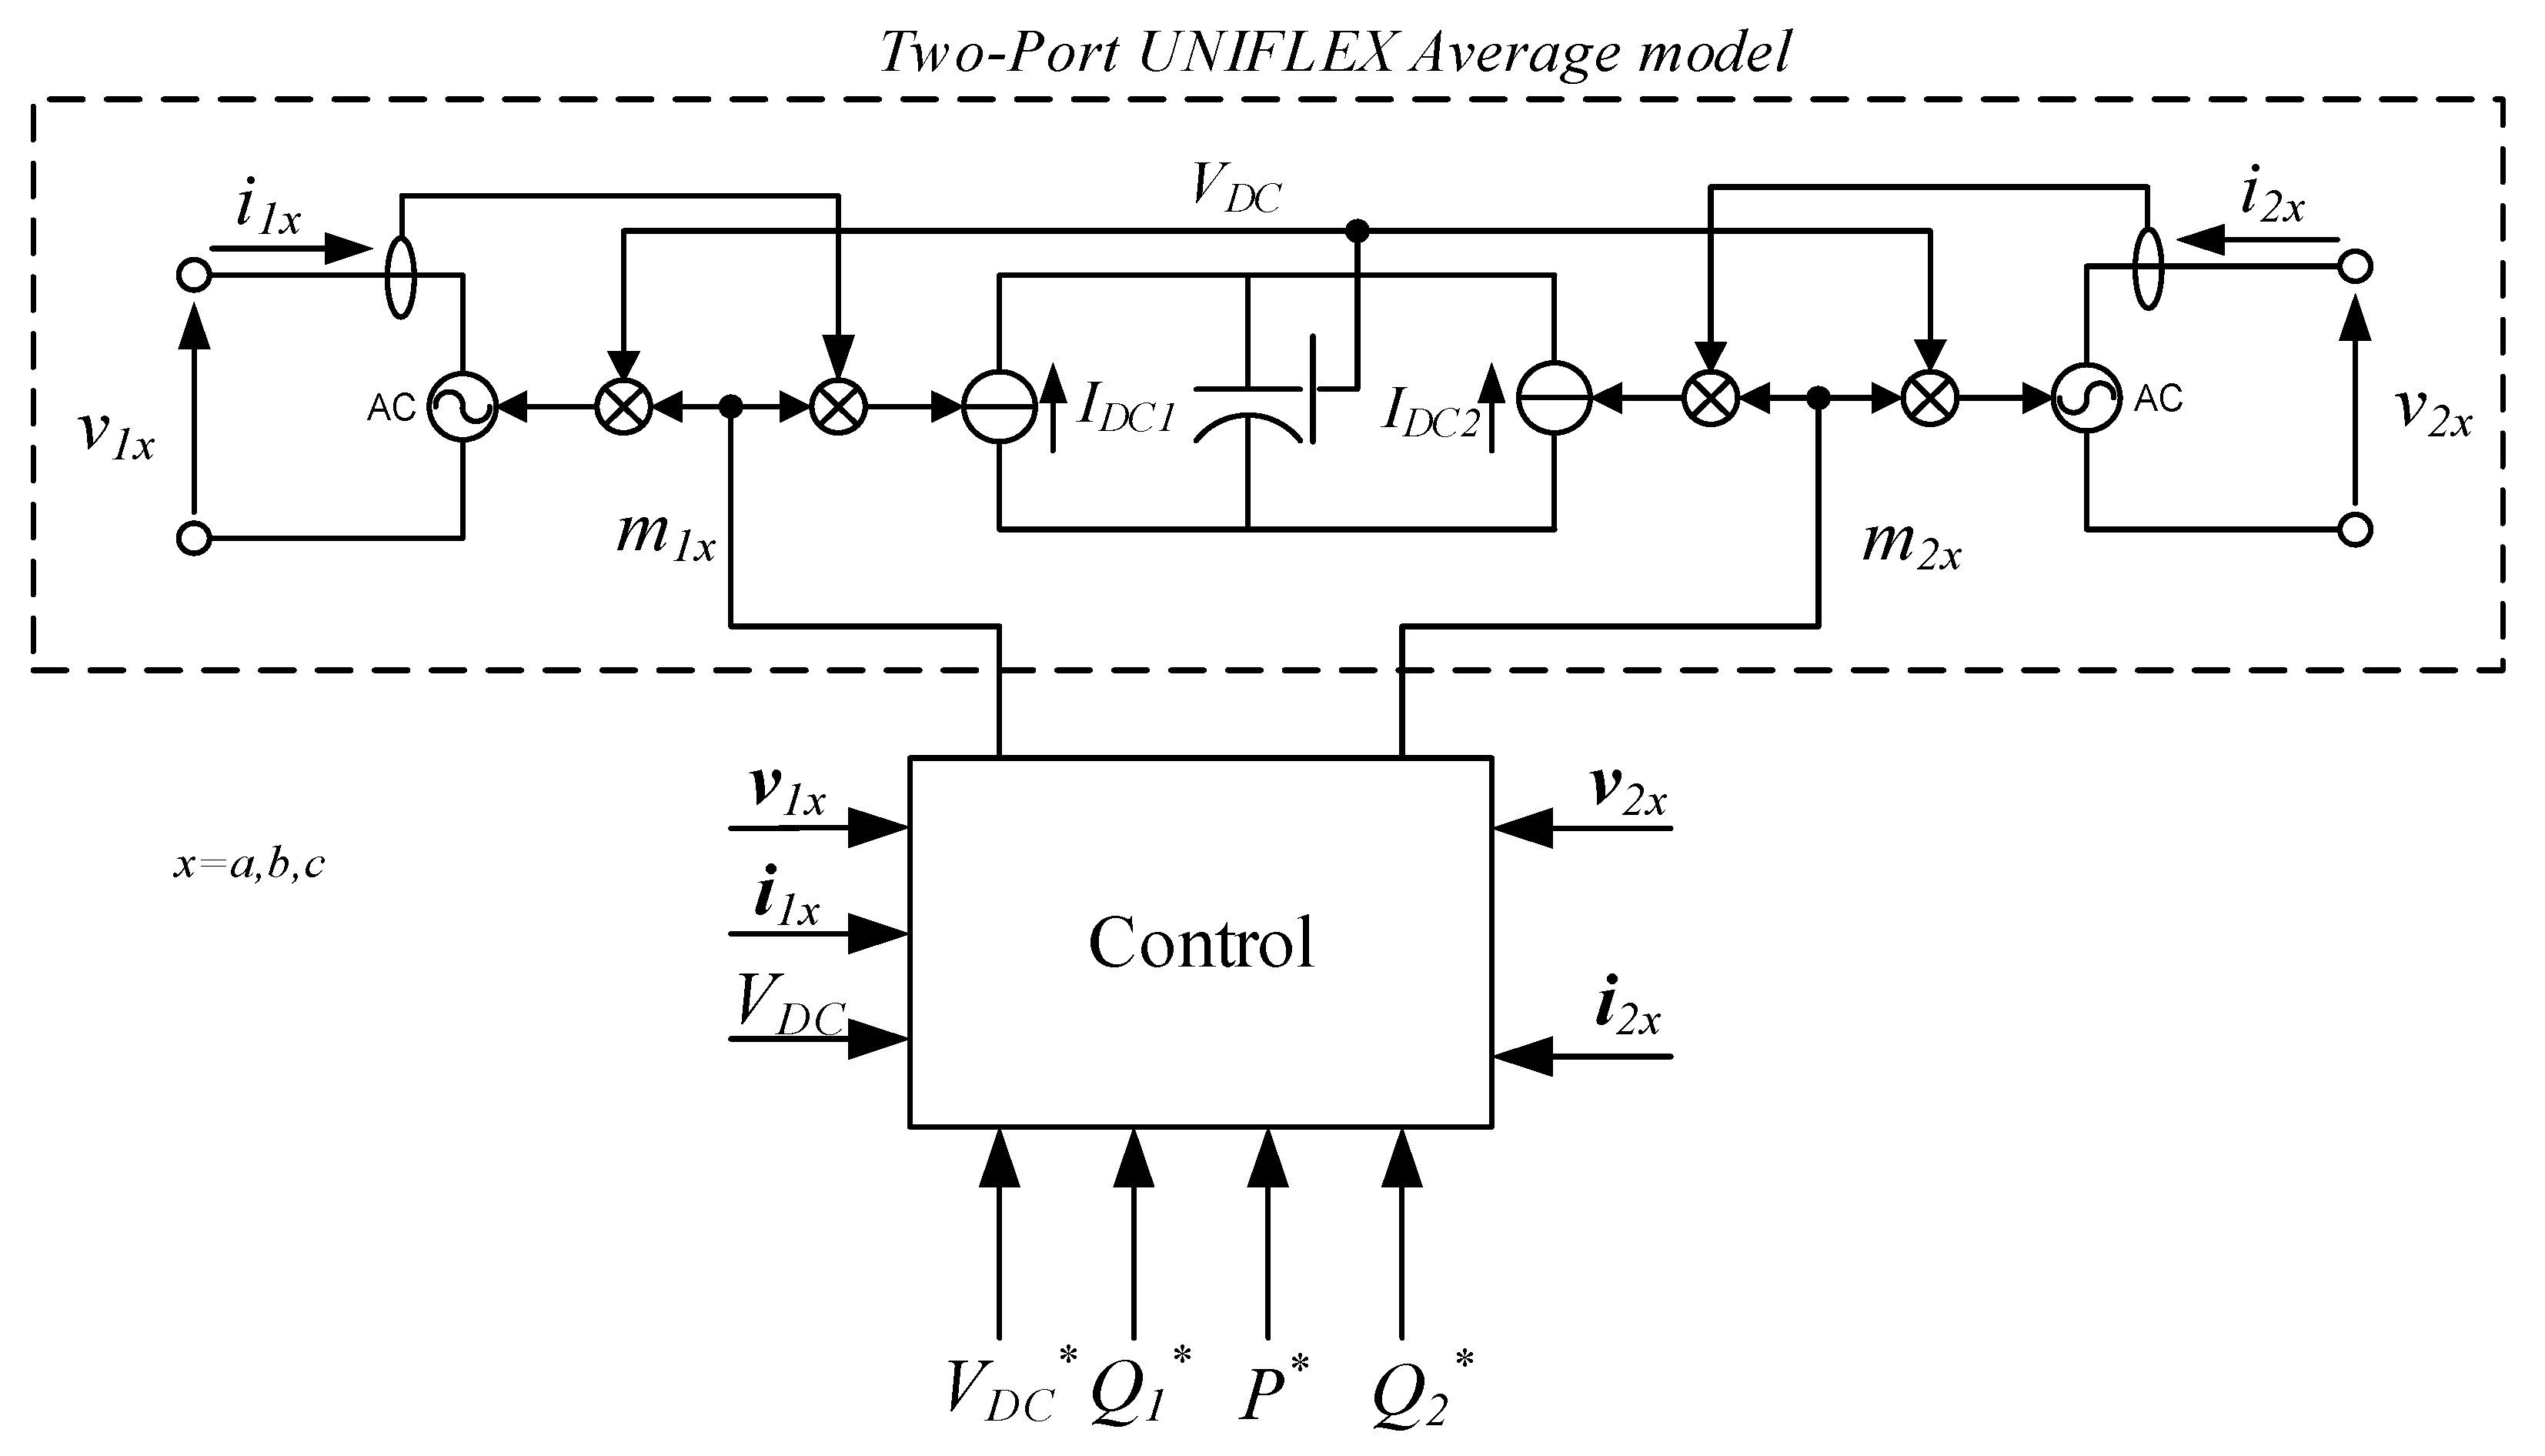
Figure 6 shows an example of the typical energy annual profile for a single passive and active user. In order to reduce the simulation complexity, the LV active and passive users have been aggregated into a single equivalent load accounted in the PowerFactory by editing the characteristics of generators and loads. The two-port UNIFLEX-PM equivalent model, shown in Figure 7, has been considered to permit an easy but effective integration in PowerFactory.
Such a structure is composed of the average models of the two power converter stages [33], based on current-controlled and voltage-controlled generators, and a control system that calculates the instantaneous values of the modulation index signals m1x and m2x, both in range (−1, +1).
The input signals VDC *, Q1 *, Q2 * and P * of the controller are, respectively, the references of the DC-link voltage, the reactive power exchanged in Port 1 and Port 2 and the active power flowing through the two ports. The reference VDC * is set as a constant based on the rated DC-link voltage VDC NOM, while P *, Q1 *, Q2 * are the reference profiles set by the DSO in order to impose the desired active and reactive power flow necessary to enable the direct routing of electricity as well as ancillary services.
The instantaneous relations between the control signals and the controlled generators are defined as:
{ v 1 x = m 1 x V D C I D C 1 = m 1 x i 1 x { v 2 x = m 2 x V D C I D C 2 = m 2 x i 2 x
where v 1 x and v 2 x the AC voltages applied by the converter, respectively, in Port 1 and Port 2, and I D C 1 , I D C 2 are the DC currents acting on the DC-link voltage VDC. The active power flow between Port 1 and Port 2 is provided through the DC-link capacitor by the VDC controller [33]. The UNIFLEX-PM model has been implemented in PowerFactory by means of two AC/DC PWM converters coupled on the DC side including a filter capacitance; such a model has been integrated in the simulation diagram of the cluster to realize the link between the 20 kV RFF(A) and the 8.4 kV PNG (B) busbars, as shown in Figure 8.
This solution allows the regulation of both the active and reactive power flow between the two MV lines even if their phases are not synchronized to each other. In the simulation model, Port 2 of the converter has been set in PQ control mode to impose the desired active power demand, while Port 1 has been set in VDC-Q control mode to regulate the DC-link voltage to the nominal value and, thus, compensate for the required active power. The active power rating has been imposed to 1 MW, while the conversion efficiency has been set to 95%. It is worth noticing that efficiency only affects the maximum power managed by the converter.

5. Discussion and Evaluation

A cost-benefit evaluation of active nodes usage in MV networks has been performed considering two different scenarios, indicated hereafter as Scenario A and Scenario B, for the implementation of the link amongst 20 kV SS belonging to RFF and 8.4 kV SS belonging to PNG. Table 3 illustrates the physical link options considered for the two adjacent substations’ connection, highlighting the distances using overhead or underground power lines. Scenario A is related to the implementation of Physical link 1, while Scenario B is related to the usage of all the three links as defined in positions 1–3. In the next subsections, the base scenario, representing the actual state of the cluster, as well as the modified scenarios including active nodes have been described in detail, including the most significant results.

5.1. Base Scenario

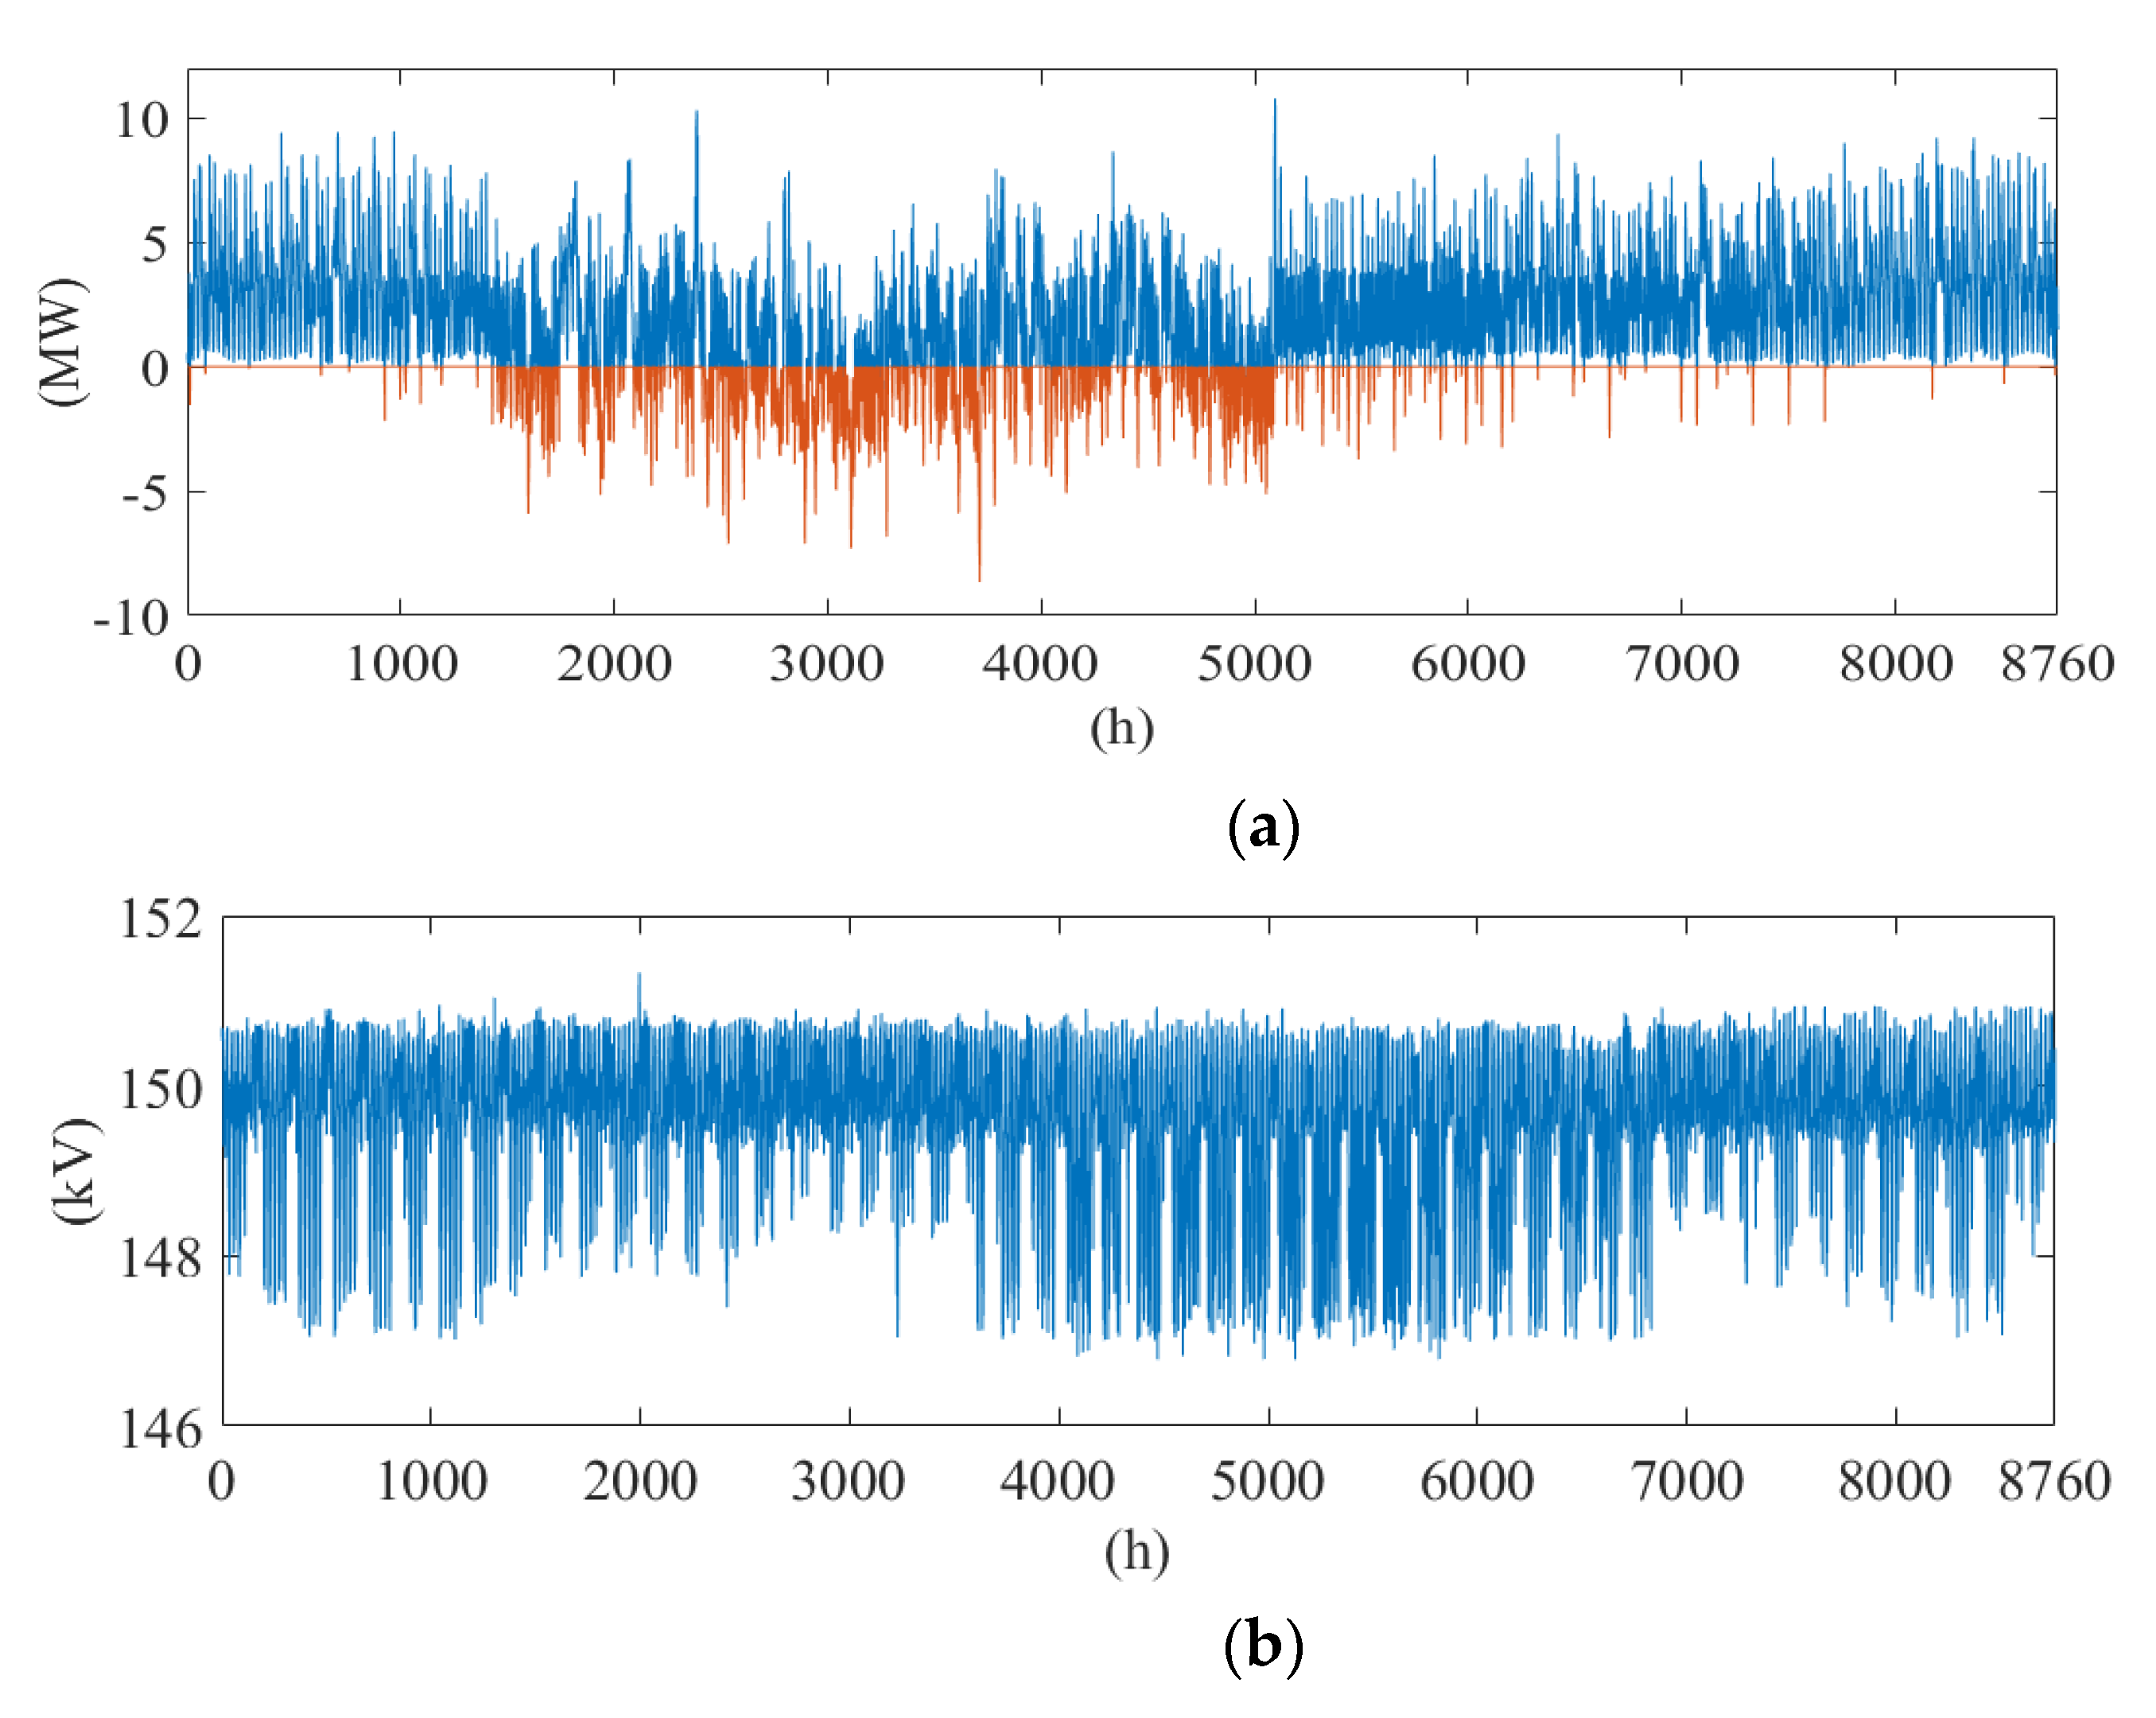
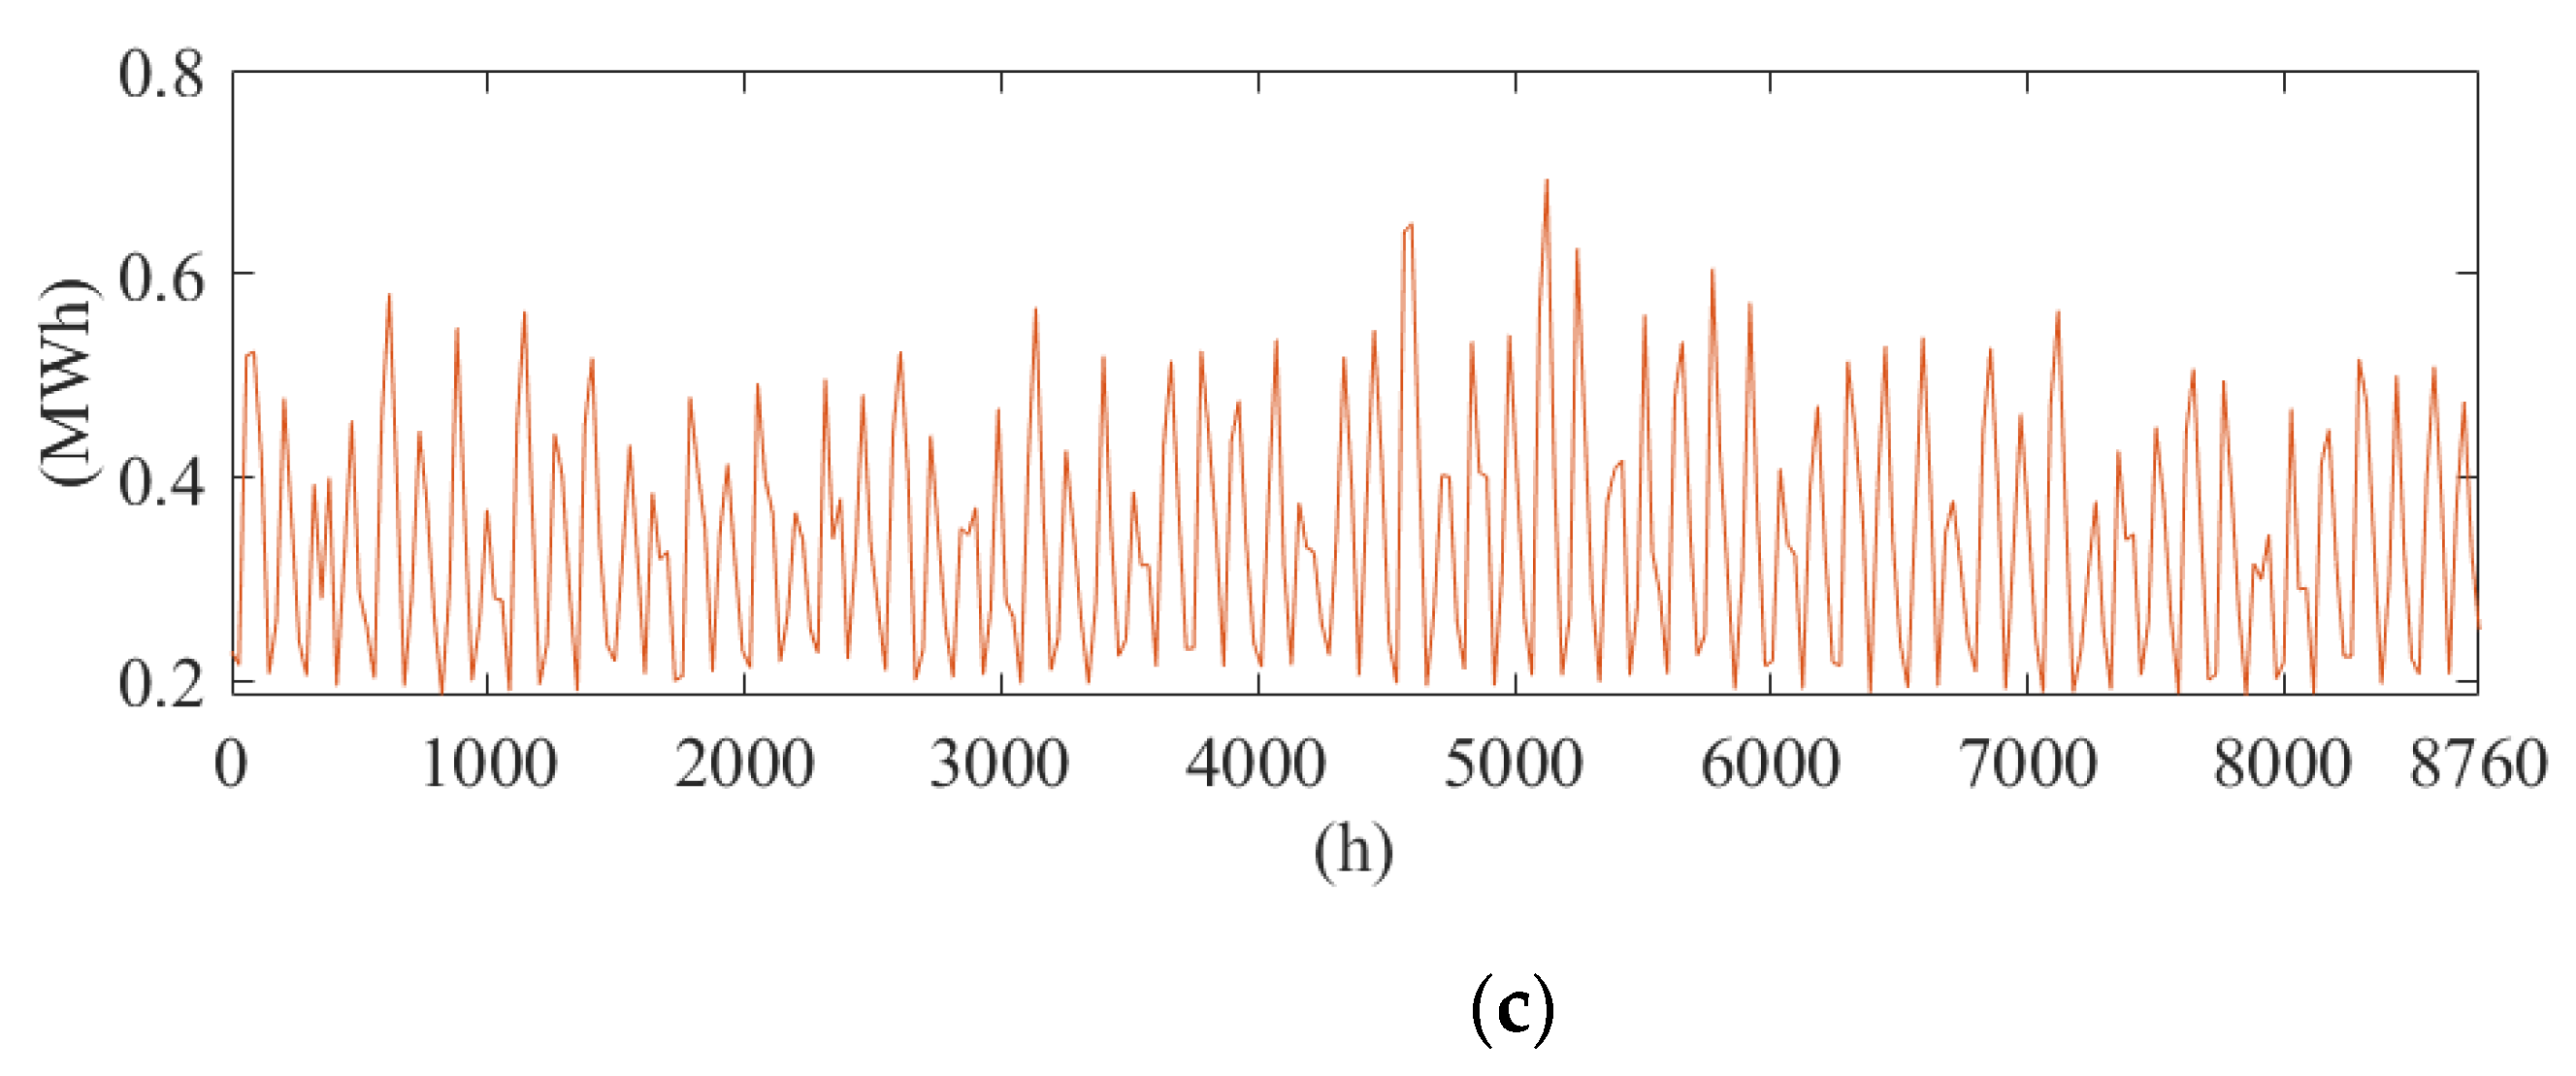
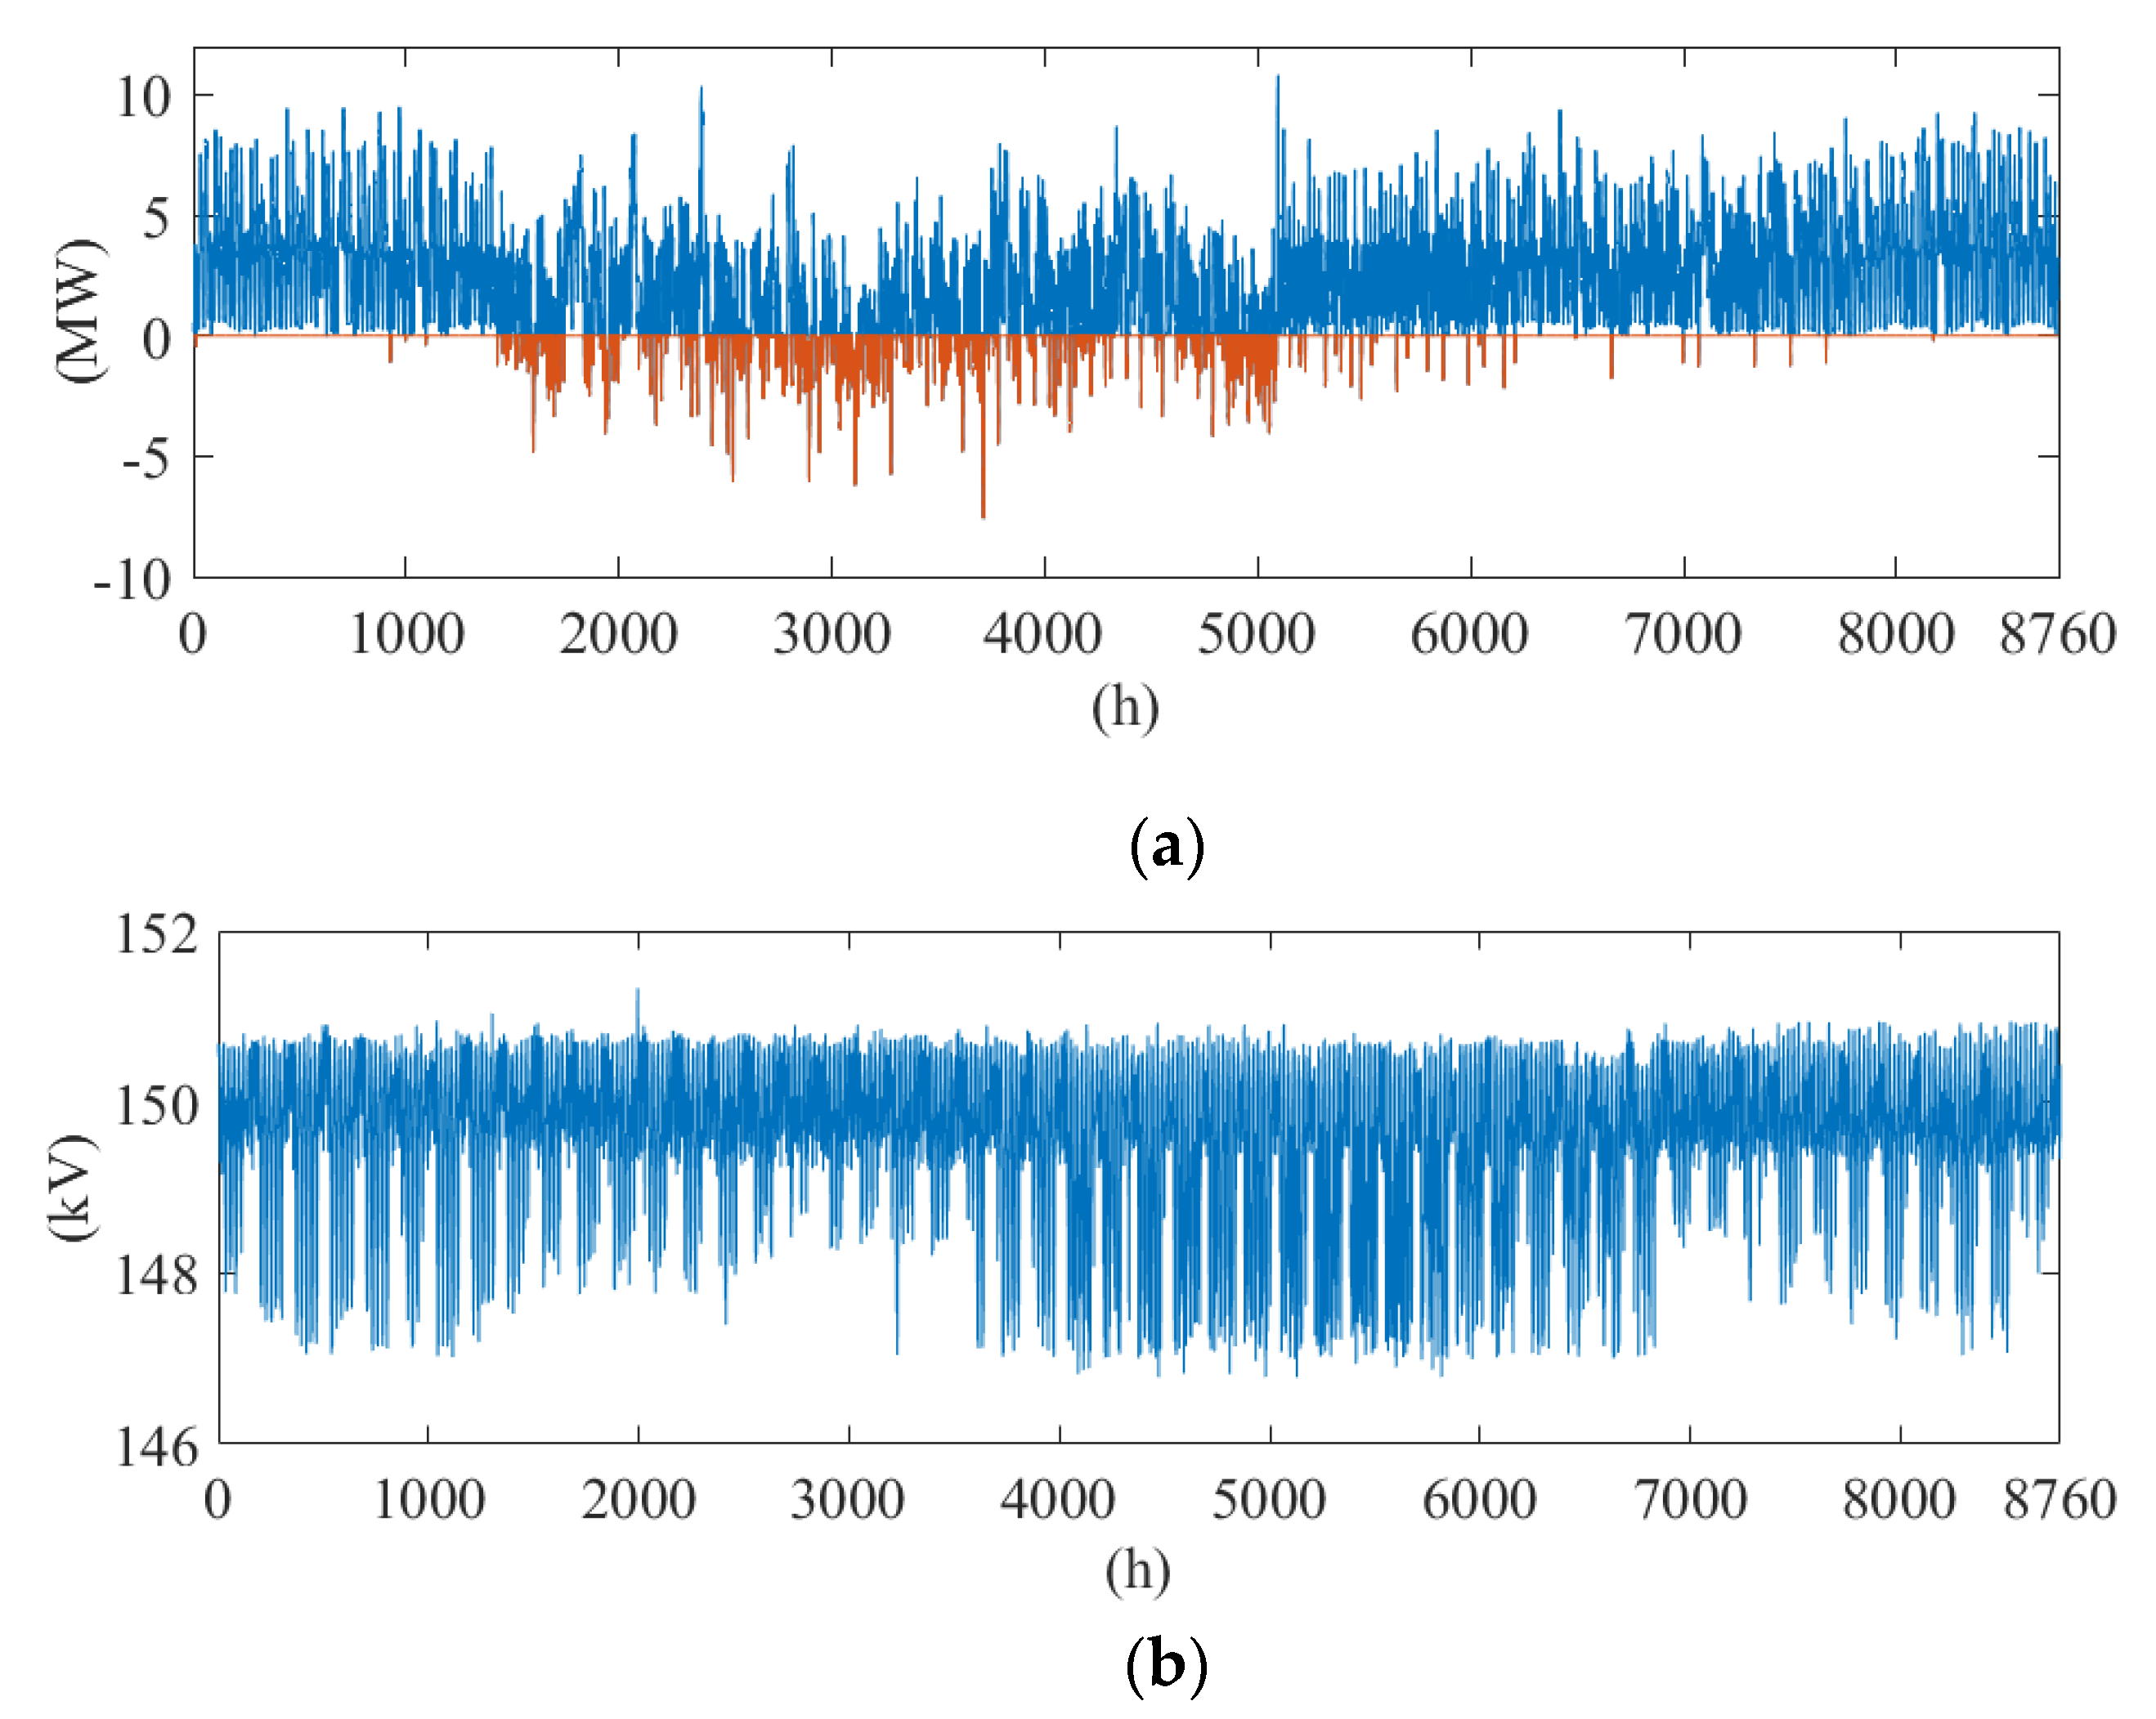
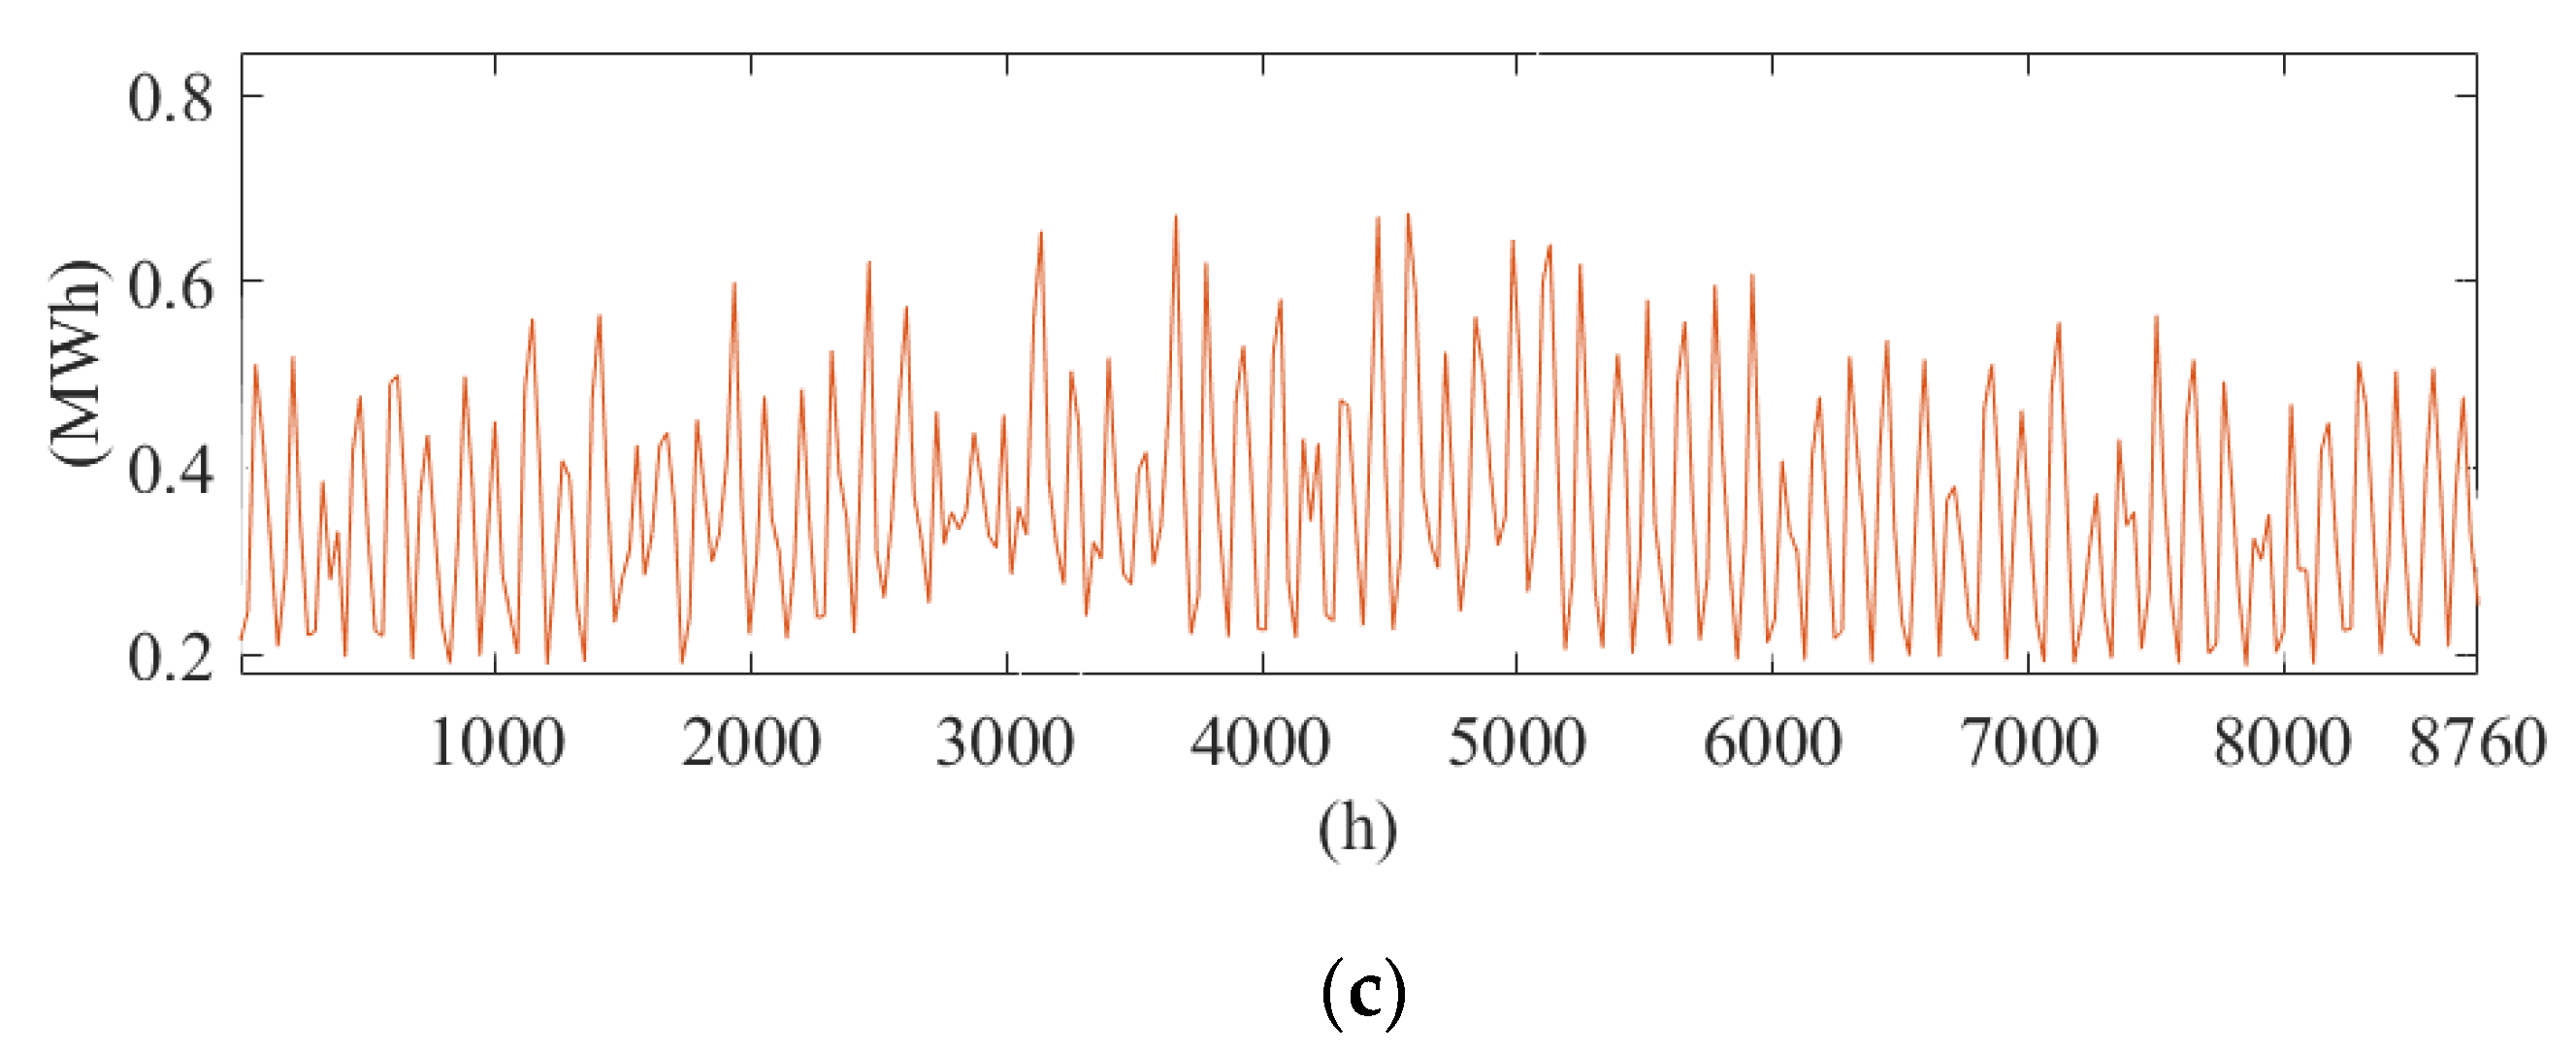
The base scenario is described to define the actual state of the considered network cluster and, thus, permits to perform a comparison with the other scenarios. As mentioned, the results shown in this section are based on the data measured over the entire MV network operated by Areti during a 1-year measurement campaign. In the following figures, the x-axis has been set with a range from 1 to 8760 representing the hours of the year, starting from 1 January till 31 December. In particular, Figure 9a illustrates the power flow generated into the HV-MV transformer belonging to the PS in RFF; in the figure, the blue lines indicate a positive power flow, whilst the red lines indicate a reverse power flow. In this scenario, an inverse power flow has been verified for 1836 h throughout the year, producing a reverse energy flow of around 3234 MWh. Figure 9b shows the voltage profile at the 150 kV busbar of the PS, while in Figure 9c, the energy losses per hour estimation is provided.

5.2. Scenario A

This scenario is related to the evaluation of the power flow obtained after the connection of a single UNIFLEX-PM converter between the substations as defined in the first row of Table 3. Figure 10 illustrates, for Scenario A, the shapes of the same physical variables used in Figure 9 for the base scenario. In this case, an inverse power flow has been verified for 1173 h throughout the year, producing an amount of energy injected in the HV line around 1631 MWh. The results, summarized in Table 4, have highlighted that the UNIFLEX-PM usage has permitted a 49.6% reduction of the reverse energy flow. In order to perform a deeper analysis, the costs evaluation related to the line improvement has been performed considering two cases, as illustrated in Table 5. The best case refers to an implementation using overhead cables, while the worst case refers to underground cables.
Furthermore, an evaluation of the return on investment (ROI) has been performed accounting for the following voices of income:
  • The amount of energy EUNI, otherwise injected on the HV side through the RFF PS, is transferred through the UNIFLEX to the PNG line and sold to the users;
  • Cost reduction due to the amount of energy EUNI no longer sink from the HV PNG line;
  • Loss reduction due to the lower energy flow on the RFF and PNG HV/MV transformers.
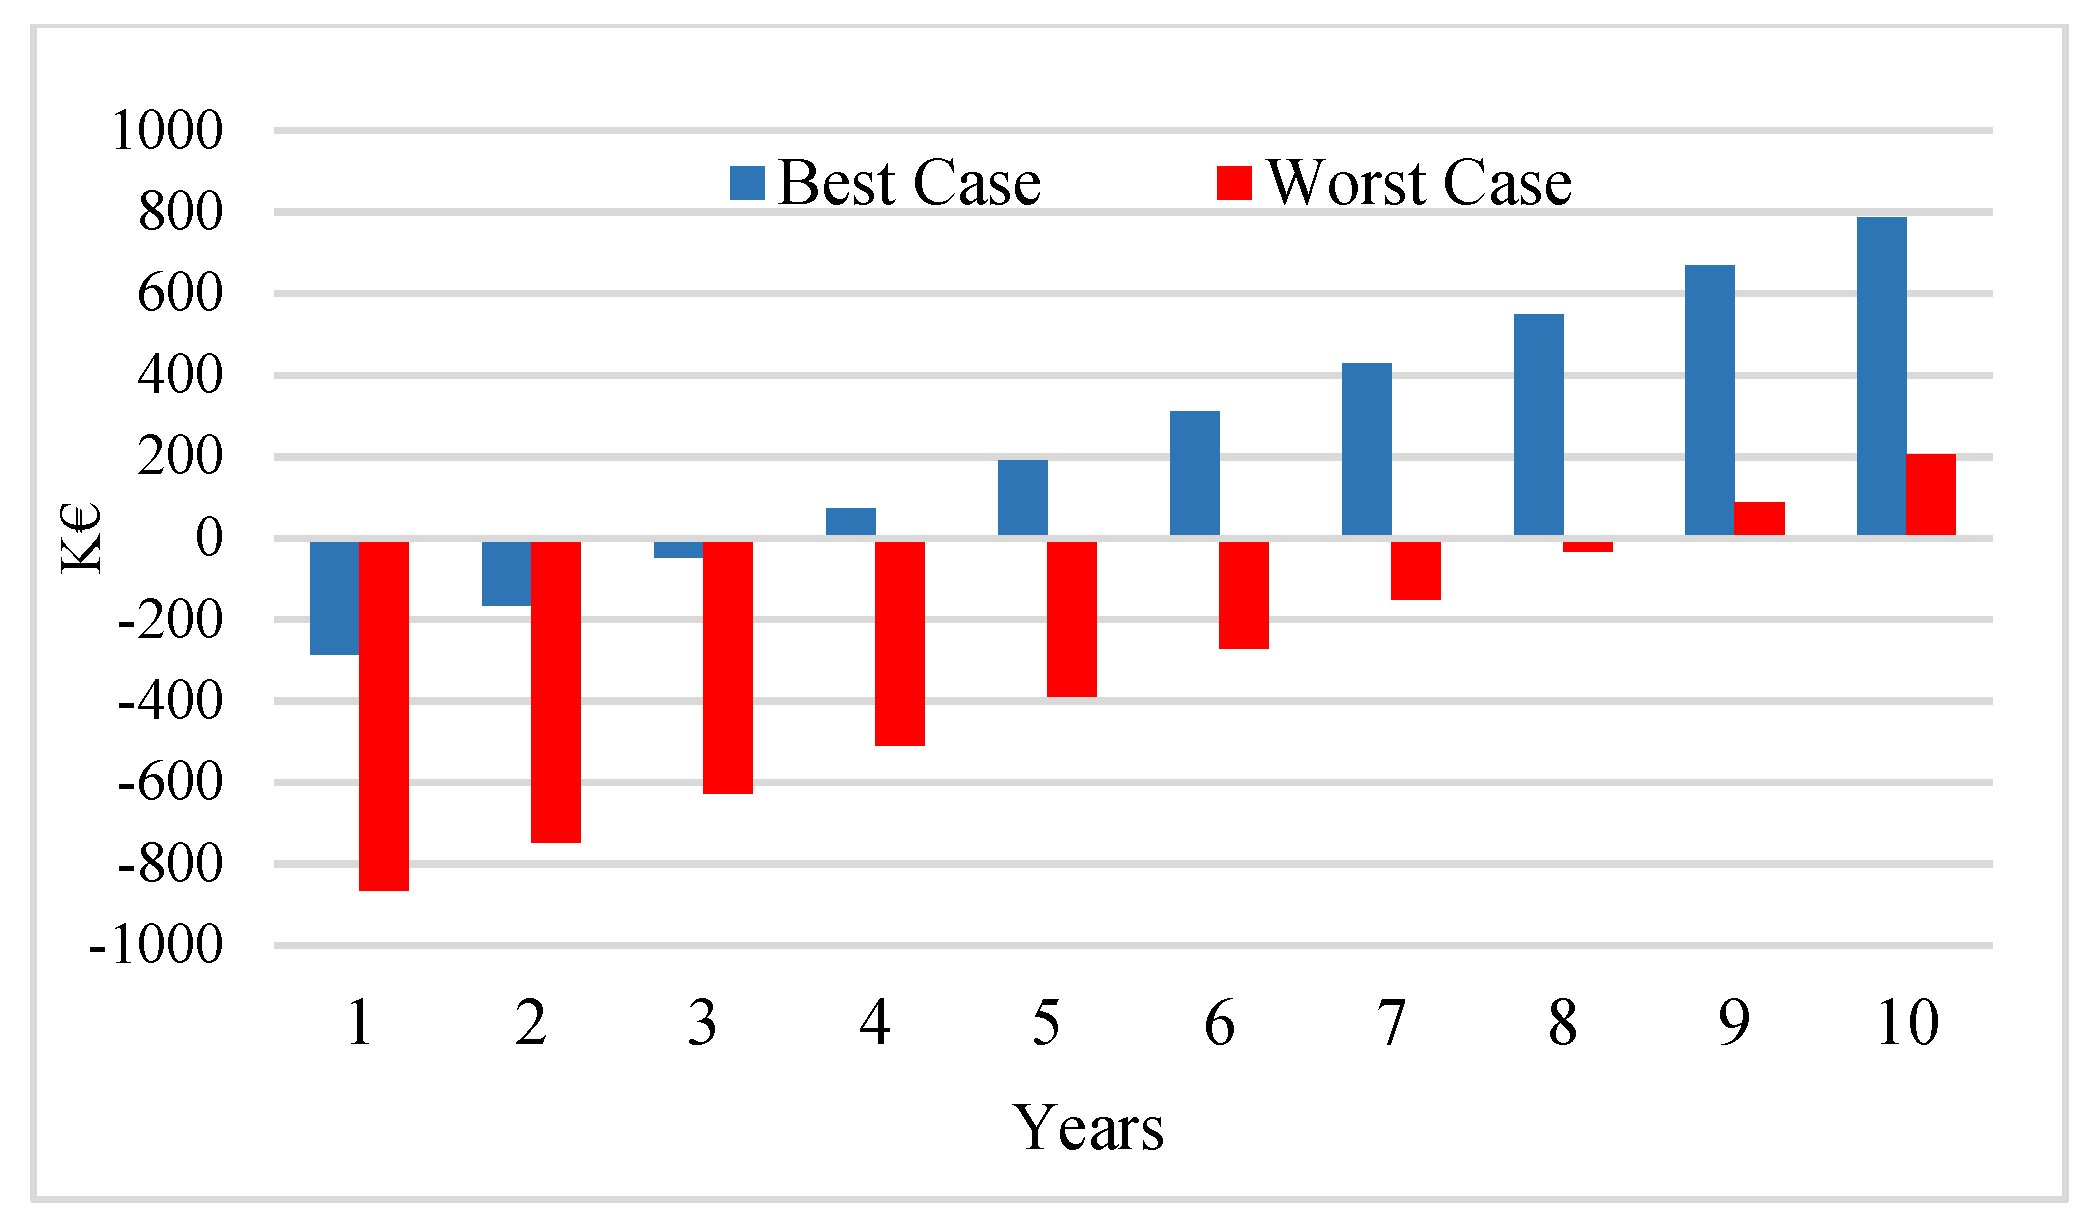
Additional benefits are related to the increased hosting capability of the lines, the increase in resiliency for the PNG line and the possibility for the DSO to include remote energy management capabilities. It is to be noticed that the economic evaluation of those benefits cannot be easily determined, as they have not been considered as incomes. As shown in Figure 11, in the best case, the ROI is 2.4 years, while in the worst case, the ROI is equal to 7.3 years.

5.3. Scenario B

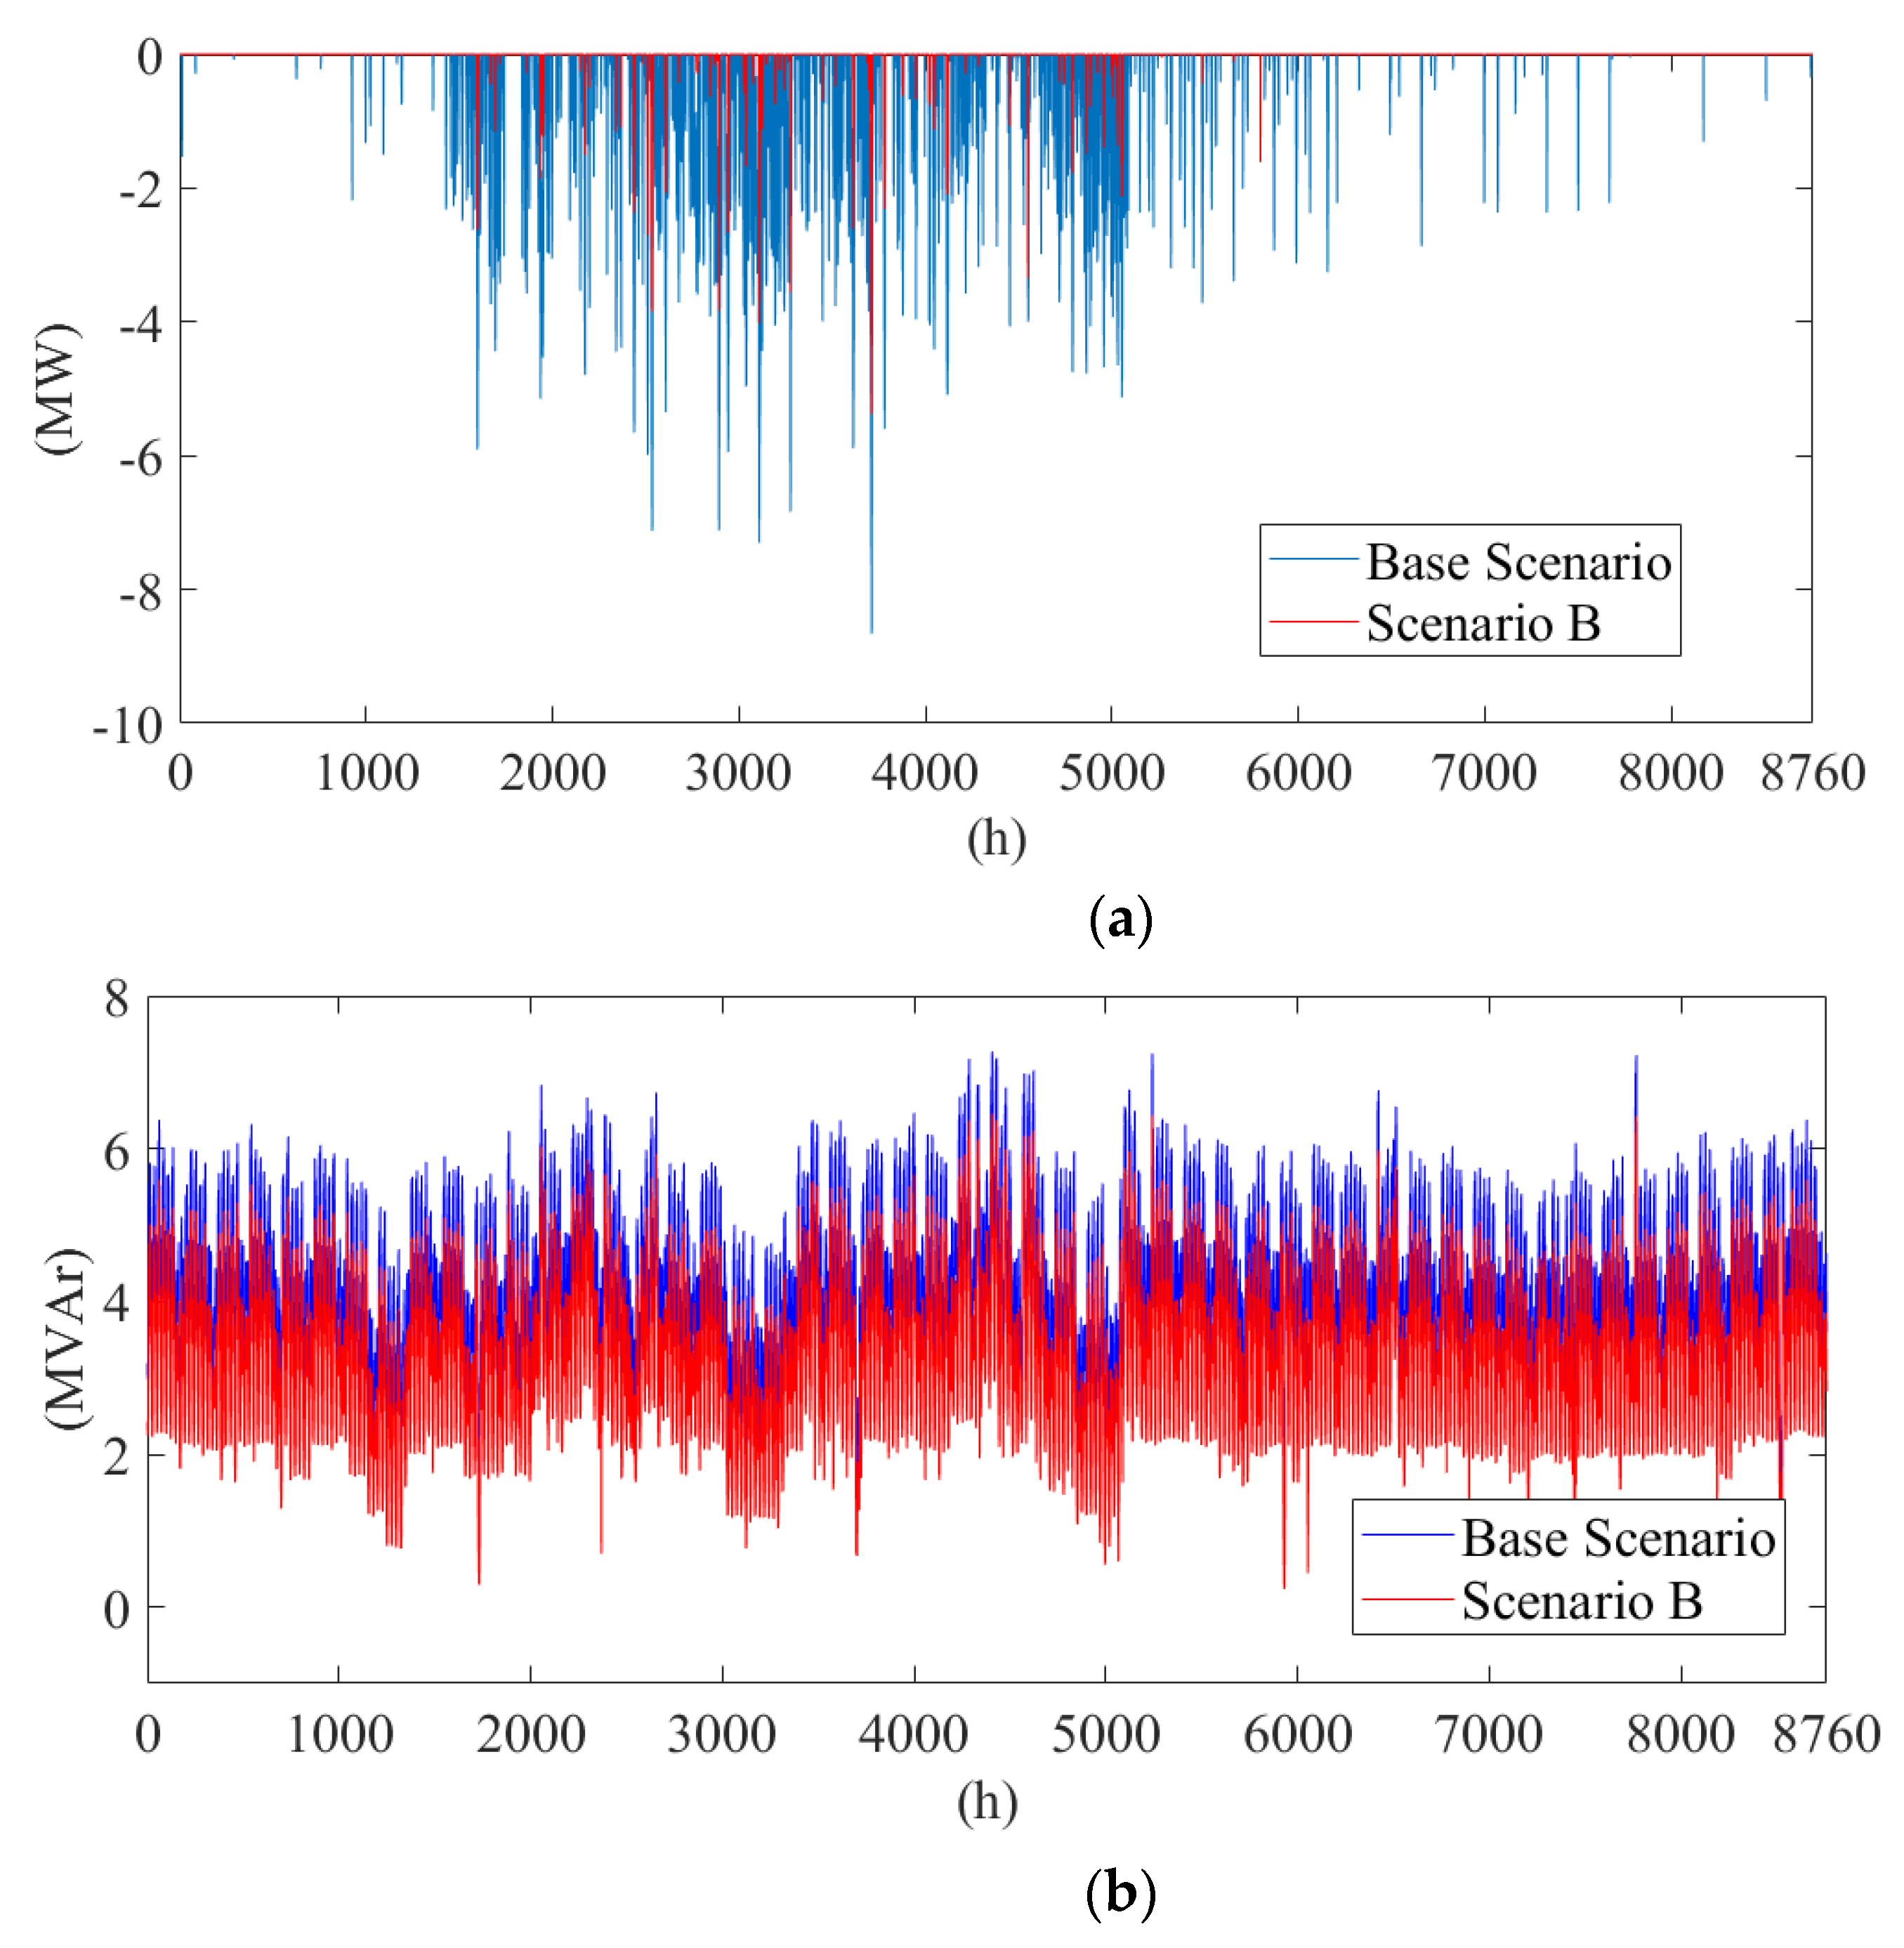
This scenario is related to the evaluation of the power flow obtained after the connection of three UNIFLEX-PM converters between the substations defined in Table 3. For a more straightforward comparison, Figure 12a illustrates the power flow generated into the HV-MV transformer belonging to both the base and Scenario B. In this case, an inverse power flow has been verified for 280 h throughout the year, producing an amount of energy injected in the HV line around 254 MWh. The results, summarized in Table 6, have highlighted that the UNIFLEX-PM usage has permitted a 92% reduction of the reverse energy and about 85% reduction in the duration of reverse energy transfer.
As a further benefit, a significant reduction of reactive power circulating in the considered line can be observed in Figure 12b, which shows the reactive power profile achieved in Scenario B in comparison with the Base Scenario.
As for Scenario A, the costs evaluation, shown in Table 7, has been pointed out considering the best case referred to an implementation using overhead cables and the worst case employing underground cables. As shown in Figure 13, in the best case, the ROI is 4.5 years while in the worst case, about 11 years.
It is worth noticing that the prediction of cash flows, as shown in Figure 11 and Figure 13, has been evaluated with the strong assumption that the corresponding energy flow scenarios remain constant every year without considering that those can change each year. Actually, the main source of uncertainty affecting the ROI prediction is the energy EUNI transferred through the UNIFLEX-PM nodes; in turn, the principal causes of variability for EUNI, supposing to retain the same generators as defined in Table 2, can be considered as mainly due to the fluctuation of the annual RES energy production and load demand variability. However, as an increase in the number of DG generators is expected in the next few years, even if the load demand grows at the same rate, it is reasonable (and conservative) to assume an almost constant inverse power flow and, consequently, a constant value of the energy EUNI.

6. Conclusions

A feasibility study has been performed to evaluate the usage of active nodes to link two asynchronous MV lines and, thus, permit a real-time active and reactive power flow control by the DSO. The power electronics interfaces, installed in strategic positions of the grid, can enable the direct routing of electricity, avoiding its worthless injection in HV networks, as well as provide ancillary services without requiring any procurement with distributed generation owners. To prove its effectiveness, a specific simulation model of a real network cluster operated by Areti has been implemented in DigSilent PowerFactory software using real data achieved on a 1-year measurement campaign. A detailed cost-benefit analysis has been provided, accounting for different load flow scenarios. The analysis has demonstrated that the inclusion of power flow capability can produce significant benefits, such as the loss reduction on the HV/MV transformers, the increase of the energy sold to the users and the reduction of the reverse energy flow (49.6% and 92% in the two presented scenarios, respectively) amongst the others. Additional improvements are related to the hosting capability and the resiliency of the lines, as well as to introduce remote energy management capabilities for the DSO. Such benefits can be obtained with an ROI in the range from 2.4 to 11 years, depending on the amount of installed power for the active node and the selected way for the electrical connections amongst the substations.

Author Contributions

Conceptualization S.B. and P.Z.; methodology S.B., V.B. and C.T.; software C.T. and S.P.; validation S.P., F.G. and S.A.; formal analysis S.B., V.B. and C.T.; data curation F.G. and S.P.; writing—original draft preparation S.B.; writing—review and editing S.B., V.B. and C.T.; supervision S.A., S.B., V.B. and P.Z. All authors have read and agreed to the published version of the manuscript.

Funding

This research received no external funding.

Data Availability Statement

Not applicable.

Conflicts of Interest

The authors declare no conflict of interest.

References

  1. Yazdaninejadi, A.; Hamidi, A.; Golshannavaz, S.; Aminifar, F.; Teimourzadeh, S. Impact of inverter-based DERs integration on protection, control, operation, and planning of electrical distribution grids. Electron. J. 2019, 32, 43–56. [Google Scholar] [CrossRef]
  2. Delfanti, M.; Galliani, A.; Olivieri, V. The new role of DSOs: Ancillary Services from RES towards a local dispatch. In Proceedings of the Cired Workshop, Rome, Italy, 11–12 June 2014. [Google Scholar]
  3. Sbordone, D.A.; Carlini, E.M.; Di Pietra, B.; Devetsikiotis, M. The future interaction between virtual aggregator-TSO-DSO to increase DG penetration. In Proceedings of the International Conference on Smart Grid and Clean Energy Technologies (ICSGCE), Offenburg, Germany, 20–23 October 2015; pp. 201–205. [Google Scholar] [CrossRef]
  4. European Parliament. Directive (EU) 2019/944 of the European Parliament and of the Council of 5 June 2019 on Common Rules for the Internal Market for Electricity and Amending Directive 2012/27/EU. Available online: https://eur-lex.europa.eu/legal-content/EN/TXT/?uri=CELEX%3A32019L0944 (accessed on 22 July 2021).
  5. Vicente-Pastor, A.; Nieto-Martin, J.; Bunn, D.W.; Laur, A. Evaluation of flexibility markets for Retailer–DSO–TSO coordination. IEEE Trans. Power Syst. 2018, 34, 2003–2012. [Google Scholar] [CrossRef]
  6. Migliavacca, G.; Rossi, M.; Six, D.; Džamarija, M.; Horsmanheimo, S.; Madina, C.; Morales, J.M. SmartNet: H2020 project analysing TSO–DSO interaction to enable ancillary services provision from distribution networks. CIRED-Open Access Proc. J. 2017, 1, 1998–2002. [Google Scholar] [CrossRef] [Green Version]
  7. Madina, C.; Jimeno, J.; Ortolano, L.; Palleschi, M.; Ebrahimy, R.; Madsen, H.; Corchero, C. Technologies and Protocols: The Experience of the Three SmartNet Pilots. In TSO-DSO Interactions and Ancillary Services in Electricity Transmission and Distribution Networks; Springer: Berlin/Heidelberg, Germany, 2020; pp. 141–183. [Google Scholar]
  8. Xu, Y.; Zhang, J.; Wang, W.; Juneja, A.; Bhattacharya, S. Energy router: Architectures and functionalities toward Energy Internet. In Proceedings of the IEEE International Conference on Smart Grid Communications (SmartGridComm), Brussels, Belgium, 17–20 October 2011; pp. 31–36. [Google Scholar] [CrossRef]
  9. Huang, A.Q.; Crow, M.L.; Heydt, G.T.; Zheng, J.P.; Dale, S.J. The future renewable electric energy delivery and management (FREEDM) system: The energy internet. Proc. IEEE 2010, 99, 133–148. [Google Scholar] [CrossRef]
  10. Zhang, J.; Wang, W.; Bhattacharya, S. Architecture of solid state transformer-based energy router and models of energy traffic. In Proceedings of the IEEE PES Innovative Smart Grid Technol (ISGT), Washington, DC, USA, 16–20 January 2012; pp. 1–8. [Google Scholar] [CrossRef]
  11. Bhattacharya, S. MV Power Conversion Systems Enabled by High-Voltage SiC Devices. IEEE Power Electron. Mag. 2019, 6, 18–21. [Google Scholar] [CrossRef]
  12. She, X.; Huang, A. Solid state transformer in the future smart electrical system. In Proceedings of the IEEE Power & Energy Society General Meeting, Vancouver, BC, Canada, 21–25 July 2013; pp. 1–5. [Google Scholar] [CrossRef]
  13. Ruiz, F.; Perez, M.A.; Espinosa, J.R.; Gajowik, T.; Stynski, S.; Malinowski, M. Surveying Solid-State Transformer Structures and Controls: Providing Highly Efficient and Controllable Power Flow in Distribution Grids. IEEE Ind. Electron. Mag. 2020, 14, 56–70. [Google Scholar] [CrossRef]
  14. De Carne, G.; Buticchi, G.; Zou, Z.; Liserre, M. Reverse power flow control in a ST-fed distribution grid. IEEE Trans. Smart Grid 2017, 9, 3811–3819. [Google Scholar] [CrossRef]
  15. Das, D.; Hrishikesan, V.M.; Kumar, C.; Liserre, M. Smart Transformer-Enabled Meshed Hybrid Distribution Grid. IEEE Trans. Ind. Electron. 2021, 68, 282–292. [Google Scholar] [CrossRef]
  16. Costa, L.F.; Hoffmann, F.; Buticchi, G.; Liserre, M. Comparative Analysis of Multiple Active Bridge Converters Configurations in Modular Smart Transformer. IEEE Trans. Ind. Electron. 2019, 66, 191–202. [Google Scholar] [CrossRef] [Green Version]
  17. Zhao, B.; Zeng, R.; Song, Q.; Yu, Z.; Qu, L. Medium-Voltage DC Power Distribution Technology; The Energy Internet, Woodhead Publishing: Cambridge, UK, 2019; pp. 123–152. ISBN 9780081022078. [Google Scholar] [CrossRef]
  18. Alassi, A.; Ahmed, K.; Egea-Àlvarez, A.; Ellabban, O. Innovative Energy Management System for MVDC Networks with Black-Start Capabilities. Energies 2021, 14, 2100. [Google Scholar] [CrossRef]
  19. Zhao, B.; Song, Q.; Li, J.; Sun, Q.; Liu, W. Full-Process Operation, Control, and Experiments of Modular High-Frequency-Link DC Transformer Based on Dual Active Bridge for Flexible MVDC Distribution: A Practical Tutorial. IEEE Trans. Power Electron. 2017, 6751–6766. [Google Scholar] [CrossRef]
  20. Zhu, R.; Andresen, M.; Langwasser, M.; Liserre, M.; Lopes, J.P.; Moreira, C.; Rodrigues, J.; Couto, M. Smart transformer/large flexible transformer. CES Trans. Electron. Mach. Syst. 2020, 4, 264–274. [Google Scholar] [CrossRef]
  21. Alsokhiry, F.; Adam, G.P. Multi-Port DC-DC and DC-AC Converters for Large-Scale Integration of Renewable Power Generation. Sustainability 2020, 12, 8440. [Google Scholar] [CrossRef]
  22. Li, K.; Wen, W.; Zhao, Z.; Yuan, L.; Cai, W.; Mo, X.; Gao, C. Design and Implementation of Four-Port Megawatt-Level High-Frequency-Bus Based Power Electronic Transformer. IEEE Trans. Power Electron. 2021, 36, 6429–6442. [Google Scholar] [CrossRef]
  23. IEEE Recommended Practice for 1 kV to 35 kV Medium-Voltage DC Power Systems on Ships. In IEEE Std 1709–2018 (Revision of IEEE Std 1709–2010); IEEE: New York, NY, USA, 2018; pp. 1–54. [CrossRef]
  24. Giannakis, A.; Peftitsis, D. MVDC Distribution Grids and Potential Applications: Future Trends and Protection Challenges. In Proceedings of the 20th European Conference on Power Electronics and Applications (EPE’18 ECCE Europe), Riga, Latvia, 17–21 September 2018. [Google Scholar]
  25. New ERA for Electricity in Europe. Distributed Generation: Key Issues, Challenges and Proposed Solutions European Commission; EUR 20901; Office for Official Publications of the European Communities: Luxembourg, 2003; ISBN 92-894-6262-0.
  26. Akagi, H. Classification, terminology, and application of the modular multilevel cascade converter (MMCC). IEEE Trans. Power Electron. 2011, 26, 3119–3130. [Google Scholar] [CrossRef]
  27. Pipolo, S.; Bifaretti, S.; Lidozzi, A.; Solero, L.; Crescimbini, F.; Zanchetta, P. The ROMAtrix converter: Concept and operation. In Proceedings of the IEEE Southern Power Electronics Conference (SPEC), Puerto Varas, Chile, 4–7 December 2017; pp. 1–6. [Google Scholar] [CrossRef]
  28. Pipolo, S.; Zanchetta, P.; Bifaretti, S.; Lidozzi, A.; Solero, L.; Crescimbini, F. Power control capabilities of the ROMAtrix converter. In Proceedings of the IEEE Energy Conversion Congress and Exposition (ECCE), Portland, OR, USA, 23–27 September 2018; pp. 3955–3960. [Google Scholar] [CrossRef]
  29. Babokany, A.S.; Jabbari, M.; Shahgholian, G.; Mahdavian, M. A review of bidirectional dual active bridge converter. In Proceedings of the 9th International Conference on Electrical Engineering/Electronics, Computer, Telecom and Information Technology, Phetchaburi, Thailand, 16–18 May 2012; pp. 1–4. [Google Scholar] [CrossRef]
  30. Tarisciotti, L.; Zanchetta, P.; Pipolo, S.; Bifaretti, S. Three-port energy router for universal and flexible power management in future smart distribution grids. In Proceedings of the IEEE Energy Conversion Congress and Exposition (ECCE), Cincinnati, OH, USA, 1–5 October 2017; pp. 1276–1281. [Google Scholar] [CrossRef]
  31. La Mendola, M.; di Benedetto, M.; Lidozzi, A.; Solero, L.; Bifaretti, S. Four-Port Bidirectional Dual Active Bridge Converter for EVs Fast Charging. In Proceedings of the IEEE Energy Conversion Congress and Exposition (ECCE), Baltimore, MD, USA, 29 September–3 October 2019; pp. 1341–1347. [Google Scholar] [CrossRef]
  32. Iov, F.; Blaabjerg, F.; Clare, J.; Wheeler, P.; Rufer, A.; Hyde, A. UNIFLEX-PM–a key-enabling technology for future European electricity networks. EPE J. 2009, 19, 6–16. [Google Scholar] [CrossRef]
  33. Bifaretti, S.; Zanchetta, P.; Watson, A.; Tarisciotti, L.; Clare, J.C. Advanced power electronic conversion and control system for universal and flexible power management. IEEE Trans. Smart Grid 2011, 2, 231–243. [Google Scholar] [CrossRef]
  34. Peng, F.Z. Flexible AC transmission systems (FACTS) and resilient AC distribution systems (RACDS) in smart grid. Proc. IEEE 2017, 105, 2099–2115. [Google Scholar] [CrossRef]
  35. Kotsampopoulos, P.; Georgilakis, P.; Lagos, D.T.; Kleftakis, V.; Hatziargyriou, N. FACTS Providing Grid Services: Applications and Testing. Energies 2019, 12, 2554. [Google Scholar] [CrossRef] [Green Version]
  36. Ciobotaru, M.; Iov, F.; Bifaretti, S.; Zanchetta, P. Short-circuit analysis of the UNIFLEX-PM using stationary and natural reference frame control. EPE J. 2009, 19, 42–50. [Google Scholar] [CrossRef]
  37. Bifaretti, S.; Zanchetta, P.; Fan, Y.; Iov, F.; Clare, J. Power flow control through a multi-level H-bridge based power converter for universal and flexible power management in future electrical grids. In Proceedings of the 13th International Power Electronics and Motion Control Conference, Poznań, Poland, 1–3 September 2008; pp. 1771–1778. [Google Scholar] [CrossRef]
  38. Tarisciotti, L.; Watson, A.; Zanchetta, P.; Bifaretti, S.; Clare, J.; Wheeler, P. An improved dead-beat current control for cascaded H-bridge active rectifier with low switching frequency. In Proceedings of the 6th IET Int. Conf. on Power Electronics, Machines and Drives (PEMD), Bristol, UK, 27–29 March 2012. [Google Scholar] [CrossRef]
  39. Tarisciotti, L.; Zanchetta, P.; Watson, A.; Bifaretti, S.; Clare, J.C. Modulated model predictive control for a seven-level cascaded H-bridge back-to-back converter. IEEE Trans. Ind. Electron. 2014, 61, 5375–5383. [Google Scholar] [CrossRef]
  40. Tarisciotti, L.; Zanchetta, P.; Watson, A.; Wheeler, P.; Clare, J.C.; Bifaretti, S. Multiobjective modulated model predictive control for a multilevel solid-state transformer. IEEE Trans. Ind. Applic. 2015, 51, 4051–4060. [Google Scholar] [CrossRef]
  41. Dang, H.; Watson, A.; Clare, J.; Wheeler, P.; Kenzelmann, S.; de Novaes, Y.R.; Rufer, A. Advanced integration of multilevel converters into power system. In Proceedings of the 34th Annual Conference of IEEE Industrial Electronics, Orlando, FL, USA, 10–13 November 2008; pp. 3188–3194. [Google Scholar] [CrossRef]
  42. Pipolo, S.; Bifaretti, S.; Bonaiuto, V.; Tarisciotti, L.; Zanchetta, P. Reactive power control strategies for UNIFLEX-PM Converter. In Proceedings of the 42nd Annual Conference of the IEEE Industrial Electronics Society (IECON), Florence, Italy, 23–26 October 2016; pp. 3570–3575. [Google Scholar] [CrossRef]
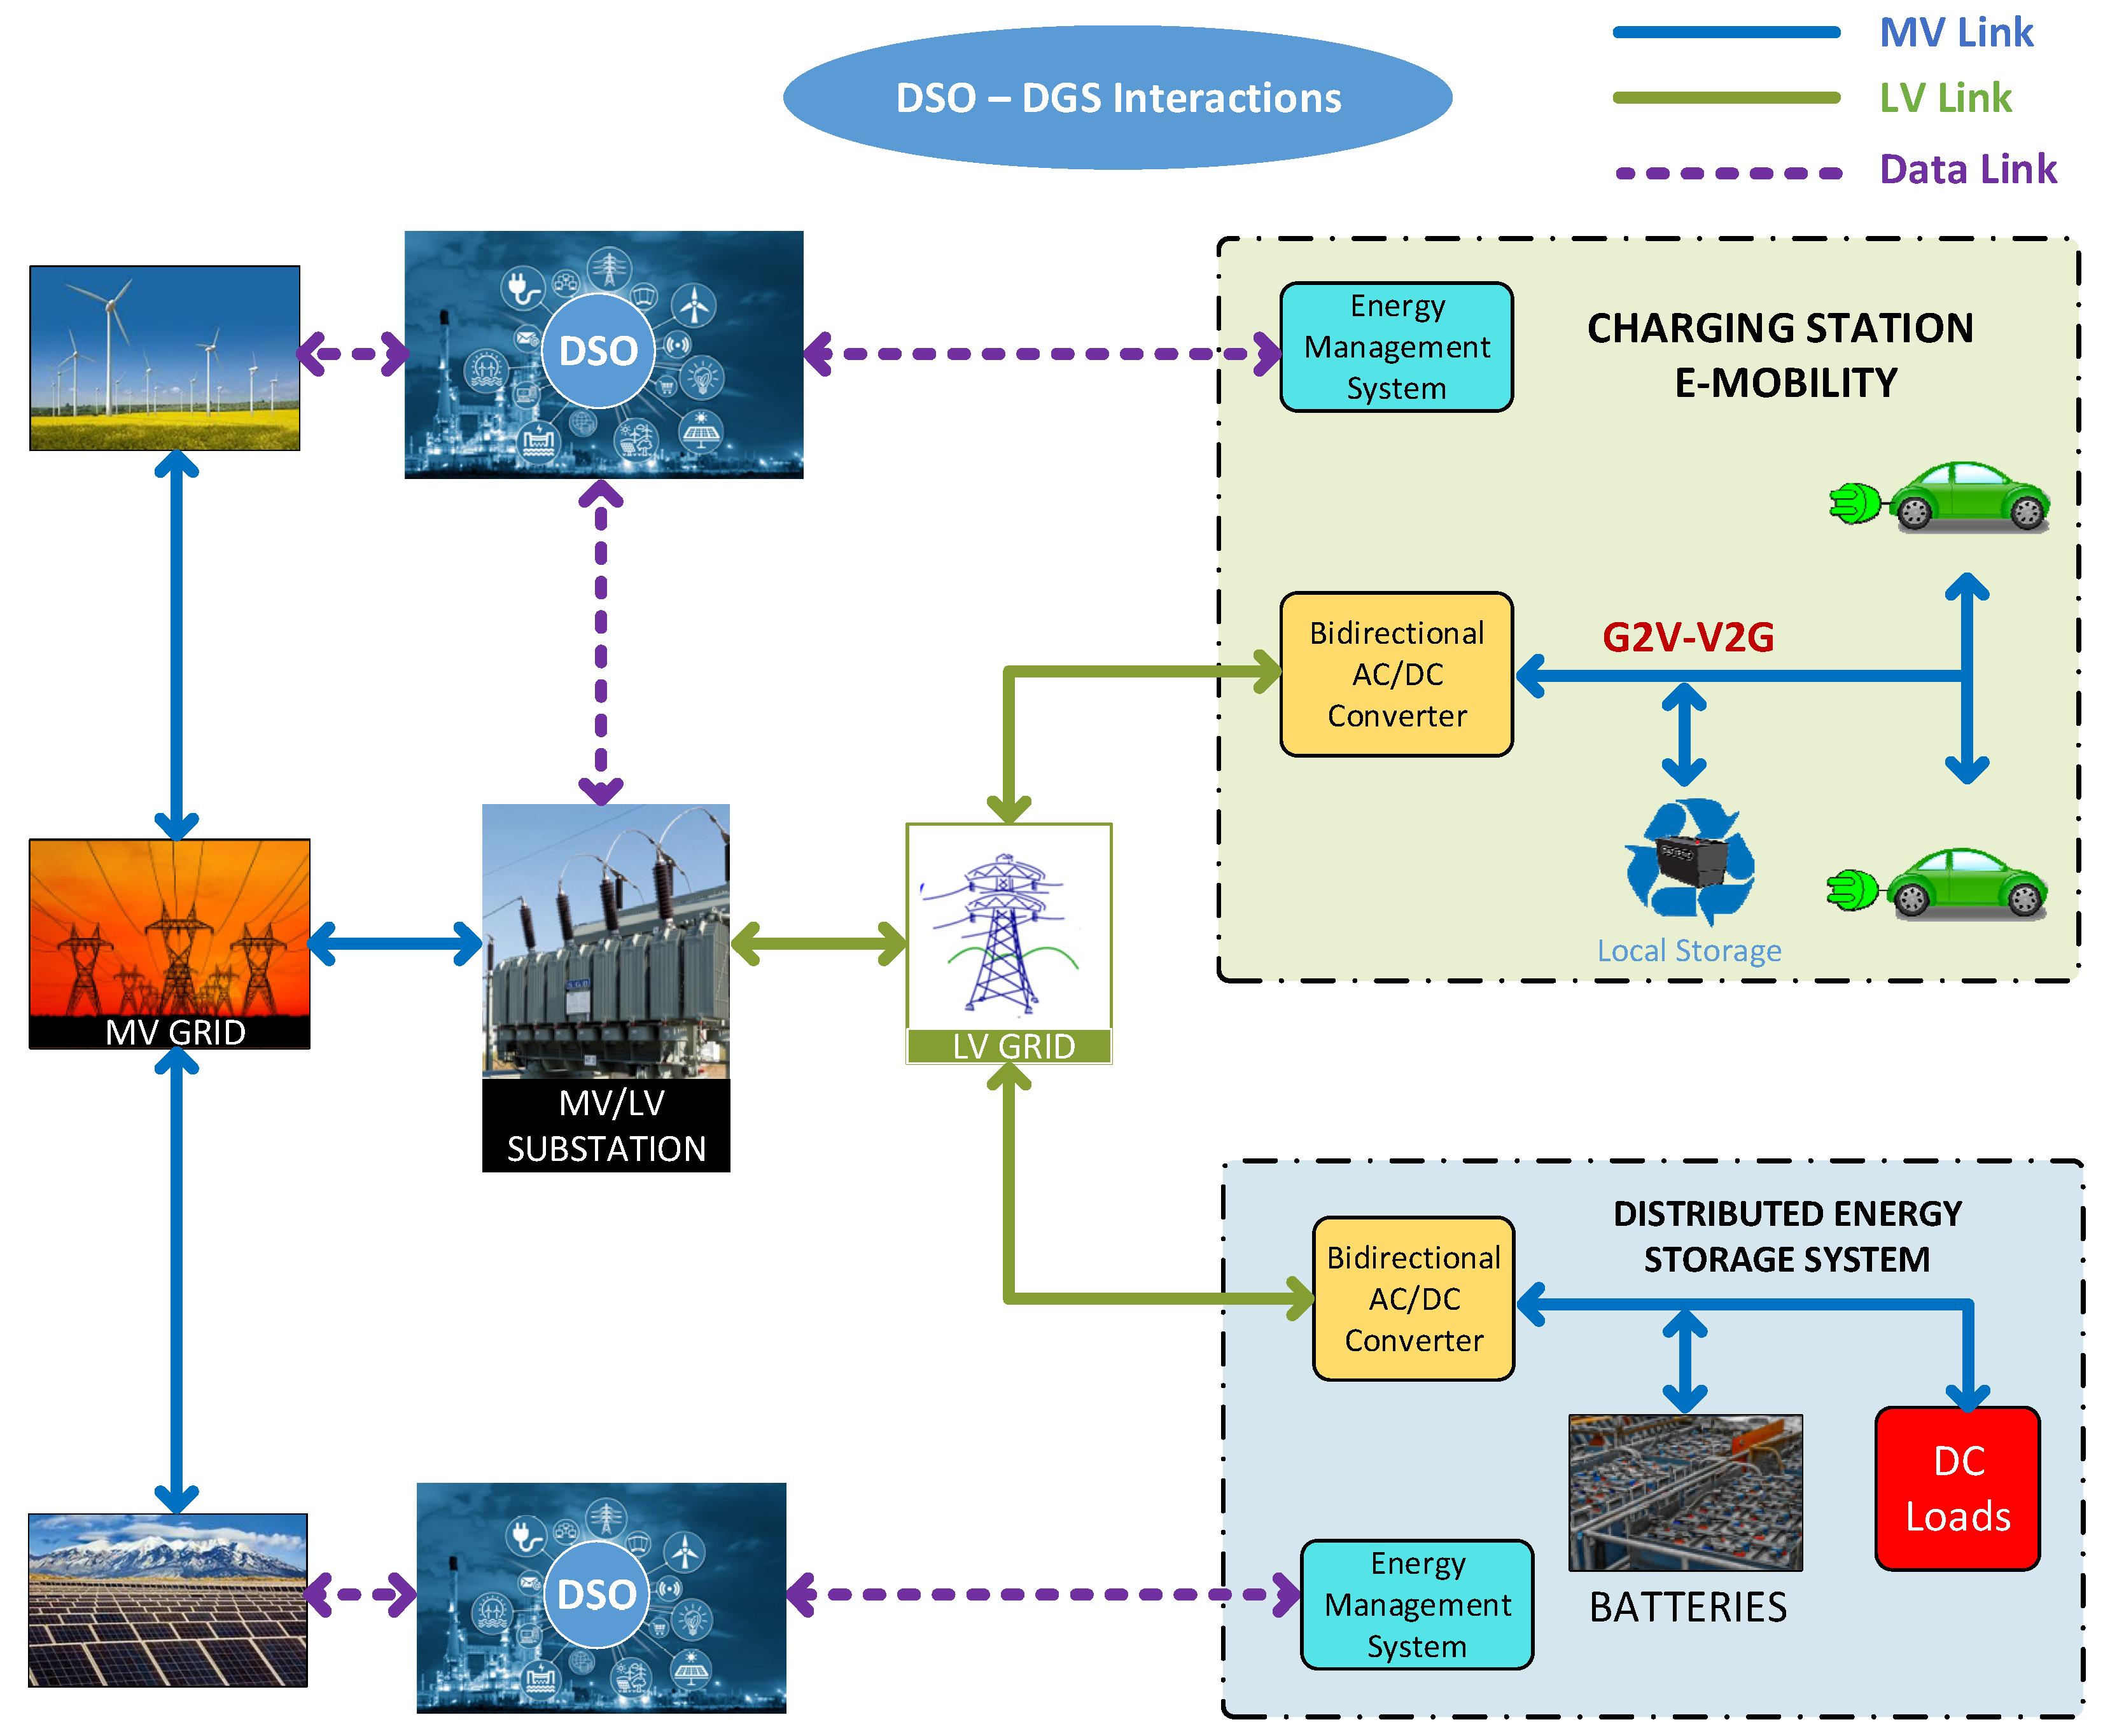
Figure 1. Example of interactions between DSO and DGSs in a dispatching service scenario. (Own elaboration).
Energies 14 04519 g001
Figure 2. Active nodes concept for the internet of energy management. (Own elaboration).
Energies 14 04519 g002
Figure 3. UNIFLEX concept. (Own elaboration).
Energies 14 04519 g003
Figure 4. UNIFLEX detailed structure—vPx: grid voltage applied to port P phase x, vCPx: voltage imposed by the converter to one terminal of the filter inductance on port P phase x, being P = 1, 2, 3 and x = a, b, c (Own elaboration).
Energies 14 04519 g004
Figure 5. Equivalent schematic diagram of the network cluster. (Created on the base of data provided by Areti).
Energies 14 04519 g005
Figure 6. Annual energy profile for LV passive and active users. (Created on the basis of data provided by Areti).
Energies 14 04519 g006
Figure 7. Simplified UNIFLEX model, including control signals. (Own elaboration).
Energies 14 04519 g007
Figure 8. Simulation diagram of the cluster, including the UNIFLEX-PM converter. (Own elaboration).
Energies 14 04519 g008
Figure 9. Base scenario simulation results: (a) Power flow in the HV-MV transformer belonging to Primary Substation RFF; (b) voltage at 150 kV busbar; (c) energy losses. (Created on the basis of data provided by Areti).
Energies 14 04519 g009aEnergies 14 04519 g009b
Figure 10. Scenario A simulation results: (a) Power flow in the HV-MV transformer belonging to Primary Substation RFF; (b) voltage at 150 kV busbar; (c) energy losses. (Created on the basis of data provided by Areti).
Energies 14 04519 g010aEnergies 14 04519 g010b
Figure 11. Cash flow for Scenario A. (Own elaboration).
Energies 14 04519 g011
Figure 12. Power flow of the Base Scenario (blue line) vs. Scenario B (red line) in the Primary Substation RFF 150–20 kV transformer: (a) active power; (b) reactive power. (Own elaboration).
Energies 14 04519 g012
Figure 13. Cash flow for Scenario B. (Own elaboration).
Energies 14 04519 g013
Table 1. UNIFLEX-PM converter rated parameters.
NameDescriptionValueUnit
CDC-Link capacitor3100(μF)
rLInductor parasitic resistance0.5(Ω)
LAC filter inductance11(mH)
P NOMRated power5(MVA)
V1 NOMRated peak value of the AC supply on port 1 (line-to-line)3300(V)
V2 NOMRated peak value of the AC supply on port 2 (line-to-line)3300(V)
V3 NOMRated peak value of the AC supply on port 3 (line-to-line)415(V)
VDC NOMRated capacitor voltage1100(V)
Table 2. Distributed generation tied to RFF substation.
Generator TypeRated Power (MW)Line Name
Incinerator9REG
Biogas19.4ASC
Biogas10GIO
Thermoelectric2.3COT
Photovoltaic1PER
Photovoltaic8.5COT
Table 3. Physical link options.
Physical LinksRFF Substation
20 kV
PNG Substation
8.4 kV
Air Distance
(km)
Ground Distance
(km)
No. Active Nodes
1RFF-APNG-A2.255.71
2RFF-BPNG-B1.359.51
3RFF-CPNG-C2.155.11
1 + 2 + 3all of the aboveall of the above5.7520.33
Table 4. Base vs. Scenario A.
TR 150–20 kV RFFUNIFLEX-PM
Energy EHV
(MWh)
Time Interval
(h)
Energy EUNI
(MWh)
Time Interval
(h)
Base Scenario−32341836NANA
Scenario A−1631117316031836
Table 5. Scenario A costs evaluation.
ITEMBest Case
(Overhead Cables)
(k€)
Worst Case
(Underground Cables)
(k€)
UNIFLEX-PM200260
Power Lines60570
Secondary Substation1016
Electrical Devices1520
Total285866
Table 6. Base vs. Scenario B.
TR 150–20 kV RFFUNIFLEX-PM
Energy EHV
(MWh)
Time Interval
(h)
Energy EUNI
(MWh)
Time Interval
(h)
Base Scenario−32341836NANA
Scenario B−25428029801836
Table 7. Scenario B costs evaluation.
ITEMBest Case
(Overhead Cables)
(k€)
Worst Case
(Underground Cables)
(k€)
UNIFLEX-PM600780
Power Lines1521170
Secondary Substation3048
Electrical Devices4560
Total8272058
Publisher’s Note: MDPI stays neutral with regard to jurisdictional claims in published maps and institutional affiliations.