Article

Analysis of Yield Potential and Regional Distribution for Bioethanol in China

1
Institute of Geographical Sciences and Natural Resources Research, Chinese Academy of Sciences, Beijing 100101, China
2
College of Resources and Environment, University of Chinese Academy of Sciences, Beijing 100049, China
3
Key Laboratory of Carrying Capacity Assessment for Resource and Environment, Ministry of Natural Resources, Beijing 100101, China
*
Authors to whom correspondence should be addressed.
Energies 2021, 14(15), 4554; https://doi.org/10.3390/en14154554
Submission received: 27 June 2021 / Revised: 25 July 2021 / Accepted: 26 July 2021 / Published: 28 July 2021

Abstract

:
Bioethanol will play a significant role in energy structure adjustment and greenhouse gas mitigation in the future, especially in the transport sector. As bioethanol production with grain crops may become obsolete due to food security concerns, the Chinese government has advocated the development of non-grain bioethanol. According to the current actual situation of bioethanol development and China’s Liquid Biofuel Development Roadmap, we defined three stages of bioethanol development. We focused on the assessment of bioethanol feedstock resources and bioethanol yield potential in different stages using a comprehensive evaluation system integrating statistical methods, crop growth process models, and geographic information system (GIS) techniques. The considered feedstocks included corn, sweet sorghum, cassava, switchgrass, crop straw, and forest residues. The spatial–temporal characteristics of the regional bioethanol distribution were discussed. The results indicate that the total resources of corn, sweet sorghum, cassava, switchgrass, crop straws, and forest residues were about 257.17, 2083.55, 44.36, 357.56, 1031.62, and 924 million tons at different time points, respectively. In the first stage, the year 2020, the potential bioethanol totaled 21.55 million tons. An advantage in bioethanol development was demonstrated by Northeast China. A positive development situation was also identified in East China, such as in Tianjin. In the second stage, from 2020 to 2030, the potential bioethanol production is estimated to be 145.42 million tons. The bioethanol development potential will increase in South China, in areas such as Yunnan, Guangxi, and Guizhou. In the third stage, the potential bioethanol based on switchgrass is estimated to be 92.99 million tons. The potential bioethanol based on crop straws and forest residues will be 14.76 million tons if 5% of these feedstocks are fully used for producing bioethanol. Regions with a large development potential will be further expanded. Interregional bioethanol flows and international cooperation will help meet the whole nation’s requirement.

1. Introduction

The energy crisis and climate change caused by fossil fuel consumption have led to the adjustment of the energy structure in various countries. Thus, renewable energy is expected to play an increasing role as an alternative energy source, of which liquid biofuel is an option. It can replace every petroleum-based fuel, helping relieve the pressure on the transport sector. Among the liquid biofuels, bioethanol is the most widely used at present. Its advantages consist of covering energy shortages, mitigating greenhouse gas emissions, and promoting rural economies. As a transportation fuel, bioethanol has multiple applications. It can be directly used as 100% of the fuel or be blended with gasoline either at a low concentration (e.g., E10 and E15) or a high concentration (e.g., E85) for use in flexi-fuel vehicles.
The global market for bioethanol has entered a stage of rapid and transitional growth [1]. Global bioethanol production increased from 67 billion liters in 2008 to over 111.9 billion liters in 2018 [2,3]. The United States and Brazil are the major producers, accounting for about 84% of the world’s total production. There were over 2000 fuel ethanol plants in operation worldwide in 2018, and the United States, Brazil, and several European Commission member states had the largest programs promoting bioethanol [4]. With new government programs in place in various countries, such as compulsory consumption quotas for bioethanol, world bioethanol production will continue growing. The United States is the largest producer of bioethanol fuel in the world, accounting for about 54% of the global bioethanol production (Table 1). The main feedstock used is corn. Research on lignocellulosic biomass is also underway. Brazil is the second largest producer in the world (Table 1), where bioethanol is predominantly derived from sugar cane. Due to the relatively short input, and low processing and transport costs, bioethanol produced in Brazil is inexpensive [4]. Additionally, Brazil is currently the only country that does not use neat gasoline in cars. European countries are also endeavoring to increase bioethanol production, where bioethanol is primarily produced from sugar beet and wheat, but the total cultivated land is insufficient to meet the needs. Another liquid biofuel, biodiesel, has been better developed.
China has a short history of bioethanol production, dating to the beginning of the 10th Five-Year Plan. The main aim was to solve the problem of “aged grain”; therefore, corn is dominant in feedstocks, followed by rice and cassava. Due to increasing concerns regarding feedstock supply and food security in recent years, bioethanol produced from non-grain sources has been developed from, e.g., cassava and sweet sorghum. In 2007, the National Development and Reform Commission issued the Middle and Long-Term Program of Renewable Energy Development, which proposed that the annual use of fuel ethanol would reach 10 million tons by 2020, supporting the full use of non-grain energy plants on marginal land and agricultural and forestry residues. As of 2018, 11 bioethanol projects had been approved. According to China’s National Grain and Oils Information Center, the national bioethanol capacity was 3.22 million tons in 2018.
Bioethanol feedstocks are sufficiently abundant, including various types of biomass, usually chronologically divided into first generation; 1.5 generation, the generation between first and second; and second generation. First-generation feedstocks mainly refer to grain crops and sugar crops (e.g., corn, sugar cane, and sugar beet); 1.5-generation feedstocks mainly refer to sugar or starch non-grain energy plants (e.g., sweet sorghum and cassava); second-generation feedstocks mainly refer to lignocellulosic biomass and algae. Lignocellulosic biomass includes herbaceous crops, agricultural and forestry residues, and other wastes [5].
First-generation bioethanol technology has matured and has been highly industrialized, which is presently the main bioethanol. Although this ethanol is produced at an acceptable cost, the feedstock cost is high, accounting for more than 60% of the total production cost [6]. The planting technology of these crops is relatively mature; thus, it is most unlikely be improved to decrease costs. Additionally, since this production conflicts with food production and animal feed and provides a limited contribution to greenhouse gas mitigation, the first-generation bioethanol development has gradually stagnated [7]. The 1.5-generation bioethanol does not threaten food security, but it still needs specialized cultivation for feedstocks. This bioethanol is currently showing a positive development trend, with a good research foundation and relatively mature technology. It is expected to be competitive in the near future. Second-generation main feedstock lignocellulosic biomass is cheap and abundant. In addition to not competing with other industries, lignocellulosic biomass generates low net greenhouse gas emissions, contributing to environmental sustainability [8]. For difficulties in pretreatment and cellulose hydrolysis, the use of lignocellulosic biomass for bioethanol is still slowly developing, but it is envisaged to provide a significant portion of the feedstock for bioethanol production in the middle and long terms.
There have been some studies on the bioethanol yield estimation from different feedstocks at home and abroad in recent years. Jiang et al. discussed non-grain energy plant-based ethanol. They presented a method, coupling the Environmental Policy Integrated Climate GIS-based (GEPIC) model with life cycle analysis (LCA), to simulate the spatial distribution of potential bioethanol production, energy efficiency, and environmental impacts. The results showed that based on sweet sorghum, 847.81 thousand tons of ethanol could be produced, and the potential net energy gained was 115 billion MJ. The total environmental effect index was 0.25 million (population equivalents). Guizhou Province can be given priority for sweet sorghum-based bioethanol development [9]. Huang et al. analyzed China’s sugar cane cultivation potential, bottlenecks, and a critical analysis of policies vs. the Brazilian model of sugar cane-derived biofuels. Their study determined that the first-generation ethanol production was constrained due to the high domestic demands of sugar. However, it was inferred that bagasse-based (second-generation) ethanol has excellent prospects, showing a higher theoretical yield potential, density distribution, and cost efficiency for disintegration [10]. Wang et al. estimated the water and farmland use and CO2 emissions in China due to first- and second-generation bioethanol production technologies using a multi-regional input–output-based hybrid life cycle assessment model. The results showed that the first-generation technology had higher resource use and environmental impacts compared to the second-generation technology. The gasoline-to-bioethanol transition enabled CO2 emission reductions, but at the cost of increased water and farmland use [11]. Tian et al. paid attention to one of the feedstocks of bioethanol, switchgrass. They developed an integrated, field-scale, and process-based ecosystem model (DRAINMOD-GRASS) for simulating hydrological processes, soil carbon and nitrogen cycling, and plant growth in three replicated switchgrass (Panicum virgatum) plots located in eastern North Carolina, USA. The results showed that the model accurately predicted the 5-year (2009–2013) biomass yield, daily water table depth, temporal dynamics of daily soil moisture, and temperature and seasonal changes in net N mineralization and nitrification rates, respectively [12]. Fan et al. focused on cellulosic bioethanol based on crop residue, whose study was conducted with the data of crop production and valid face-to-face questionnaires on residue utilizations. It was found that the crop residue amounted to 897.06 Mt in 2016. The bioethanol potential was 124.3 Mt in 2016. The four top-ranked provinces of bioethanol potential were Heilongjiang, Henan, Jilin, and Sichuan [13].
To achieve the large-scale application of bioethanol, feedstock supply, technology, and the economy should be considered. Fuel ethanol suitable for development varies over time. Bioethanol research and industry launched late in China, and thus systematic research on bioethanol feedstock resources and use potential from the temporal and spatial dimensions is lacking, leading to difficulties in supporting the national and regional bioethanol planning requirements in the middle and long terms. As such, in this study, we aimed to assess the distribution of bioethanol feedstock resources and bioethanol potential in China in different stages, and to determine the pragmatic balance between production potential and demand, in order to gain a complete understanding of the history and future trend of bioethanol development. Then, targeted and effective suggestions for the future development of bioethanol can be raised, contributing to the results; hence, bioethanol production can better adapt to the market demand. This work mainly lies in the systematic nature of the research methods and the practicability of the results. Previous studies on the yield potential of bioethanol were usually directed against only one type or one class of raw material. In this paper, a comprehensive evaluation system integrating various estimation methods for the yield potential of bioethanol of different feedstocks was constructed. According to the current actual situation of bioethanol development, three stages of bioethanol development were defined. This research systematically sorted out the development process of bioethanol and finally obtained the distribution of the bioethanol yield potential at different stages, indicating the systematic and comprehensive consideration of the layout of the bioethanol industry in China from a geography view, which was rarely involved in current studies. On the other hand, comparisons between the yield potential of bioethanol and China’s energy demand at each stage were clarified. Market demand was drawn into the results analysis and discussed by province. Furthermore, regional and time-effective suggestions were put forward. Consequently, this research will have a clear direction and practicality for China to develop bioethanol and solve the energy shortage problem.
The Chinese government has announced that the development of diversified non-grain bioethanol is being encouraged, which should not compete with cultivated land and food. According to the current actual situation of bioethanol development and China’s Liquid Biofuel Development Roadmap [14], and synthetically considering the resource potential, technology level, feedstock use efficiency, and cost, we defined three stages of bioethanol development. In the first stage, by 2020, first-generation bioethanol was mainly developed. Corn ethanol was analyzed as a representative. In the second stage, from 2020 to 2030, 1.5-generation bioethanol will mainly be developed. Sweet sorghum and cassava ethanol were analyzed as representatives. In the third stage, from 2030 to 2050, second-generation bioethanol will mainly be developed. Switchgrass, crop straw, and forest residue ethanol were analyzed as representatives. Our comprehensive evaluation system, integrating statistical methods, crop growth process models, and geographic information system (GIS) techniques, was constructed for analysis (Figure 1).

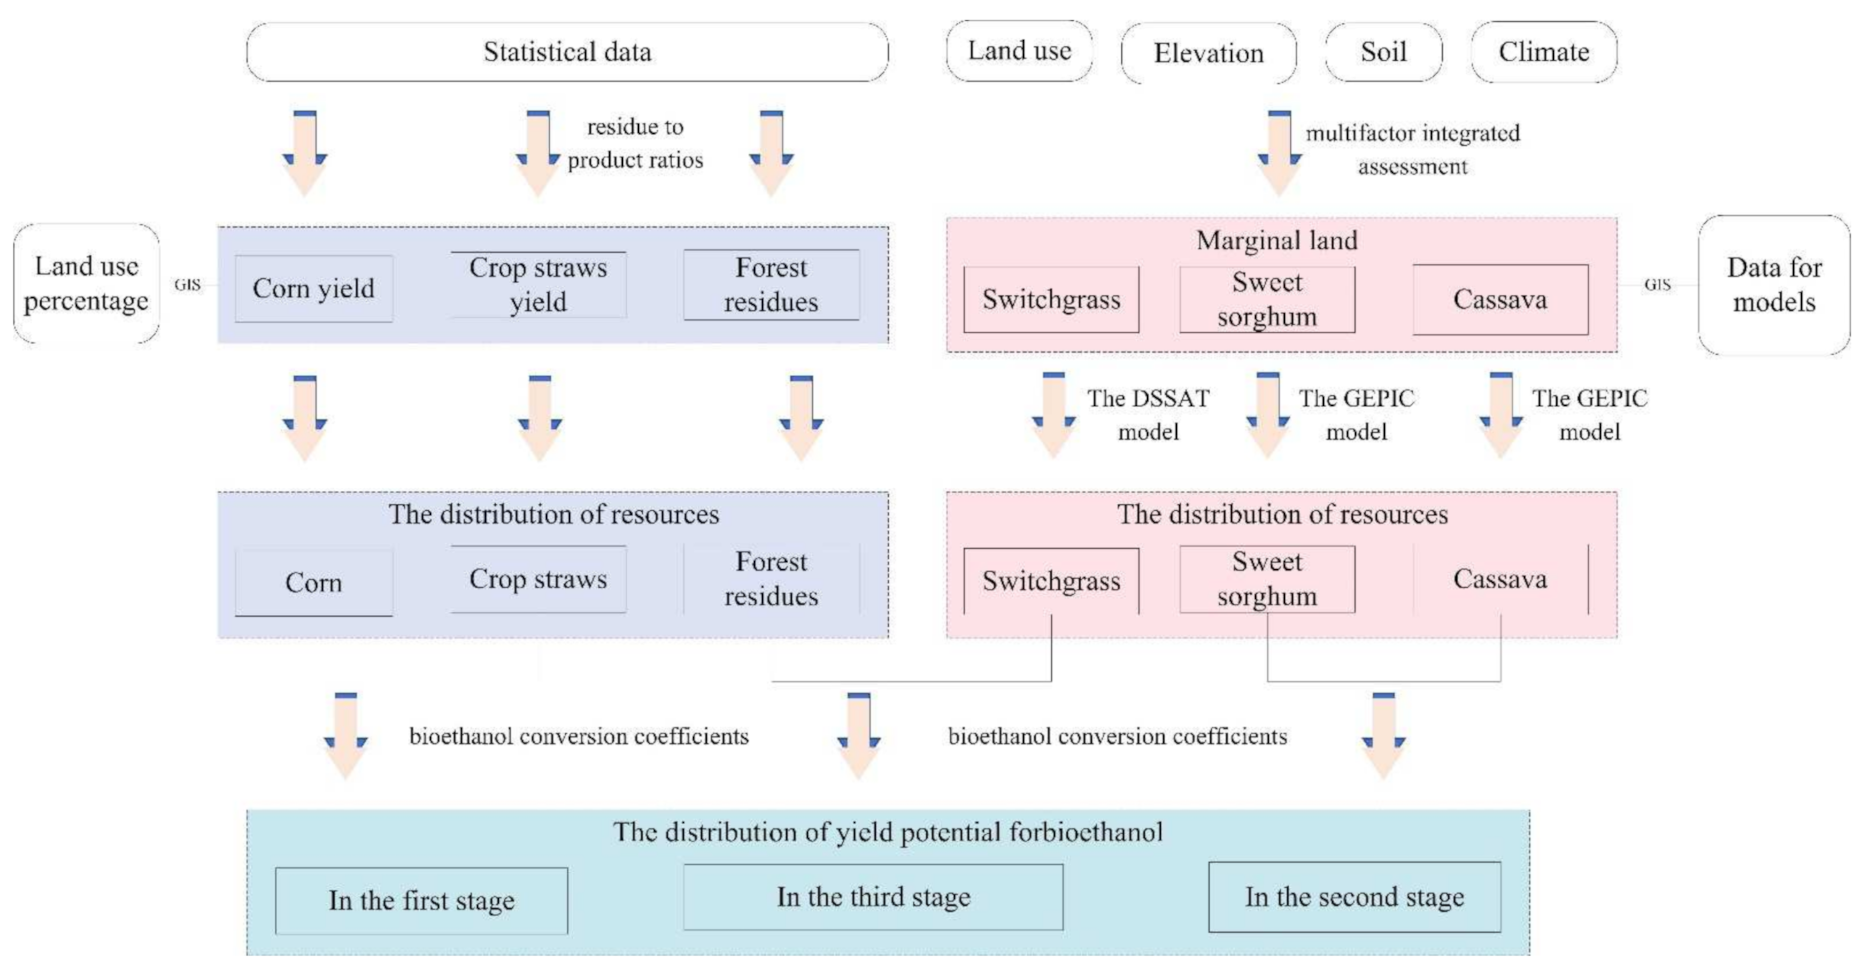
2. Materials and Methods

In general, the bioethanol yield potential is obtained based on evaluation of the feedstock resources, and then according to the conversion coefficient of feedstocks and bioethanol. There are many studies on bioethanol yield estimation at home and abroad at present, and some recognized methods have been formed. Based on the above research, considering the national policies and expert advice, this paper formulated calculation methods for the production of various feedstocks of bioethanol and methods of calculating the bioethanol yield potential based on different feedstocks.

2.1. Evaluation of Feedstock Yields

The spatial distributions of corn, straw, and residue resources were calculated from statistics and spatial data including Chinese administrative boundary data and land use percentage data. As the straw yield was not available from initial statistics, resources were calculated based on crop yields. The specific computation is shown in Appendix A, referring to Liu et al. [15]. For non-grain energy plants, sweet sorghum, cassava, and switchgrass, two crop growth process models, the Decision Support System for Agrotechnology Transfer (DSSAT) model and the GIS-based Environmental Policy Integrated Climate (GEPIC) model, were used to simulate the yields, referring to Yan [16] and Fu [17]. The detailed simulation of yields is also shown in Appendix A.

2.2. Evaluation of Bioethanol Potential

The usable proportion of feedstock resources and the coefficients of converting feedstock into bioethanol are two key factors for determining the bioethanol production potential. Since most feedstocks discussed in this study are still under development, whose usable proportion will change in the future, we paid more attention to feedstock availability. The usable proportions of sweet sorghum, cassava, and switchgrass were assumed to be 100%. The usable proportions of straw and forest residues were temporarily undefined in the calculation considering the forecast difficulty. For ease of comparison, the usable proportion of corn was also undefined. Bioethanol potential was calculated using a bioethanol conversion coefficient (Table 2), which indicated how many tons of feedstock can be converted into 1 ton of bioethanol. An open discussion about undefined usable proportions is provided in the analysis of the results.

2.3. Data

Geographic and statistical data were used in this study. Statistical data consisted of the output of 10 main crops and the total amount of forest residues in each province for some of the distribution of bioethanol feedstock resources calculations. Crop data were obtained from the 2018 China Statistical Yearbook, including rice, wheat, corn, beans, tubers, cotton, oil crops, fiber, sugar cane, and sugar beet. Forest residue data were composed of the amount of tree cutting residue, wood processing residue, bamboo cutting and processing residues, tree tending and thinning residues, and waste wood [22]. Statistical data for forest residues were obtained from the 2013 China Forestry Statistical Yearbook and Zhang et al. [23]. We integrated the statistical data (crop output and amount of forest residues) with land use spatial data to generate the spatial distribution of crop yields and forest residue resources in this study. Geographic data included data for planting land extraction and non-grain energy plant yields estimated by the DSSAT and GEPIC models. Planting land extraction was assessed for the estimation of limiting the simulation scope of non-grain energy plant yields. All geographic data for planting land extraction are presented in Table 3. Data for the DSSAT model included climate, soil profile, and field management data, which were introduced, in detail, in Yan [16]. Data for the GEPIC model included land use, elevation, climate, soil, fertilizer, and management data, which were introduced, in detail, in Fu [17].

3. Results and Analysis

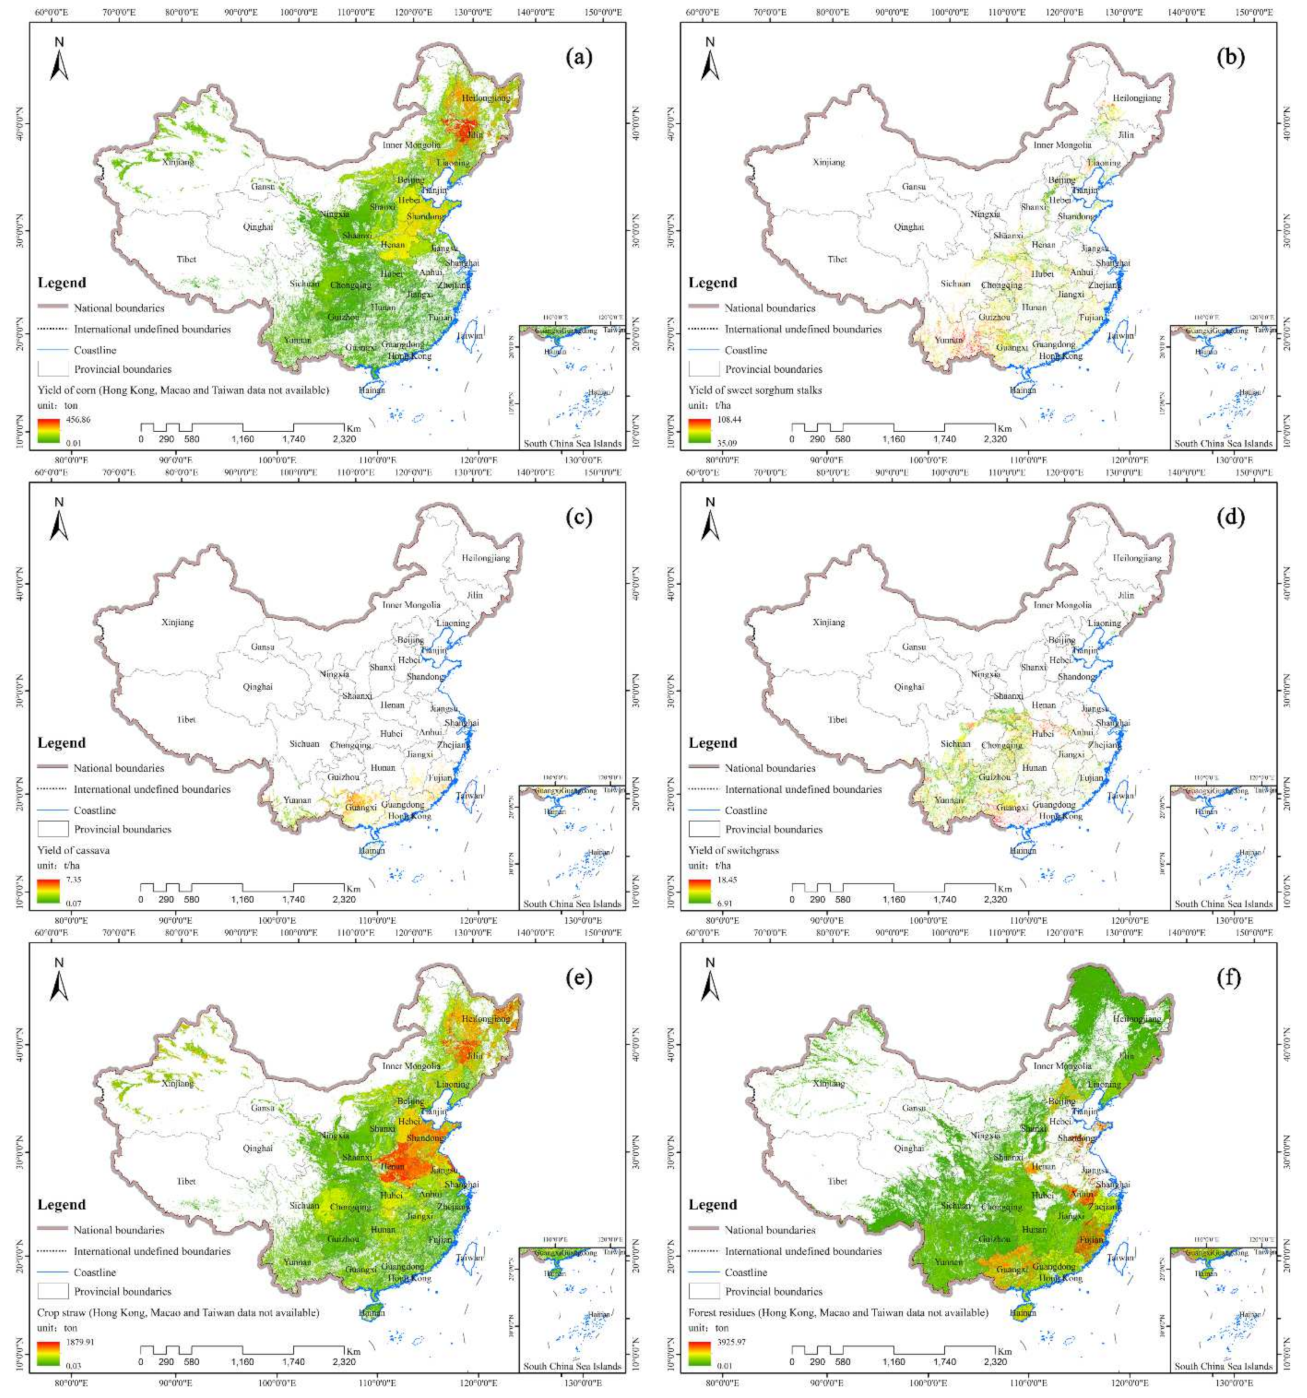
3.1. Distribution of Bioethanol Feedstock Resources

Figure 2 reveals the distribution of bioethanol feedstock resources in China, including the corn yield, the sweet sorghum stalk yield, the cassava biomass, the switchgrass biomass, the crop straw yield, and the forest residue resources. The spatial distributions of the corn yield, the crop straw yield, and the forest residue resources were estimated by the integration of the statistical data (crop outputs and amount of forest residues) and the land use data, while the spatial distributions of the sweet sorghum stalk yield, the cassava biomass, and the switchgrass biomass were simulated by the GEPIC and DSSAT models. As it is illustrated, there are apparent differences in the spatial distributions of the different feedstocks. In terms of quantity, the total resources of corn, sweet sorghum stalks, cassava biomass, switchgrass biomass, crop straws, and forest residues were 257.17, 2083.55, 44.36, 357.56, 1031.62, and 924 million tons, respectively.
In terms of distribution, corn was primarily distributed in spring-sowing areas in Northeast China, summer-sowing areas in the Yellow and Huai River regions, and southwest maize areas. The first two were superior. Sweet sorghum was widely distributed in Northeast, East, South, and Southwest China. High-biomass areas were mostly centralized in Southwest China such as Yunnan, Guangxi, and Guizhou. Cassava showed a limited distribution, mainly in South China. A large planting potential was identified in Guangxi, Yunnan, and Guangdong. The main reasons for the distribution were the relative temperature and precipitation conditions for cassava growth. Switchgrass was mainly distributed in South China. Yunnan, Sichuan, and Guangxi Provinces may be the regions with the best conditions for growth in the future. Crop straw was widely distributed in all agricultural production areas. However, it is a pity that the current use of straw as a feedstock of bioethanol is limited even though it is easy to gain. Resources in the Northeast Plain and Yellow and Huai River Plains were particularly ample.
Forest residues were mostly distributed in Northeast, Southeast, and Southwest China. The resources in the latter two were more abundant. Overall, in some areas of Western China, such as Tibet and Qinghai, the resources of each bioethanol feedstock were negligible.

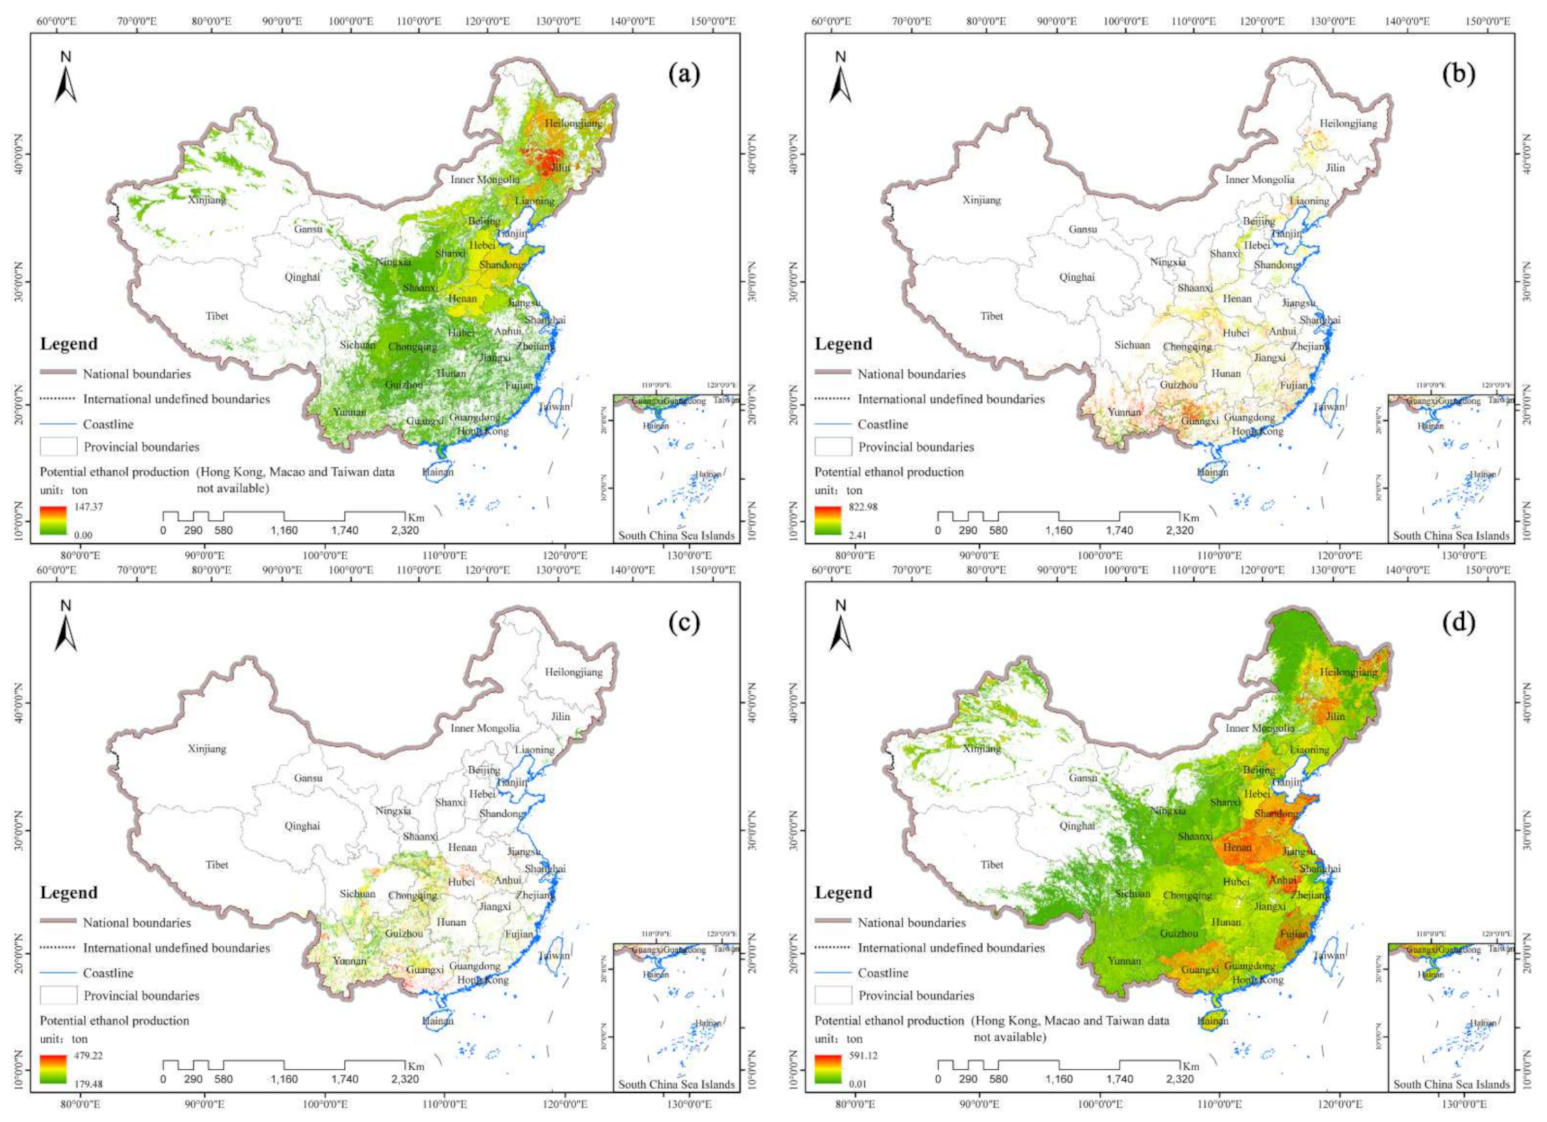
3.2. Distribution of Bioethanol Yield Potential in Three Stages

According to the results of the bioethanol feedstock resources and conversion coefficients in Table 2, the spatial distribution of the bioethanol production potential in China was calculated in chronological order using three stages (Figure 3). The bioethanol potential in the first stage is expressed using the corn bioethanol yield. The bioethanol potential in the second stage is expressed by the total bioethanol yield of sweet sorghum and cassava. With obvious differences in the usable proportions and categories of feedstocks in the third stage, the distributions of the bioethanol production potential based on switchgrass, crop straws, and forest residues were calculated separately. The results show that in terms of total amount, the potential bioethanol production in the first stage, by 2020, was 82.90 million tons. According to the national regulation that the deep processing of corn should not exceed 26% of the total output [24], the actual bioethanol potential was 21.55 million tons, which is even higher than the development target of 10 million tons in 2020. We found that the development scale of corn ethanol was not very large in the past. The bioethanol potential in the first stage was consistent with that of corn resources.
The potential bioethanol production in the second stage, from 2020 to 2030, is estimated at 145.42 million tons. According to the forecast of the China National Petroleum Corporation (CNPC) Economics & Technology Research Institute, gasoline consumption in China will reach a peak of 148 million tons annually in 2025 [25]. As China specifies the use of E10 bioethanol, if bioethanol in the second stage can fully reach its potential, the consumption demand will be easily satisfied. The bioethanol potential in the second stage was widely distributed in Northeast, East, South, and Southwest China. High-production potential areas were mostly centralized in Yunnan, Guangxi, Guizhou, Guangdong, and Fujian.
In the third stage, from 2030 to 2050, the potential bioethanol production based on switchgrass will be 92.99 million tons. Regardless of the usable proportion, the potential bioethanol production from straw and forest residues will be 295.14 million tons. According to the forecast of the CNPC Economics & Technology Research Institute and Innovation Center for Energy and Transportation, annual gasoline consumption in China will be about 88–135 million tons in 2035 [25,26]. With the E10 blending method, if 5% of straws and forest residues are used to produce bioethanol, all demand will be met. Comparing the production potential of the three stages, we found that bioethanol production is showing an increasing trend. The bioethanol industry is showing considerable promise. The bioethanol potential based on switchgrass coincided with that of switchgrass resources, while the bioethanol potential based on straws and forest residues was widely dis-tributed in most parts of China, except some areas of Western China, such as Tibet and Qinghai.

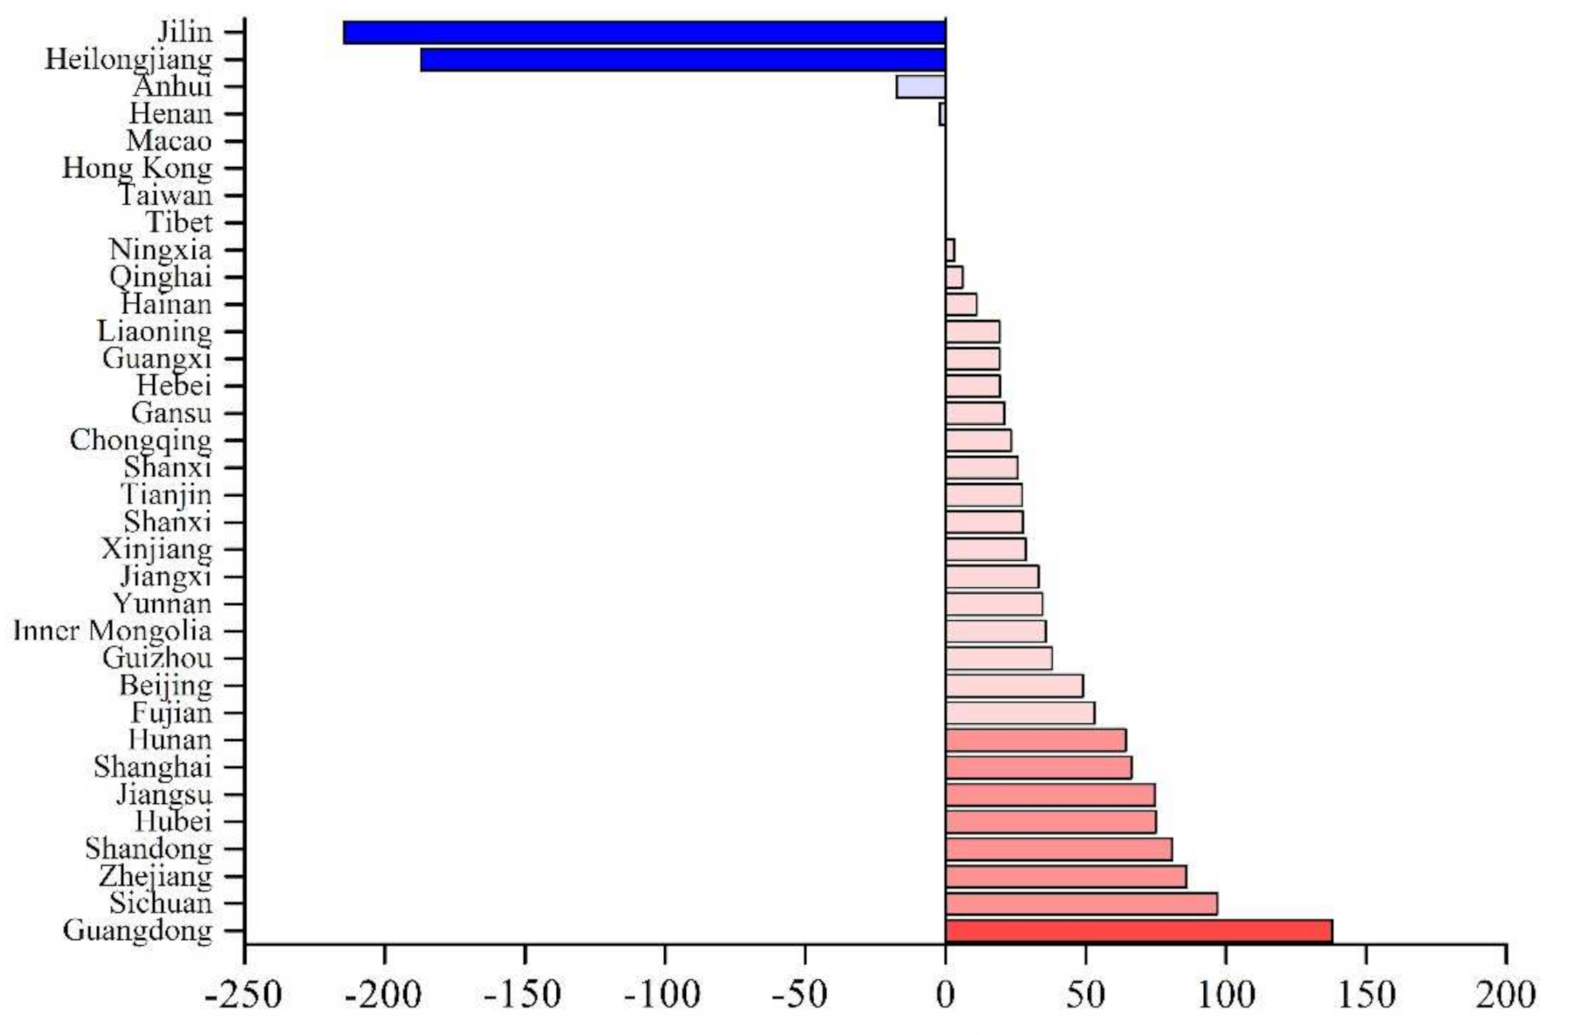
3.3. Comparison of Bioethanol Production Potential and Demand

Based on the results of the bioethanol yield potential for the three stages in Section 3, Figure 4 illustrates the total quantities of potential production in each province gained by provincial statistics. The results are divided into four objects in Figure 4 consistent with the objects in Figure 3. Comparisons with the current market situation, market demand, and promotion policy will be discussed in this section. In the first stage, Heilongjiang, Jilin, Inner Mongolia, and Shandong showed a high bioethanol production potential, with annual production of over 2 million tons. The spatial distribution of the bioethanol production potential roughly matches the current market situation. Gasohol has been used in Tianjin, Heilongjiang, Henan, Jilin, Liaoning, Anhui, Guangxi, Hebei, Shandong, Jiangsu, Inner Mongolia, and Hubei Province. Gasohol has been developed most vigorously in the northeast, with a market share of more than 90%. An array of bioethanol production plants were built in Jilin, Heilongjiang, and Liaoning Provinces [27]. Tianjin also shows positive development, being the first province to achieve the closed promotion production of ethanol gasoline for vehicles. The above-mentioned regions hold a feedstock potential and active policies, which will be given priority in the development of bioethanol industrialization and be expected to drive the bioethanol development of the surrounding areas.
In the second stage, the results suggest that the bioethanol development potential will increase in South China. The bioethanol production potentials in Yunnan, Guangxi, Guizhou, Sichuan, and Hubei are ranked the top five in China, mainly because their abundant marginal land resources and favorable climate conditions make them suitable for the development of non-grain energy plants in South China. Since the 11th Five-Year Plan, China has attached great importance to the development of non-grain bioethanol, and several non-grain (sweet sorghum, cassava, etc.) bioethanol demonstration projects and industrialization devices have been built in Guangxi, Inner Mongolia, Shandong, Henan, and other provinces. This situation aligns with the calculation results. Among the advantageous provinces, Yunnan, Guizhou, and Sichuan have not yet conducted any bioethanol marketing, and thus they are expected to become active development areas in the future.
In the third stage, the results suggest that some provinces are suitable for the development of switchgrass bioethanol due to the restrictions on switchgrass growth. Yunnan and Sichuan show a high bioethanol production potential, where it is recommended to develop and promote switchgrass bioethanol in the future. By contrast, bioethanol from straws and forest residues is widely distributed. The production potentials in Inner Mongolia, Xinjiang, and Heilongjiang ranked among the top three.
Based on the above situation, the relationships between the capacity of bioethanol production and the amount of bioethanol demand (estimated by E10, the mix proportion of gasoline consumption on the basis of market research) by province were further analyzed in this paper, intending to obtain the actual value of bioethanol development by province and the targeted suggestions by analyzing the market gap and the provincial bioethanol production potentials. Figure 5 shows that a market gap existed in most provinces except Jilin, Heilongjiang, Anhui, and Henan, where bioethanol was overproduced. Relying on the developed railway transportation in the northeast, east, and southeast, this gap can be partly narrowed through interregional flows. Since the bioethanol development potential will increase in South China in the second stage, the bioethanol gap in these provinces might be closed. Due to the natural conditions and the economic situation at present, the demand and production potential of bioethanol in the western regions are both relatively low.

4. Discussion

4.1. Prospects for International Development

Figure 6 proactively points out the major countries with a positive attitude towards the development of bioethanol, in order to justify possible international cooperation in the future. With globalization, international cooperation in bioethanol has hastened the agenda. Next, we should pay more attention to areas with an exact policy and areas where bioethanol is planned to be promoted, such as “the Silk Road Economic Belt and the 21st Century Maritime Silk Road” (“the Belt and Road”), and then proposals of bioethanol cooperation countries can be advanced. Furthermore, some countries have implemented explicit plans for significant future development of bioethanol such as the United States, Brazil, and Canada. Cooperation with neighboring countries such as Russia and some Southeast Asian countries in 2020 to 2030, and with countries along the Belt and Road, as well as other countries under vigorous development such as the United States, Brazil, and Canada, in 2030 to 2050 may be considered.

4.2. Comparison with Other Studies

The feedstock resources and bioethanol production potential values were discussed and compared with those reported in other studies. As per our findings, the total amount of crop straw resources is 1031.62 million tons. Wang et al. concluded that the total output of crop straw in China is 981 million tons [28]. Liu et al. calculated that the reserve potential of straw is 358 million tons [15]. Yu et al. estimated that the straw resources total 810 million tons [29]. The same calculation method and data source provided by statistical yearbooks were used in different studies. The variations in the results were probably caused by the time of data capture and the residue-to-product ratio (RPR) chosen.
As for the research on the three non-grain energy plants, Jiang et al. presented a GEPIC model to simulate sweet sorghum yields in China, whose result was 13.57 million tons [9]. Yan et al. concluded that the per unit sweet sorghum biomass varied from 0.68 to 24.54 t/ha in different regions in China using the DSSAT model [30]. Dai et al. evaluated the potential output of cassava ethanol as 2525.25 million liters in Guangxi based on the statistical marginal land and cassava production data [31]. Jiang et al. chose the GEPIC model to estimate the potential bioenergy of cassava on marginal land, and the result for rainfed and irrigated conditions was 1909.59 and 2054.02 billion MJ, respectively [32]. Tian et al. developed the DRAINMOD-GRASS model to predict the 5-year mean annual biomass yield from 2009 to 2013 in three replicated switchgrass plots located in eastern North Carolina, USA. The result was 4.8 t/ha [12]. Fu et al. conducted field experiments with switchgrass in Northern China, and the biomass yield of switchgrass averaged 11.5 t/ha [33]. The differences in the ethanol potential mainly resulted from marginal land extraction and the plant yield data source, whereas the plant yield can be derived by field experiments, statistical data collection, and model simulation. In addition, our calculated yield of sweet sorghum is obviously different from that of other studies because we included the sweet sorghum stalk yield, whereas other studies usually estimated biomass.
The forest residue resources calculated in this study totaled 924 million tons. Duan et al. measured forest residue resources in China at 454 million tons [34]. Liu et al. calculated that the potential forest residue resources total 1242 million tons [15]. Nie et al. estimated that the available value of forest residues for use is 310 million tons [22]. The diversity in the results is mainly caused by the data, calculation method, and the scope definition of resources. Some studies evaluated the reserves, whereas others evaluated usage. The choice of coefficient was also different.

4.3. Research Uncertainties and Limitations

Three aspects can be considered as uncertainties in this study. The first uncertainty is the land extraction of each feedstock’s growth, which was obtained from different datasets and the criteria of marginal land. The second uncertainty is the model simulation of non-grain energy plant yields. Each model was calibrated using field experimental data of only one species in this study, but multiple varieties are planted in different regions in reality. One species cannot adapt to the environment of every type of marginal land. The growth environment and process of different varieties differ. The third uncertainty is the usable proportions and coefficients of converting from feedstock to bioethanol.
In addition, the development conditions of bioethanol in the three stages analyzed in this study are based on the calculation results of the existing feedstock resources. If more detailed development plans in different periods are required, the forecasting simulation of bioethanol production and quantitative economic assessment can be considered to more accurately fit the real situation of bioethanol development in future research.

5. Conclusions

In this study, the bioethanol feedstock resources and bioethanol potential in different stages were considered and analyzed through a comprehensive evaluation system integrating statistical methods, crop growth process models, and geographic information system (GIS) techniques. The following results were obtained: (1) The total resources of corn, sweet sorghum, cassava, switchgrass, crop straw, and forest residues are 257.17, 2083.55, 44.36, 357.56, 1031.62, and 924 million tons, respectively. (2) According to the national regulation that the deep processing of corn should not exceed 26% of the total corn output, the bioethanol potential in the first stage was calculated as 21.55 million tons. Assuming the usable proportions of sweet sorghum, cassava, and switchgrass are 100%, the bioethanol potential in the second stage is estimated to be 145.42 million tons, and the bioethanol potential based on switchgrass in the third stage is estimated to be 92.99 million tons. Assuming the usable proportion of straw and forest residues is 5%, the bioethanol potential based on these feedstocks in the third stage will be 14.76 million tons. (3) In chronological order of the three stages, Northeast, East, and South China have prominent development potentials for bioethanol. Interregional bioethanol flows will help fill the demand gap. Additionally, international cooperation can be strengthened with countries that have implemented explicit plans for bioethanol development.
Despite some limitations, the spatial distributions of feedstock resources and the bioethanol yield potential are logical and can provide some support for the national and regional bioethanol development plans in the medium and long terms.

Author Contributions

J.F. and G.L. contributed to all aspects of this work; D.J. conducted data analysis, and J.D. wrote the main manuscript text. All authors have read and agreed to the published version of the manuscript.

Funding

This work was supported by grants from the National Natural Science Foundation of China (Grant No. 41971250), Youth Innovation Promotion Association (Grant No. 2018068), and Institute of Geographical Sciences and Natural Resources Research, Chinese Academy of Sciences (Grant No. E0V00112YZ).

Data Availability Statement

Not applicable.

Acknowledgments

We greatly thank the “MDPI English editing service” for the editing assistance in the paper.

Conflicts of Interest

The authors declare no conflict of interest.

Appendix A

1.
Evaluation of Straw Yields
The corn yield can be obtained directly from the statistical yearbook. As straw yields are not available from initial statistics, resources are usually calculated based on crop yields. The formula is as follows:
M = i = 1 n P i × α i × λ i
where M is the available amount of crop straw; i is the different crop categories; n is the number of crop species; Pi is the economic yield of the crop; αi is the residue-to-product ratio (RPR); λi is the proportion of the available amount of crop straw in the total amount. With technology advancement and ideal transformation, almost 100% of straw resources will be available [15]; thus, the value of all λi can be regarded as 1. The parameter αi is exhibited in Table A1. The spatial distribution of corn and straw resources is calculated from the corn and straw yields, Chinese administrative boundary data, and land use percentage data.
Table A1. Residue-to-product ratios (RPRs) of crops [32].
RPR RPRs
grainrice1.0cotton3.0
wheat1.1oil crops2.0
corn2.0fiber1.7
beans 1.7sugar cane0.1
tubers 1.0sugar beet0.1
2.
Evaluation of Non-Grain Energy Plant Yields
The DSSAT model was used to estimate the sweet sorghum yield. First, the DSSAT model was calibrated for biomass simulation by the field experimental data. Then, daily climate data and soil profile data were input into the DSSAT-CERES-Sorghum model. The key growth parameters of sweet sorghum were localized in the model. Localized data were derived from Yan [16]. Then, the DSSAT model was set up to link with geospatial datasets for geospatial simulation. According to the existing literature [35,36,37], the yield of sweet sorghum stems is generally not less than 35 t/ha; thus, the part of the simulation results that is less than 35 t/ha should be removed. The GEPIC model was used to estimate cassava and switchgrass yields. Land use data, elevation data, slope data, soil data, climate data, and field management data were input into the model. The key growth parameters of cassava and switchgrass were from Fu [17]. For the GEPIC model, it was coupled with GIS technology, and spatial distributions of yields were simulated directly.
Considering the national demand, marginal land was used as a limiting condition to control the simulation scope. In this study, the criteria systems of marginal land suitable for sweet sorghum, cassava, and switchgrass development were established through the literature, expert advice, and relevant national policies (Table A2). According to the definition of marginal land by the Ministry of Agriculture (MoA) of China, marginal land refers to winter-fallowed paddy land and wasteland. In this study, wasteland is under consideration, and shrub land, sparse forest land, grassland, shoal/bottomland, and unused land are included [38]. Due to the policy of returning farmland to grassland and the consideration of not competing with animal husbandry, some grassland was excluded. The marginal lands suitable for sweet sorghum, cassava, and switchgrass growth were extracted using a multifactor integrated assessment method [39].
Table A2. The criteria systems of marginal land for sweet sorghum, cassava, and switchgrass.
FactorsSpecific ParametersSweet Sorghum [17,40,41]Cassava [41,42]Switchgrass [17,43]
Threshold
Land useland use typeshrub land, sparse forest land, grassland, shoal/bottomland, alkaline land, and bare land
nature reserveexcluding nature reserve
grasslandexcluding middle and high coverage grassland in Qinghai, Xinjiang, Inner Mongolia, Tibet, and Ningxia Province
Terrainslope/°<25<25<25
elevation/m-<2000-
Soilorganic matter content/%>1.5>1.5>1.5
PH (H2O)5.0–8.5-4.9–7.6
effective depth/cm≥30≥30-
sand content/%≤85≤85-
salinity/%<0.6--
Temperatureannual average temperature/°C-≥18-
≥10 °C accumulated temperature/°C≥1500≥2000-
minimum temperature in April–June>15--
Moistureannual precipitation/mm≥300600–6000≥800
Minimum continuous growth areaarea/hm2≥200≥200≥200

References

  1. Sarkar, N.; Ghosh, S.K.; Bannerjee, S.; Aikat, K. Bioethanol production from agricultural wastes: An overview. Renew. Energy 2012, 37, 19–27. [Google Scholar] [CrossRef]
  2. REN21. Renewable 2009 Global Status Report; REN21 Secretariat: Paris, France; Worldwatch Institute: Washington, DC, USA, 2009. [Google Scholar]
  3. REN21. Renewable 2019 Global Status Report; REN21 Secretariat: Paris, France; Worldwatch Institute: Washington, DC, USA, 2019. [Google Scholar]
  4. Balat, M.; Balat, H. Recent trends in global production and utilization of bio-ethanol fuel. Appl. Energy 2009, 86, 2273–2282. [Google Scholar] [CrossRef]
  5. Kim, S.; Dale, B.E. Global potential bioethanol production from wasted crops and crop residues. Biomass Bioenerg 2004, 26, 361–375. [Google Scholar] [CrossRef]
  6. Wu, C.; Zhou, Z.; Yin, X.; Yi, W. Current Status of Biomass Energy Development in China. Trans. Chin. Soc. Agric. Mach. 2009, 40, 97–105. [Google Scholar]
  7. Galbe, M.; Zacchi, G. Pretreatment of Lignocellulosic Materials for Efficient Bioethanol Production. Adv. Biochem. Eng. Biotechnol. 2007, 108, 41–65. [Google Scholar]
  8. Limayem, A.; Ricke, S.C. Lignocellulosic biomass for bioethanol production: Current perspectives, potential issues and future prospects. Prog. Energy Combust. Sci. 2012, 38, 449–467. [Google Scholar] [CrossRef]
  9. Jiang, D.; Hao, M.; Fu, J.; Liu, K.; Yan, X. Potential bioethanol production from sweet sorghum on marginal land in China. J. Clean. Prod. 2019, 220, 225–234. [Google Scholar] [CrossRef]
  10. Huang, J.; Khan, M.T.; Perecin, D.; Coelho, S.T.; Zhang, M. Sugarcane for bioethanol production: Potential of bagasse in Chinese perspec-tive. Renew. Sustain. Energy Rev. 2020, 133, 110296. [Google Scholar] [CrossRef]
  11. Wang, C.; Malik, A.; Wang, Y.; Chang, Y.; Pang, M.; Zhou, D. Understanding the resource-use and environmental impacts of bioethanol production in China based on a MRIO-based hybrid LCA model. Energy 2020, 203, 117877. [Google Scholar] [CrossRef]
  12. Tian, S.; Youssef, M.A.; Chescheir, G.M.; Skaggs, R.W.; Cacho, J.; Nettles, J. Development and preliminary evaluation of an integrated field scale model for perennial bioenergy grass ecosystems in lowland areas. Environ. Model. Softw. 2016, 84, 226–239. [Google Scholar] [CrossRef] [Green Version]
  13. Fang, Y.R.; Wu, Y.; Xie, G.H. Crop residue utilizations and potential for bio-ethanol production in China. Renew. Sustain. Energy Rev. 2019, 113, 109288. [Google Scholar] [CrossRef]
  14. China National Renewable Energy Centre. China Liquid Biofuel Development Roadmap; China National Renewable Energy Centre: Beijing, China, 2018. [Google Scholar]
  15. Liu, G.; Shen, L. Quantitive Appraisal of Biomass Energy and Its Geographical Distribution in China. J. Nat. Resour. 2007, 22, 9–19. [Google Scholar]
  16. Yan, X. Assessing the Sweet Sorghum-Based Ethanol Energy Potential with DSSAT Model and Life Cycle Assessment Approaches; University of Chinese Academy of Sciences: Beijing, China, 2018. [Google Scholar]
  17. Fu, J. Assessment of the Non-Grain Based Fuel Ethanol Potential in China; University of Chinese Academy of Sciences: Beijing, China, 2015. [Google Scholar]
  18. Feng, W. Research on Life Circle Energy Balance and Carbon Emission of Whole-Plant Corn Fuel Ethanol; Zhengzhou University: Zhengzhou, China, 2013. [Google Scholar]
  19. Tian, Y.; Li, S.; Zhao, L.; Meng, H.; Huo, L. Life Cycle Assessment on Fuel Ethanol Producing from Sweet Sorghum Stalks. Trans. Chin. Soc. Agric. Mach. 2011, 42, 132–137. [Google Scholar]
  20. Xia, X.; Zhang, J.; Xi, B. Fuel Ethanol Analysis and Policy Research Based on the Life Cycle; China Environmental Science Press: Beijing, China, 2012. [Google Scholar]
  21. Li, Z.; Li, D.; Huang, G.; Wei, H. Insights on current development of fuel ethanol. Chem. Ind. Eng. Prog. 2013, 32, 1457–1467. [Google Scholar]
  22. Nie, Y.; Chang, S.; Cai, W.; Wang, C.; Fu, J.; Hui, J.; Yu, L.; Zhu, W.; Huang, G.; Kumar, A.; et al. Spatial distribution of usable biomass feedstock and technical bioenergy potential in China. Glob. Chang. Biol. Bioenergy 2020, 12, 54–70. [Google Scholar] [CrossRef]
  23. Zhang, W.; Zhang, L.; Zhang, C.; Yu, D. Assessment of the Potential of Forest Biomass Energy in China. J. Beijing For. Univ. (Soc. Sci.) 2015, 14, 52–55. [Google Scholar]
  24. Zhang, Z. Current Situation and Development Trend of Domestic Bioethanol Processing Industry. China Grain Econ. 2011, 11, 17–20. [Google Scholar]
  25. ETRI. China Energy Outlook 2050; ETRI: Beijing, China, 2017. [Google Scholar]
  26. An, F.; Kang, L.; Qin, L.; Mao, S.; Wang, W.; Dror, M.B. Study on the phasing-out timetable of China’s traditional ICE-vehicles. Int. Pet. Econ. 2019, 27, 1–8. [Google Scholar]
  27. Lou, Y. The supply and demand market for ethanol gasoline and fuel ethanol in China. Int. Pet. Econ. 2019, 27, 68–74. [Google Scholar]
  28. Wang, H.; Tu, Y.; Zhang, N.; Si, B.; Ma, T.; Rula, S.; Na, Y.; Diao, Q. Chinese crop straw resource and its utilization status. Sci. Technol. Rev. 2017, 35, 81–88. [Google Scholar]
  29. Yu, J.; Shi, K.; Wang, S.; Xu, Z.; Zhai, R.; Wen, Z.; Jin, M. Analysis of crop straw distribution in China and research progress on converting crop straw into fuel ethanol. Biotechnol. Bus. 2018, 4, 33–40. [Google Scholar]
  30. Yan, X.; Jiang, D.; Fu, J.; Hao, M. Assessment of Sweet Sorghum-Based Ethanol Potential in China within the Water-Energy-Food Nexus Framework. Sustainability 2018, 10, 1046. [Google Scholar] [CrossRef] [Green Version]
  31. Dai, D.; Hu, Z.; Pu, G.; Li, H.; Wang, C. Energy efficiency and potentials of cassava fuel ethanol in Guangxi region of China. Energy Convers. Manag. 2006, 47, 1686–1699. [Google Scholar] [CrossRef]
  32. Jiang, D.; Hao, M.; Fu, J.; Huang, Y.; Liu, K. Evaluating the bioenergy potential of cassava on marginal land using a biogeochemical process model in GuangXi, China. J. Appl. Remote Sens. 2015, 9, 097699. [Google Scholar] [CrossRef]
  33. Fu, H.M.; Meng, F.Y.; Molatudi, R.L.; Zhang, B.G. Sorghum and Switchgrass as Biofuel Feedstocks on Marginal Lands in Northern China. Bioenergy Res. 2016, 9, 633–642. [Google Scholar] [CrossRef]
  34. Duan, X.; Zhou, Z.; Xu, J.; Tian, Y.; Wang, R. Utilization Situation and Suggestion of Forestry Residues Resources in China. China Wood-Based Panels 2017, 24, 1–5. [Google Scholar]
  35. Wu, C.W.; Chen, X.B.; Sun, Y.P.; Jiang, M.L.; Yan, K.; Zhang, L.H. Marginal Land-Based Biomass Energy Production in Yellow River Delta. Adv. Mater. Res. 2014, 860–863, 544–549. [Google Scholar] [CrossRef]
  36. Li, X.F.; Hou, S.L.; Su, M.; Yang, M.F.; Shen, S.H.; Jiang, G.M.; Qi, D.M.; Chen, S.Y.; Liu, G.S. Major Energy Plants and Their Potential for Bioenergy Development in China. Environ. Manag. 2010, 46, 579–589. [Google Scholar] [CrossRef]
  37. Lu, Q.; Zhao, X.B.; Zheng, Z.M. Technology and Engineering for Liquid Biofuels; Shanghai Scientific & Technical Publishers: Shanghai, China, 2003. [Google Scholar]
  38. Fu, J.; Jiang, D.; Huang, Y.; Zhuang, D.; Ji, W. Evaluating the Marginal Land Resources Suitable for Developing Bioenergy in Asia. Adv. Meteorol. 2014, 2014, 238945. [Google Scholar] [CrossRef] [Green Version]
  39. Jiang, D.; Hao, M.; Fu, J.; Zhuang, D.; Huang, Y. Spatial-temporal variation of marginal land suitable for energy plants from 1990 to 2010 in China. Sci. Rep. 2014, 4, 5816. [Google Scholar] [CrossRef] [Green Version]
  40. Wang, H.; Chen, G.; Zhang, H.; Liu, B.; Yang, Y.; Qin, L.; Chen, E.; Guan, Y. Identification of QTLs for salt tolerance at germination and seedling stage of Sorghum bicolor L. Moench. Euphytica 2014, 196, 117–127. [Google Scholar] [CrossRef]
  41. Liu, Q.; Sun, C.; Zhang, B.; Xie, G. Methodology and certification criteria of non-food land suitable for energy plant production in China. J. China Agric. Univ. 2015, 20, 11–20. [Google Scholar]
  42. Hao, M. Evaluation of Energy Saving Potential and GHG Reduction Potential of Bio-Fuel Ethanol Fromcassava at Large Scale; University of Chinese Academy of Sciences: Beijing, China, 2015. [Google Scholar]
  43. Xie, G.; Zhuang, H.; Wei, W.; Zhuo, Y.; Guo, X. Non-Grain Energy Plants: Production Principle and Cultivation in Marginal Land; China Agricultural University Press: Beijing, China, 2011. [Google Scholar]
Figure 1. Technology roadmap of this study.
Energies 14 04554 g001
Figure 2. The distribution of bioethanol feedstock resources in China: (a) corn yield; (b) sweet sorghum stalk yield; (c) cassava biomass; (d) switchgrass biomass; (e) crop straw yield; (f) forest residue resources.
Energies 14 04554 g002
Figure 3. The distribution of bioethanol yield potential in three stages in China: (a) first stage; (b) second stage; yield potential based on (c) switchgrass in the third stage; and (d) crop straws and forest residues in the third stage.
Energies 14 04554 g003
Figure 4. The distribution of provincial bioethanol yield potential in three stages in China: (a) first stage; (b) second stage; provincial yield potential based on (c) switchgrass in the third stage; and (d) crop straws and forest residues in the third stage.
Energies 14 04554 g004
Figure 5. Provincial market gap in China. Note: The blue color means that the value of the market gap is negative, that is, bioethanol is overproduced. The red color means that the value of the market gap is positive, that is, bioethanol production cannot meet the market demand.
Energies 14 04554 g005
Figure 6. Global development status of bioethanol.
Energies 14 04554 g006
Table 1. Global bioethanol production in 2018 (billion liters) [3].
USABrazilChinaCanadaThailandIndiaArgentinaEU-28Others
Ethanol60.933.04.11.91.51.41.24.43.5
Share of total (%)54.4229.493.661.701.341.251.073.933.13
Table 2. Bioethanol conversion coefficients.
CornSweet SorghumCassavaSwitchgrassCrop StrawForest Residue
conversion coefficient3.1 [18]16 [19]2.9 [20]3.85 [17]6 [21]7.5 [21]
Table 3. Geographic data for planting land extraction.
FactorsSpecific ParameterResolutionData Source
Land useland use type1 kmRESDC 1
land use percentage data1 kmRESDC
DEM 2 1 kmSRTM 3. V4
SoilPH (H2O), organic matter content, effective depth, sand content, and salinity1 kmRESDC, CARD 4
Temperatureannual average temperature, monthly minimum temperature, and ≥10 °C accumulated temperature1 kmRESDC, CMA 5
Moistureannual precipitation1 kmRESDC
1 RESDC—Data Center for Resources and Environmental Sciences; 2 DEM—digital elevation model; 3 SRTM—Shuttle Radar Topography Mission; 4 CARD—Cold and Arid Regions Science Data Center; 5 CMA—China Meteorological Administration.
Publisher’s Note: MDPI stays neutral with regard to jurisdictional claims in published maps and institutional affiliations.

