1. Introduction
Sustainable development and green growth are ideas for which there has been a renewed increase in interest among politicians, scientists, and the public in recent years. The growing interest in these concepts seems to be directly proportional to the increasingly frequent and more dramatic scientific reports on the progressive degradation and increasing human pressure on the environment. However, treating these concepts as a kind of a “remedy” for the current and future problems of the world is more and more often described as unjustified. Merely investing in increasingly efficient technologies supported by motivating the business sphere so that national economies can grow further and at the same time reduce their unsustainable environmental impact seems insufficient, according to recent studies. It is worth mentioning here, for example, a project of a team led by Monika Dittrich [
1], which published its first findings in 2012. It showed that with the economic growth rate of about 2–3% per year, the consumption of, e.g., fish, livestock, the use of forests, metals, and fossil fuels would increase from 70 billion tonnes per year in 2012 to 180 billion tons in 2050.
In contrast, the value that would allow a balance between economic growth and the use of the environment was set at around 50 billion tonnes. As indicated in the report, the value was already exceeded by a civilization in 2000. The Dittrich team also looked at what would happen if each country immediately implemented best practices for the efficient use of natural resources. Consumption would then improve, but it would still be as much as 43 billion tons above the accepted equilibrium level.
Does this mean that we should abandon attempts to implement the assumptions of the concepts for which the overarching goal is to search for the possibility of permanent decoupling of the GDP from the total consumption of the Earth’s natural resources? The answer is obvious—no, we should still search for opportunities to implement the assumptions of these concepts effectively. Unfortunately, however, we cannot predict both further obstacles to their implementation and the possibility of evolution of today’s technological solutions. Especially that some of these solutions already encounter problems that were difficult to predict earlier.
For example, it is worth mentioning that Norway achieved a record level of electric car sales last year. In 2020, as much as 54% of the cars delivered to this market did not have a combustion engine in any form. However, due to the high repair cost and subsidies, which lower the price of electric cars, otherwise twice as expensive as combustion models, their repair is not profitable. As a result, the number of scrap electric cars is growing exponentially, and at least one in three of them could be repaired. In addition, although the material from scrapped cars is, according to the manufacturers’ information, 98% recoverable, only a small percentage of repairs in Norway are made with the use of used car parts [
2].
These reports are contradicted by official statistics used to monitor progress in implementing the concept of sustainable development, which show that Scandinavian countries are, in fact, the only countries in Europe that have managed to separate economic growth from negative environmental pressures permanently. What does this mean? Only that the adopted indicators are too general or too unified. Striving to develop similar evaluation standards for all countries, e.g., for the European Union, one forgets about the differences between those countries, which are significant despite relatively similar development conditions.
Hence, there is a need for more detailed analyses and new tools to support the monitoring of progress in implementing the sustainable development strategy, such as green growth. It should be emphasized that this level of detail should not be limited only to creating increasingly advanced indicators. The relationships between individual areas of these concepts are also meaningful, as they will allow for a better understanding of each of them.
The symptoms of similar thinking are visible both in the current and previous concepts of measuring progress in implementing the Sustainable Development Strategy. The strategy, in force until 2018, assumed, for example, various levels of its implementation: from the level of explanatory indicators, through operational indicators, to headline indicators. The main problem of this hierarchical method of presenting indicators was the lack of connections between the successive levels of the pyramid (until 2018, the sustainable development indicators were hierarchical and presented in the form of a pyramid). As it was shown in [
3], achieving the level of indicators close to the assumed values at the lower levels of the pyramid did not translate into equally high positions at higher levels. On the other hand, in the current strategy aiming to achieve as many as 17 different goals, it was decided to immediately identify the goals and appropriate indicators that should be related to each other. Moreover, in this case, some of these assumed relationships are not observed in reality, which was confirmed, among others, by the results of the research presented in [
4,
5], examining in detail the relationship between the various goals of the strategy.
These observations prompted the authors to begin research analyzing the strength and directions of the relationship between the indicators used to measure the latest Sustainable Development Strategy, the 2030 Agenda, and the indicators used to measure the concept of green growth, which is referred to in the literature [
6,
7] as a tool for sustainable development.
Therefore, the study aims to present a proposal for measuring the relationship between the concepts of sustainable development and green growth. The considerations presented in the paper focus primarily on the relationships between Goal 7 of the 2030 Agenda (SDG 7), i.e., to ensure access to affordable, reliable, sustainable, and modern energy for all and one of the areas considered in the Green Growth Strategy (GGS), i.e., environmental production efficiency. Both of these areas illustrate the relationship between the natural environment and the economy, emphasizing the transformations taking place in energy use. Selected taxonomic methods were used to study the relationships between these areas: TOPSIS [
8] and multicriteria taxonomy [
9].
The paper, therefore, formulates the following research questions:
How are the relationships between sustainable development and green economy shaped in terms of the areas selected for the study related to sustainable energy use (Goal 7 of the 2030 Agenda and one of the areas of Green Growth Strategy)?
Does the high level of development in the area of green growth selected for the study impact the achievement of Goal 7 of the 2030 Agenda?
The added value of the study is the research approach used by the authors, in which the values of synthetic measures obtained for both analyzed areas became the basis for grouping the EU countries characterized by similarity and dissimilarity of development. This approach was used for the first time in this study. As a rule, studies of this kind are limited to building rankings of objects in terms of the adopted indicators. The literature on the subject lacks analyses showing the relationship between sustainable development and green growth, which is assumed to be a tool for implementing the sustainable development policy. The research approach used in the paper allows for assessing these relationships from various perspectives, including the similarity and dissimilarity of development. The authors of the article identified a research gap in the literature in this area. There are no studies that show not only the level of development in these two areas but also the way they are related to each other. This approach is demonstrated in this paper.
The layout of this article includes an introduction (
Section 1), which presents the main purpose of the work and explains the most important motivations of the authors for researching the relationship between the natural environment and the economy, with particular emphasis on transformations taking place in the field of energy use. Later in the paper, research on the green economy as a sustainable development tool is reviewed (
Section 2). Then, the statistical data used in the study are presented, and the research procedure used in the study is described (
Section 3). The article ends with presenting the research results (
Section 4), discussion, and conclusions resulting from the research (
Section 5).
2. Green Growth as a Tool for Sustainable Development-Research Overview
It is assumed that the discussion on the concept of development, taking into account economic and social, and environmental aspects, began in earnest in the 1970s and 1980s [
10], although already in the 1960s, the first publications appeared in the literature [
11], drawing attention to the negative effects of modern large-scale technologies on the natural environment. Initially, it was rather a political idea aimed mainly at improving the functioning of the economy in terms of its balance with the natural environment, only in subsequent years taking into account also social goals [
12]. Since then, this concept has undergone a significant evolution, which was initially aimed at finding the concept’s proper definition. As B. Caroll (2002) demonstrated in her work, who analyzed as many as 500 different definitions of sustainable development, most of these proposals did not contribute much to the most frequently cited definition of the Gro Bruntland report [
13]. According to this definition, sustainable development is: “development that meets current needs without depriving future generations of the ability to meet their own needs”.
Nowadays, more and more often, certain elements (distinctions) are indicated, which are important for a proper understanding of this concept [
14]. These are primarily such terms as:
Development [
15,
16,
17,
18]—this is usually one of the first terms referred to in constructed definitions;
Integration [
19,
20,
21]—also understood as an integration process and balancing most often related to three main orders: social, economic, and environmental ones,
the quality of life [
22,
23,
24]—indicated as the overarching goal of sustainable development.
Each of these terms allows for a better understanding of the concept of sustainable development. Their bottom line is to understand this concept as a constantly evaluating process, which means that there is a need for a dynamic approach to this issue. Integration is also essential, understood as a kind of relationality, which means that the three main components of sustainable development form different relationships with each other. In addition, these relationships are formed between them and the environment. Hence the numerous attempts to integrate sustainable development into other areas [
25,
26,
27,
28,
29,
30,
31]. As a result, there is a growing number of new research areas such as sustainable competitiveness, sustainable agriculture, and sustainable energy. Each of these areas can be treated separately or as a development of particular dimensions of the SD—e.g., sustainable competitiveness or sustainable energy as a development of the economic dimension. The sustainability of the balance between these dimensions, which is now identified as the most important sustainable development goal, is also worth mentioning.
There was also a need to develop concepts that will result in a more accurate picture of what is happening in the economic dimension, which is in a strong relationship with the other dimensions; social and natural. Previous studies by the authors [
32,
33] show that along with economic development, there is a similar rate of social development, which applies in principle to all European Union countries. On the other hand, in the case of relations between economic and natural measurements, two types of relationships can be distinguished: a positive relationship that means that economic growth also entails an improvement in the environmental dimension and the opposite situation when economic growth comes at the expense of the environment. Therefore, more advanced analyses are needed to show what model or models of development we are currently dealing with in the European Union see: [
34,
35].
The response to such needs is the so-called concepts supporting research on sustainable development, such as the concept of green growth. This concept was first promoted in 2005 by the UN Economic and Social Commission for Asia-Pacific (UNESCAP), mainly to seek opportunities to introduce a new low-carbon sustainable development model for rapidly developing Asian countries [
36]. The term, as in the case of sustainable development, is defined in many different ways. According to the OECD [
37] definition, green growth means “fostering economic growth and development while ensuring that natural assets continue to provide the resources and environmental services on which our well-being relies.” UNESCAP [
38,
39] defines this term as: “...growth that emphasizes environmentally sustainable economic progress to foster low-carbon, socially inclusive development.” According to World Bank [
40], green growth should be described as: “growth that is efficient in its use of natural resources, clean in that it minimizes pollution and environmental impacts, and resilient in that it accounts for natural hazards and the role of environmental management and natural capital in preventing physical disasters.” The literature [
41,
42] also indicates that the concept of green growth does not replace sustainable development but achieving the purposes of sustainable development becomes possible when the economy is functioning right. An essential aspect of this operation is the care of proper efficient, at least diverse, and efficient use of energy sources.
Energy, access, and use are the theme of Goal 7 of the 2030 Agenda: ensure access to affordable, reliable, sustainable, and modern energy for all. As indicated in the explanation to this goal [
43]: “Access to affordable, reliable and sustainable energy is crucial to achieving many of the Sustainable Development Goals—from poverty eradication via advancements in health, education, water supply and industrialization to mitigating climate change.”
In the case of green growth, the indicators describing energy use were assigned by the OECD to the economy’s environmental and resource productivity, together with indicators describing carbon productivity, non-energy material productivity, and environmentally adjusted multifactor productivity. As indicated in the latest OECD report [
44,
45], “the structure of the country’s energy supply and the efficiency of its energy use are key determinants of environmental performance and economic development.” This report indicates, for example:
Increase in energy used most in the services and transport sector;
Low levels of productivity in many of the major energy-consuming countries despite widespread increases in energy productivity;
A relatively minor role of renewables in OECD energy mixes.
The results of the research presented in this paper, on the one hand, allow verifying whether these observed trends are still valid. Thanks to the application of selected multivariate methods of statistical analysis, it is also possible to examine the relationship between the degree of achievement of Goal 7 of sustainable development and the results of energy use within the green growth concept. The following part of the paper will examine the relationship between these areas.
An overview of current research directions in the field of green economy and sustainable development can also be found in the works published by other authors.
Table 1 contains an overview of selected studies in this field, presenting the main directions of research and analysis in this domain.
3. Data and Methodology
3.1. Statistical Database
According to the adopted assumptions, the analyses covered two groups of data. The first includes the European Commission’s indicators to monitor progress in the implementation of Goal 7 of the 2030 Agenda. The second group comprised the indicators describing developments in one of the areas of green growth, i.e., the environmental and resource productivity of the economy, from the OECD database. In the paper, all of the indicators applied by the European Commission (2030 Agenda) and OECD (green growth) were used. The authors decided not to select indicators from these databases with use, e.g., statistical methods. It means that all of the indicators created for this purpose by these international organizations were adopted for the study. This approach will allow for a real comparison of these areas as they were originally designed.
In both cases, because of the comparative nature of the studies conducted, the 2018 data were analyzed. In individual cases, due to the adopted, for example, 5-year period of change monitoring, data from 2015 were included in the analyses, mainly in the case of indicators on the green economy. The study covered the 27 current European Union members and the United Kingdom, which only formally left the European Union in 2020. A comparison of both groups of indicators is presented in
Table 2. The symbol
S next to the indicator (e.g.,
X15S) means that it is a stimulant—with the increase in the value of this indicator, an improvement is observed in the analyzed area, while the symbol
D means a destimulant, in this case, the deterioration is observed with the increase of the indicator.
All the indicators studied have a significant variation level, with coefficients of variation (VS) for indicators describing changes in Goal 7 of sustainable development strategies are significantly higher than in the case of green growth for the area selected for the study: the economy’s environmental and resource productivity. The highest level of coefficient of variation concerns two indicators: X13D—final energy consumption in households (kg of oil equivalent per capita) is 304.99% and X1.4S—energy productivity (purchasing power standard, PPS per kg of oil equivalent) is 318.45%. Such a large diversity is influenced, among others, by significant differences between maximum and minimum values. For X1.3D, the highest final energy consumption in households per capita, at 1032 kg, was recorded for Finland, and the lowest was recorded at 193 kg for Malta. With respect to the latter, the maximum concerned was Ireland (18.66 PPS per kg of oil equivalent), and the minimum value (4.73) was also Malta. It is also worth noting that most of the indicators adopted for the study were characterized by high (Goal 7 indicators) or moderate (green growth indicators) right-hand asymmetry, which means that for most EU countries, their values were below average. In the case of indicators classified as destimulants, this is a favorable situation for most analyzed countries. Their values are below average.
To describe the second study area of green growth, 14 indicators were selected, 8 of which are stimulants. The coefficients of variation, lower than for Goal 7, range from 20.1% (
X2.3S) to 58.35% (
X2.9S). The relatively high variation of the indicator describing renewable energy supply (
X2.9S, % of total energy supply) is influenced by a significant difference between the maximum value, 40.44% for Latvia, and the minimum value of 5.17% for Malta. It is also worth noting that, compared to the results of the OECD Report [
42], there is still an increase in the use of energy in transport in most of the countries under study, the largest for the dynamically developing countries of Eastern Europe: Poland (up 4.60 PPS), Slovak Republic (2.82 PPS), and Hungary (1.45 PPS). There is also a decrease in the use of energy in transport, mainly in the Nordic countries: Norway (down 1.96 PPS), Finland (0.47 PPS), and Sweden (0.55 PPS), but also, e.g., Italy (0.72 PPS) and Latvia (0.50 PPS).
In most countries, the X2.6S energy productivity indicator is also increasing, with the most notable increase observed in Ireland (17.02%), Malta (14.73%), Romania (11.33%), Bulgaria (10.76%), Germany (8.60%), Portugal (8.39%), and Croatia (8.20%). The indicator decreased in the case of Sweden (−4.78%) and Estonia (−0.90%). In many EU countries, there is also an increase in the use of renewable energy (X2.9S), even by more than 30%, but at the same time relatively minor role of this energy in energy mixes in the case of, e.g., Malta (up 61.21 PPS, with a share of 5.02%), or Ireland (33.23 p.p. and 8.42%, respectively).
The information provided confirms significant development differences between EU countries, which is important because one of the main objectives of the functioning of such economic organizations is to strive for equal development of all member states. However, it appears that these differences are still significant, and efforts to eliminate them are still needed. The differences between the level of development of EU countries observed at the level of the individual indicators will also be seen in more advanced multidimensional analyses. Therefore, it is essential to check whether the improvement of the analyzed area of green growth: the environmental and resource productivity of the economy is reflected in the implementation of Goal 7, the 2030 Agenda.
3.2. Statistical Methods
A two-stage research procedure was used to study the relationship between indicators describing the degree of implementation of Goal 7 of the 2030 Agenda and Green growth strategy regarding the economy’s environmental and resource productivity. At the first stage, synthetic measures were calculated based on the indicators in each area concerned, which allowed ordering the studied countries in terms of their performance. The TOPSIS method was used to determine synthetic measures. A detailed description of this method and examples of its application can also be found in the papers [
78,
79,
80,
81,
82,
83,
84,
85,
86]. This method is often used in the literature to study customer preferences [
78,
79,
80,
81,
82]. There are also a growing number of its application in research on the level and directions of regional development [
84,
85,
86]. Its main advantage is the ability to determine the distance from the so-called pattern and the anti-pattern of development, enabling not only to study the similarity of development in relation to the pattern but also to identify objects similar to the so-called anti-pattern. It appears, which is also confirmed by the results of the research presented in this paper, that a large distance of an object from the pattern (in this case, a country) does not mean a high similarity to the so-called anti-pattern. This observation is important for determining the paths of development of the studied objects within the scope of the studied phenomenon or for comparing objects between one another.
The basis of linear ordering is a synthetic measure whose values are estimated based on observations of diagnostic variables describing the examined objects. TOPSIS is a computational technique that belongs to a group of reference methods for which there are two reference points for objects in multidimensional space, i.e., a pattern and an anti-pattern. The final result of the analysis is a synthetic indicator that creates a ranking of the surveyed objects (in this case, countries). The best object is considered the one with the shortest distance from the pattern and, at the same time, the longest from the anti-pattern.
The determination of synthetic measure in the TOPSIS method is as follows [
78,
79]:
The second stage was devoted to examining the relationship between the results obtained in the two areas analyzed. The first step is to set linear correlation coefficients:
r Pearson (for the value of synthetic measures) and
τ Kendall (for the positions occupied by the studied countries), describing the dependencies between the determined measures and the results obtained by individual countries [
83,
84,
85,
86,
87,
88,
89]. The results allowed examining the relationships between the analyzed areas and, importantly, identifying countries where the assumed objectives of the green economy supporting sustainable development are being achieved.
More advanced statistical analysis methods were used to study the relationships between the analyzed areas. The research used a multicriteria taxonomy described in the literature [
90,
91,
92]. The mathematical algorithm of this method takes place in several stages. A detailed description of this method can be found in [
93,
94]. The first step requires a transformation of each indicator utilized in the analyses. The paper proposes that the clustering of countries should be carried out using the distances from the pattern in the TOPSIS method (
and the anti-pattern (
, which replaces the normalized values of indicators used as a standard for this method. This approach allows countries to be grouped by their similarity in the distance to the pattern (the best object) and the similarity of distance to the anti-pattern (the worst object). In this paper, these distances are defined as baseline distances. The matrices containing information about the baseline distances determined for each indicator analyzed were used to determine two final distance matrices
DP (based on distance from the pattern) and
DAP (based on distance from the anti-pattern). Euclidean distance was used for this purpose. In the next step, based on the values in the distance matrices, a threshold values
di should be defined. The following formula can be utilized for this purpose:
The transformation of the
DA and
DAP distance matrices is carried out. For each indocator, the affinity matrix of
dimension is defined. The elements of this matrix:
are equal to:
If inequality (6) is satisfied, the objects designated as
i and
j are treated as similar. In opposite, if inequality (7) is satisfied, the analyzed objects are deemed as dissimilar. In the second case, the affinity measure of
is equal to zero. Finally,
CA(n×n) and
CAP(n×n) affinity matrices are determined. In this case, the following formula is applied in which
elements of these matrices are equal to the product of relevant elements of
CA and
CAP matrices for all the analyzed indicators:
If , it means that each of elements corresponding to it in CK matrices is equal to one, and if , if one of the elements corresponding to it are equal to zero.
Two analyzed objects (in the paper two countries) are considered to be similar to one another simultaneously on account of all the criteria if they are similar to one another separately on account of those criteria individually. Two objects are treated as dissimilar on account of all the examined criteria if they are not similar to one another, even in terms of one of such criteria. According to this assumption, sometimes it is challenging to find many similar objects in terms of every analyzed indicator.
In the following step, the analyzed objects are divided into typological groups. In the paper, for this purpose, the vector elimination method [
87] is used. The procedure in this method, as in the multicriteria taxonomy, involves several stages. In the first step, the final
C(n×n) affinity matrix is transformed into a
C*(
n×n) dissimilarity matrix. Next, based on
C* matrix, the
c0 column vector is estimated with
n components. In the second step, the row is eliminated from
C* matrix along with a corresponding column for which the
c0 vector component has a maximum value. If the
c0 vector contains several components whose value reaches the maximum, such a row and column are eliminated. The second step of the procedure is repeated until the
c0 vector components are equal to zero. To the first sub-group, objects corresponding to the rows and columns that were not crossed off and remain in
C* matrix were assigned.
4. Study Results
4.1. The Results of the TOPSIS Method
The indicators described in the previous parts of the article are now used to construct synthetic measures describing the degree of the implementation of Goal 7, the 2030 Agenda, and the Green Growth Strategy within the framework of environmental production efficiency. The results obtained from the classification and grouping of EU countries due to the examined areas are shown in
Table 3.
As it has already been mentioned, many of the papers published so far point out that the Scandinavian countries are basically the only countries in Europe that have managed to separate economic growth from the negative environmental pressures permanently. Similar patterns are also visible in the presented list. Scandinavian countries that are members of the EU: Denmark and Sweden, and additionally Croatia, are the only countries in the top five countries with the highest scores in both areas of the survey. For the other countries, two patterns are visible. According to the first one, EU countries ranking high on Sustainable Development Goal 7 have lower rankings on environmental productivity and vice versa. That applies to countries located in different parts of Europe, although more often those located in:
Northern Europe (Estonia: 6 and 27; Finland: 22 and 10; Lithuania: 25 and 5);
Southern Europe (Italy: 19 and 9; Malta: 20 and 11; Portugal: 18 and 6; Slovenia: 9 and 18);
Eastern Europe (Czechia: 15 and 25; Poland: 11 and 28; Romania: 2 and 12).
In Western Europe, this is the case for only one country (Luxembourg: 28 and 15). The results of other countries located in this part of Europe are more often at a similar level in both analyzed areas. This similarity of the results, that is, the second type of regularity, is visible regarding other countries located in different parts of Europe, apart from the already indicated Scandinavian countries and Croatia. The most considerable differences, not exceeding five positions in the rankings, were noted for: Austria (7 and 2), the Netherlands (21 and 26), and the United Kingdom (8 and 13). Several different development models of EU countries (
Table 4) can be identified, based on the division into typological groups (I–IV).
It is clear from the information provided in
Table 4 that countries classified in the first typological group in the case of the first ranking (Goal 7, SDS) were also classified in the first two groups in the case of the second ranking (Environmental and resource productivity of the economy of GGS). The first and second typological groups include countries that have above-average values for taxonomic measures of development. However, this division is no longer evident for other typological groups. The countries representing the second typological group in the case of Goal 7 were classified into all groups in the case of the second analyzed area. In the prepared set, however, no country was identified that was classified in group IV (with the lowest scores) in the case of both analyzed areas. These regularities are also confirmed by the assessments of correlation coefficients
r Pearson (for taxonomic measures) and
τ Kendall (for positions occupied;
Table 5).
Their analysis indicates a moderate correlation between both the values of the determined synthetic measures and the positions taken by EU countries in the case of Goal 7 and GGS.
Of course, the reasons for the differences in performance between countries vary. As we have already mentioned in the case of the Scandinavian countries, good results in both areas analyzed result from economic development achieved with care for the environment. Countries such as Romania or Croatia owe their high places in the rankings primarily to the lower economic development level compared with other countries. Their GDP per capita (USD 25,805 and USD 26,018, respectively) is well below the EU average (USD 40,192), which results in lower than in other EU countries, environmental interference at this stage of development. The opposite situation can be observed in the case of much more economically developed countries: the United Kingdom (second place in both rankings with a GDP of per capita above average (USD 43,720) or France (USD 42,543). The observed differences in development directions are confirmed by low Pearson’s r and Kendall’s τ correlation coefficients for the calculated taxonomic measures and GDP per capita not exceeding the level of 0.3, indicating only a moderate correlation.
4.2. The Results of the Multicriteria Taxonomy Method
The wide diversity of EU countries due to the two areas analyzed is one of the many reasons that make it difficult, for example, to develop acceptable by all countries assumptions for various EU policies. Therefore, it is important to check more precisely to what extent (in terms of which indicators) the analyzed countries are similar to each other or which ones make the biggest differences between them. However, the aim is to compare individual indicators from both analyzed areas at the same time. In the literature of the subject [
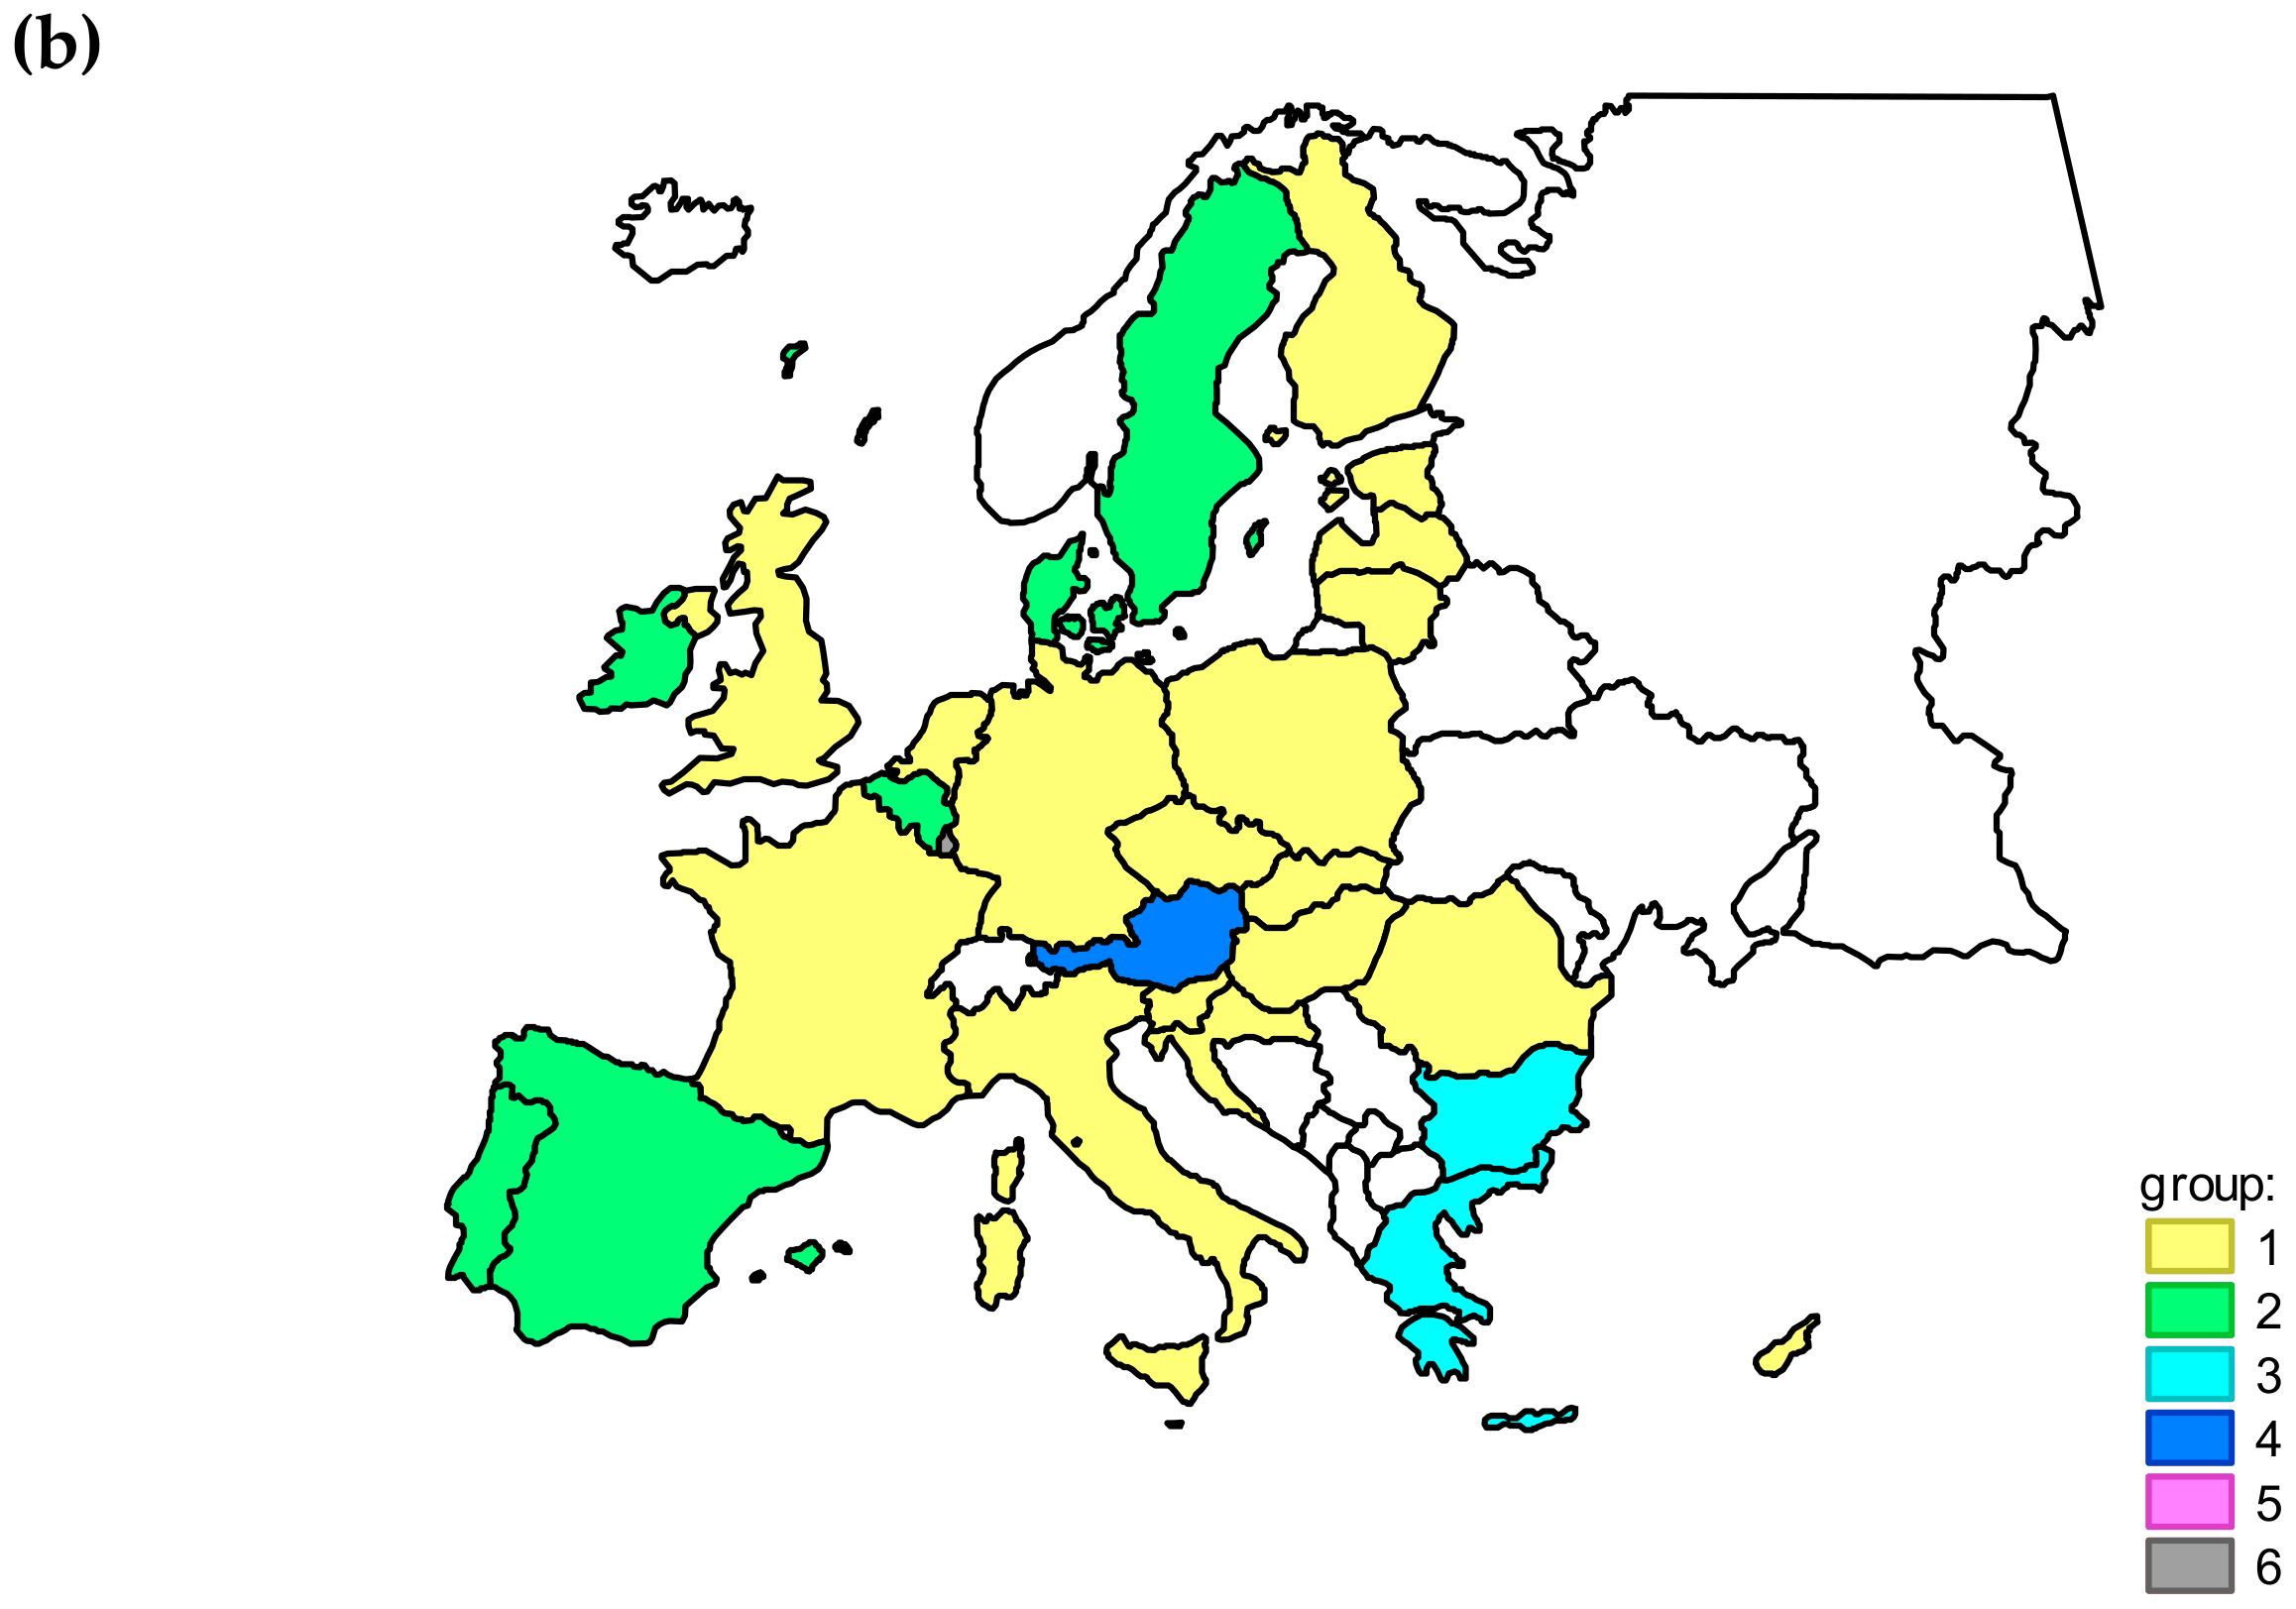
59], the average level of analyzed phenomena is most often used in this case. However, in the approach proposed by the authors, the starting point to more advanced analyses are distance matrices calculated based on the distance between the individual indicators and the adopted pattern (variant V1) and the anti-pattern of development (variant V2). The result is the division of the studied EU countries into groups, as shown in
Table 6 and
Figure 1a,b.
The compositions of the different groups differ quite significantly, but their comparison allows drawing some interesting conclusions. It is worth noting that the computational algorithm used does not allow to determine the order of groups due to their level of development. The order in which groups are created is conditioned by the number of objects classified into them. The first group is always the most numerous, while single-element groups are distinguished last. Despite the different number of EU countries classified in the first typological group, each of the analyzed cases included countries such as Croatia, Czechia, Estonia, France, Germany, Hungary, Italy, Latvia, Poland, Romania, Slovakia, Slovenia, and the United Kingdom. In their case, there is a substantial similarity of development regarding the achievement of SDG 7. With the exception of Italy, all countries are above the EU average in terms of reaching Sustainable Development Goal 7 (cf.
Table 2). The situation in terms of green growth is more diverse, as for six out of thirteen countries (Czechia, Estonia, Germany, Hungary, Poland and Slovakia, and Slovenia), the indicators representing this area often reach unfavorable values compared to other EU countries (below average). However, the fact that these countries are in the same group does not raise any doubts when the distributions of the values of the individual diagnostic characteristics are analyzed in detail. For SDG 7, feature distributions vary distinctively (101.81% to 318.45%), with a strong asymmetry of the vast majority of all indicators. On the other hand, the distributions of individual indicators for environmental production efficiency have slightly different characteristics: variation level from 20.11% to 58.35% and weaker asymmetry. The typological groups presented in
Table 4 are the consequence of applying a multicriteria analysis that considers both research areas simultaneously, and the characteristics of the distributions of indicators within each area affect the final result.
Regardless of the adopted variant of grouping, one can clearly see the countries that differ in plus or minus from the rest of European countries, reaching maximum or minimum values. They include:
Malta—in the area of achievement of Goal 7 the best in terms of X1.3D—final energy consumption in households per capita, kg of oil equivalent, and worst in terms of implementation of indicators: energy productivity, purchasing power standard (PPS) per kilogram of oil equivalent (X14S), energy import dependency, % of imports in total gross available energy (X1.6D). In the area of green growth, the country stands out positively in terms of the following indicators: energy productivity, GDP per unit of TPES, US Dollar, 2015 (X2.6S), energy consumption in industry, % total energy consumption (X2.12D); it stands out negatively for the following: energy intensity, TPES per capita, tonnes of oil equivalent (TOE; X2.7S), total primary energy supply, tonnes of oil equivalent (TOE), millions per capita (X2.8S), renewable energy supply, % total energy supply (X2.9S);
Luxembourg—in the area of achieving Goal 7, Luxembourg has achieved unfavorable values in terms of primary energy consumption, tonnes of oil equivalent (TOE) per capita (X1.1D), final energy consumption, tonnes of oil equivalent (TOE) per capita (X1.2D); whereas in the case of green growth the following can be positively assessed: energy intensity, TPES per capita, tonnes of oil equivalent (TOE; X2.7S), total primary energy supply, tonnes of oil equivalent (TOE), millions per capita (X2.8S), energy consumption in agriculture, % total energy consumption (X2.11D); negatively: production-based CO2 intensity, energy-related CO2 per capita (X2.2D), demand-based CO2 intensity, energy-related CO2 per capita (X2.4D), energy consumption in transport, % total energy consumption (X2.13D);
The Netherlands—this country can be assessed negatively in the case of the indicator on the achievement of Goal 7—share of renewable energy in gross final energy consumption, % (X1.5S), and negatively in the forename GG—energy consumption in agriculture, % total energy consumption (X2.11D).
It would seem that the grouping of countries in two variants, using distances from the pattern ( and the anti-pattern ( determined in the TOPSIS method, should produce similar results, i.e., groups of countries similar to each other due to both their similarity and dissimilarity should be distinguished. This situation occurs only in some cases when most of the characteristics adopted for the study show similar direction and values, which happens especially in the case of single-element groups. It should be noted that most EU countries, due to the characteristics adopted for the study, cannot be unambiguously assigned to the group of those that achieve only desirable or undesirable values. Their situation varies greatly, and this has an impact on the obtained results.
5. Discussion and Conclusions
The results of the EU countries’ classification for Goal 7 SD Strategy and Environmental production efficiency of GG Strategy show how different countries’ development paths within a single economic community can be. Despite continued attempts to equalize the development levels between European Union countries in many strategic areas, this level remains highly diversified.
Should we expect that the action taken by the European Commission will eliminate these differences in every possible area? In our opinion, this is not possible, especially that this view is also confirmed by the research results presented in this paper. It turns out that even the Scandinavian countries, which in the EU are among the few countries that have managed to separate economic growth from negative environmental impacts, are unable to predict all the pitfalls of their growth and economic development. Problems of this kind are also experienced in the highly developed countries of Northern and Western Europe.
The literature of the subject [
88,
89,
90] points out that in the initial stage of economic development, environmental pollution increases with economic growth. The higher the level of economic development a society achieves, the more attention it pays to the environment. Less developed countries should therefore exert less pressure on the environment. What should these relationships look like for the areas analyzed in the paper? Given the computational procedure used, where one of the steps is transforming the destimulant into stimulants, we expect that with economic growth, there will be an improvement in the areas of sustainable development and a green economy. The higher the GDP per capita, the higher the results in terms of implementation of Goal 7 SD Strategy and environmental production efficiency under the GG Strategy should be. However, the results of the studies presented in the paper show that these relationships are not so obvious. It was noted that among the countries with the highest GDP values per capita (Austria, Belgium, Denmark, Finland, Germany, Ireland, Luxembourg, the Netherlands, Sweden, and the United Kingdom), there are also those for which the designated values of synthetic measures were lower than the average in the group. Countries such as Belgium, the Netherlands, despite their relatively high GDP per capita, are successful in achieving Goal 7 of the SD Strategy. Their environmental production efficiency is also lower than that of other less developed EU countries, hence their qualification for Group III or IV.
On the other hand, the opposite was observed for Croatia, Latvia, Romania, and Spain. Despite being lower than the EU average GDP per capita, these countries achieved relatively high results in the analyzed areas, allowing them to qualify for typological groups I or II. These observations are also confirmed by the results of studies by other authors [
91,
92,
93,
94,
95], which show, among other things, that the relationship between environmental pollution and the wealth of a country has the shape of an inverted letter “U”—with economic growth, the pollution increases, but only to a particular level beyond which environmental pollution decreases with economic growth. In recent years, the above-described curve has flattened, and the peaks at ever-lower levels signify that even poorer countries are beginning to pay more attention to the environment. This observation is fundamental in the analyzed area of environmental production efficiency. It seems that a large group of highly developed countries may not have reached the so-called tipping point yet—hence their worse position than in the case of other countries in terms of indicators showing, for example, CO
2 production [
96].
However, it is worth noting that investments, which often rely on costly and durable infrastructure, play an essential role in achieving the objectives of both strategies. Vast amounts of capital are needed to finance infrastructure such as smart grids, renewable energy sources, resource efficiency. The analysis of EU Community Innovation Survey (CIS) data for eco-innovation adoption by EU firms—for energy efficiency and carbon dioxide abatement—suggests that adoption is positively correlated to the emission efficiency of the countries where the companies are based. There are structural differences in this correlation across the EU Member States, with leaders and laggards.
This also means that we need reliable data that will allow us to assess accurately at which development stage the countries currently are and how their development paths may proceed [
97]. The choice of computational method is also important. In the literature, there are many different proposals for determining the level of development of the analyzed objects (in this paper, these are the EU countries). These methods focus on determining the average level of development of these objects. In this paper, however, it is proposed to examine the distance of the EU countries in relation to the so-called development pattern and, at the same time, the so-called anti-pattern. On this basis, in the next step, the objects are grouped in order to recognize their current level of development more accurately. It is essential for the evaluation of the studied phenomena because it allows illustrating complex relationships between them. It also enables assessing whether the high level of development of one phenomenon (in this case, within the selected goal of the green economy) influences the development of another one (within the selected goal of sustainable development). The results presented in this paper showed that these relationships are not straightforward. The high level of development in both examined areas concerns only a few countries. Economically less developed countries pollute the environment to a lesser extent, but it can be expected that the environment will be increasingly polluted as the rate and level of economic development increases.
The key question can be formulated as follows: What can be done? What instruments should be applied in order to make this development in the less economically developed EU countries progress in a different way than in the case of the currently most developed EU countries? How to make the transition from one stage of development to another (high economic development and low environmental pressure) as fast as possible?
It is also worth emphasizing that the unique value of the study lies in the research approach that focuses on the relationships between the areas selected for the analysis. In the literature on the subject, there are no works examining the relationships between different areas of development, especially conducted in the manner proposed by the authors (the similarity versus dissimilarity of development). The main concern is to determine the average level of the studied phenomena. The authors of the paper propose a more advanced approach to this issue. The final goal is the degree of correlation between the two areas and the indication of the different development stages currently faced by the EU countries.
In the subsequent research, the authors also plan to extend the range of research methods used to study the relationship between these areas to qualitative and quantitative techniques using, for example, cognitive mapping. The ability to anticipate changes in the relationships that connect the analyzed areas is the advantage of this approach. Such attempts in the study of dependencies can be found in the earlier work of the authors of this article [
3,
4,
5] and the studies of other authors [
98,
99]. The authors plan to concentrate on the relationship between the different goals of sustainable development and the green economy in their future studies. In this way, the authors will be able to examine more broadly the relationship between these two areas.


