Abstract
In this paper, the dynamic experimental identification of an inductive energy harvester for the conversion of vibration energy into electric power is presented. Recent advances and requirements in structural monitoring and vehicle diagnostic allow defining Autonomous Internet of Things (AIoT) systems that combine wireless sensor nodes with energy harvester devices properly designed considering the specific duty cycle. The proposed generator was based on an asymmetrical magnetic suspension and was addressed to structural monitoring applications on vehicles. The design of the interfaces of the electric, magnetic, and structural coupled systems forming the harvester are described including dynamic modeling and simulation. Finally, the results of laboratory tests were compared with the harvester dynamic response calculated through numerical simulations, and a good correspondence was obtained.
1. Introduction
In recent years, the widespread adoption of IoT (Internet of Things) devices and technologies has seen their application in different and various fields, including in industrial ones. These wireless devices have became more and more interesting to industries, especially for maintenance and diagnostics. By means of these devices, it is possible to create a wireless sensors network, where each node is capable of giving fundamental data for a new and deeper knowledge of the components, structure, or vehicle under monitoring. These networks provide real-time information concerning the monitored device, providing the opportunity to record a continuous data stream, which can be crucial to opening new frontiers in predictive maintenance and condition monitoring. Among all the features a node should have, the most crucial ones are a long lifecycle, a reduced size, and a solid wireless connection. A long lifecycle is necessary due to the maintenance cost associated with the battery replacement and disposal. Furthermore, a small and compact size is required to realize nodes suitable for easy integration in the system, even in places inaccessible to or unsafe for human intervention. Moreover, each node needs to be solidly connected to the network to send data when required. As mentioned earlier, in these applications, the use of conventional batteries has become a disadvantage as their replacement requires human intervention and their disposal is an environmental and safety issue [1]. Considering this, the need for an alternative power supply for these sensor networks emerges. For this reason, the research topic of energy harvester devices continues to grow, especially in the Autonomous Internet of Things (AIoT) field. The process of the conversion of the unused energy in the form of electricity, called harvesting, could help provide unlimited energy for the lifespan of the electronic device, generating new categories of AIoT systems. The electric energy can be provided by many sources such as light, wind, temperature gradients, radio frequency waves, the kinetic energy of sea waves, and mechanical vibrations available in the ambient environment [2,3]. It is possible to classify, as schematically described in Figure 1, the different energy-harvesting devices by their energy sources such as solar, thermal, and vibration. Concentrating the study of this paper on the mechanical vibration energy source, the most common conversion principles are piezoelectric, magnetic inductive, and capacitive.
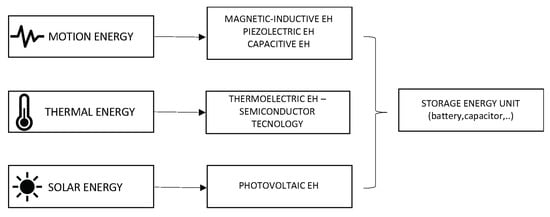
Figure 1.
Schematic list of energy harvesting from environmental energy sources.
In previous works [4,5,6], the authors have analyzed the performances of different energy harvesters: piezoelectric, electrostatic-capacitive, and magnetically levitated; they also patented some dedicated devices for energy harvesting. Among them, the magnetic inductive energy-harvesting strategy was preferred in this work for the conversion of vehicle mechanical vibrations into electricity. The reasons were mainly related to the compatible dynamic response of these generators (low resonance frequency, long travels) and the better ratio between generated power and device volume (higher power density). The considered generators were designed to tune their dynamic response to the vehicle excitation, which means lowering the resonance frequency using very low stiff suspensions. For this purpose, traditional springs or mechanical suspensions were replaced with magnetic suspensions, which can considerably reduce the force/displacement ratio by preserving the long travels and velocities of the oscillating permanent magnet. The most crucial design issues of the inductive harvester are the dynamic response of the magnetic suspension and the electromagnetic coupled system dimensioning. The experimental characterization of different harvesters with different numbers of the coil is needed to identify the behavior of the generator.
Energy Harvesting Technology for a Power Supply Monitoring Sensor Network
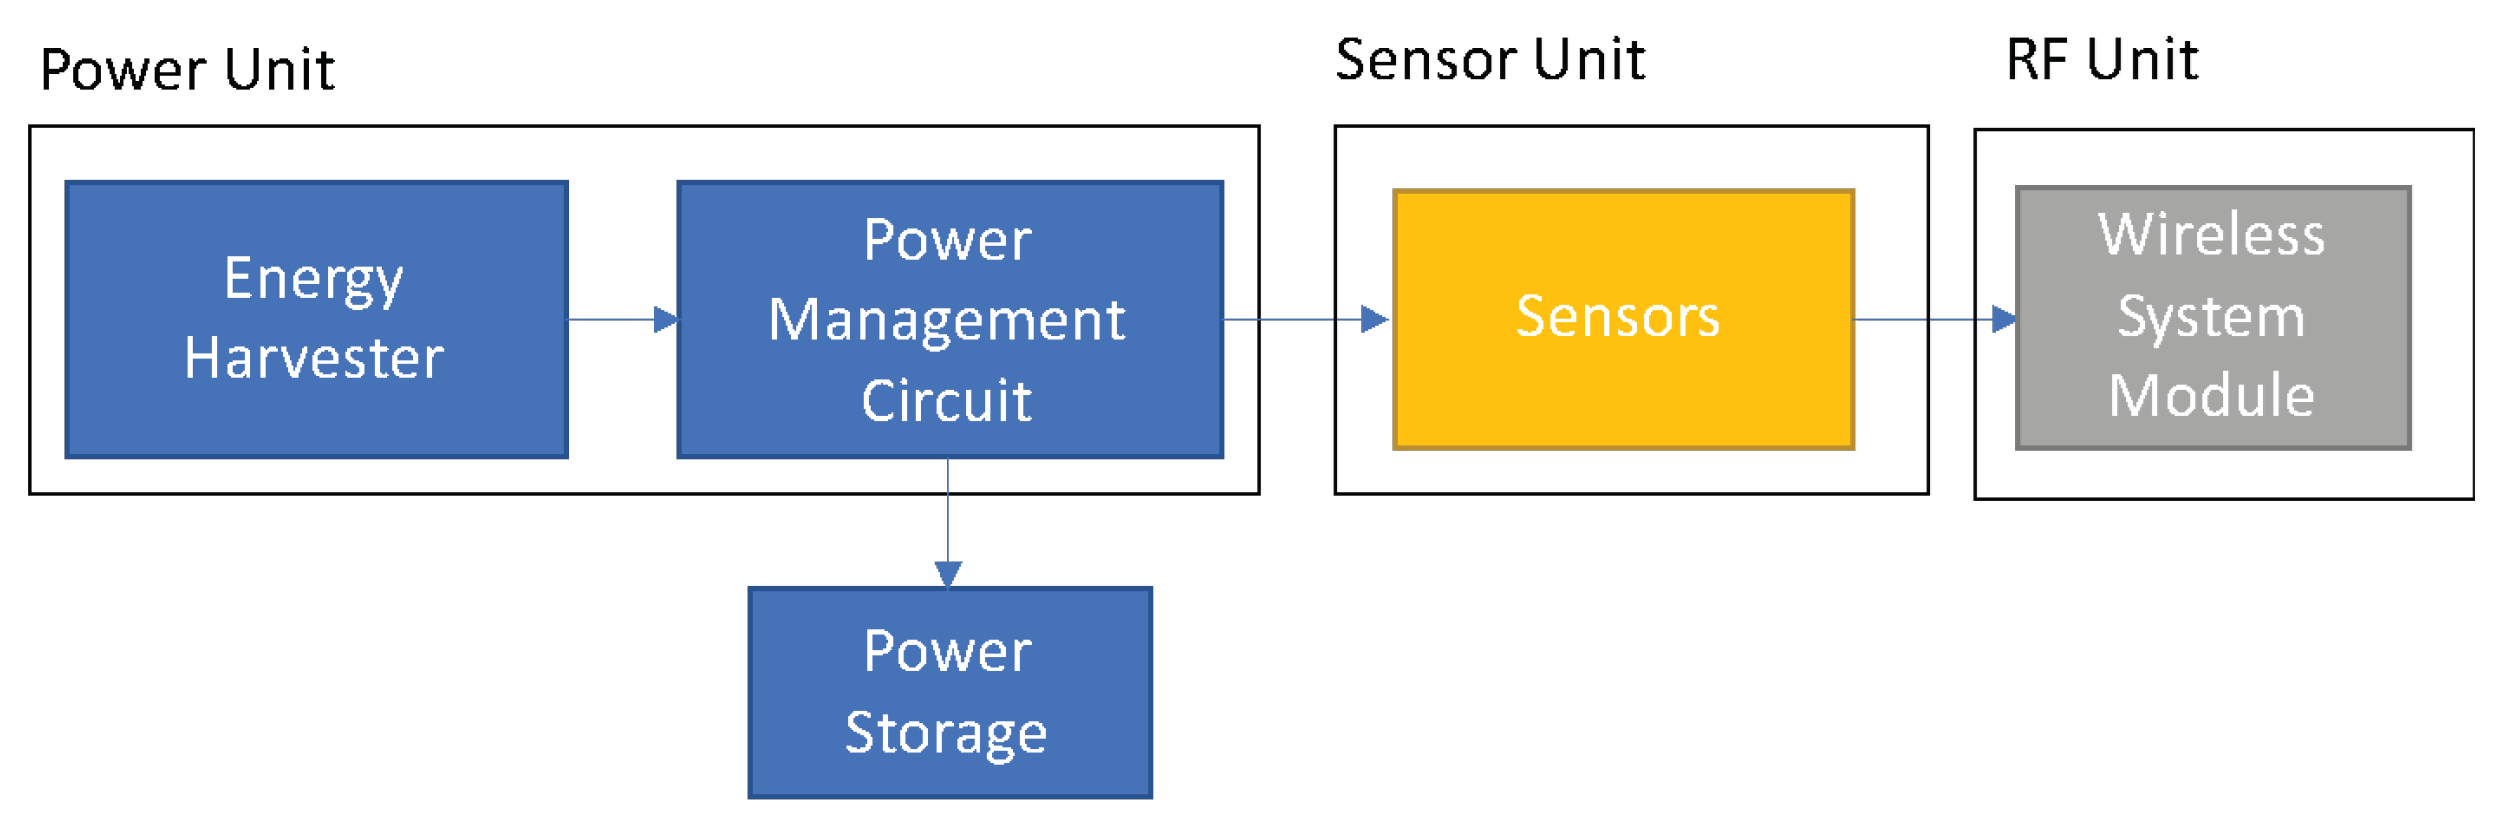
As described in the Introduction, the devices powered by energy harvesters can be used to provide vital information on the operational and structural circumstances by placing them in inaccessible locations. They represent a valid alternative to batteries and cables and are promising for opening new opportunities for the development of mobile and wireless devices. Dedicated devices for harvesting the energy dissipated by the mechanical vibrations of machines have shown their applicability in supplying autonomous distributed sensing systems [7,8]. Energy harvesters will allow using, for example, wireless sensors in many applications such as industrial and structural monitoring, transportation and logistics, and energetic efficiency control [9]. Recent applications are also in the fields of wearable device and human walking monitoring [10,11]. They can provide help in the on-site charging of rechargeable batteries and supercapacitors. The sensors can be coupled with energy harvesting systems to obtain self-powered wireless sensing units; the sensing unit can measure environmental parameters and send the processed information by radio-frequency modules without physical connections, as shown in Figure 2. The conversion of unused energy into electricity has motivated many academic and industrial researchers during the last few years.

Figure 2.
Architecture of a self-powered sensing wireless node system.
The focus of this paper is to present the characterization of a vibrational linear energy harvester and the realization of its numerical model in MATLAB/Simulink to estimate the power obtained by varying the resistive load or the excitation frequency. In the literature, these harvesters are widely studied and presented in different configurations of dimensions and springs. Obviously, the more the harvester size is reduced, the more it is suitable to be integrated into a sensor network, but using small masses and volumes makes harvesting the right amount of power more complex. On the other hand, a spring is chosen considering the proper stiffness to guarantee the tuning of the resonance frequency with the characteristic frequency of the application. Here we report some examples extracted from the literature that show different small-sized harvesters with symmetrical springs. First, in Yuen et al. [12], an example of an AA battery-sized energy harvester was proposed. This represents an interesting miniaturized system capable of 120 μW with 30 kΩ. Furthermore, in a more recent research work [13,14], a C battery-sized harvester was proposed so that the system was suitable for an integrated electronic device. The harvester was a two-degree-of-freedom nonlinear electromechanical harvester with a magnetic spring that, with the impact of the two masses, could provide a broadening of the power frequency response thanks to the impact of the two masses. The obtained output power was 0.178 mW with a high figure of merit of 2.6 at 11.5 Hz. The figure of merit used in these papers was the volumetric one; it compares the power output of the harvester represented with the power output of an harmonic oscillator of the same volume and mass, with the mass made of gold, the half volume occupied by the mass, and the other being free of displacement. These examples perfectly demonstrate the effort of the researchers to obtain the maximum power from harvesters of a very reduced size in order to insert them into a wireless network.
One of the things that distinguishes our model from others is the presence of a nonsymmetrical magnetic spring with only one fixed magnet at the lower end of the harvester; in this way, the moving magnet returns to the equilibrium position by gravitational force. In fact, many harvesters proposed in the literature present a symmetrical magnetic spring with two fixed magnets collocated at the ends and an oscillating magnet. An example was shown in Vishwas Bedekar [15], where they generated 3 mW at 5 Hz and 1 mW at 3.5 Hz with a device the size of a pen. The integrated pen harvester prototype was found to generate continuous power of 0.46–0.66 mW under the excitation of usual human actions such as jogging and jumping, which is enough for a small-scale pulse rate sensor. Furthermore, Dallago [16] proposed an analytic model of a vibrating electromagnetic harvester, considering nonlinear effects. The model can predict the induced voltage power output with different loads applied. The structure of the harvester consisted of two fixed magnets on the ends and two moving magnets, arranged in a configuration that created a repulsive force. The output power produced from this device was 6 mW. Moreover, Christopher Lee [17] proposed a nonlinear magnetic suspension, modeled using the Duffing equation and using an experimental test to compare it to the numerical model, obtaining 16 mW. Furthermore, in the work of Marco P. Soares dos Santos [18], a magnetic suspension was used, and a combined experimental and theoretical approach was presented. The model provides unique insight into the fundamental mechanisms of energy transduction and enables both the geometric optimization of harvesters before manufacturing and the rational design of intelligent energy harvesters. Finally, in D.F. Berdy [19], a different configuration of the magnetic suspension was proposed with a parallelogram-shaped oscillating magnet. The friction issue was highlighted and described also in the Simulink model, and 410 μW at 6.7 Hz of power was obtained. In this paper, a gravitational magnetic suspension energy harvester with cylindrical magnets is presented. In Section 2, the structure and the geometry of the device are described. In Section 3, the experimental apparatus is presented, both for the static and the dynamic tests. The fundamental equation of the system and the numerical model are presented in Section 4, and in Section 5, the experimental results and their comparison to the numerical one are shown. At the end of Section 6, the results and the conclusion are discussed.
2. Harvester Configuration
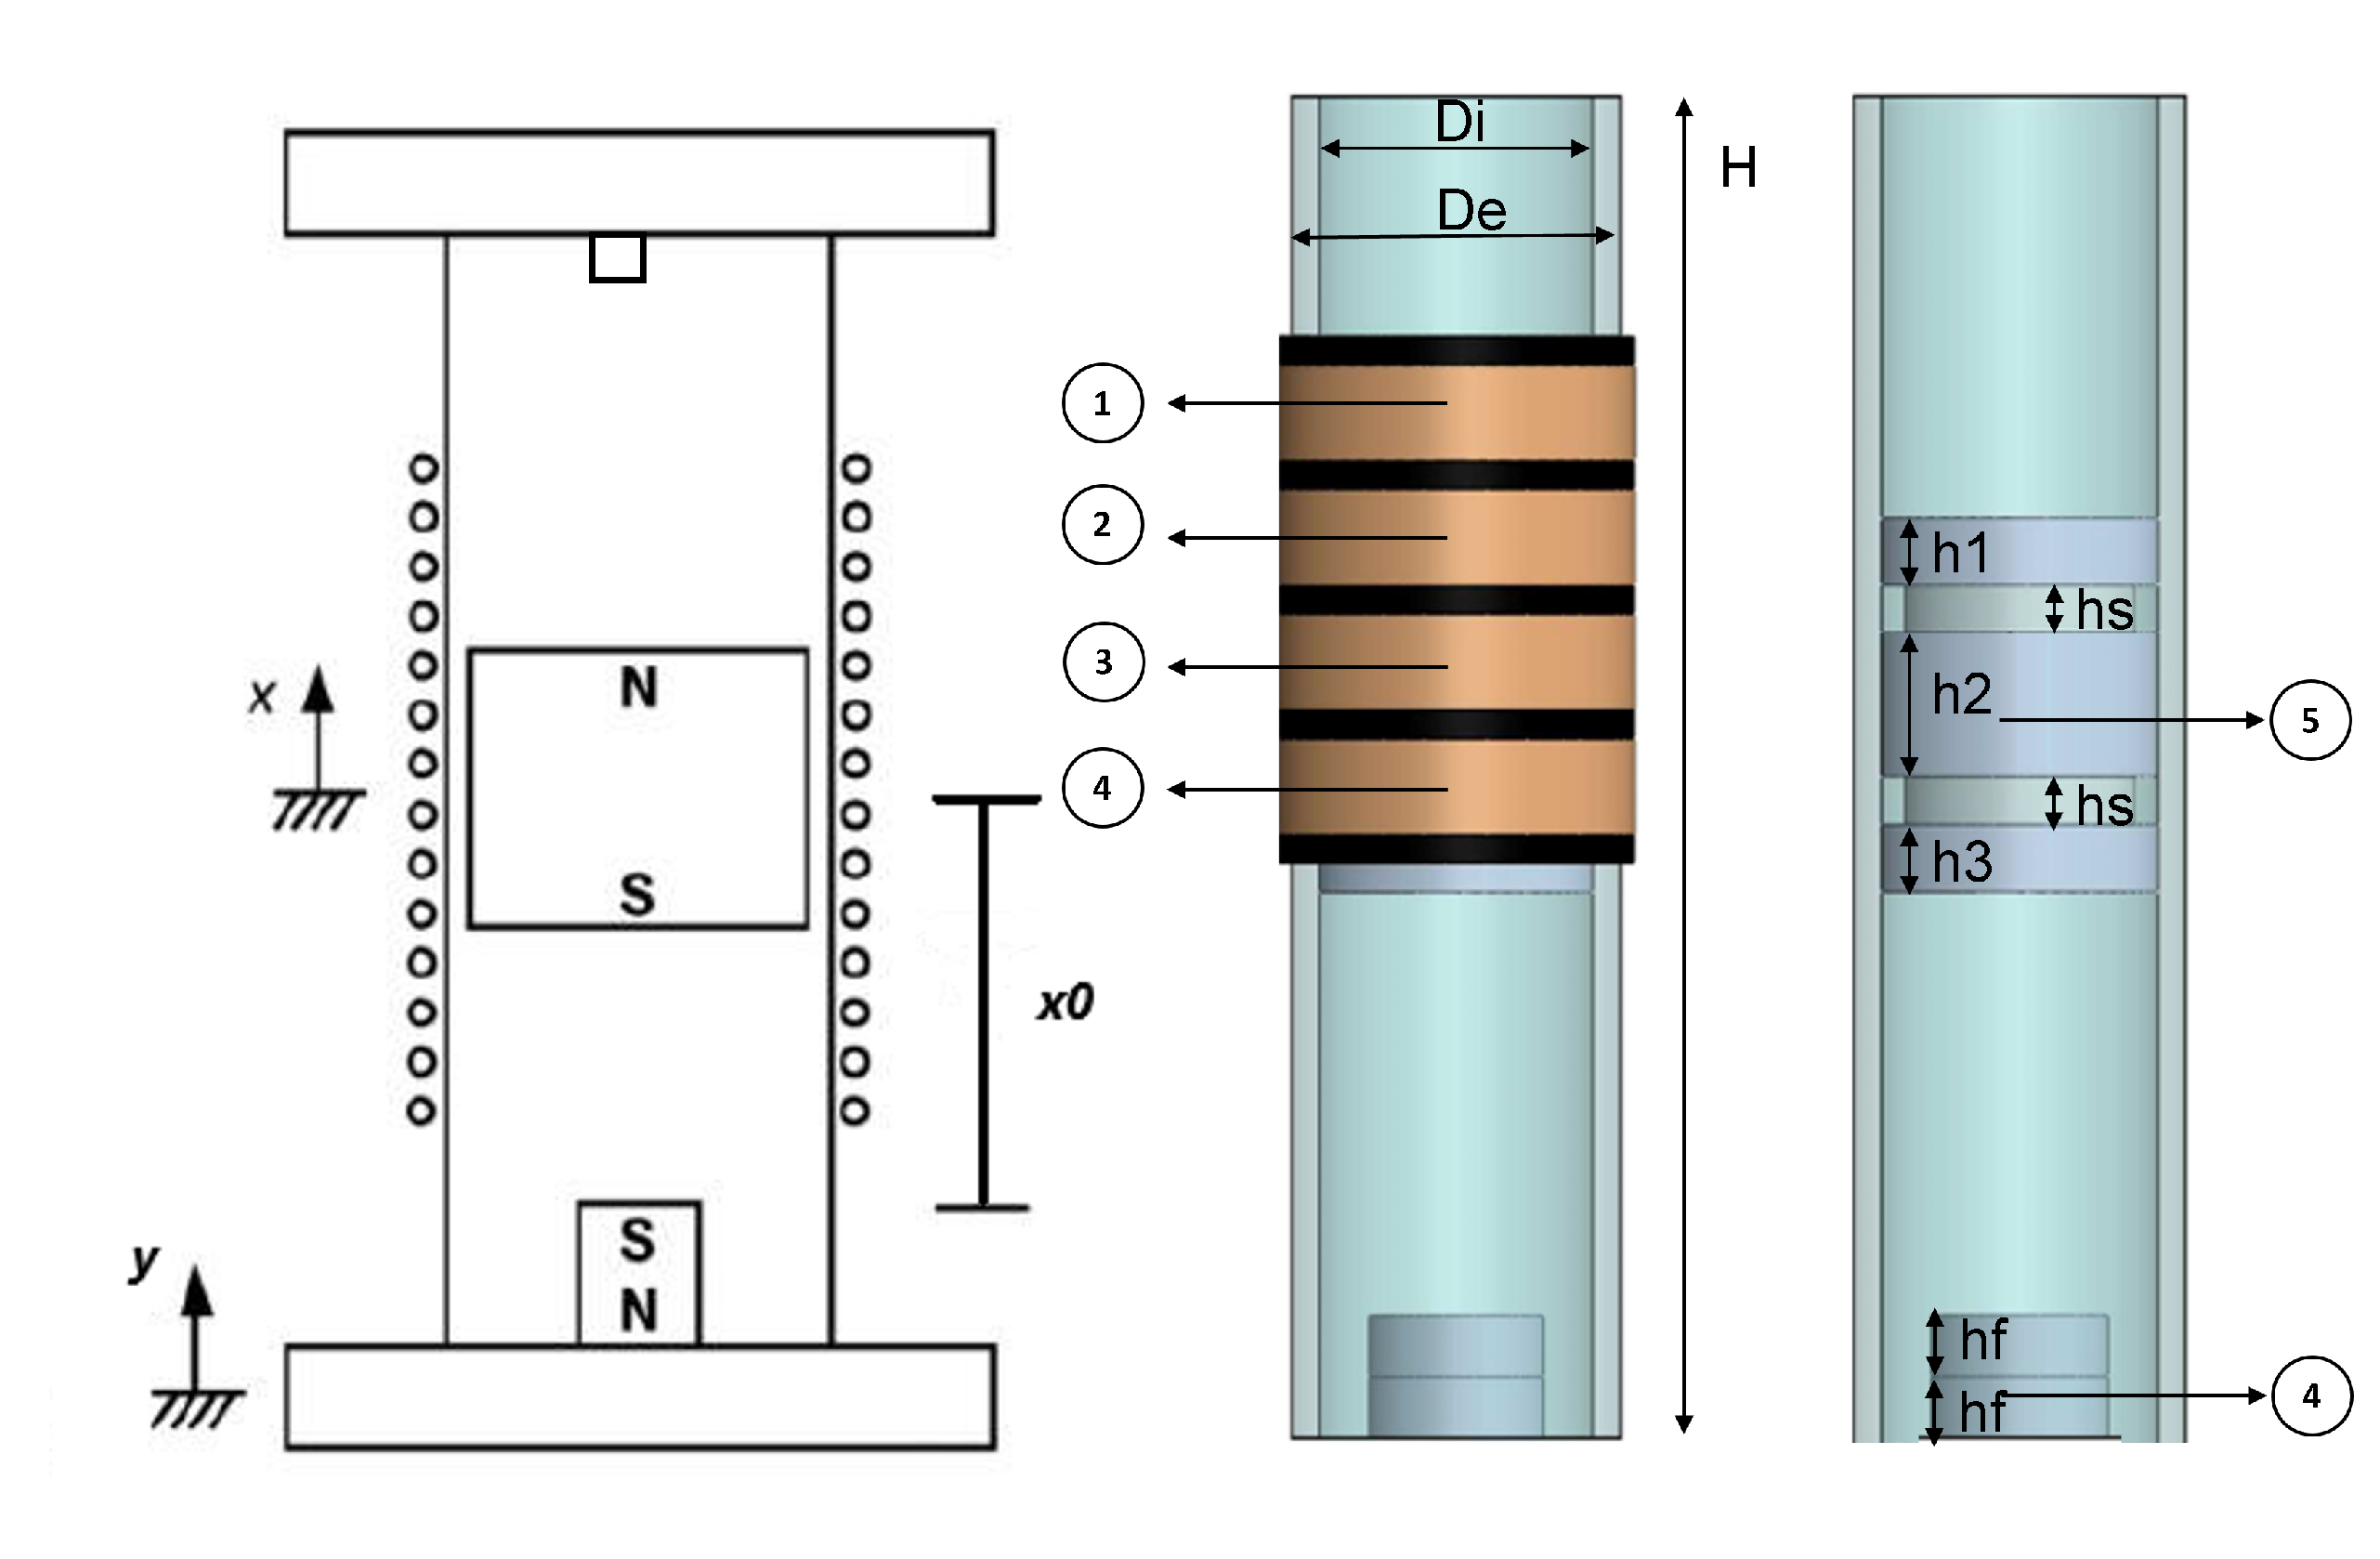
The harvester scheme, reported in Figure 3, included a fixed magnet, a suspended magnet, and four coils. One characteristic of this harvester is the presence of an asymmetrical spring. The fixed magnet was present only at the lower end of the harvester, and the moving magnet returns to the equilibrium position by gravitational force. Due to this characteristic, a bumper was placed to avoid impacts within the moving magnet and the upper end of the harvester.

Figure 3.
Energy harvester scheme.
In Table 1 are reported the main components of the energy harvester. In particular, it is important to underline the structure of the moving magnet. It was composed by three magnets assembled using their attraction forces and spacers with proper dimensions to obtain the requested global height and mass of the magnets. The maximum travel of the moving magnet was measured from the top surface of the fixed magnet ( on the left of Figure 3) and, in the same way, the other measurements were made as well, such as the height of each coil and the equilibrium position. The last one is the distance between the top face of the fixed magnet and the center of mass of the moving one.

Table 1.
Description of the components of the energy harvester.
The main characteristics of the two harvesters are reported in the tables below: Table 1, Table 2 and Table 3.
Table 2.
Characteristics of the fixed and moving magnet.
Table 3.
Dimensions and common electric characteristics of Harvesters 1 and 2.
For this study, two types of energy harvester were compared, Harvester 1 (EH 1) and Harvester 2 (EH 2), keeping the same magnets, but changing the number of turns of each coil. In particular, Harvester 1 had four coils, each of two-hundred eighty turns, while Harvester 2 had four coils, each of four-hundred thirty-five turns. Moreover, for Harvester Coils 2 and 4 were tested to find out the effect of the axial coil location on the output power. The main characteristics of the two harvesters are reported in the table below.
In Table 4, the height of each coil is reported using as the zero reference the top end of the fixed magnet.
Table 4.
Dimensions and electric characteristics specific to Harvesters 1 and 2.
3. Experimental Setup
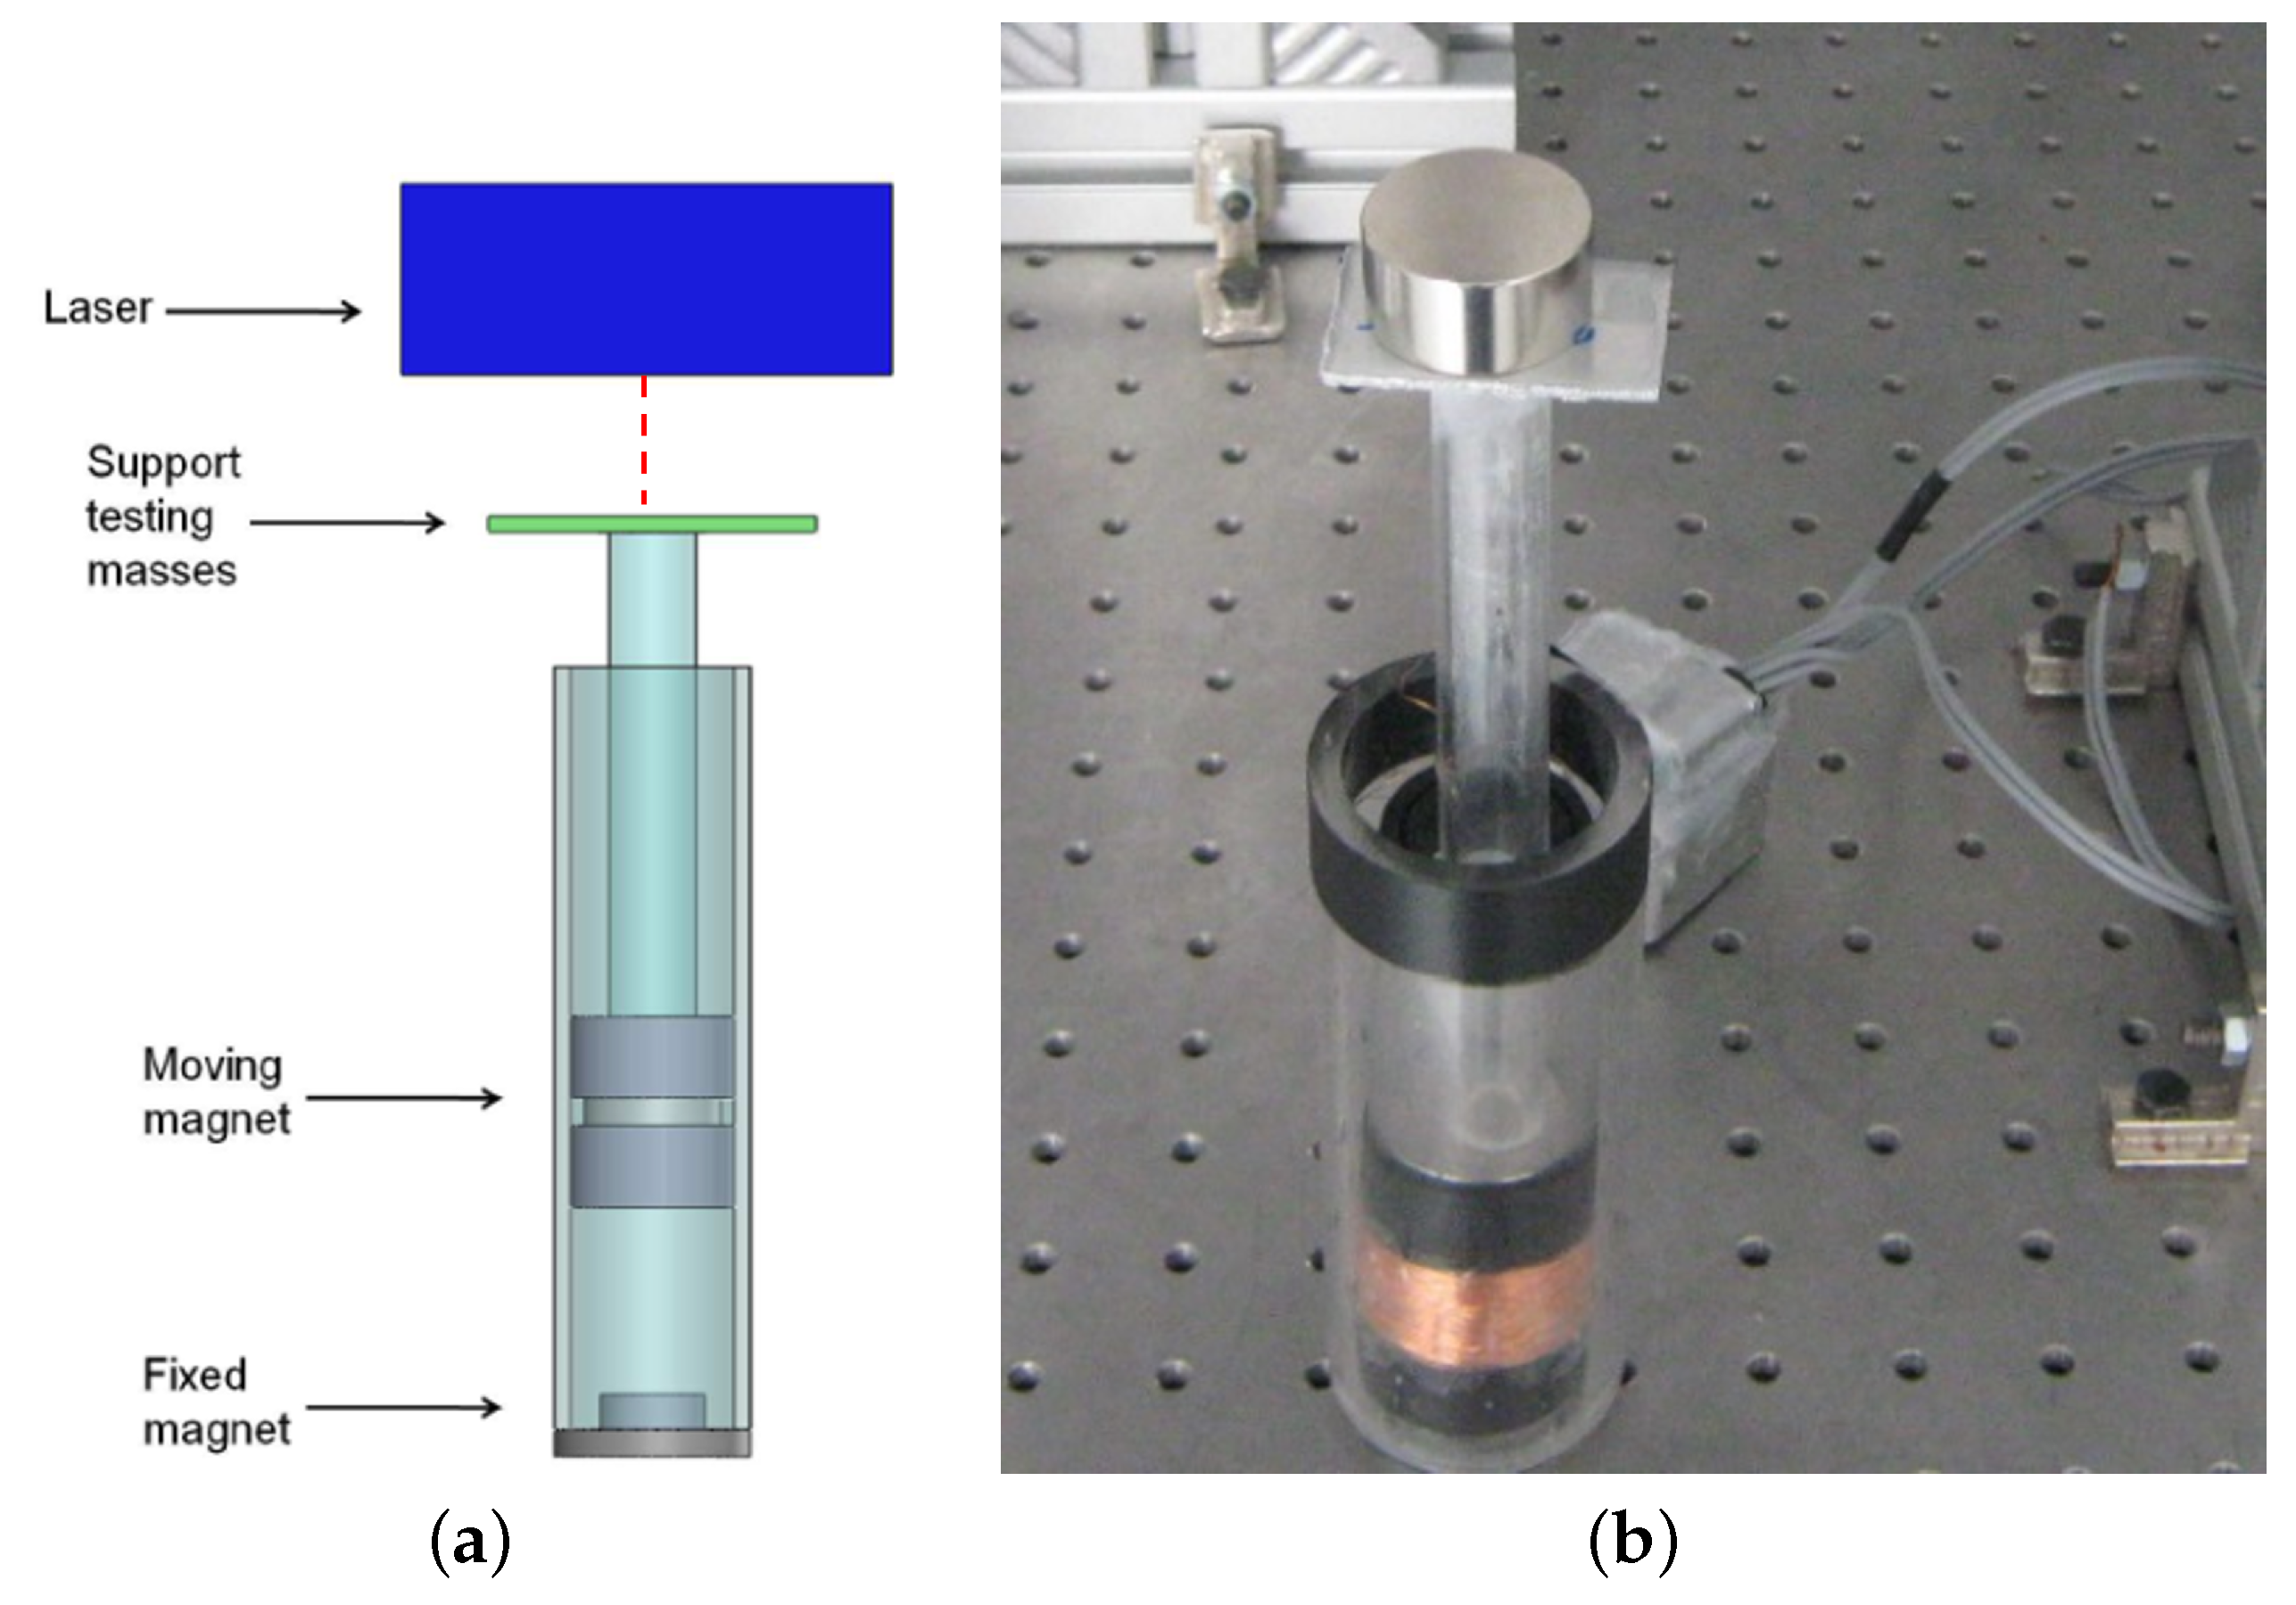
For the static characterization of the magnetic suspension, a test bench including a DC voltage generator and two LK-G82 KEYENCE (Mexico City, Mexico) laser sensors (50 kHz sampling frequency, 0.2 mm, 70.05% accuracy) with an LK-G signal controller was used. The harvester was integrated with a support beam having a plate on the top for the application of the calibrated masses. The equilibrium position of the moving magnet was evaluated leaving the supporting beam free from the calibrated masses, then the other positions of the moving magnet were computed with respect to the equilibrium position by applying fourteen different masses with increasing values.The measurements of the moving magnet position were conducted on a seismic table to reduce the effects of external noise on the experimental results. The laser sensors were supplied by the DC voltage generator and used to measure the different positions of the moving magnet under the weight of the calibrated masses. The measured data were sent to a signal controller and then to a PC for postprocessing. The schematic of the static tests setup is represented in Figure 4a, and the picture of the static experimental bench is shown in Figure 4b.
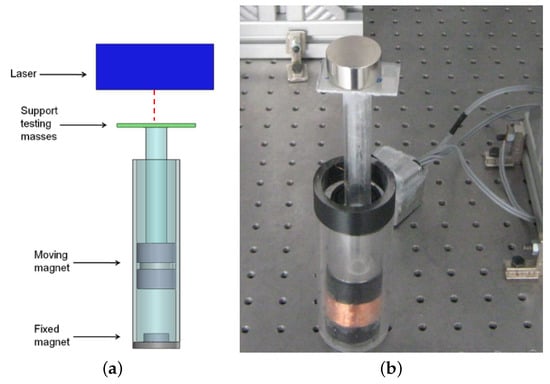
Figure 4.
Picture and scheme of the experimental static measures. (a) Scheme of the experimental static measures. (b) Picture of the experimental static measures.
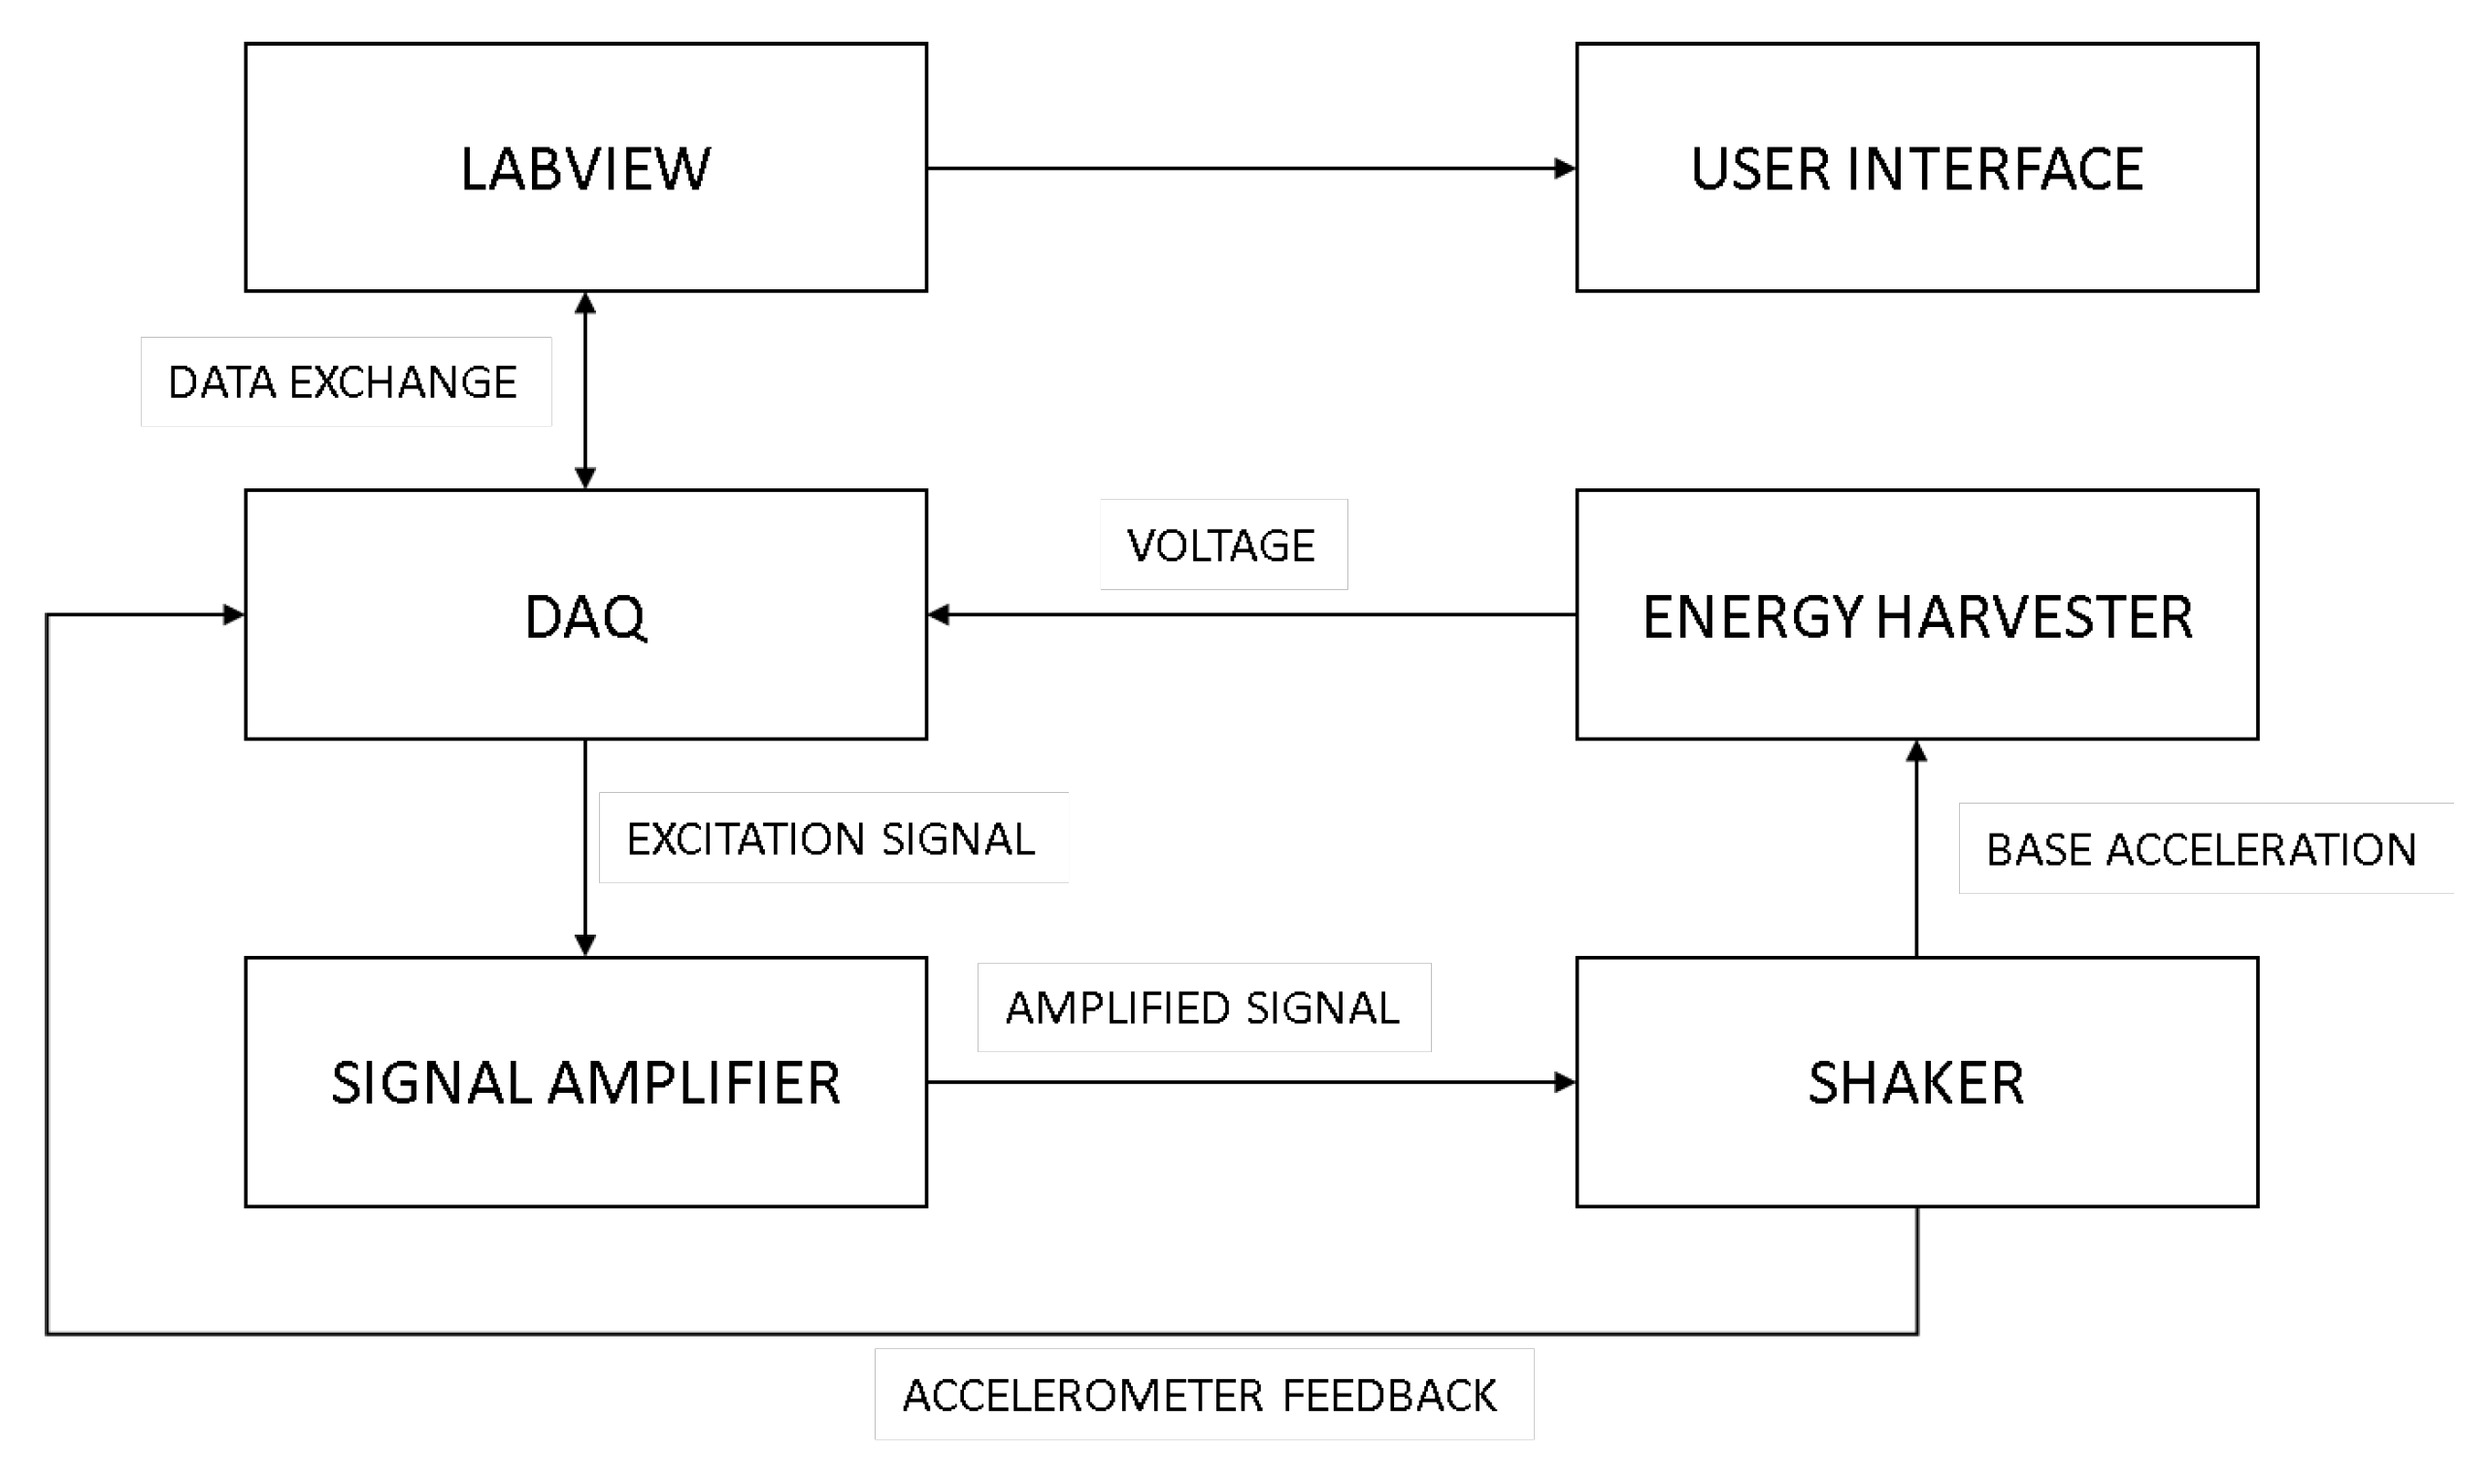
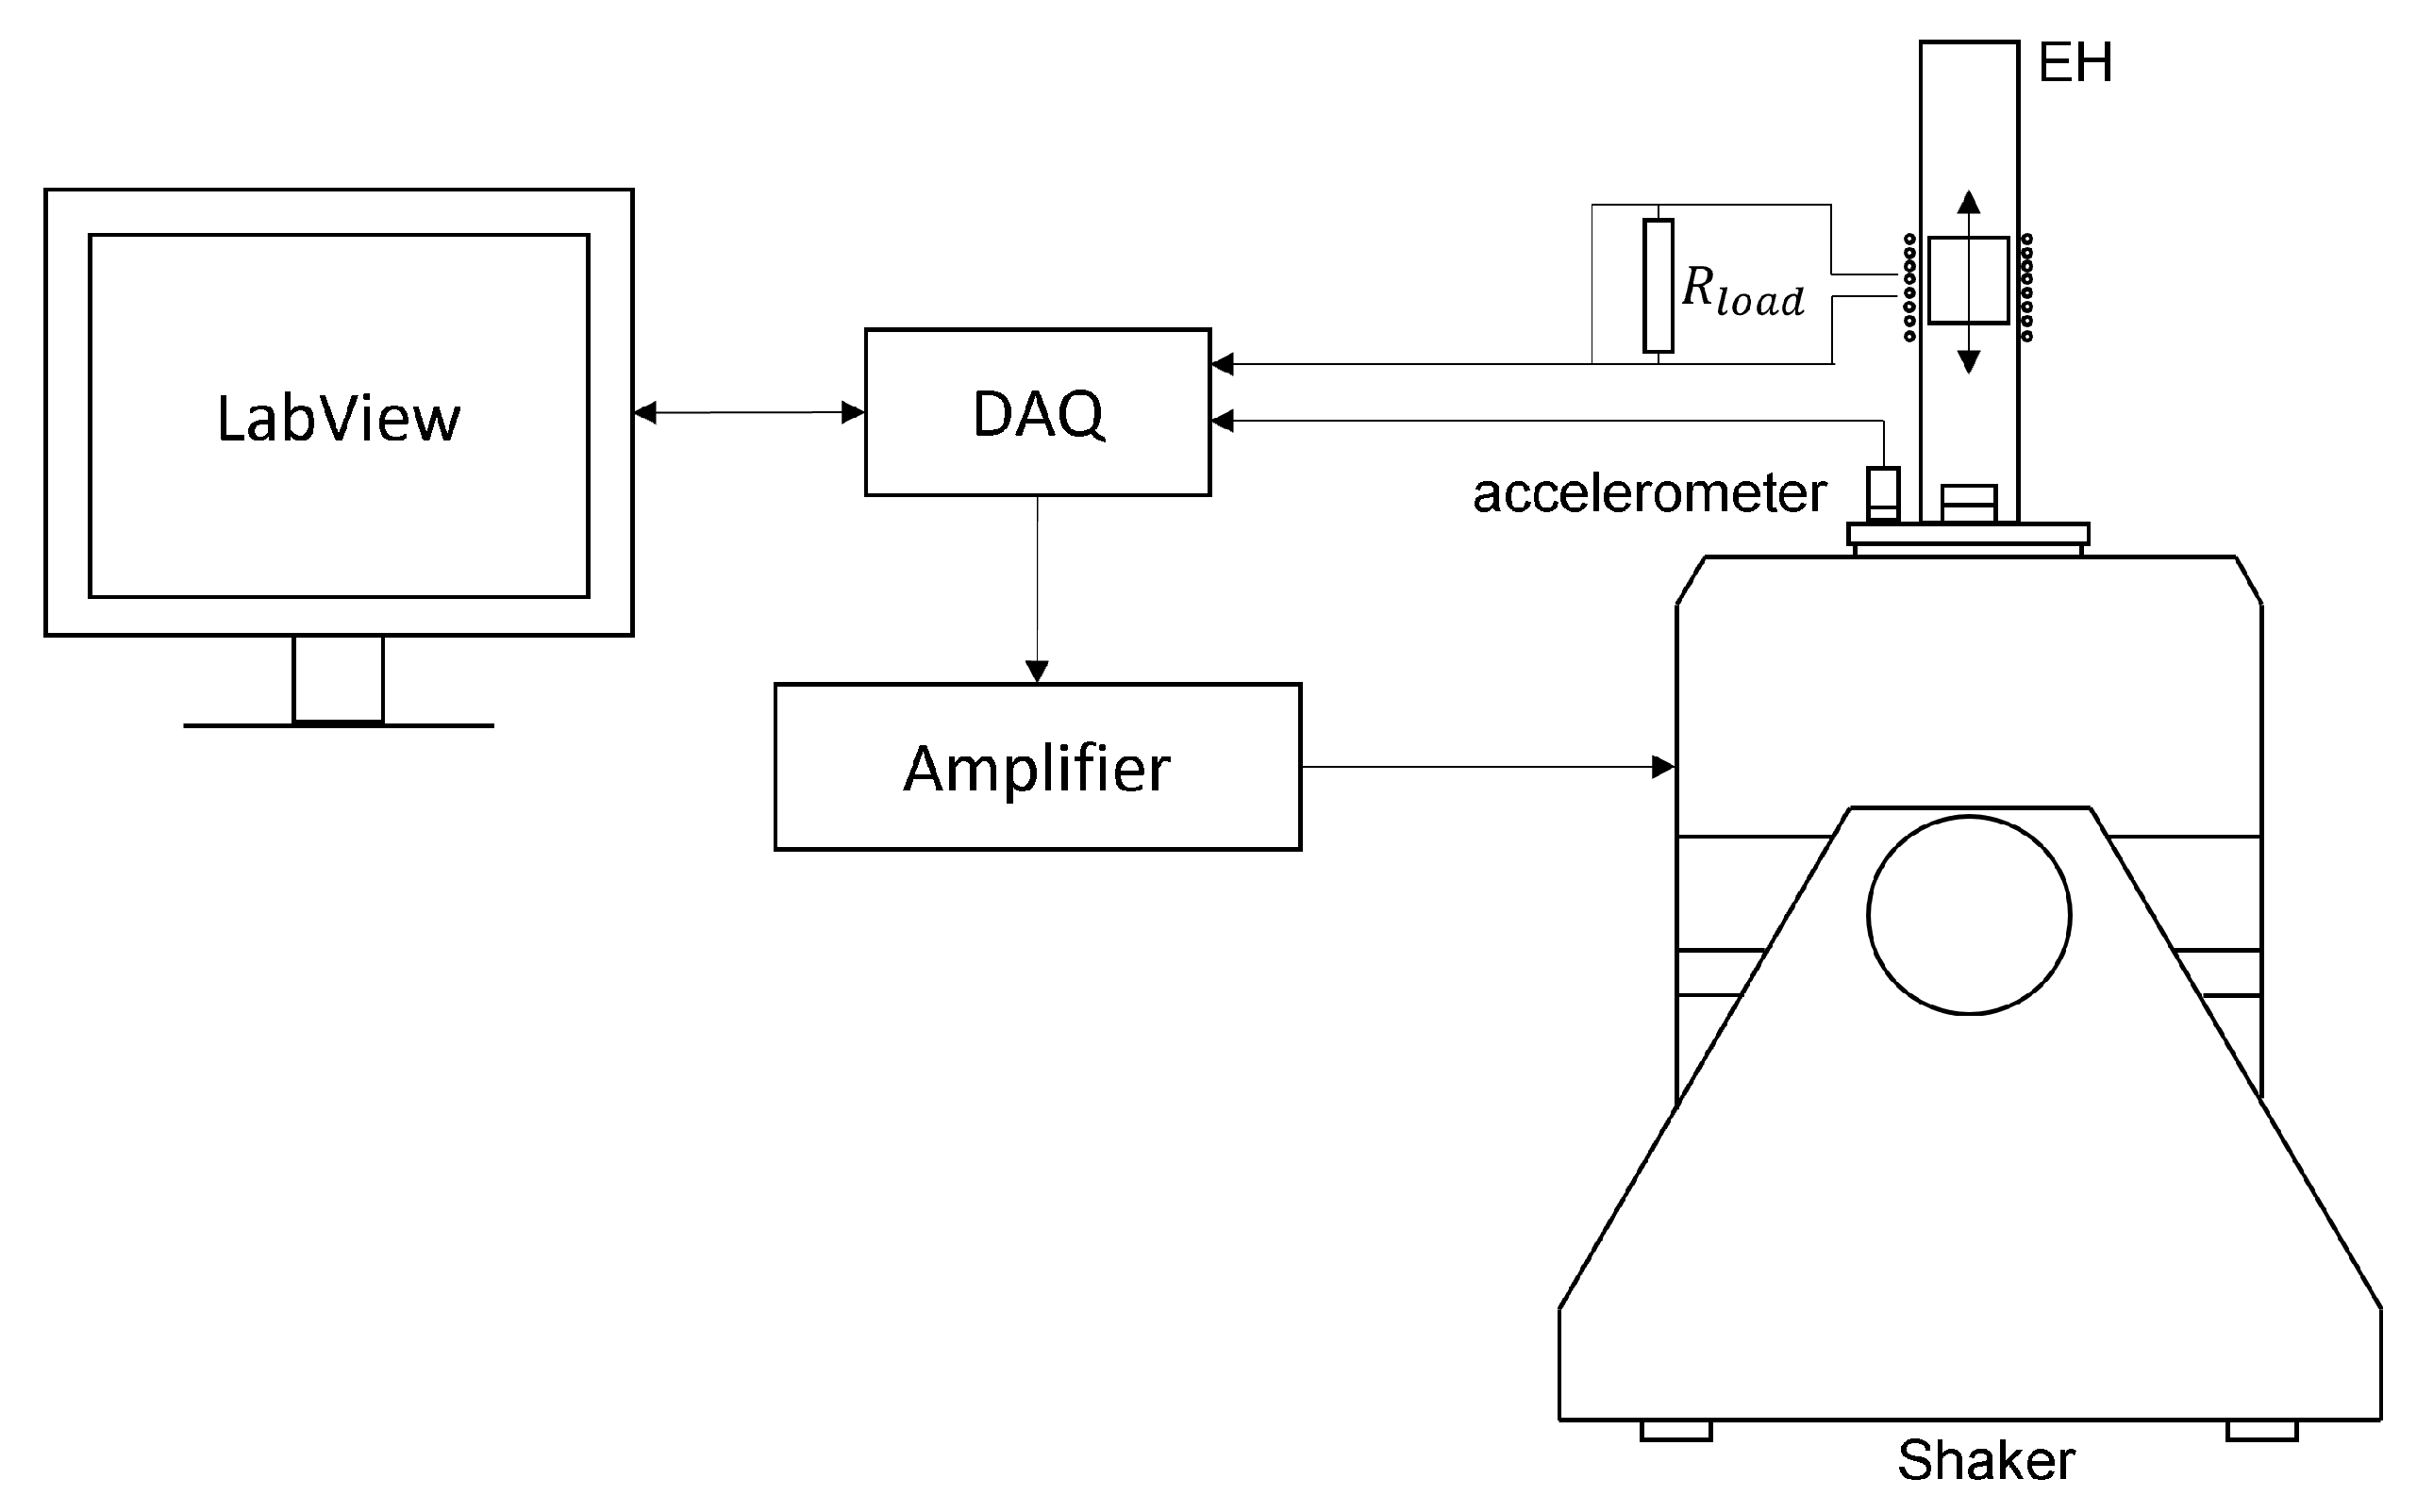
The dynamic characterization of the suspension and the measurement of the harvester performances were conducted with a shaker (TIRA TV51120) with its amplifier (BAA 500) with variable gain control (TIRA GmbH, Schalkau, Germany). LabView (National Instruments, Austin, TX, USA) was used to supply a sinusoidal voltage signal to the moving base of the shaker; the closed-loop feedback signal was provided by an IMI 608A11 piezoelectric accelerometer (PCB Piezotronics, Depew, NY, USA). The output voltage from the harvester was measured across the load resistor, whose value was chosen in order to obtain the maximum power. The scheme and a representation of the test bench are reported in Figure 5 and Figure 6.

Figure 5.
Input/output scheme of the experimental apparatus.
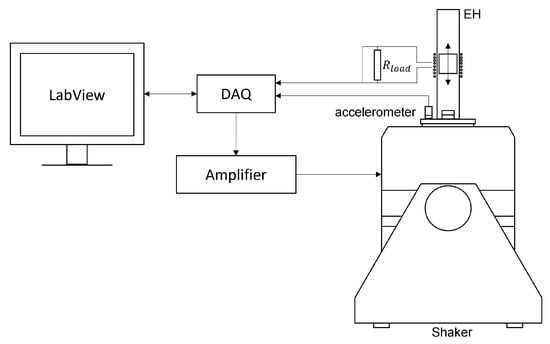
Figure 6.
Input/output scheme of the experimental apparatus.
4. Mathematical Model
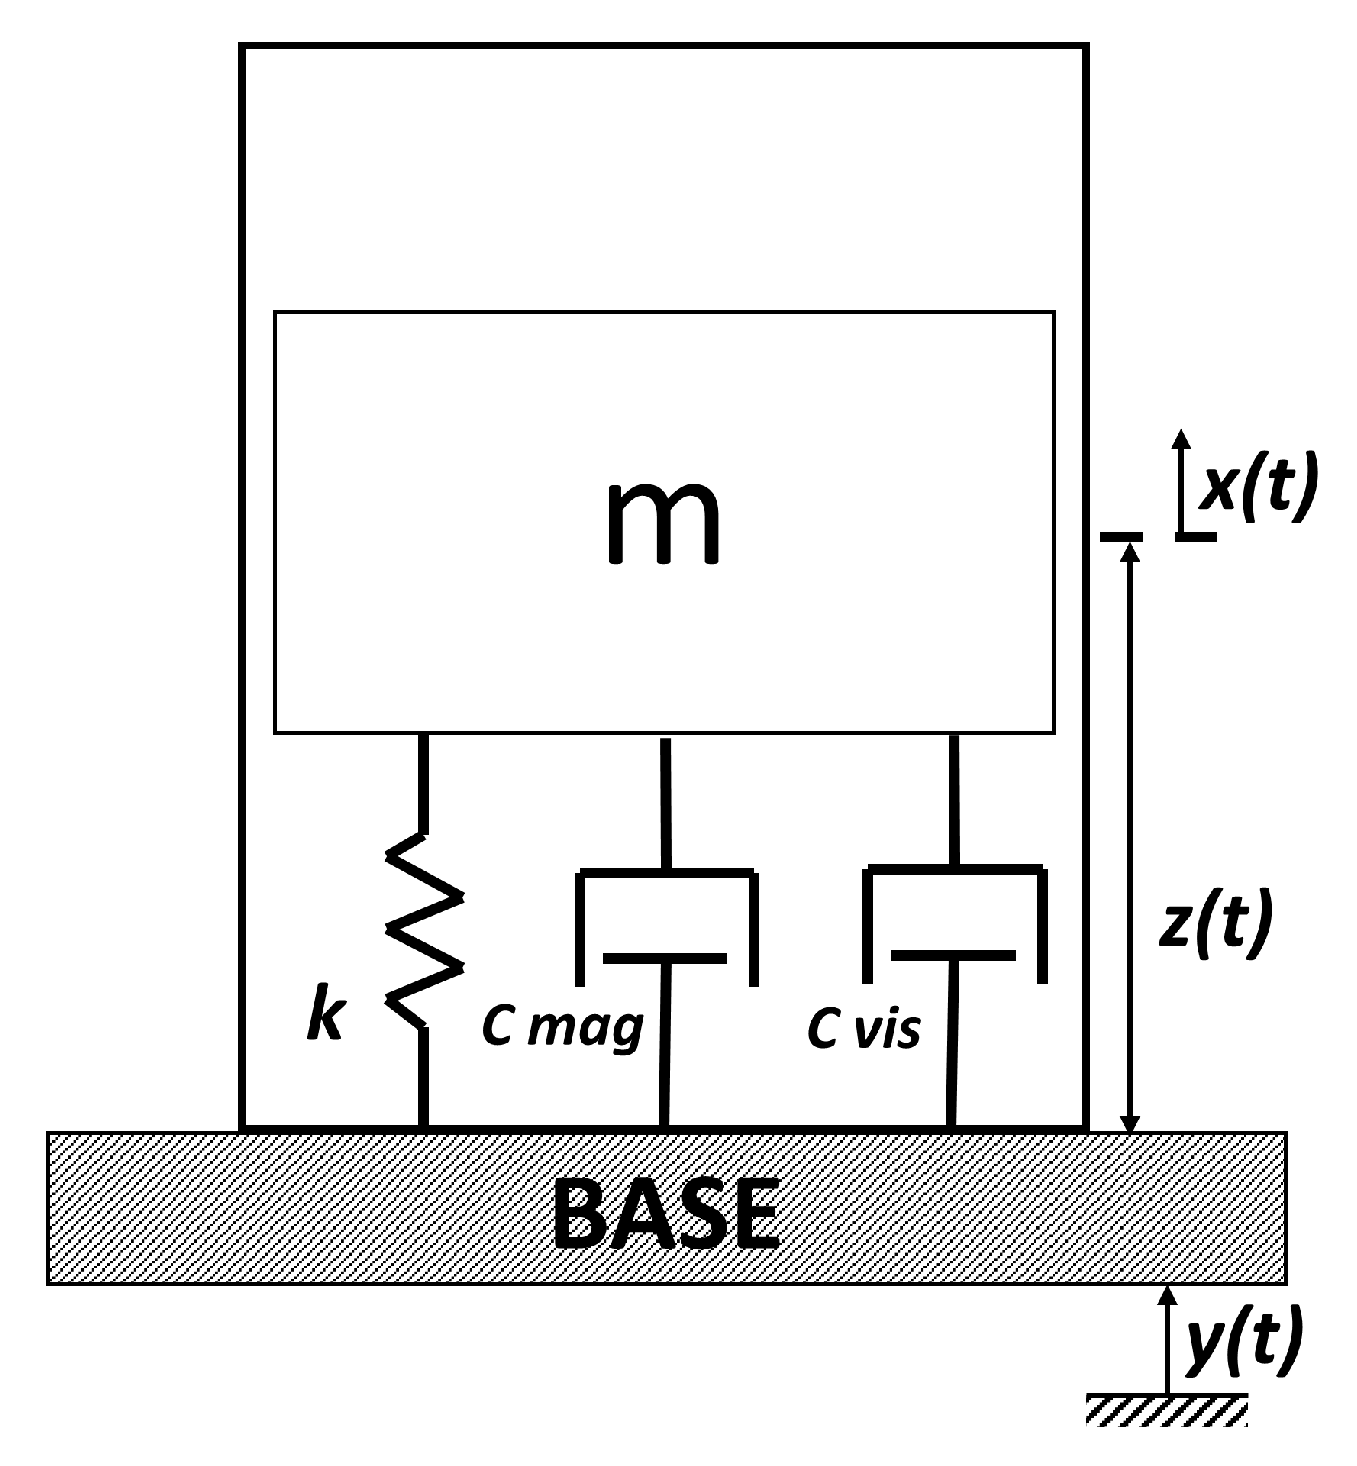
Roundy et al. [8] proposed the basic principles of the functionality of a vibration energy harvester. These generators consisted of a seismic mass m attached by means of a spring and a viscous damper to a moving base (Figure 7), and its analytical model was a 1 d.o.f mass–spring–damper system. The moving magnet had a relative motion z with respect to the base, which received an imposed sinusoidal input base displacement y. The vibrational external source made the seismic mass move out of phase with respect to the box. This relative motion between the mass and the base could drive a suitable transducer to generate electrical energy.
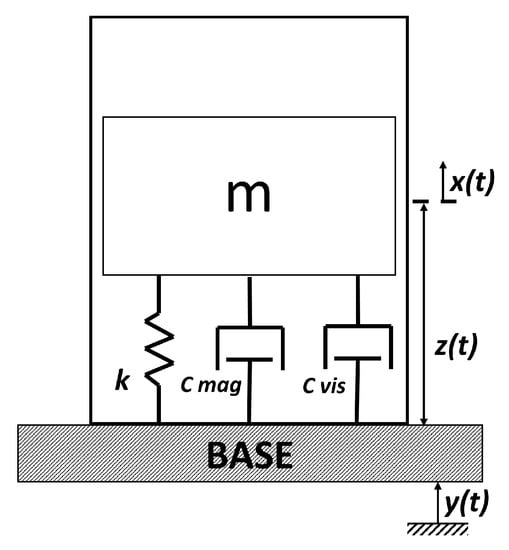
Figure 7.
The 1 d.o.f mass–spring–damper scheme model.
The magnetic interaction within the two magnets can be studied as a nonlinear magnetic spring. Moreover, the damping coefficient had two main components, the viscous one caused by the air trapped in the tube and the friction between the magnets and the internal surface of the tube; then, there was also the magnetic damping due to induction interaction between the moving magnet and the coils. The equation of motion can be written in terms of the relative motion, considering the starting position as the equilibrium of the moving magnet, when the repulsive magnetic force is equal to its weight. Thus, the absolute motion coordinate of the moving magnet x is related to the static equilibrium condition of the moving magnet .
Then, the form to introduce this equation into MATLAB Simulink is:
where:
- m is the mass of the moving magnet;
- is the sum of viscous damping and magnetic damping ;
- k is the magnetic nonlinear stiffness;
- is the acceleration amplitude (in this case, it is sinusoidal);
- is the excitation frequency.
In Table 5, the main Simulink blocks, identified by the blue numbered labels in Figure 8, are described to have a better understanding of the Simulink model implementation.
Table 5.
Main Simulink blocks.
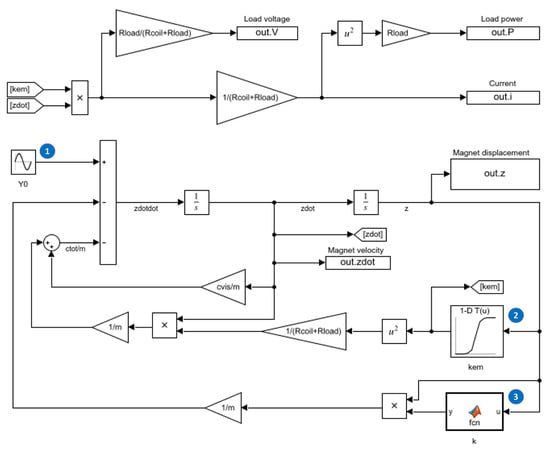
Figure 8.
Simulink model of the energy harvester.
The model built in MATLAB/Simulink allowed studying the dynamic behavior of the system and the interaction between its mechanical and electrical parts in a single simulation. Moreover, it was possible to introduce the nonlinear characteristic of the system into the model in a straightforward way. In detail, the stiffness characteristic was modeled as a MATLAB function block, which received as the input the instantaneous moving magnet position (z) and computed the output stiffness, as explained in the next Section 4.1. To introduce the electromagnetic coupling coefficient, a 1D lookup table was used, which received as the input the instantaneous moving magnet position (z) and computed the output as is explained in the next Section 4.2. To give a complete description of the simulation model, the settings for the main model parameters are reported in Table 6.
Table 6.
MATLAB/Simulink model settings.
4.1. Mechanical Model
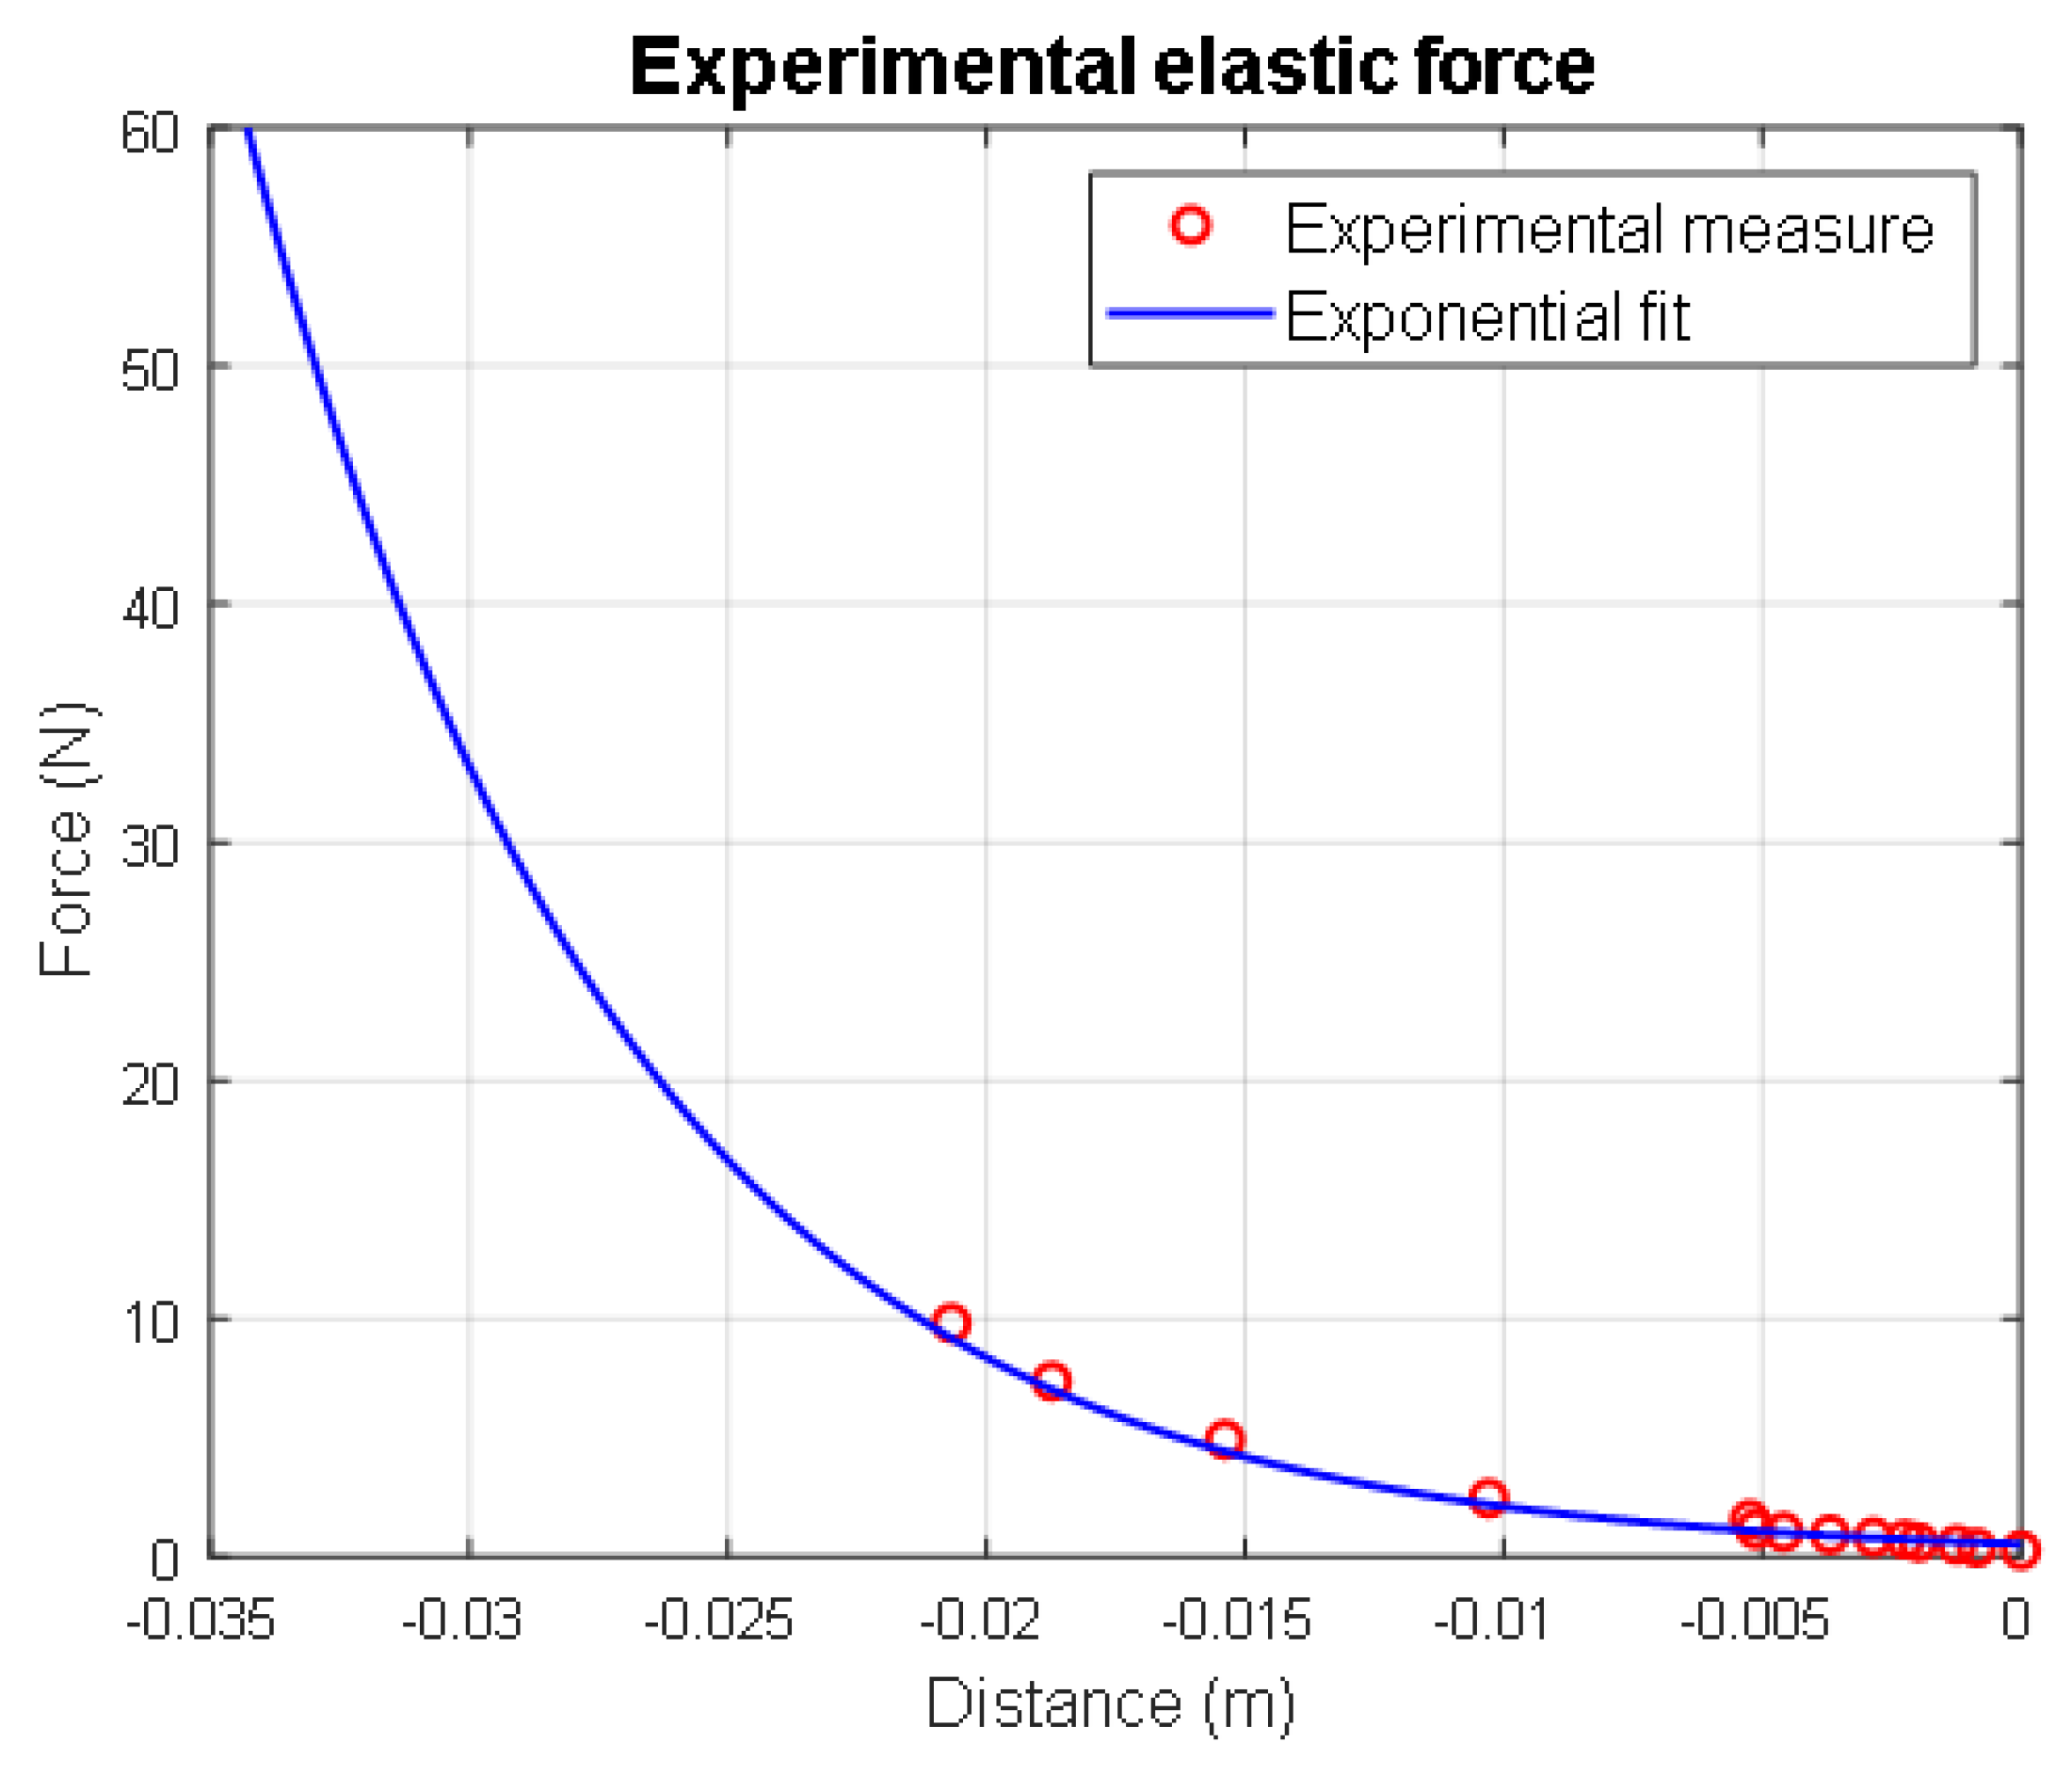
The stiffness of the magnetic suspension is directly influenced by the properties of the two magnets. By varying their dimensions, masses, and magnetization, it is possible to obtain different nonlinear characteristics of the spring. The experimental data regard the stiffness values of the suspension when the moving magnet is pressed versus the fixed one by the application of the calibrated masses. Since the equilibrium position was assumed as the origin of the z-axis, these stiffness values refer to a negative position of the moving magnet. The stiffness numerical model was obtained by finding the best fit of these experimental results. The chosen relation between the magnetic force and the displacement of the moving magnet is an exponential equation, as is shown in the the Figure 9.
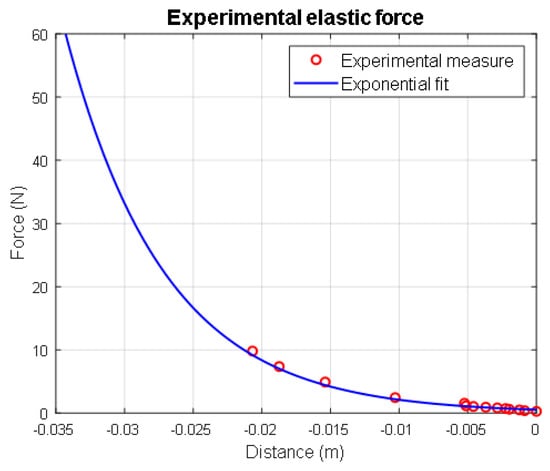
Figure 9.
Overlap of the experimental and exponential fit of the magnetic stiffness.
The zero position coincides with the equilibrium position of the magnet . The magnetic force equation is expressed in the form:
Subsequently, the stiffness can be obtained from the derivative of this equation:
This allows computing the stiffness in the equilibrium position and obtaining the natural frequency of the linear system.
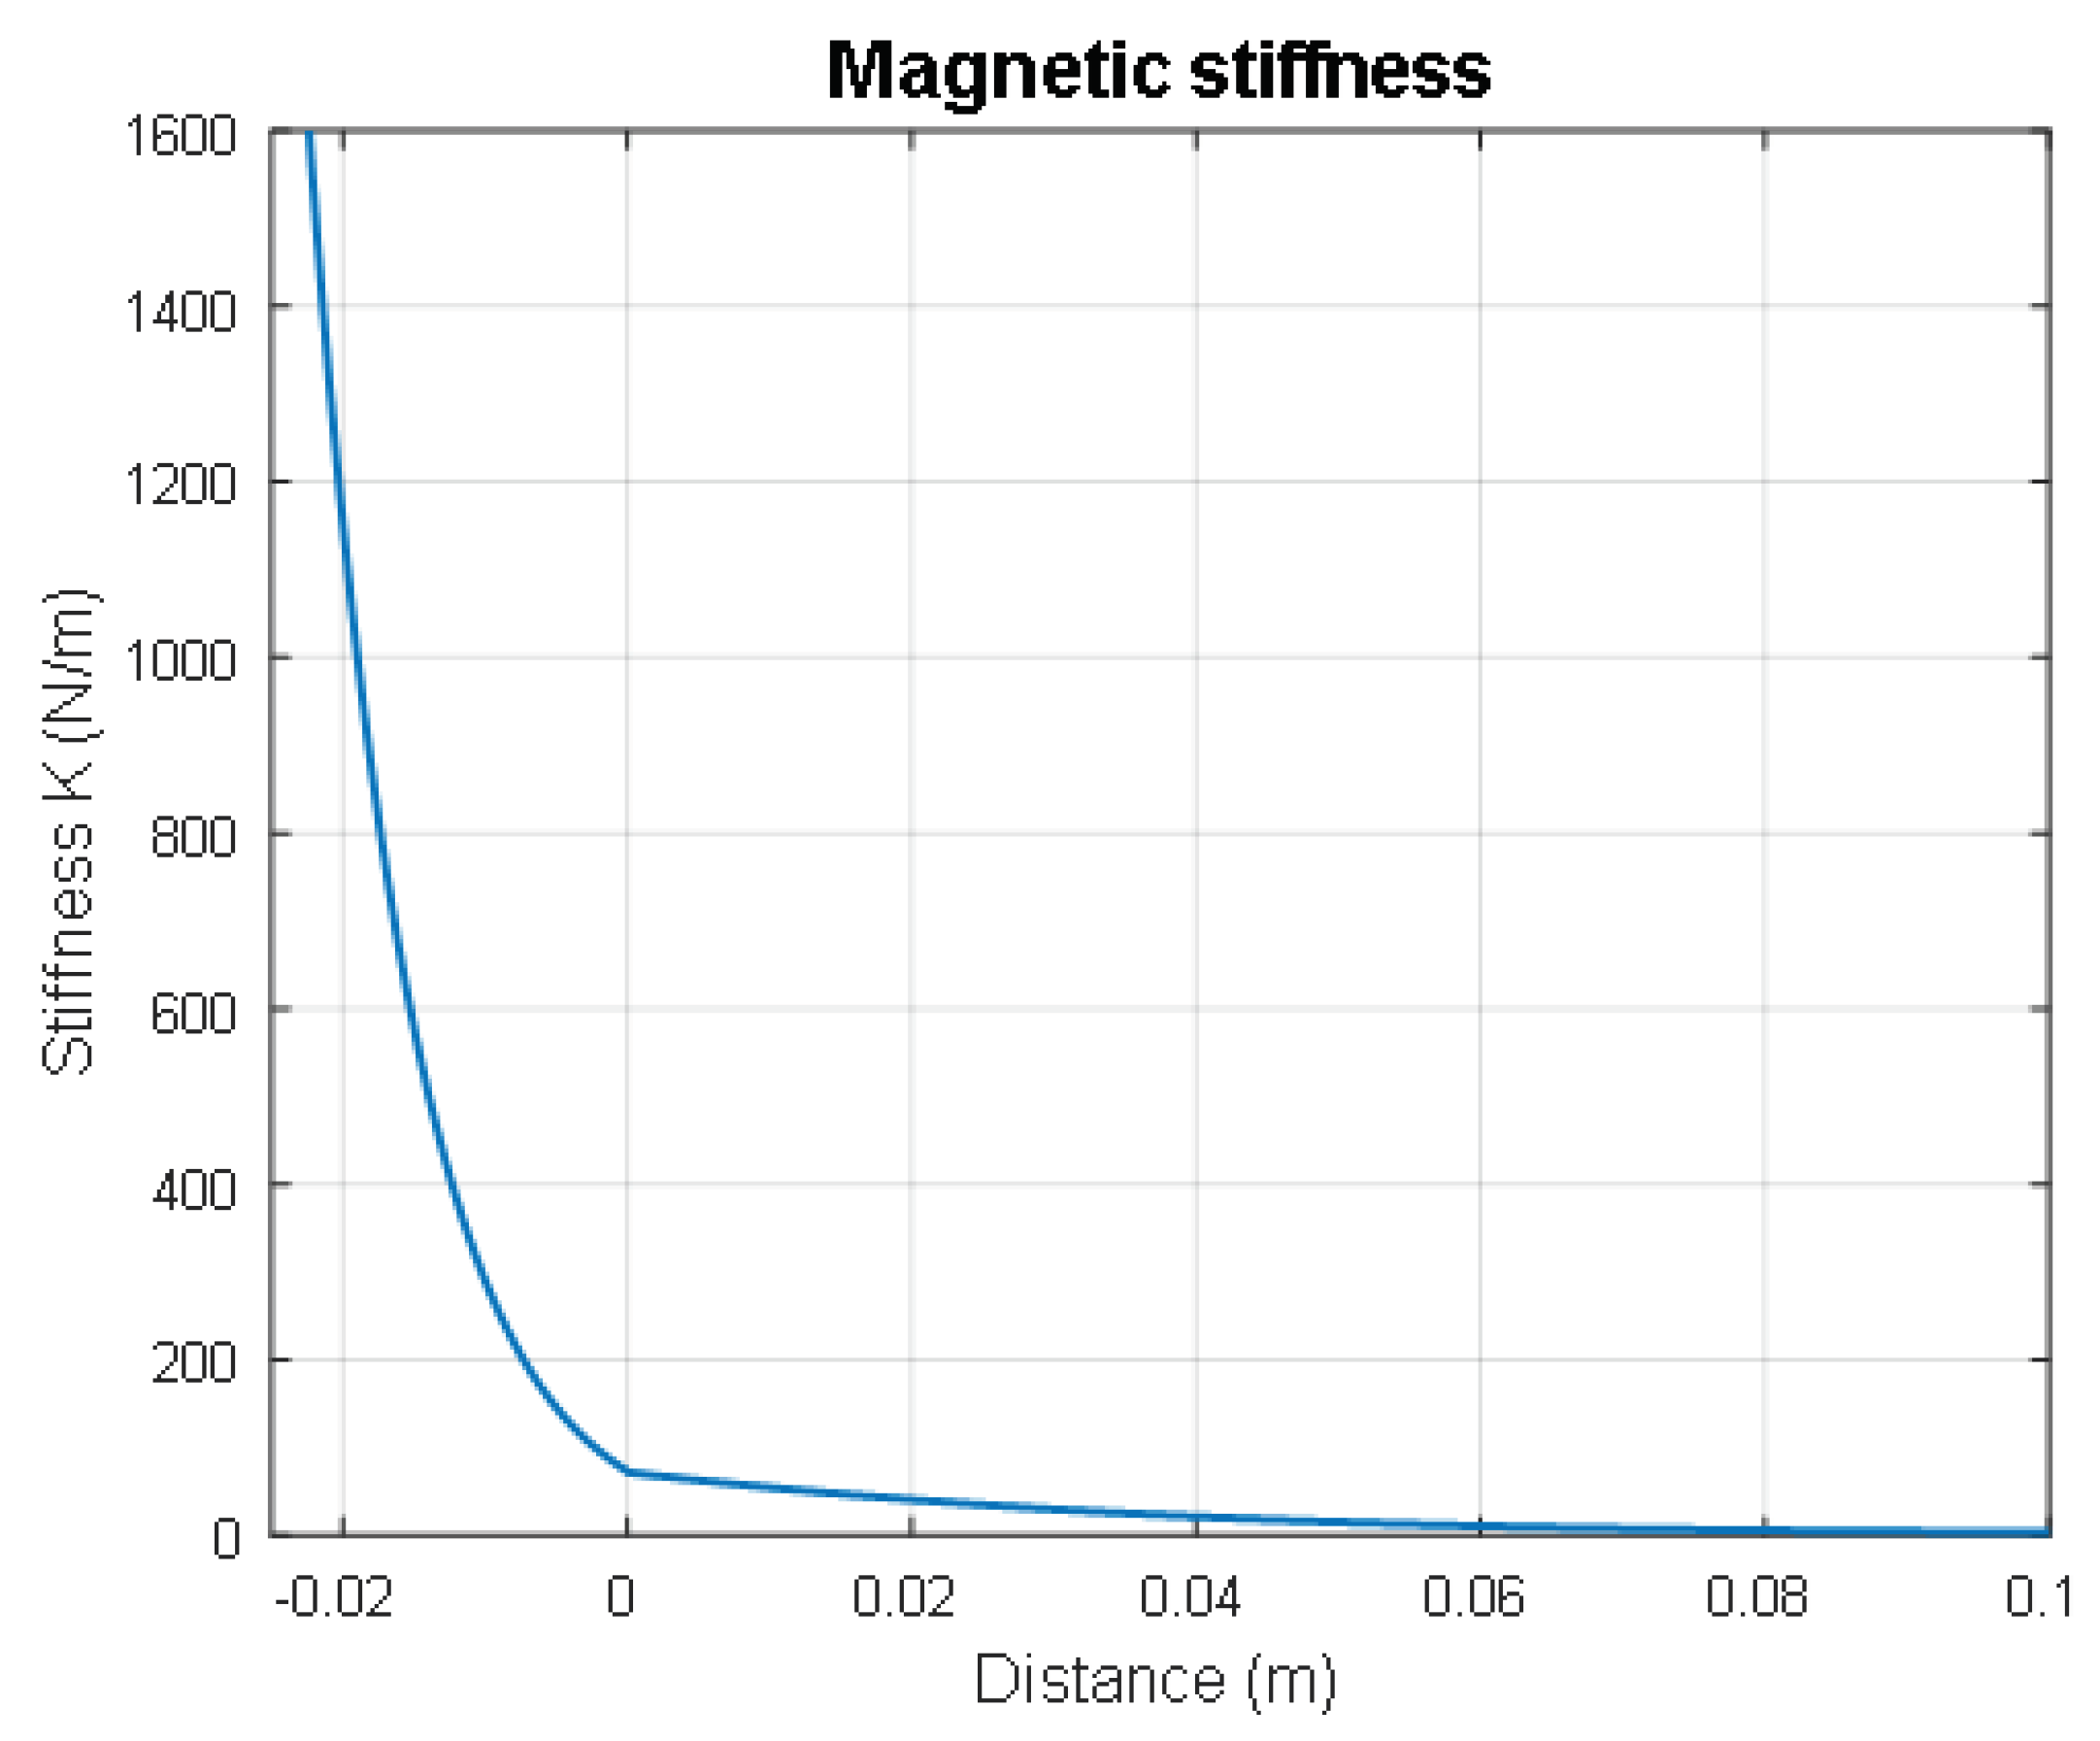
However, the introduction of the previously described exponential stiffness also for the positive values of the z-axis into the MATLAB/Simulink model resulted in an inaccurate description of the real behavior. This inaccuracy was brought to light by a too low stiffness, causing resonance peaks at lower values with respect to the experimental results. To overcome this problem, the stiffness for the positive z-axis was interpolated as a polynomial equation between the value of stiffness in z = 0 and a supposed value at the extreme position of the cylinder, found by trial and error to have the best superimposition of the numerical and experimental resonance peaks, the result is shown in Figure 10. The final expression of the stiffness of the magnetic spring results:
where:
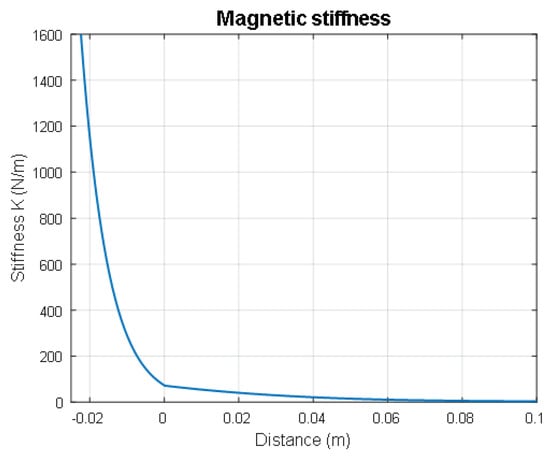
Figure 10.
Exponential magnetic stiffness and cubic polynomial fit when the magnet moves away from the fixed one.
- a = 0.53
- b = −137.9
The mechanical action of the air and the friction between the cylinder’s inner surface and the moving magnet were modeled as viscous damping. The damping ratio coefficient was evaluated experimentally by exciting the harvester with a step input on the dynamic test bench. The output voltage generated in time by the device was then processed, and the coefficient was obtained through its logarithmic decrement. Its value increased when the moving magnet velocity decreased, leading to nonlinear viscous damping depending on the oscillation amplitude of the moving magnet. This phenomenon was caused by tolerance errors in the inner surface of the cylinder, leading to variable friction with the moving magnet during its motion. The nonlinear viscous damping had a minimum when the moving magnet was in resonance and a maximum when it oscillated around the equilibrium position. For the sake of simplicity in the Simulink model, constant viscous damping having the value obtained by the mean logarithmic decrement was introduced, obtaining a good approximation. Since Harvesters 1 and 2 had the same cylinder and magnets, they had the same viscous damping ratio, equal to .
4.2. Electromagnetic Model
The purpose of this study is to evaluate the output power generated on the load both by numerical and experimental analysis. The tests on the experimental bench returned the load voltage value, and the corresponding power could be computed. By applying the Kirchoff laws to the circuital part of the system (Figure 11), it was possible to relate the voltage produced by the harvester to the output power on the load.
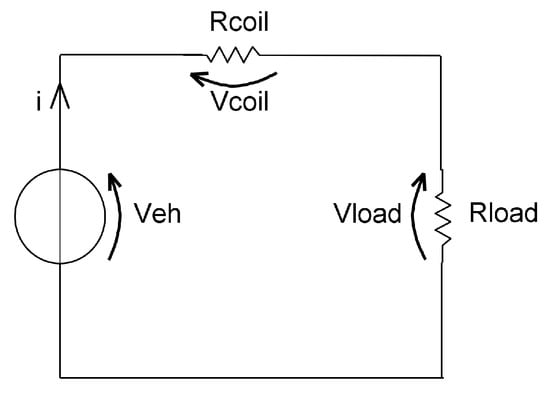
Figure 11.
Electrical circuit of the energy harvester.
The electromagnetic damping was introduced to the nonlinear model of the energy harvester by analyzing its circuital part. Another damping force component can be introduced in the equation of motion considering its dependence on the velocity state.
where:
- is the electromagnetic coupling coefficient;
- is the variation of the magnetic flux on the z-axis;
- is the voltage generated by the harvester;
- is the electromagnetic damping;
- is the electromotive force.
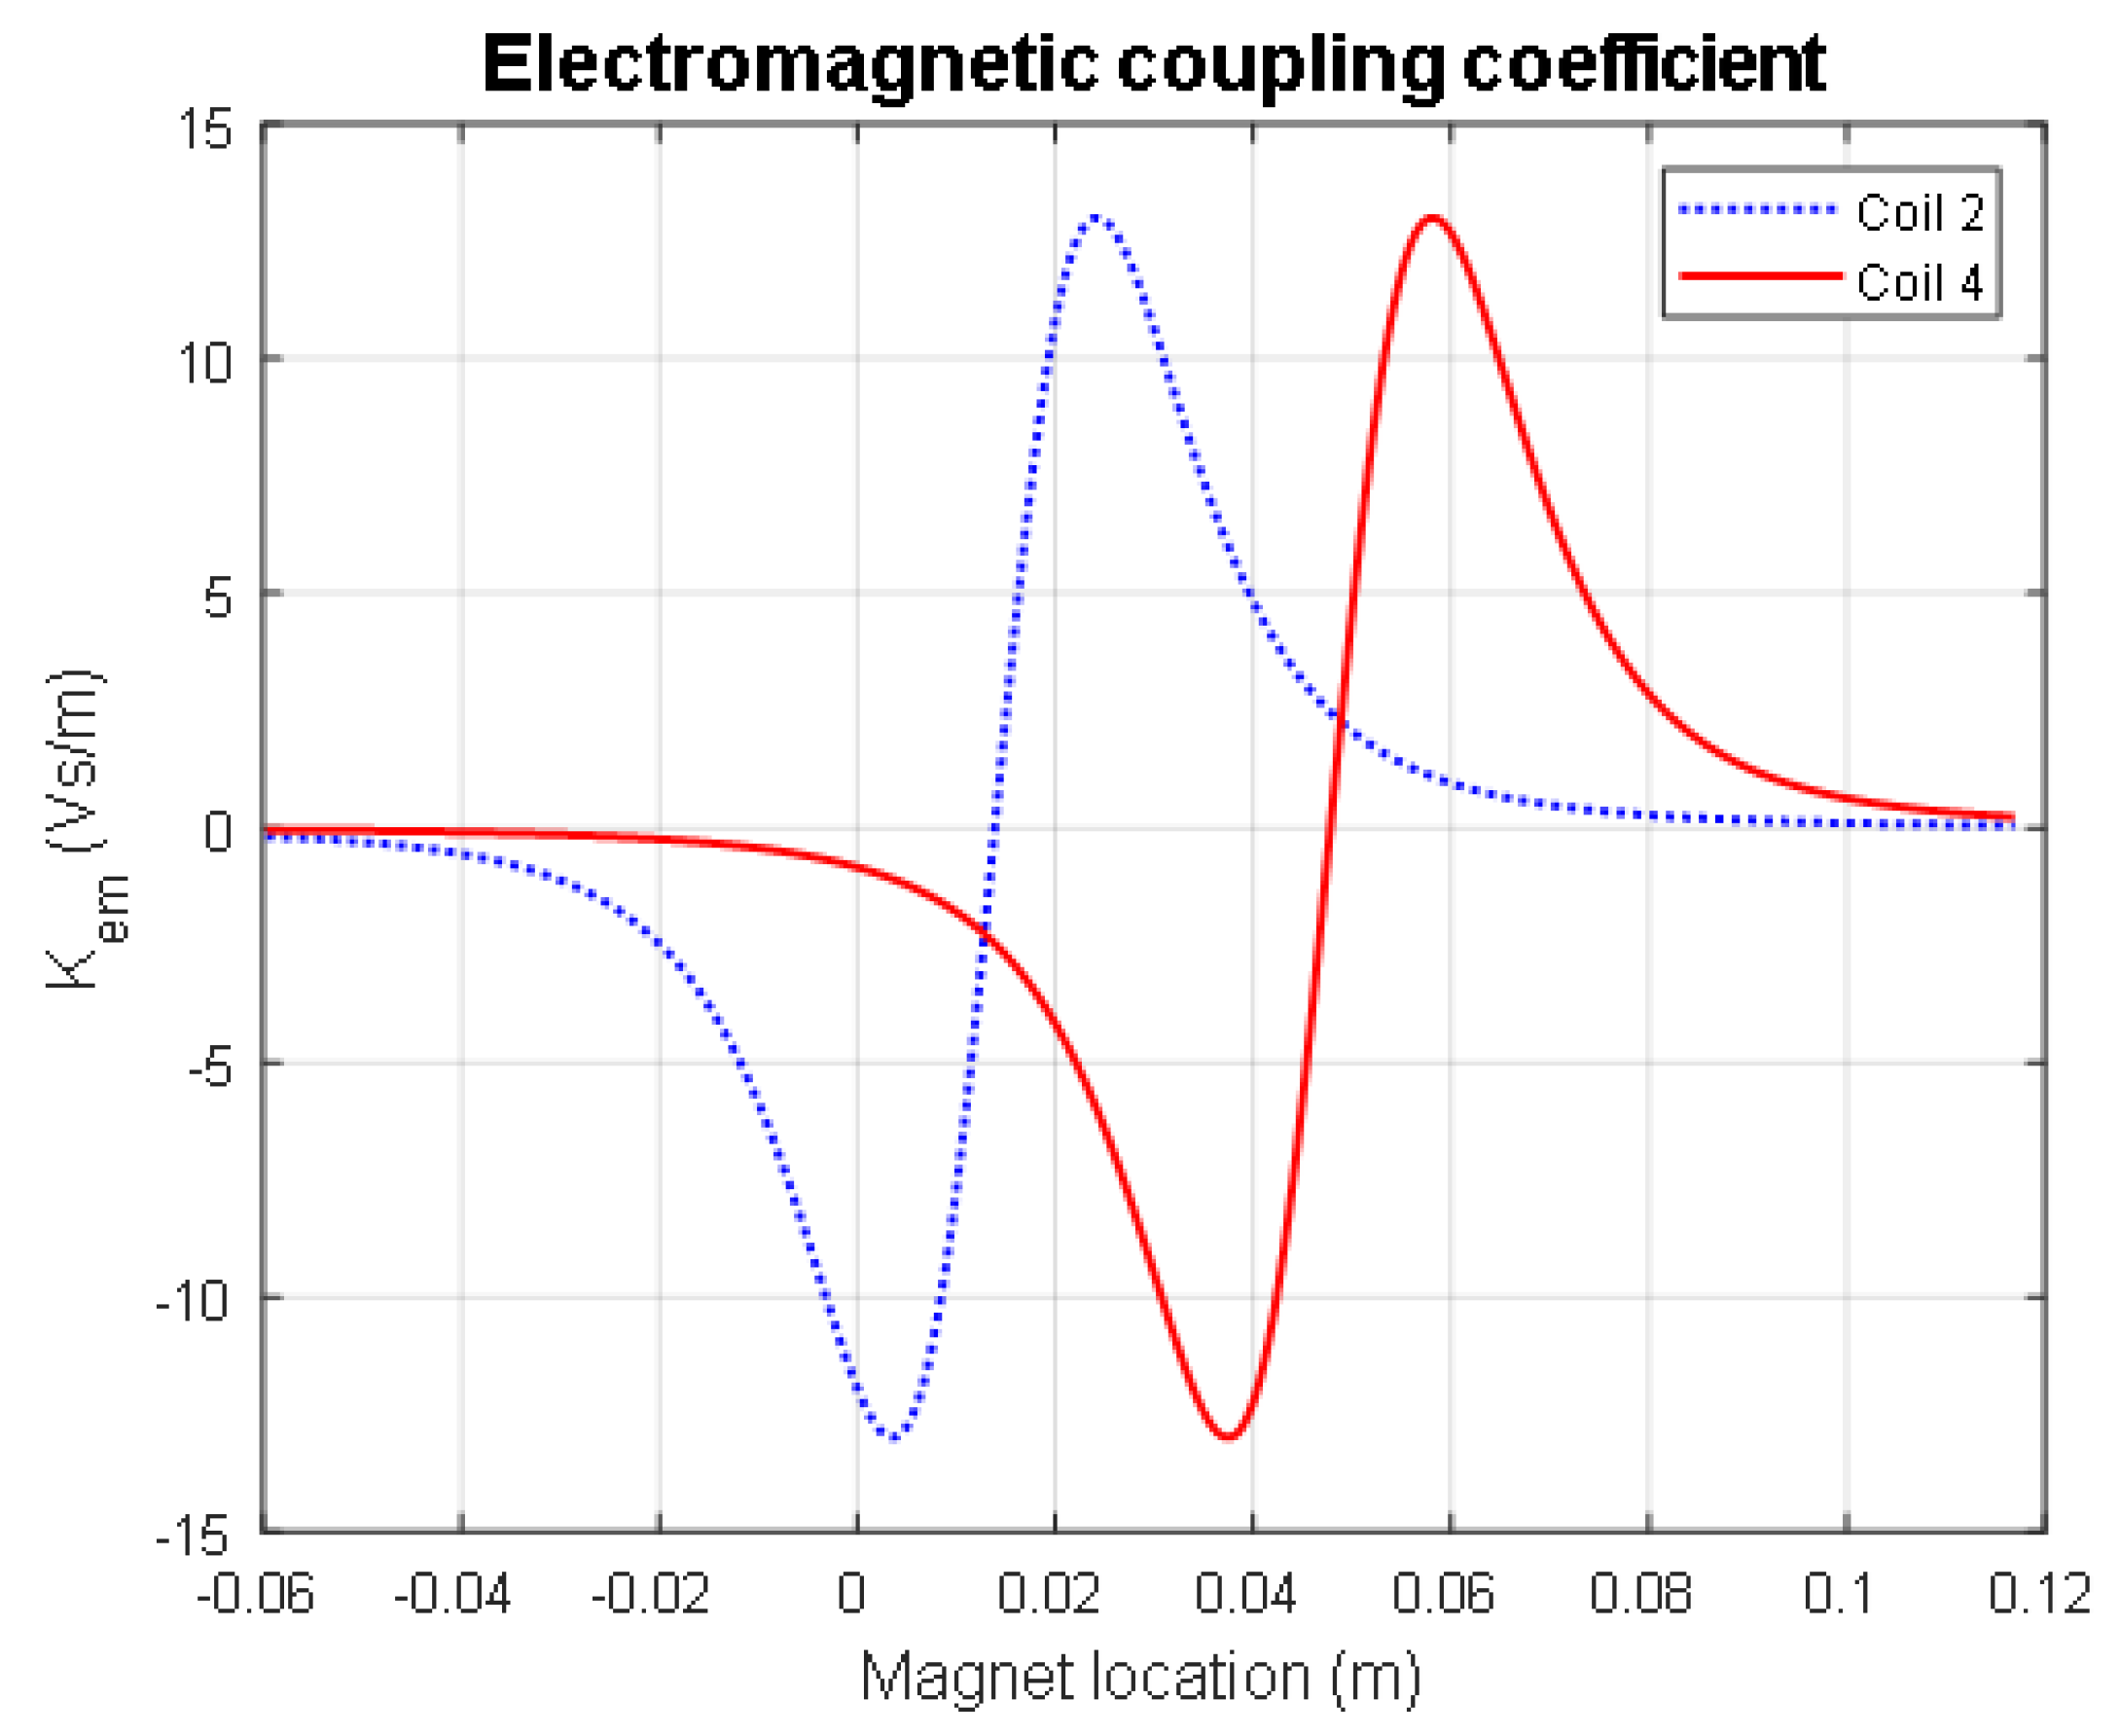
The electromagnetic coupling coefficient links the electric with the mechanical variables of the system. Considering it as a constant leads to an approximation, because, as the moving magnet travels in the tube during vibration, its flux linkage with the coils varies. In addition, the coils have a non-negligible extension along the axial direction, so the coefficient has another degree-of-freedom related to the position of the coil compared to that of the moving magnet. For this reason, the axial location of the coil is an important variable that needs to be studied to find the optimum value of the output power. To derive the coefficient values, the magnetic flux produced by the moving magnet through the winding should be evaluated. Considering the radial magnetic field produced by the cylindrical magnet, assumed to be a dipole, the relation between the electromagnetic coefficient and the position of the magnet is obtained [20,21]:
where:
- is the total length of the coil;
- is the volume of the coil;
- are respectively the inner and outer radius of the coil;
- are respectively the height of the first and last turn of the coil;
- is the magnetic constant;
- is the moving magnet volume;
- m is the magnetic moment of the dipole.
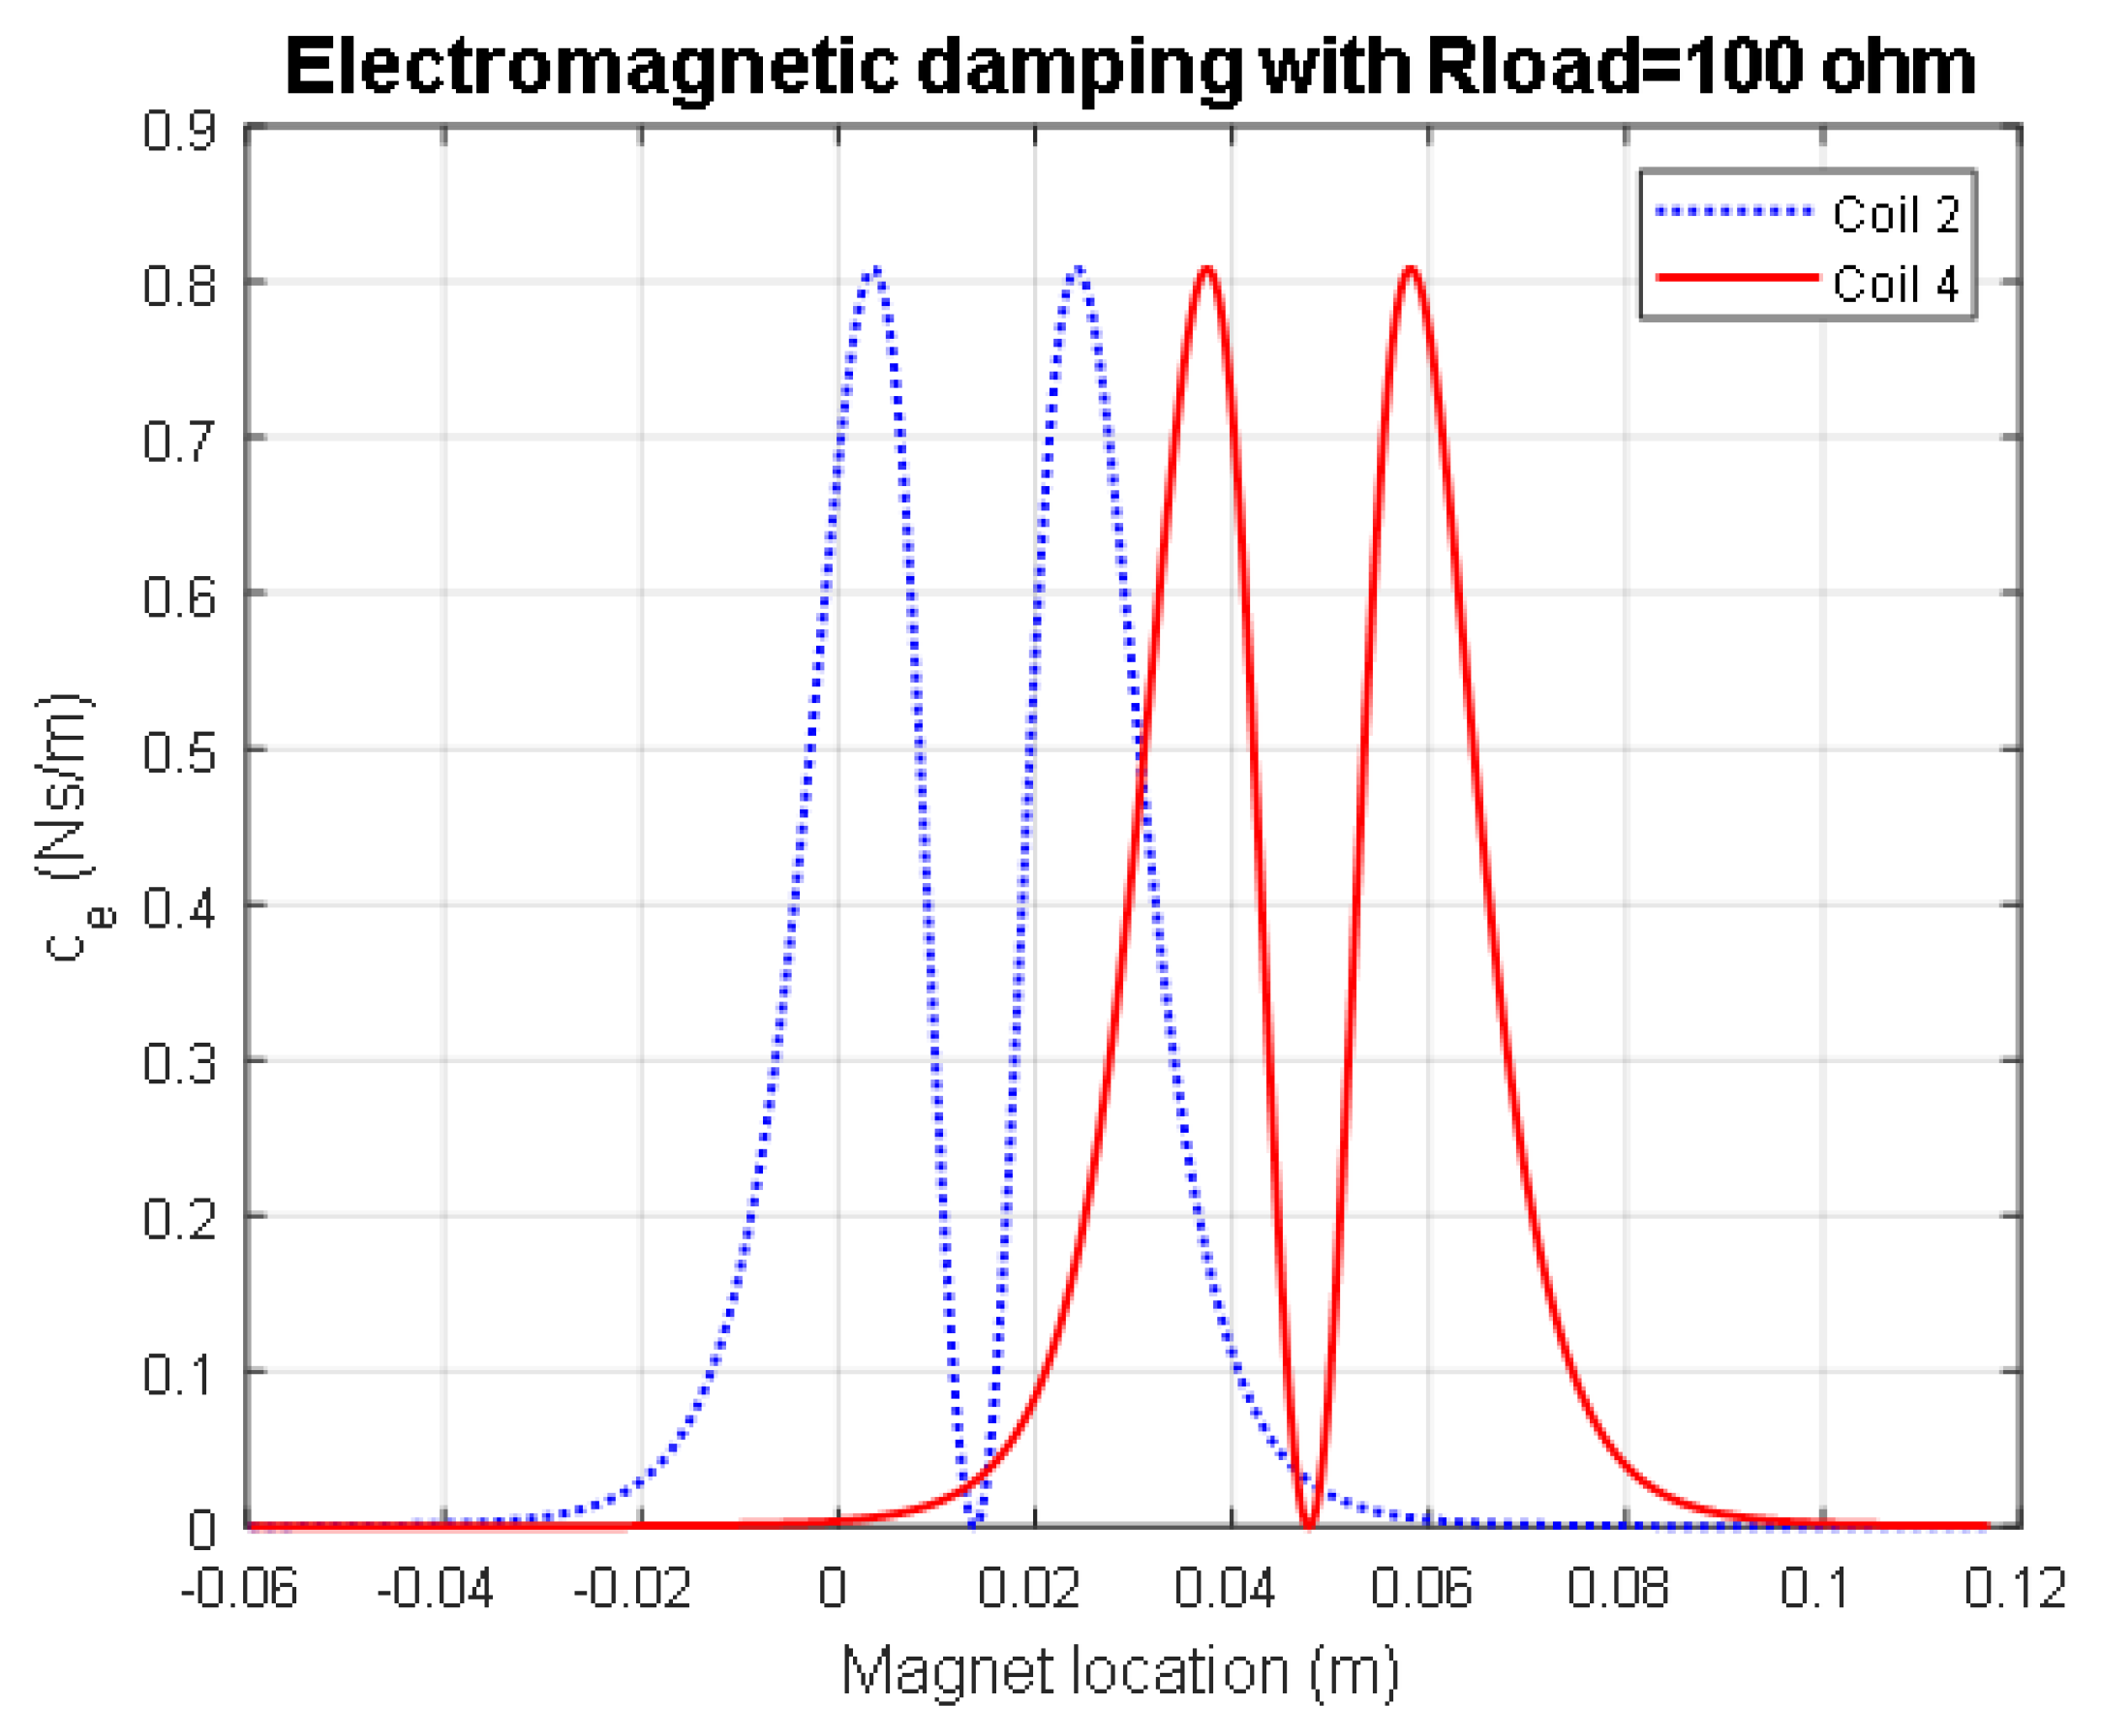
In Figure 12 and Figure 13, the plots of the electromagnetic coefficient and damping with respect to the magnet position for Harvester 2 are reported. The height and axial location of the coils have a direct effect on the electromagnetic circuit in terms of shifting these curves along the x-axis, changing thevalue of the coefficients at a certain magnet position during vibration.
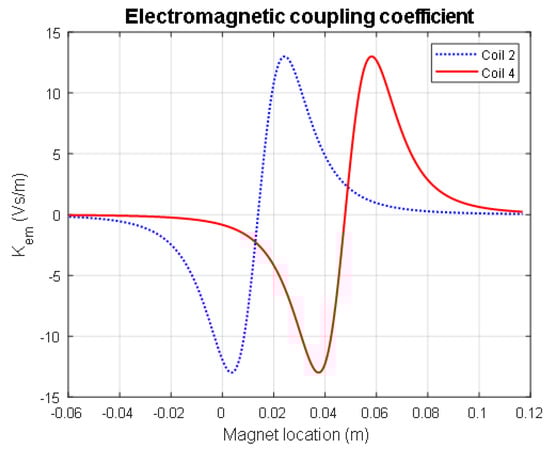
Figure 12.
Electromagnetic coupling coefficient for Coils 2 and 4 over the extension of the harvester.
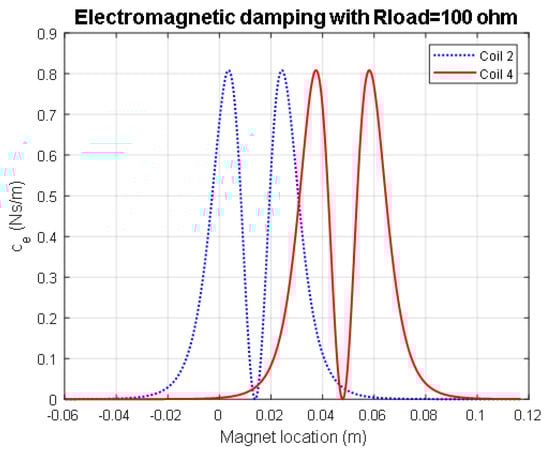
Figure 13.
Electromagnetic damping for Coils 2 and 4 over the extension of the harvester.
5. Experimental Results
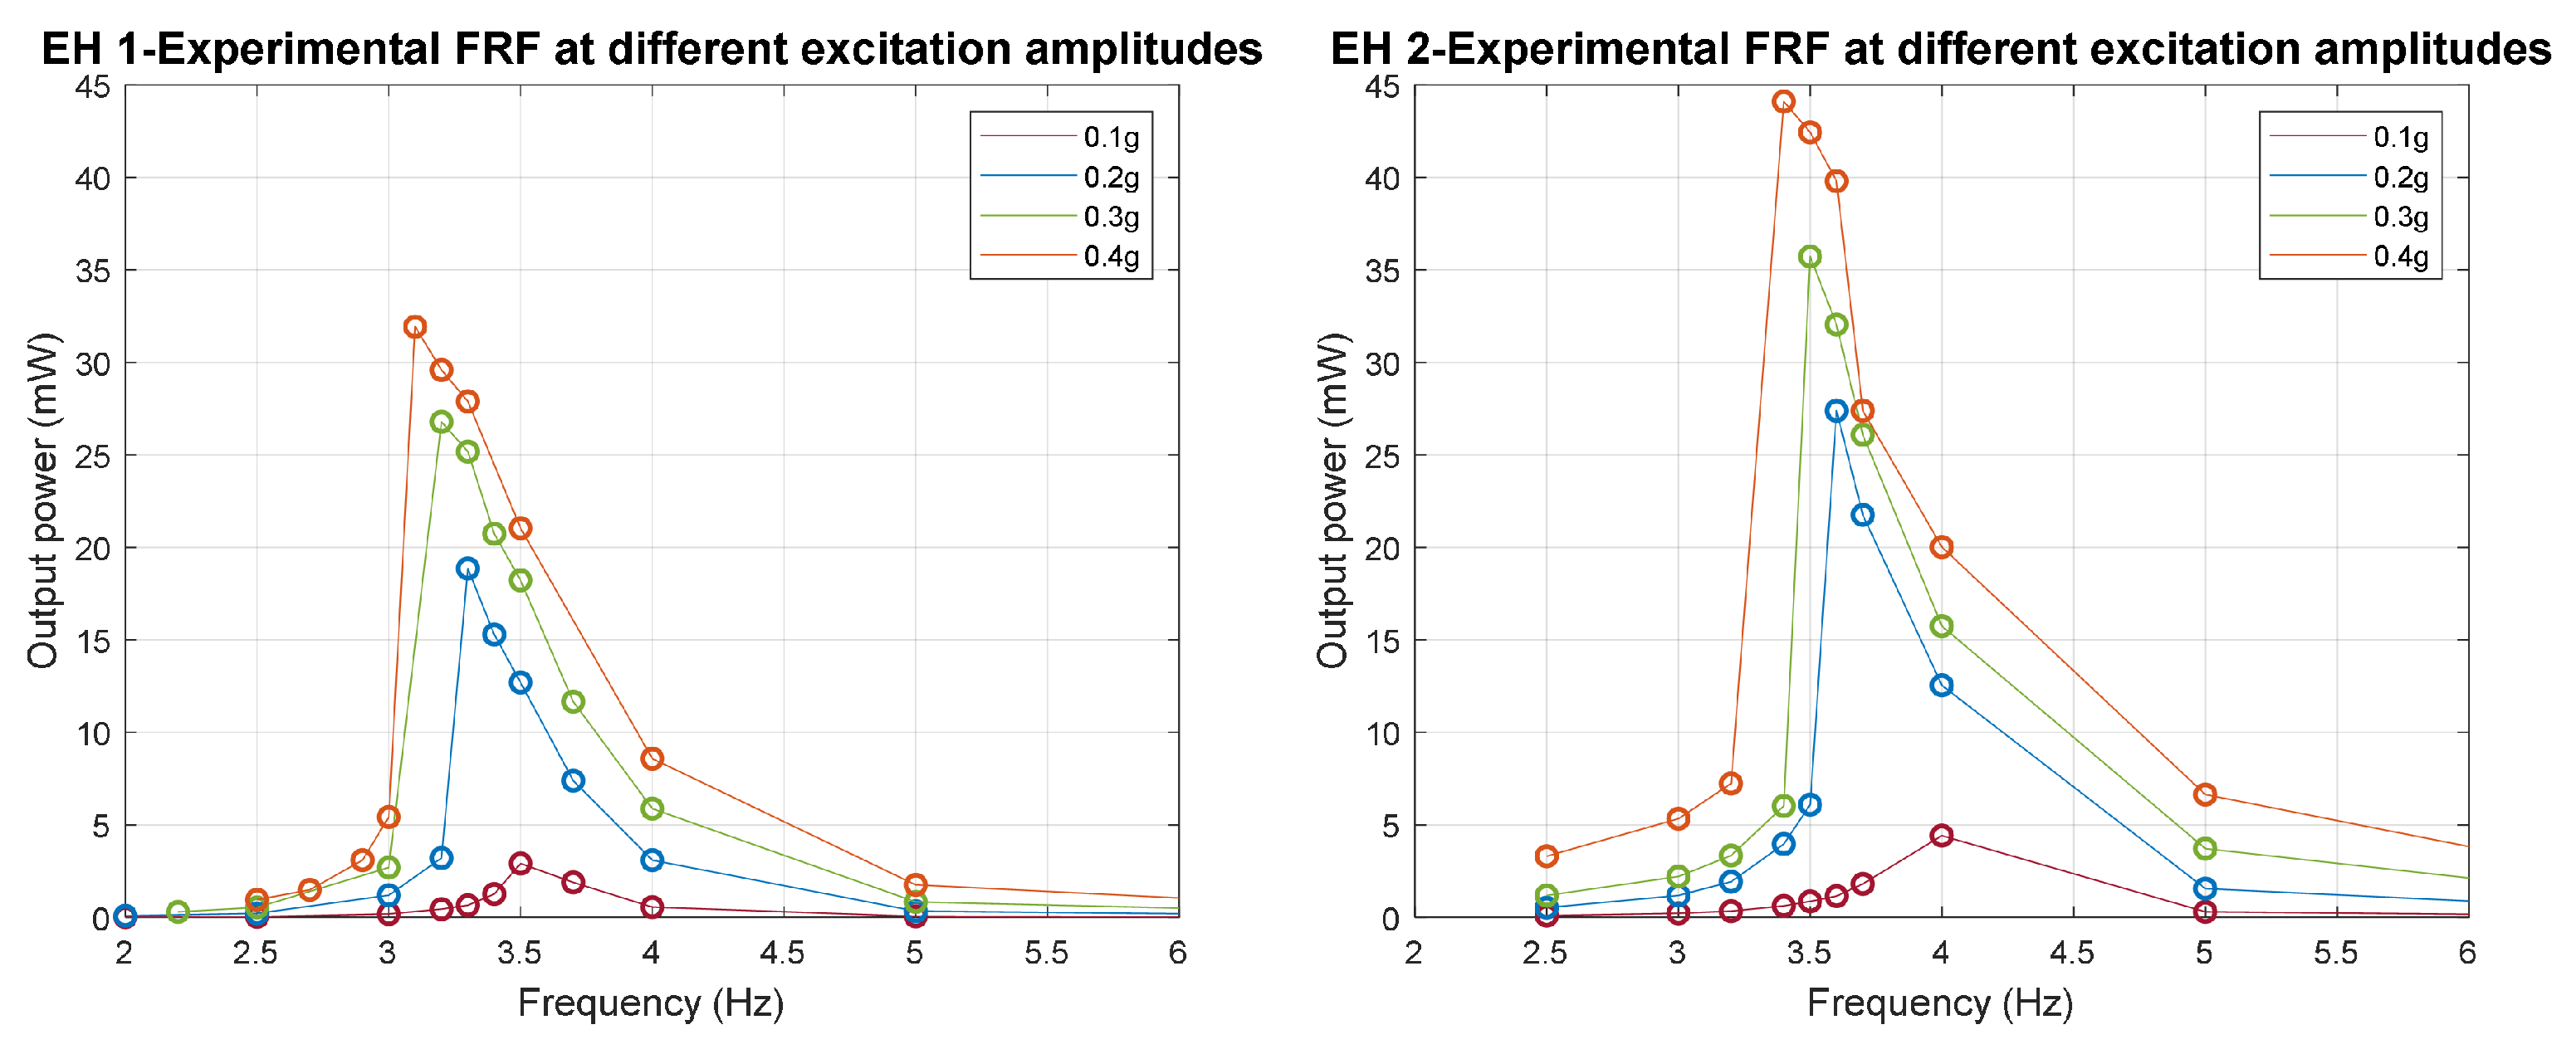
In this section, the experimental results are given and their comparison with the numerical model is proposed. The most relevant experimental results are the frequency response function (FRF) and the load response. The experimental tests returned as the output the voltage on the load, whose value could be used to derive the current, and finally, the power. The FRF is expressed in terms of RMS power, and it was computed using an optimum resistive load chosen during the load tests. The FRF curves were obtained by varying the frequency of the sinusoidal excitation and keeping the amplitude constant. Figure 14 below shows the FRFs obtained for different excitation amplitudes, from 0.1 g to 0.4 g, on Coil 2 of Harvesters 1 and 2, with an optimum resistive load respectively of 100 Ω and 150 Ω. Through this comparison, it is possible to point out the nonlinear behavior of the harvester. In the literature, there are several symmetrical spring energy harvesters, which have two fixed magnets on the two ends of the tube and present a symmetrical stiffness characteristic. In this case, as described in the previous paragraph, the stiffness is nonsymmetrical due to the presence of only one fixed magnet, and this produces a slightly softening spring behavior. In this case, a harvester with the same magnetic characteristic, but with two magnets on the top and lower end is expected to produce a reduced amount of power because keeping the same dimension of the case, the axial displacement of the moving magnet is reduced due to the presence of the fixed magnet on the top end. In line with the spring stiffness characteristic, as seen Section 4.1, the magnetic force decreases rapidly as the moving magnet moves away from the fixed one. This behavior causes the decrease of the resonance frequency with increasing excitation amplitude because, for larger resonant oscillation, the spring force decreases. This characteristic leads to a nonlinear response that can be observed by the sudden drop in the power amplitude for frequencies slightly below the resonance peak. Moreover, from the comparison between the FRFs of Harvester 1 and Harvester 2, it is possible to observe that Harvester 2, with a coil of 435 turns, generated more power at every excitation. In particular, for 0.4 g, the maximum power for Harvesters 1 and 2 was 31 mW and 44 mW. For different excitations the results obtained are reported in Table 7.
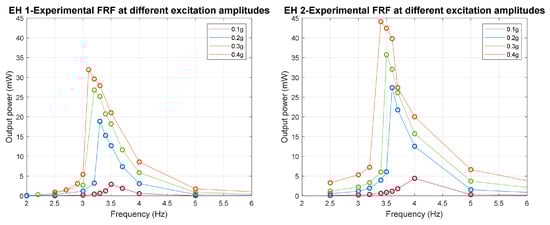
Figure 14.
Experimental RMS power FRF for different excitation amplitudes, on the left, for EH 1 and, on the right, for EH 2.
Table 7.
RMS output power for EH 1 and EH 2.
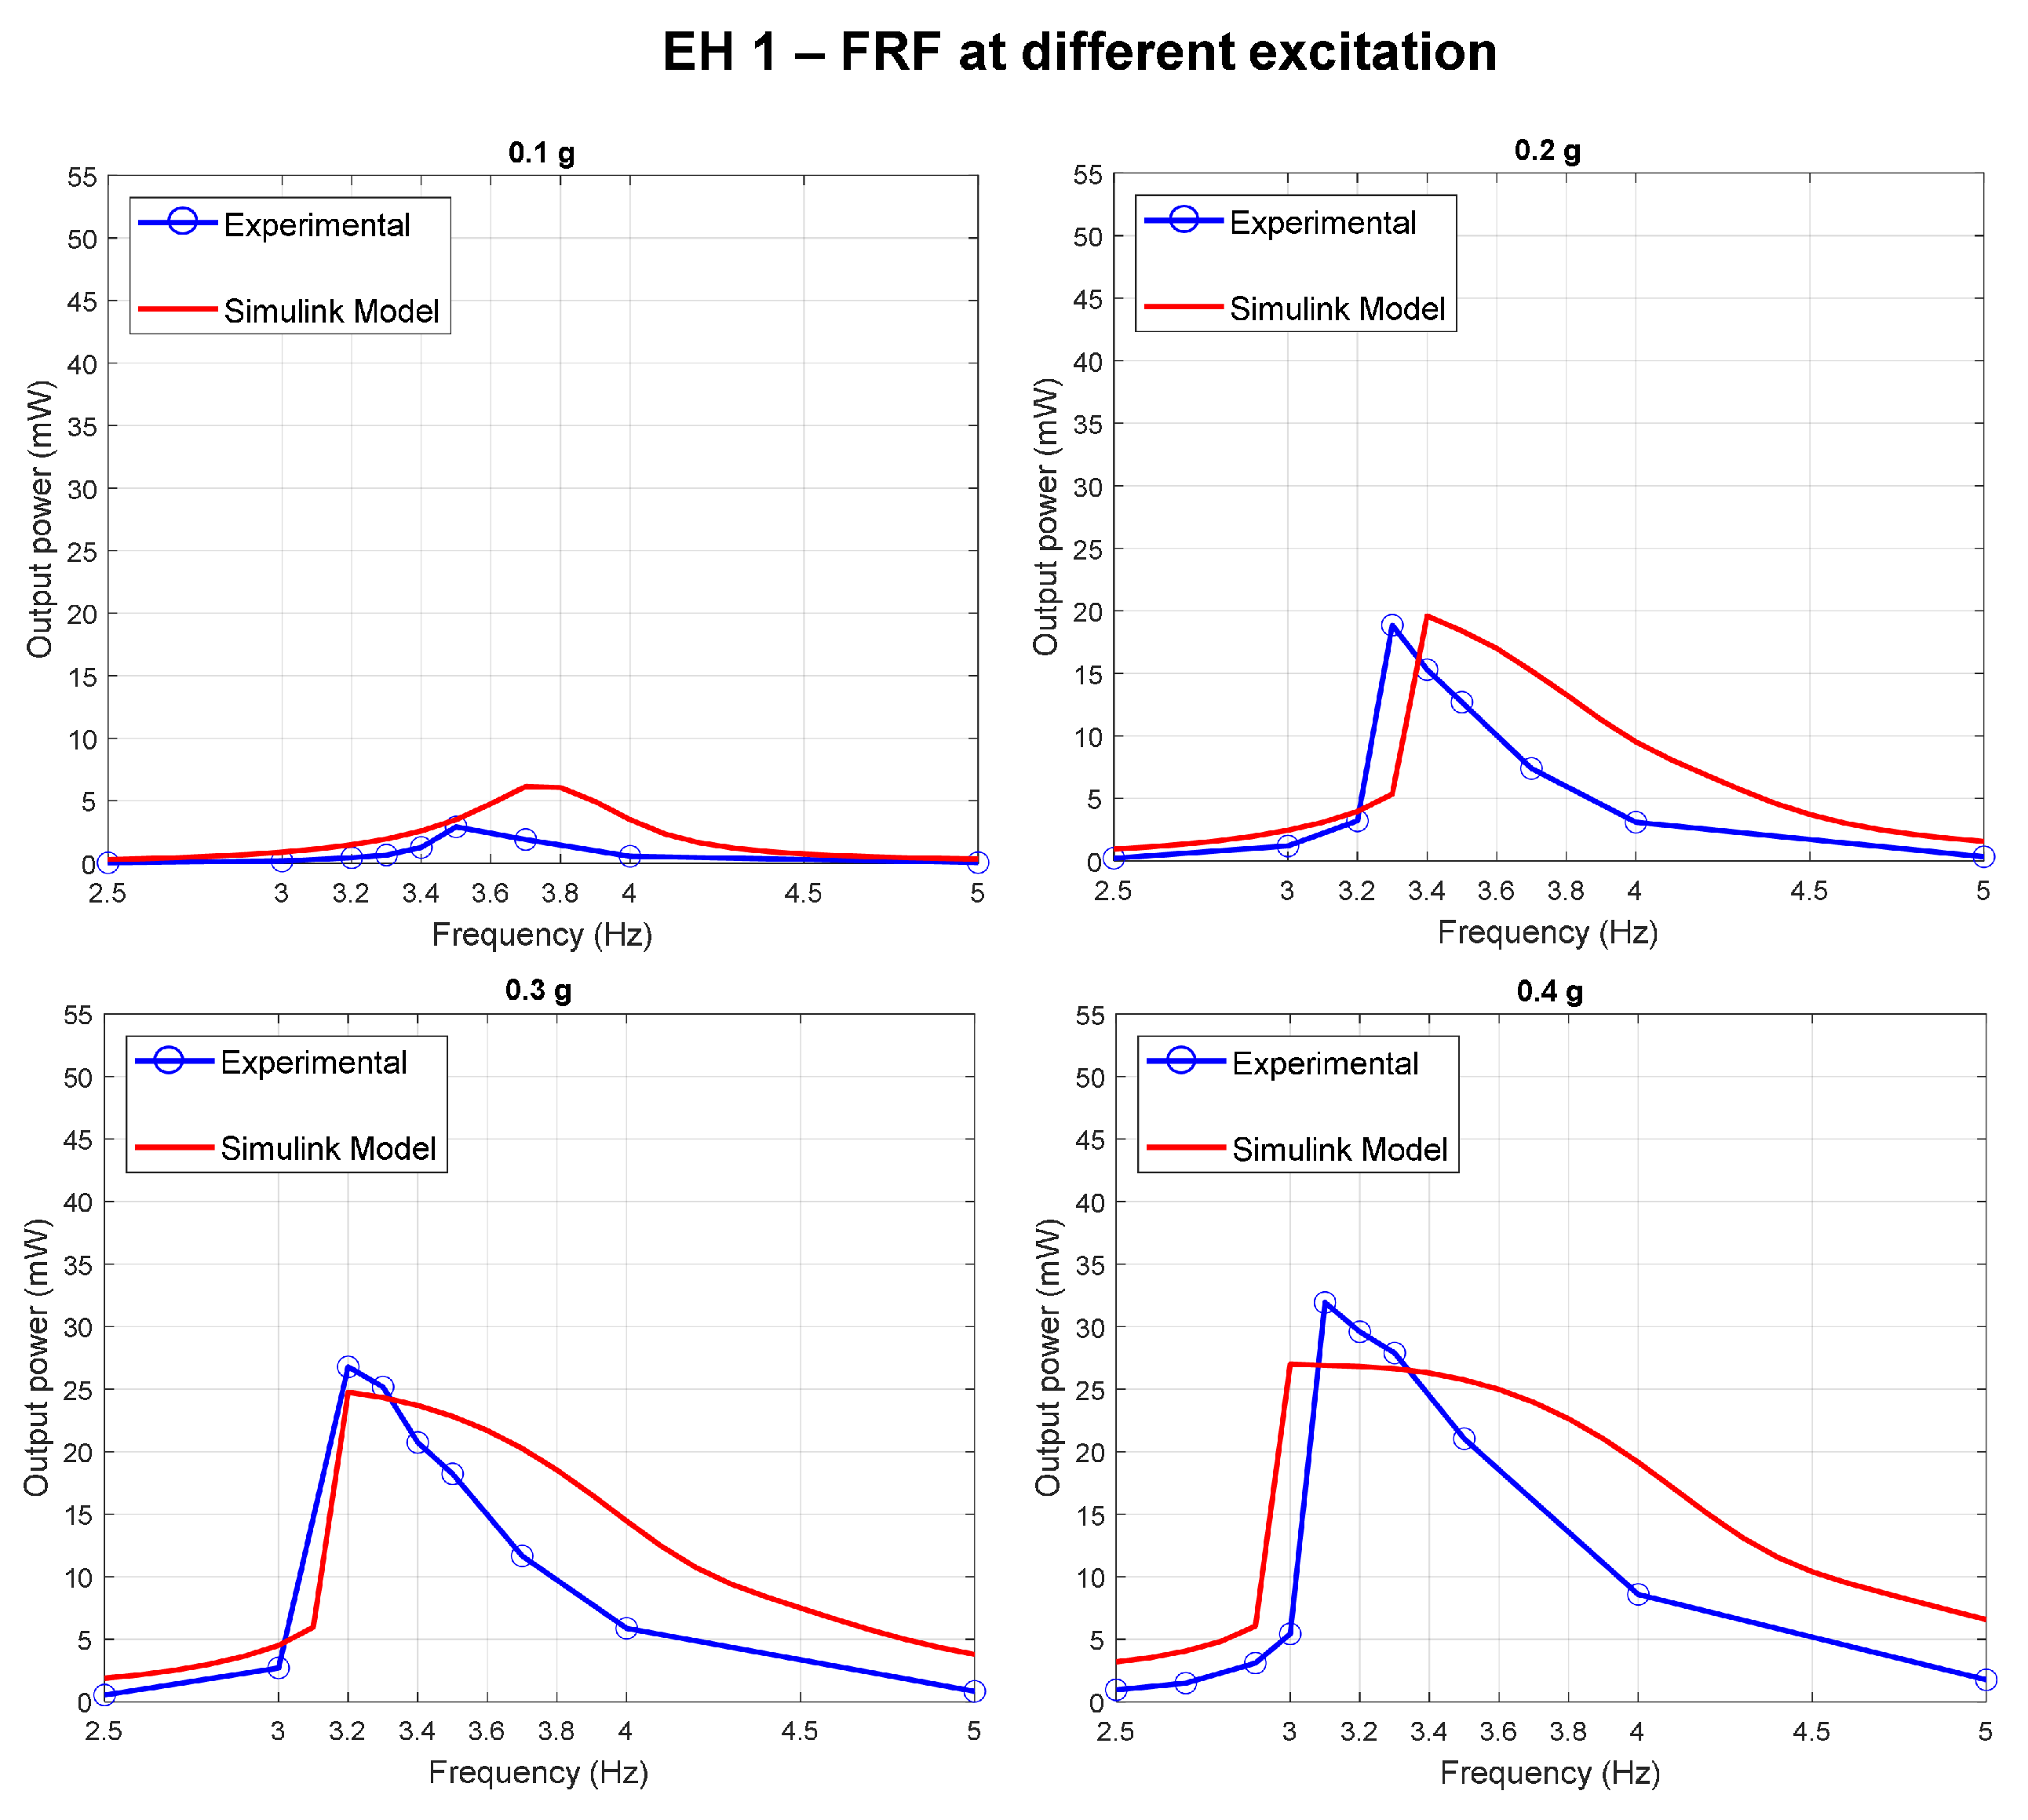
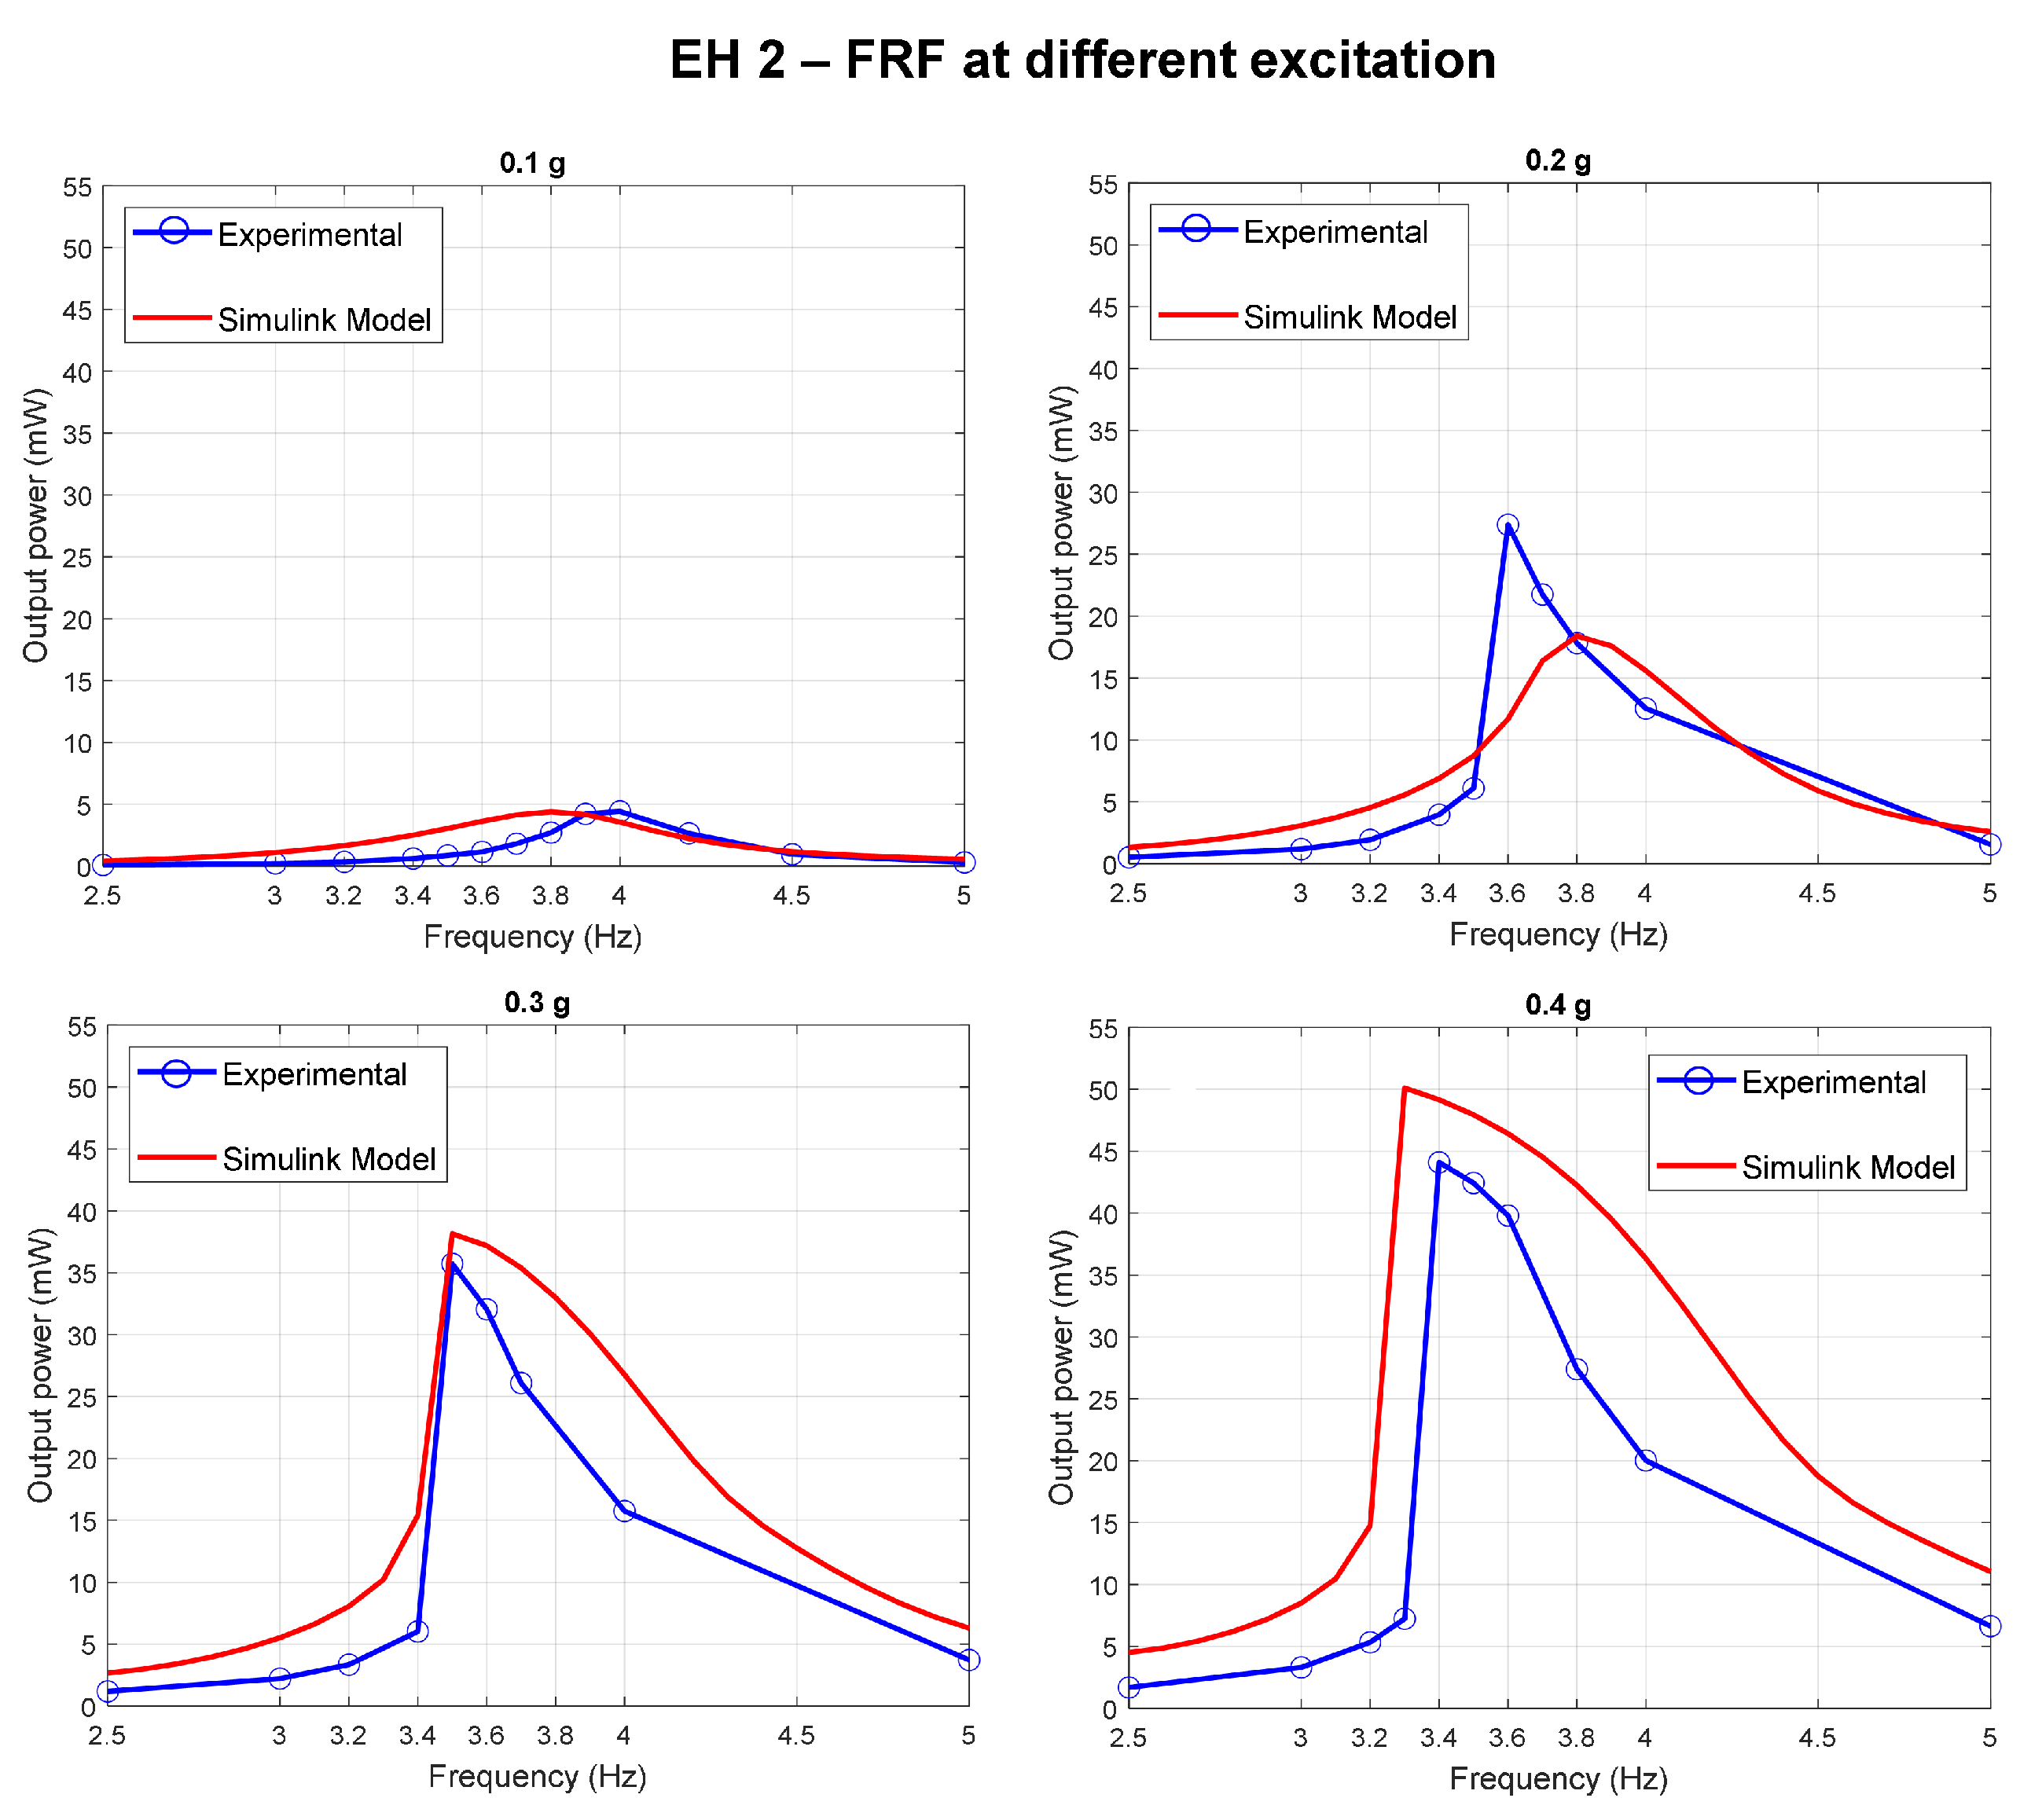
In Figure 15 and Figure 16, the first comparison between the model and the experimental device for the coil of Harvesters 1 and 2 is presented. In particular, the plots below show the FRF obtained experimentally and from the numerical model for different excitation amplitudes, from 0.1 g to 0.4 g, with an optimum resistive load of 100 Ω and 150 Ω, respectively. A good correspondence both in the peak amplitude and resonance frequency was obtained. Considering the different model implementations of the viscous damping with respect to the real behavior of the harvester, as seen in Section 4.1, errors on the resonance peak amplitudes between the numerical and experimental results could be found. In particular, this occurred when the numerical peaks had lower amplitudes than the experimental ones because the constant viscous damping was greater than the real nonlinear one in resonance and, vice versa, when the experimental peak was greater than the numerical one. In this study, we focused mainly on the resonance frequency tuning of the model with the real device, obtaining a maximum difference of 0.3 Hz between the numerical and experimental peaks. In future works, the nonlinear behavior of the viscous damping will be correctly implemented in the numerical model, even though this simplification would not lead to significant inconsistencies. For 0.4 g and 0.1 g excitation, a slight difference in resonance frequency between the numerical model and experimental results occurred. This could be the result of the modeling procedure of the stiffness, as explained in Section 4.1, but mainly because the experimental data were gathered around a frequency of 3 Hz, which was near the lower end of the shaker’s working range.

Figure 15.
EH 1: Experimental and model comparison of the RMS output power FRF for different excitation amplitudes.
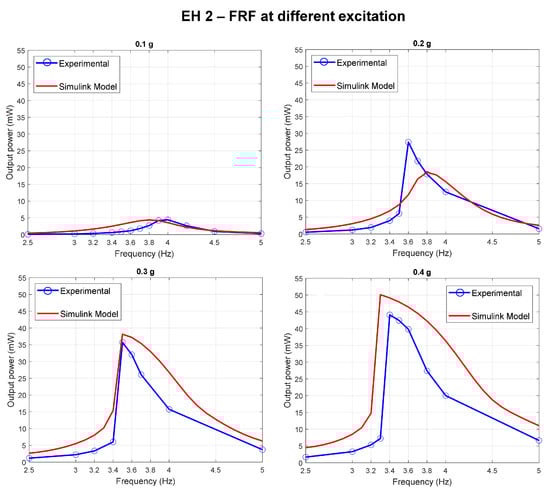
Figure 16.
EH 2: Experimental and model comparison of the RMS output power FRF for different excitation amplitudes.
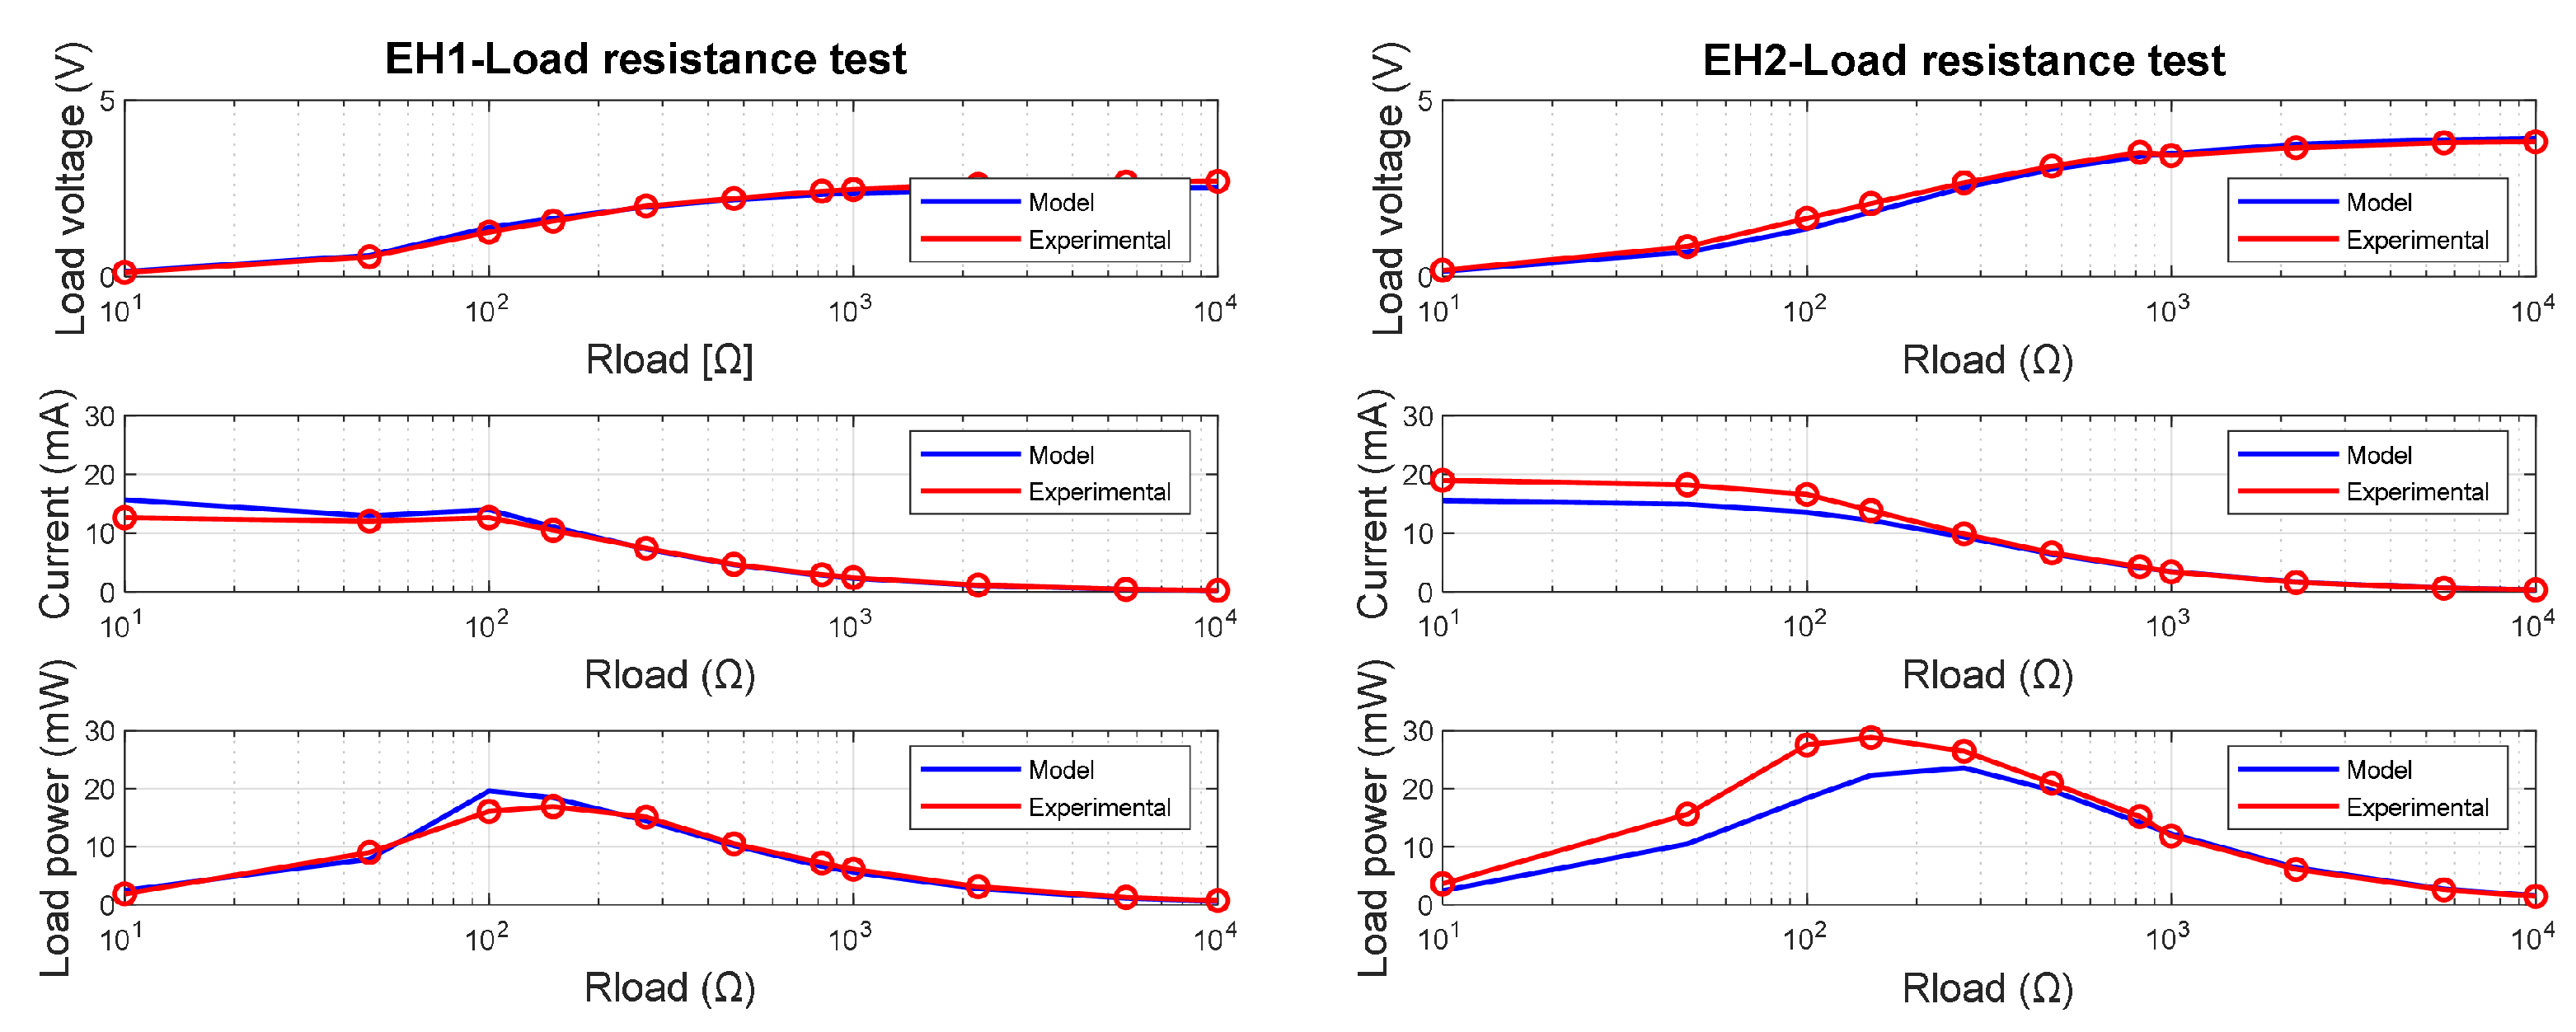
The load resistance is a variable of the circuit that needs to be optimized because it directly affects the output power of the system. It was introduced into the expression of the electromagnetic damping (see Equation (16)), and therefore in the generated current Equation (12). The tests on the experimental bench confirmed the dependence of the electrical quantities on the load resistance and returned the value that generated the optimized power. In order to optimize the output power of the harvester, the reduction of the electrical damping is one of the possible solutions. In the literature [22,23], it was found that this can be obtained by matching the mechanical and electrical load; the result presented it for a linear model, but after the test on the four different harvesters with an increasing number of turns, it was possible to obtain a result in line with this statement. In fact, it can be pointed out that the load resistance optimum almost coincided with the coil resistance of each solution. The numerical model results properly fit the experimental values of the voltage, current, and power, as can be seen in the plots in Figure 17 for Coil 2 of Harvesters 1 and 2, with an excitation amplitude of 0.2 g and at their resonance frequency.
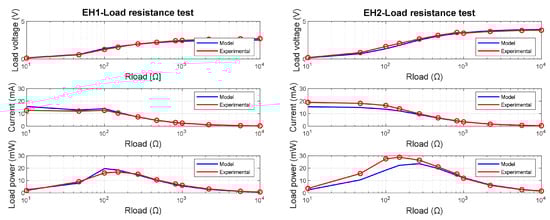
Figure 17.
Experimental and numerical comparison of the load tests.
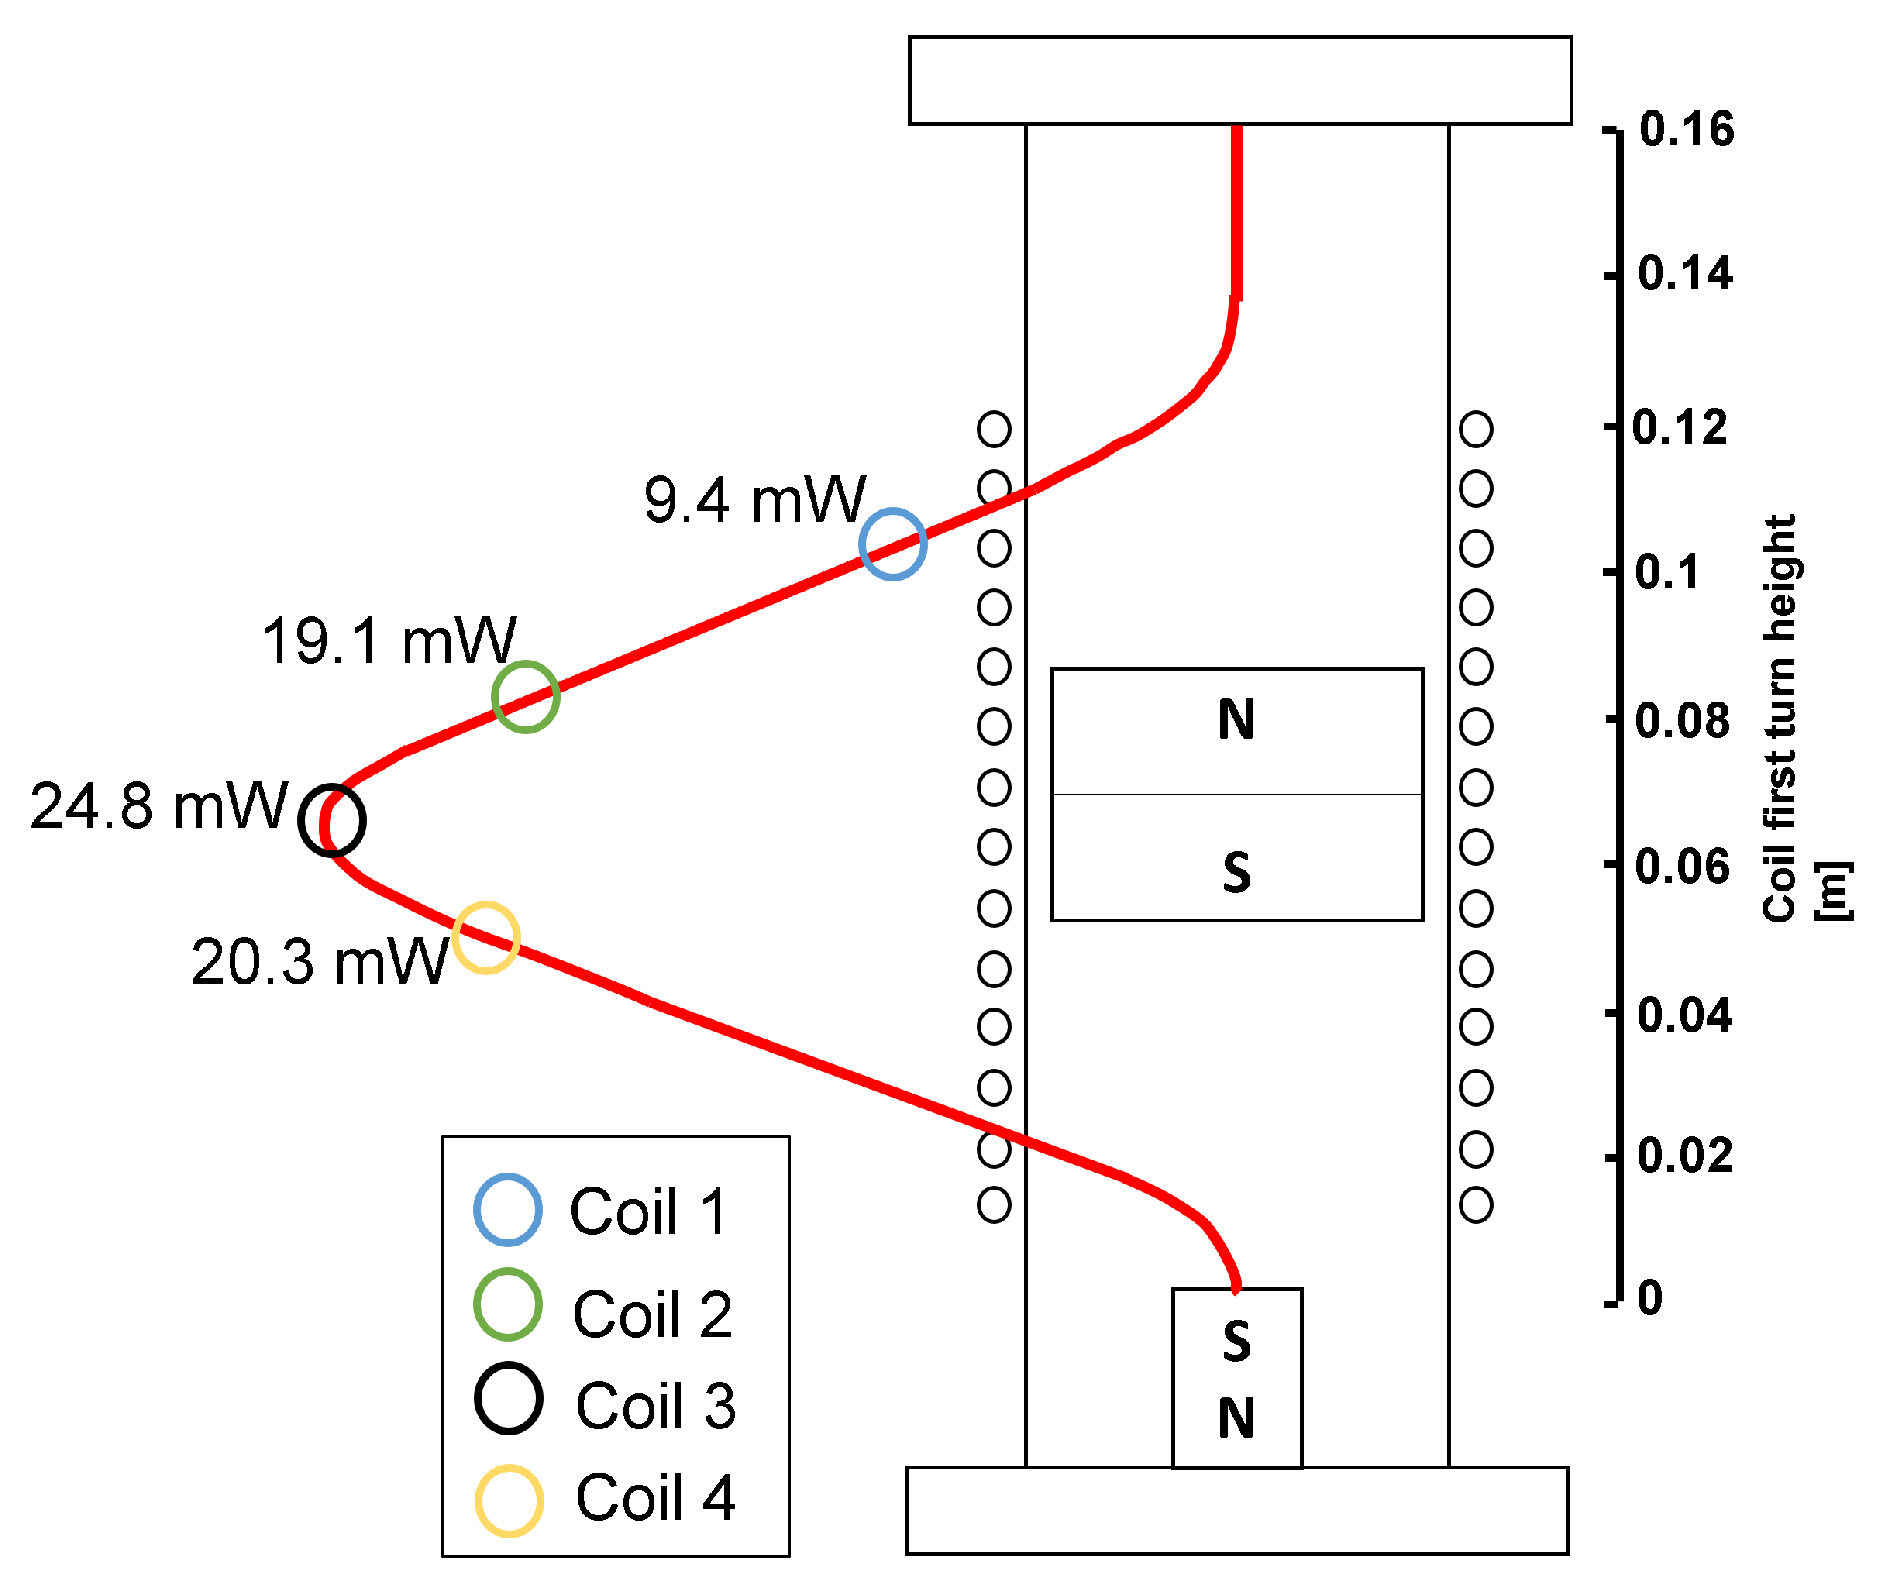
The optimization of the output power required the design of the coil position and length: they both affect the flux linkage during the magnet oscillation. For this purpose, various experimental tests changing the coil axial location and the number of turns (see Table 8) should be carried out to compare the results of the output power at resonance and find a trend. The tests on the axial location were implemented on the same harvester, with a fixed excitation amplitude of 0.3 g, a constant number of turns, and consequently, coil resistance and optimized resistive load. The axial location tests (see Figure 18) showed that the highest power was generated by Coil 2, whose location almost coincided with the equilibrium position of the moving magnet.
Table 8.
Effect of the number of turns on the output power at a 0.2 g excitation amplitude.

Figure 18.
The optimum power output with respect to the height of the harvester.
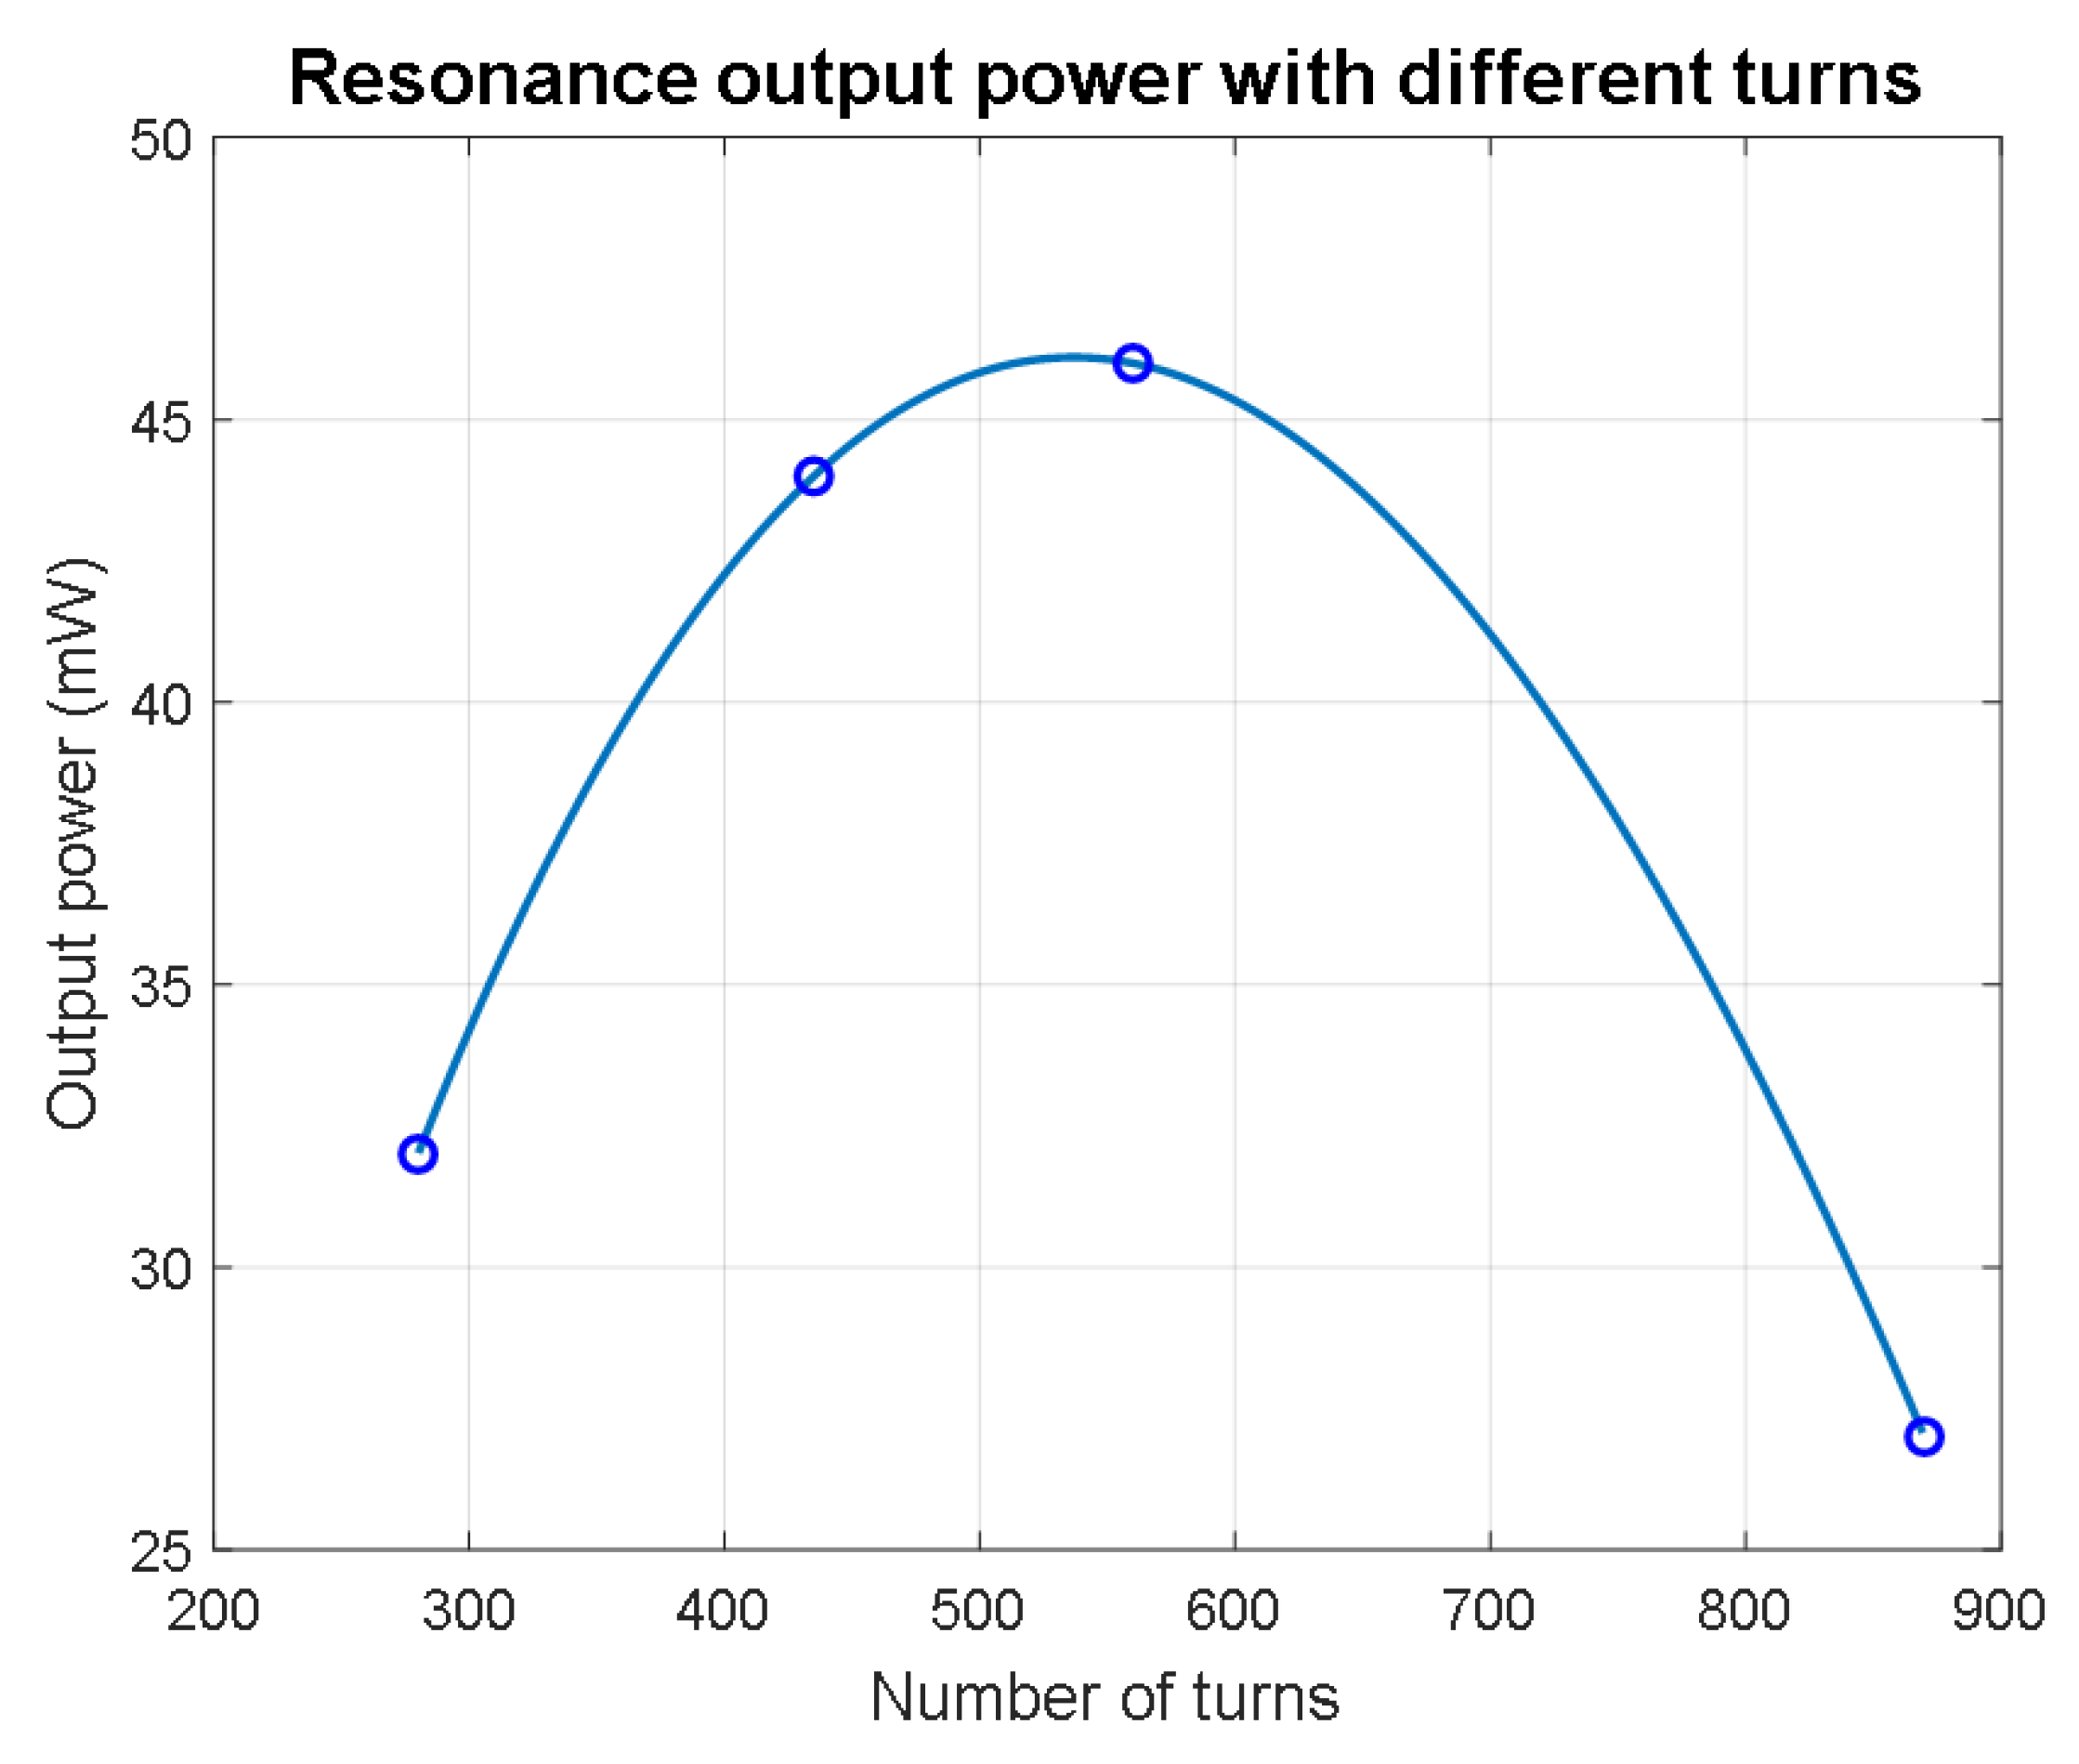
For each test on the number of turns, the RMS power was evaluated with the optimized resistive load, considering that the coil resistance changes, keeping the excitation amplitude at 0.4 g and connecting Coil 2. For both analyses, the numerical model results fit the experimental ones well. The number of turns tests (see Figure 19) showed that the optimum value of the number of turns was 550, with a corresponding = 140 . The output power of the harvester with Coil 2, a number of turns of 550, optimized = 180 , at a resonance frequency of 3.3 Hz, and an excitation amplitude of 0.4 g was the maximum obtained on the experimental tests and was equal to 46 mW.
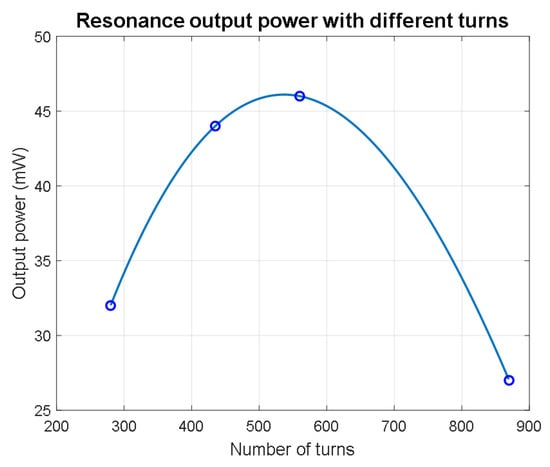
Figure 19.
The optimum power with respect to the number of turns.
6. Discussion and Conclusions
Many electromagnetic energy harvester solutions, as the one presented in this paper, can be found in the literature. The applications of these devices are many, and consequently, so are their configurations and generated power. A comparison of the obtained results from energy harvesters similar to the one described in this work is shown in Table 6. The table compares the harvesters with respect to their power density (PD), which is the ratio between the output power and the volume of the harvester and their normalized power density, which is the power density divided by the excitation squared [24]. This last index offers a fairer comparison among the harvesters, taking into account also the amplitude of the excitation at which they produce the considered power. The harvester of this paper generated one of the highest powers at the lowest frequencies among the considered solutions. As seen in Table 9, this harvester presented a normalized power density (NPD) of 1.44 mW/cm3g2, which is a good value because it offers a high power considering the low resonance frequency (3.4 Hz). This characteristic needs to be pointed out because, for this research, it is important to maintain a low frequency for future industrial application, for example in the railway field.
Table 9.
Literature comparison.
So far, the main drawback of our harvester was its dimensions, which have to be optimized in order to be more suitable for IoT applications. Further developments may address bandwidth amplification strategies and active resonance tuning of the harvester to improve the global efficiency of the device.
In conclusion, this paper carried out a study on the dynamic behavior of a gravitational electromagnetic generator based on asymmetrical magnetically levitated suspensions addressed to structural monitoring applications. The design of the interfaces of the electric, magnetic, and structural coupled systems forming the harvester were described including the dynamic modeling and simulation. The characterization activity on the energy harvester prototypes showed very promising results in terms of output power and conversion efficiency. The frequency and acceleration identified as the typical operative working condition were addressed to applications in the vehicle field. The experimental tests had the purpose of evaluating the magnetic stiffness curve and the dependency of the electrical power on the number of turns and their height. The F-z curve was then used to model the device dynamics with a single-degree-of-freedom model. The frequency response function (FRF) was obtained by measuring the oscillation amplitude at variable frequencies and the voltage output over an optimum resistance . The output power was evaluated for different harvester prototypes tuned to the frequency of the dominant component of the vibration frequency range of the vehicle dynamics. The results of the laboratory test and the harvester dynamic response were compared with those obtained using numerical simulations built in MATLAB/Simulink, and a good correspondence was obtained, in terms of both the FRF and the load curve. The results of the present paper can be used in the system engineering approach to design novel AIoT systems, taking into account the specifications and requirements of the duty cycle and power spectral density available in the environment.
Author Contributions
The authors contributed equally to this manuscript. All authors read and agreed to the published version of the manuscript.
Funding
This research received no external funding.
Institutional Review Board Statement
Not applicable.
Informed Consent Statement
Not applicable.
Data Availability Statement
Not applicable.
Conflicts of Interest
The authors declare no conflict of interest.
References
- Dewan, A.; Karim, M.N.; Beyenal, H. Alternative power sources for remote sensors: A review. J. Power Sources 2014, 10, 142–149. [Google Scholar] [CrossRef]
- Beeby, S.; O’Donnell, T.P. Electromagnetic Energy Harvesting; Priya, S., Inman, D.J., Eds.; Springer: Boston, MA, USA, 2009. [Google Scholar]
- Chalasani, S.; Conrad, J.M. A survey of energy harvesting sources for embedded systems. In Proceedings of the IEEE Southeastcon, Huntsville, AL, USA, 3–6 April 2008; pp. 442–447. [Google Scholar] [CrossRef]
- De Pasquale, G.; Soma, A.; Zampieri, N. Design, Simulation, and Testing of Energy Harvesters With Magnetic Suspensions for the Generation of Electricity From Freight Train Vibrations. J. Comput. Nonlinear Dyn. 2012, 7, 41011. [Google Scholar] [CrossRef]
- De Pasquale, G.; Somà, A.; Fraccarollo, F. Comparison between piezoelectric and magnetic strategies for wearable energy harvesting. J. Phys. Conf. Ser. 2013, 476, 12097. [Google Scholar] [CrossRef] [Green Version]
- De Pasquale, G.; Somà, A.; Fraccarollo, F. Piezoelectric energy harvesting for autonomous sensors network on safety-improved railway vehicles. J. Mech. Eng. Sci. 2012, 226, 1107–1117. [Google Scholar] [CrossRef]
- Approaching the Horizon of Energy Harvesting, Texas Instruments. Available online: https://www.ti.com/lit/wp/sszy004/sszy004.pdf?ts=1627464210392&ref_url (accessed on 28 June 2021).
- Roundy, S.; Wright, P.; Rabaey, J.K. A study of low level vibrations as a power source for wireless sensor nodes. Comput. Commun. 2003, 26, 1131–1144. [Google Scholar] [CrossRef]
- Bosso, N.; Magelli, M.; Zampieri, N. Application of low-power energy harvesting solutions in the railway field: A review. Veh. Syst. Dyn. 2021, 59, 841–871. [Google Scholar] [CrossRef]
- Shi, H.; Liu, Z.; Mei, X. Overview of human walking induced energy harvesting technologies and its possibility for walking robotics. Energies 2019, 13, 86. [Google Scholar] [CrossRef] [Green Version]
- Mocera, F.; Aquilino, G.; Somà, A. Nordic Walking Performance Analysis with an Integrated Monitoring System. Sensors 2018, 18, 1505. [Google Scholar] [CrossRef] [Green Version]
- Yuen, S.; Lee, J.; Li, W.; Leong, P. An AA-Sized Vibration-Based Microgenerator for Wireless Sensors. Pervasive Comput. IEEE 2007, 6, 64–72. [Google Scholar] [CrossRef] [Green Version]
- Nico, V.; Boco, E.; Frizzell, R.; Punch, J. A C-battery scale energy harvester, part a: System dynamics. In Smart Materials, Adaptive Structures and Intelligent Systems; American Society of Mechanical Engineers: New York, NY, USA, 2015; Volume 57304. [Google Scholar]
- Boco, E.; Nico, V.; Frizzell, R.; Punch, J. A C-battery scale energy harvester, part b: Transducer optimization and modeling. In Proceedings of the ASME 2015 Conference on Smart Materials, Adaptive Structures and Intelligent Systems, 21–23 September 2015; Springs: Colorado, CO, USA, 2015; Volume 2, pp. 1–10. [Google Scholar]
- Bedekar, V.; Oliver, J.; Priya, S. Pen harvester for powering a pulse rate sensor. J. Phys. Appl. Phys. 2009, 42, 64–72. [Google Scholar] [CrossRef]
- Dallago, E.; Marchesi, M.; Venchi, G. Analytical Model of a Vibrating Electromagnetic Harvester Considering Nonlinear Effects. IEEE Trans. Power Electron. 2010, 25, 1989–1997. [Google Scholar] [CrossRef]
- Lee, C.; Stamp, D.; Kapania, N.R.; Mur-Miranda, J.O. Harvesting vibration energy using nonlinear oscillations of an electromagnetic inductor. Energy Harvest. Storage 2010, 7683, 76830. [Google Scholar]
- Dos Santos, M.P.S.; Ferreira, J.A.; Simões, J.A.; Pascoal, R.; Torrão, J.; Xue, X.; Furlani, E.P. Magnetic levitation-based electromagnetic energy harvesting: a semi-analytical nonlinear model for energy transduction. Sci. Rep. 2016, 6, 18579. [Google Scholar] [CrossRef] [PubMed]
- Berdy, D.F.; Valentino, D.J.; Peroulis, D. Design and optimization of a magnetically sprung block magnet vibration energy harvester. Sens. Actuators Phys. 2014, 218, 69–79. [Google Scholar] [CrossRef]
- Sneller, A.; Mann, B. On the nonlinear electromagnetic coupling between a coil and an oscillating magnet. J. Phys. Appl. Phys. 2010, 43, 295005. [Google Scholar] [CrossRef]
- Donoso, G.; Ladera, C.; Martín, P. Magnet fall inside a conductive pipe: Motion and the role of the pipe wall thickness. Eur. J. Phys. 2009, 310, 855–869. [Google Scholar] [CrossRef]
- Williams, C.B.; Yates, R.B. Analysis of a micro-electric generator for microsystems. Sens. Actuators A 1996, 52, 8–11. [Google Scholar] [CrossRef]
- Stephen, N.G. On energy harvesting from ambient vibration. J. Sound Vib. 2006, 293, 409–425. [Google Scholar] [CrossRef] [Green Version]
- Beeby, S.; Torah, R.; Tudor, M.; Glynne-Jones, P.; O’Donnell, T.; Saha, C.; Roy, S. Micro electromagnetic generator for vibration energy harvesting. J. Micromech. Microeng. 2007, 17, 1257–1265. [Google Scholar] [CrossRef]
- Constantinou, P.; Mellor, P.H.; Wilcox, P. A model of a magnetically sprung vibration generator for power harvesting applications. In Proceedings of the 2007 IEEE International Electric Machines & Drives Conference, Antalya, Turkey, 3–5 May 2007; Volume 1, pp. 725–730. [Google Scholar]
- Foisal, A.R.M.; Lee, B.C.; Chung, G.S. Fabrication and performance optimization of an AA size electromagnetic energy harvester using magnetic spring. In Proceedings of the SENSORS, 2011 IEEE, Limerick, Ireland, 28–31 October 2011; pp. 1125–1128. [Google Scholar]
- Munaz, A.; Lee, B.C.; Chung, G.S. A study of an electromagnetic energy harvester using multi-pole magnet. Sens. Actuators Phys. 2013, 201, 134–140. [Google Scholar] [CrossRef]
- Halim, M.A.; Park, J.Y. A non-resonant, frequency up-converted electromagnetic energy harvester from human-body-induced vibration for hand-held smart system applications. J. Appl. Phys. 2014, 115, 9. [Google Scholar] [CrossRef]
- Nico, V.; Boco, E.; Frizzell, R.; Punch, J. A high figure of merit vibrational energy harvester for low frequency applications. Appl. Phys. Lett. 2016, 108, 013902. [Google Scholar] [CrossRef] [Green Version]
- Zhao, X.; Cai, J.; Guo, Y.; Li, C.; Wang, J.; Zheng, H. Modeling and experimental investigation of an AA-sized electromagnetic generator for harvesting energy from human motion. Smart Mater. Struct. 2018, 27, 085008. [Google Scholar] [CrossRef]


Publisher’s Note: MDPI stays neutral with regard to jurisdictional claims in published maps and institutional affiliations. |
© 2021 by the authors. Licensee MDPI, Basel, Switzerland. This article is an open access article distributed under the terms and conditions of the Creative Commons Attribution (CC BY) license (https://creativecommons.org/licenses/by/4.0/).