Article

Numerical Simulation on Charge Transport and DC Breakdown in Polyethylene-Based Micro-h-BN/Nano-SiO2 with Filler Orientation Dependent Trap Energy  †

School of Electrical and Information Engineering, Tianjin University, Tianjin 300072, China
*
Author to whom correspondence should be addressed.
This paper is an extended version of our paper published in 2020 IEEE International Conference on High Voltage Engineering and Application (ICHVE 2020), Beijing, China, 6–10 September 2020; pp. 1–4.
Energies 2021, 14(15), 4645; https://doi.org/10.3390/en14154645
Submission received: 27 June 2021 / Revised: 25 July 2021 / Accepted: 29 July 2021 / Published: 30 July 2021

Abstract

:
In order to improve the thermal conductivity and the insulation properties of polyethylene (PE) used as cable insulation under DC stress, hexagonal boron nitride (h-BN) and inorganic particles have been considered as micro-filler and nano-filler, respectively. As a 2D material, the orientation of h-BN possibly affects the insulation properties of the polymer. It is important to understand the influence of the filler orientation on the insulation performance of the polymer. In this work, a numerical simulation has been performed to investigate the effect of orientation of micro-h-BN on charge transport and DC breakdown of PE-based micro/nano-composites and a comparison between the simulation result and previous literature data has been conducted. The h-BN was designated to be parallel, perpendicular to the normal sample surface vector (the direction of electric field in this work) or randomly distributed in the matrix, and the charge transport behavior and DC breakdown strength in the samples were discussed by using the bipolar charge transport (BCT) model. The results indicated that when the h-BN was perpendicular to the normal vector, the density of trapped charge was the largest and the DC breakdown strength was the highest among the three cases studied. It is suggested that the charge trapping/de-trapping processes and the electric field in the sample vary with the orientation of h-BN through tailoring the trap characteristics of the material.

1. Introduction

With the development of high voltage direct current (HVDC) transmission projects, the demand of energy delivery with high power density through underground cable has become an urgent issue [1]. Polyethylene (PE), as the base material of HVDC cable insulation, is exposed to high temperatures and high electric fields during operation. Due to the coaxial structure of a single core power cable, a temperature gradient appears across the insulating material, which leads to serious space charge accumulation and electric field distortion, thus threatening the safe operation of the cable [2,3]. From the viewpoint of safety, it is very important to improve the thermal conductivity of DC cable insulation so as to establish a compromise the thermal and the insulation performances.
Over the years, a number of investigations have been performed to improve the thermal conductivity of polymer insulating materials. One simple method is to add inorganic particles with high intrinsic thermal conductivity into a polymer, whereby a composite with high thermal conductivity could be formed [4,5]. Hexagonal boron nitride (h-BN) with an intrinsic thermal conductivity of 350–400 W/m·K has been widely considered as the best filler to tailor the thermal properties of polymers [6], and several studies regarding the enhancement of thermal conductivity of polymers by using h-BN as the filler have been reported. Zeng et al. revealed that the thermal conductivity of the composites was increased to 1.11 W/m·K, when h-BN with the average size of 1 μm was added into bismaleimide-triazine (BT) resin at 50 wt %, which represents a six-fold increase compared with pure BT resin [7]. Wang et al. reported that thermal conductivity with a value of 2.91 W/m·K could be obtained when 80 wt % micro-sized h-BN was added into epoxy (EP) [8]. Sato et al. employed polyimide (PI) and h-BN with an average particle size of 8 μm as the base material and filler to prepare a composite with high thermal conductivity. A thermal conductivity of 7 W/m·K was achieved with a filler loading of 60 vol%, which was 30 times higher than that of the neat PI [9]. It should be noted that the orientation of the added 2D material could affect the thermal conductivity of the composite. Karolina et al. [10] prepared highly aligned graphene-LDPE nanocomposites and measured the thermal conductivity from through plane and in-plane directions. It was found that the thermal conductivity along the extrusion direction for samples filled with 7.5 wt % of graphene nanoplatelets (GnP) reached 2.2 W/m·K whereas thermal conductivity measured through the plane direction decreased slightly. Such a phenomenon was also observed in polyimide (PI) films filled with h-BN by Tanimoto [11]. The obtained results indicated that the PI/h-BN films with in-plane directions filler had larger thermal conductivity than that with out-of-plane directions. In short, it is generally accepted that the addition of h-BN with appropriate content and orientation could obviously improve the thermal conductivity of polymer insulating materials.
However, it is also noticed that the insulation properties are usually reduced when micro-sized particles with high intrinsic thermal conductivity are added to a polymer [12]. Attempts have been made to add nano-sized inorganic particles into the material to form micro/nano-composites with balanced thermal and insulation properties. It was pointed out by Donnay [13] that when the content of micro and nano h-BN in the composite was 20 wt %, the breakdown strength could be increased by about 10%, and the thermal conductivity of the composite was three times of that of pure EP. Wang et al. [14] reported that EP composites co-filled with micro-h-BN and nano-SiO2 could exhibit a thermal conductivity of 5.16 W/(mꞏK) and a breakdown strength of 102.9 kV/mm which was higher than that of neat EP. In addition, ultralow DC-conductivity that prevents the risk of thermal runaway and electrical failure is also an important insulation property, which is affected by the addition of nano-particles [15]. A large number of investigations have been performed with respect to this property. It was reported by Pourrahimi that the addition of poly(3-hexylthiophene) (P3HT) at 0.0005 wt % could reduce the DC electrical conductivity by a factor of up to 3 compared with LDPE [16]. Karolina et al. [17] studied the through-plane conductivity of a composite of LDPE filled with GnP exposed to low relatively low electric fields (<20 kV/mm). The results indicated that the DC conductivity in the composite was reduced slightly compared with the pure LDPE. Although previous works have been carried out to investigate the effect of the addition of micro/nano-particles on the thermal conductivity and the insulation properties of composites, when an 2D material with high intrinsic thermal conductivity like h-BN is employed, the effect of the filler orientation on the insulation performance of the micro/nanocomposite is rarely discussed.
At present, the orientation methods of thermal conductive fillers can be divided into two categories. One is the orientation driven by an external field including electric field orientation [18] and magnetic field orientation [19]. The method of electric field orientation is often applied to thermoset materials. The effect of the magnetic field orientation method depends on the encapsulation degree of h-BN in the polyethylene matrix. The other category is the orientation during processing, including pressure forming [20], tape casting [21], electrospinning methods [22]. The tape casting and electrospinning methods are suitable for thermoset polymers whereas polyethylene is a thermoplastic material. If we have the h-BN oriented in the melting state through a pressure forming method, the crystal growth in the cooling process may change the orientation. In summary, at this stage, it is still difficult to achieve an ideal orientation of h-BN in a polyethylene micro/nano-composite. Accordingly, it is worthwhile to perform numerical simulations with respect to this issue.
In our previous work, the preliminary result that the charge transport behavior and the DC breakdown strength in the composite is dependent on the orientation of micro-h-BN has been reported [23]. In this paper, as a follow-up and extension of our previous work, detailed and in-depth demonstrations about the charge dynamics and the electric field distortion have been performed to elucidate the mechanism of the filler orientation- dependent charge accumulation and DC breakdown behaviors through the bipolar charge transport (BCT) model using a novel method for threshold electric field extraction.

2. BCT Model

With the purpose of describing the charge transport behavior in polymer samples in detail during DC stressing, the BCT model [24] has been employed. The schematic diagram of the BCT model for a polymeric material under a DC voltage is shown in Figure 1. This figure is reproduced from [24]. The cathode and the anode are located at x = 0 and x = d, respectively. Electron and hole in the metal electrodes have to overcome the potential barriers between the electrode and the material to inject into the bulk. The injected charge can trap, de-trap, migrate and recombine in the polymer [25]. The mathematical equations of the BCT model are given in the sections that follow.

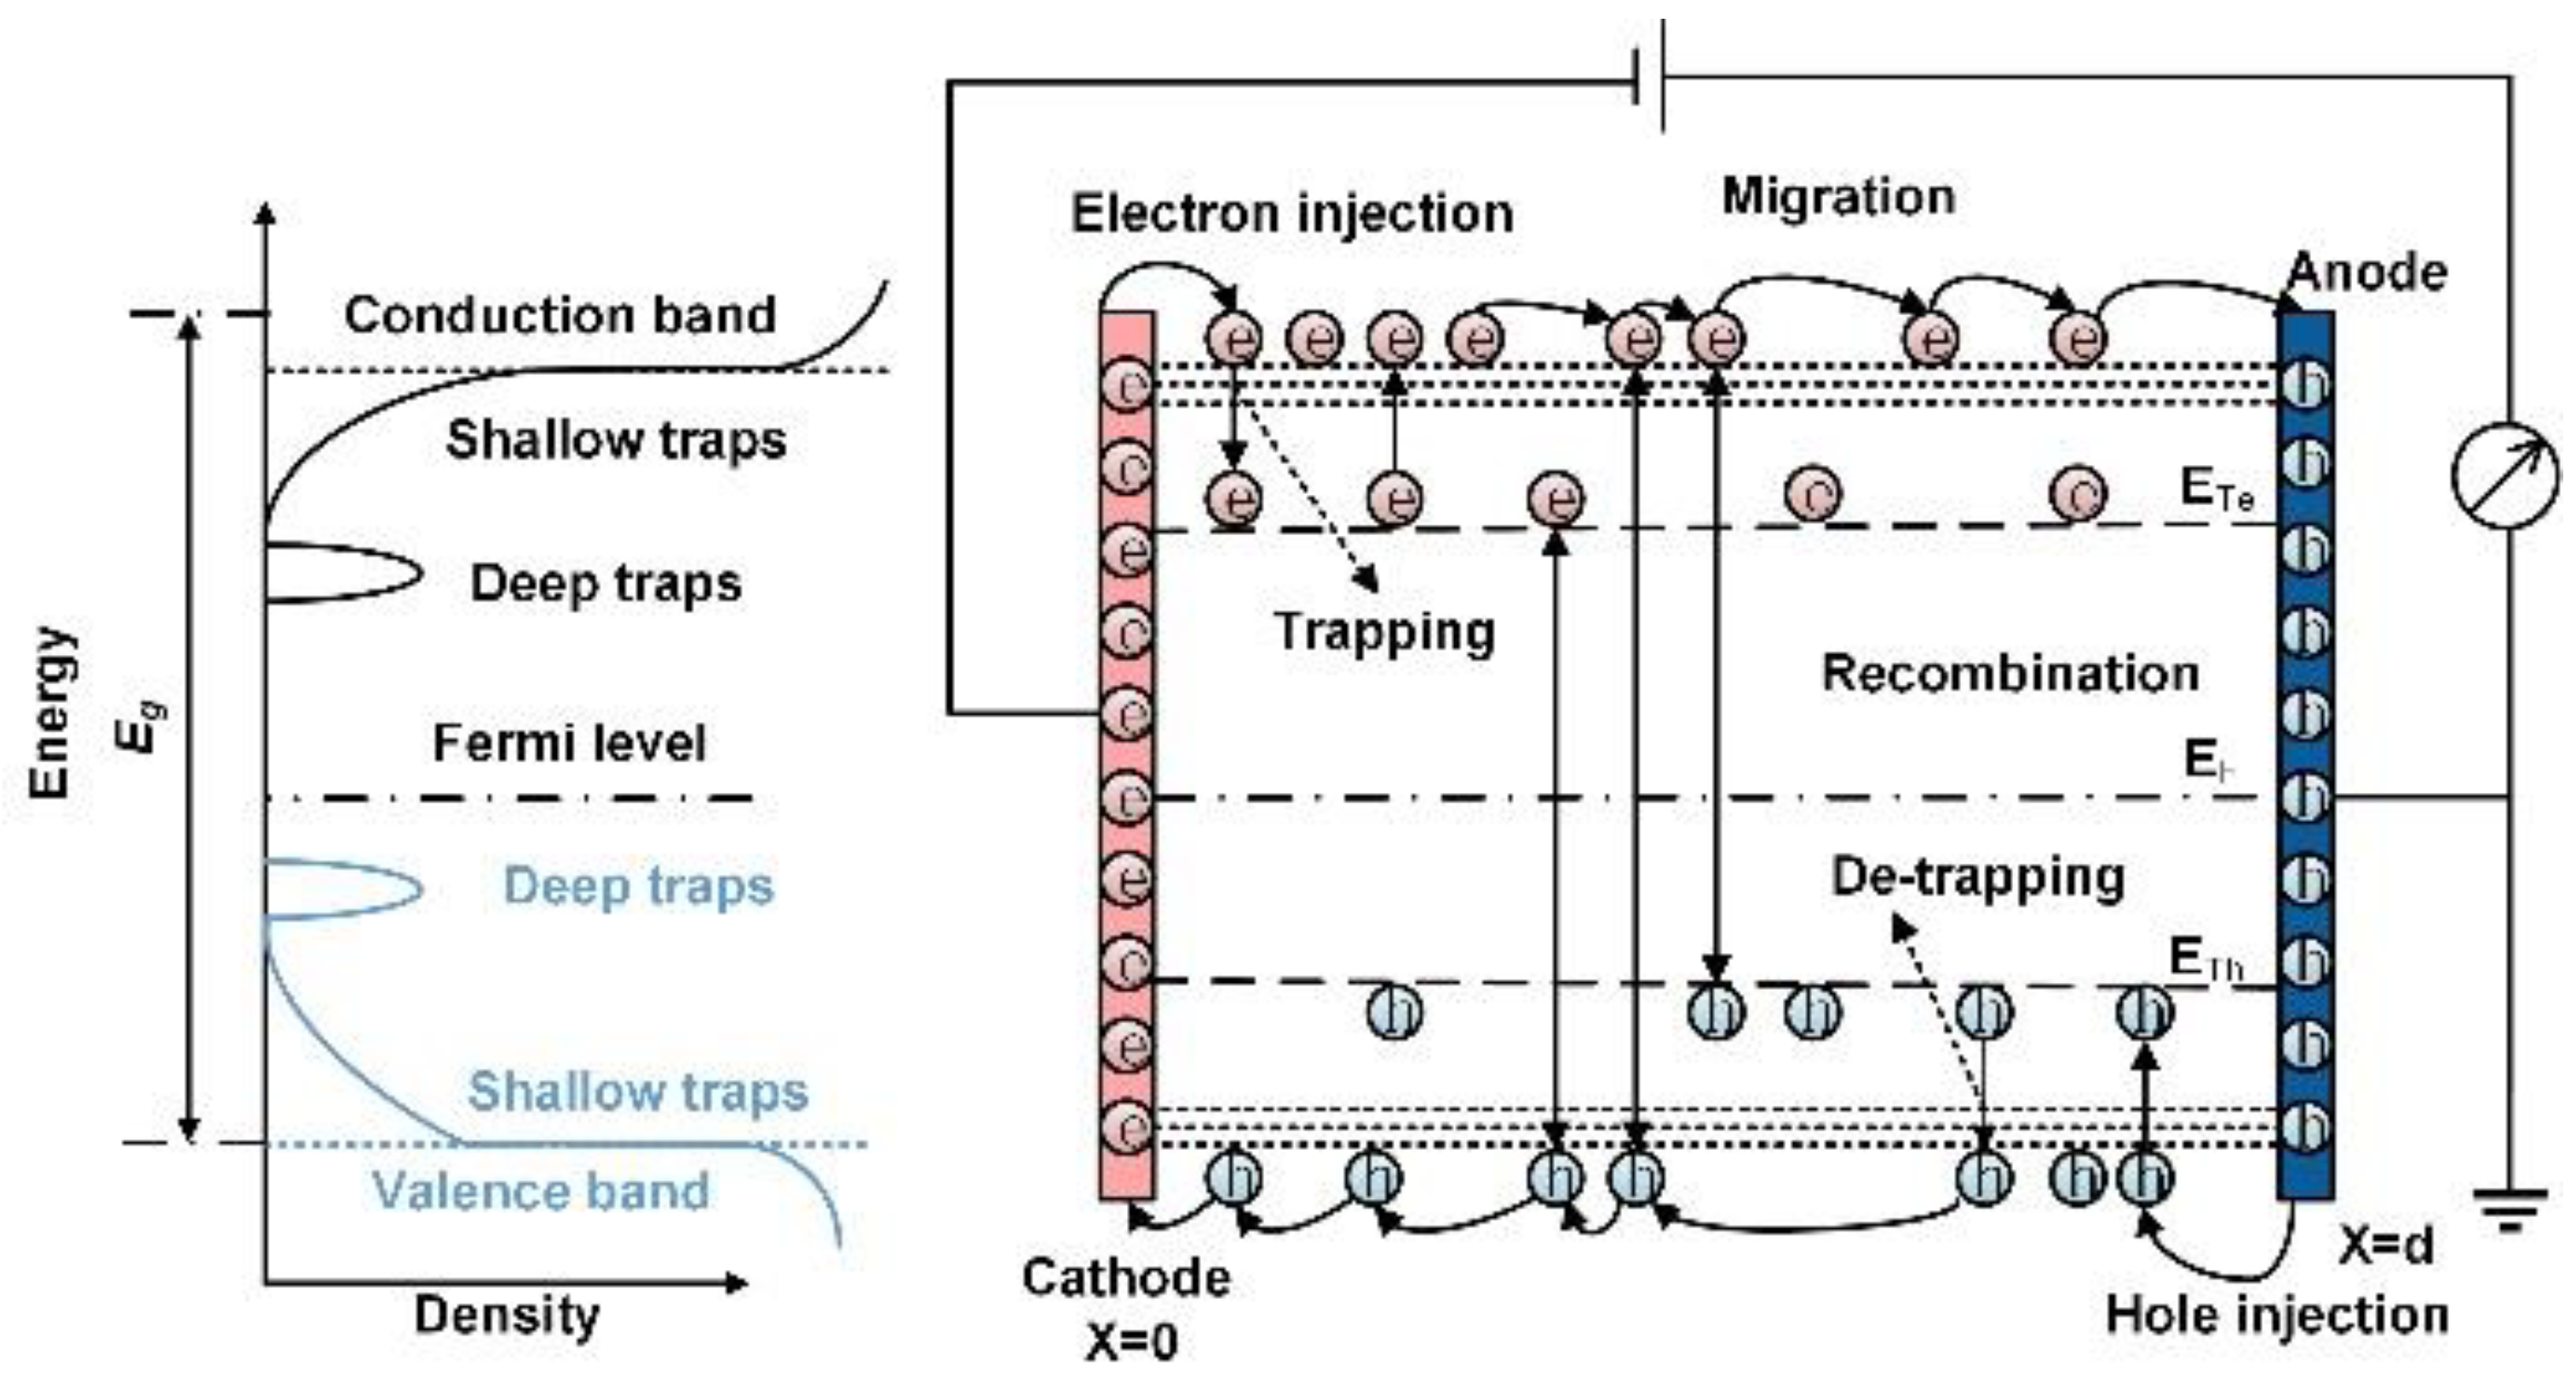
2.1. Charge Injection

Electrons and holes are assumed to be injected into the sample from the cathode and anode, respectively, by Schottky thermionic emission [26]. The current densities induced by the charge injection are determined by the effective injection barrier between the sample and the electrode, electric field at the interface and temperature [27,28,29], as shown in Equations (1) and (2):
j i n ( e ) ( t ) = A T 2 exp ( e F ( 0 , t ) / 4 π ε 0 ε r E i n ( e ) k B T )
j i n ( h ) ( t ) = A T 2 exp ( e F ( d , t ) / 4 π ε 0 ε r E i n ( h ) k B T )
where, jin(e) (t) and jin(h) (t) are the current densities caused by electrons and holes injected from the cathode and anode in A/m2, Ein(e) and Ein(h) are the injection barriers for electrons and holes in eV, e is the elementary charge in C, A and kB are the Richardson constant and the Boltzmann constant, ε is the vacuum permittivity in F/m, εr is the relative permittivity of the sample, T is the temperature in K, F(0,t) and F(d,t) are the electric fields at the interfaces of x = 0 and x = d, respectively.

2.2. Self-Consistent Equations

The charge in polymeric materials is governed by a set of self-consistent equations [30], including charge continuity equation, charge transport equation and Poisson’s equation, as depicted in Equations (3)–(6):
q f r e e ( x , t ) t + j c ( x , t ) x = S f r e e ( x , t )
q t r a p ( x , t ) t = S t r a p ( x , t )
j c ( x , t ) = q f r e e ( x , t ) μ 0 F ( x , t )
2 ϕ ( x , t ) x 2 = q f r e e ( x , t ) + q t r a p ( x , t ) ε 0 ε r
where, qfree and qtrap are the free and trapped charge densities in the sample in C/m3, jc is the conducting current density in the material in A/m2, μ is the carrier mobility in m2/Vs, F(x,t) is the electric field in the sample. Sfree(x,t) and Strap(x,t) are charge sources and are shown in detail below. The variation of charge in the material follows the charge continuity equations with the consideration of charge trapping, de-trapping and recombination processes [31]. Traps in this model are assumed to be with single trap energy when charges are trapping and de-trapping, and recombination occurs when electrons and holes encounter each other.
While solving the Poisson’s equation (6), a boundary condition should be given. During the real DC breakdown experiment, a negative ramping voltage with a rising rate kramp is applied to the sample until the breakdown occurs. Accordingly, the potential is set to be zero on the anode and the same to the applied voltage on the cathode. The potential on the cathode is proportional to the time of voltage application. The boundary condition is expressed as follows:
ϕ ( 0 , t ) = V a p p l ( t ) = k r a m p t r a m p
where Vappl is the applied voltage in V, kramp is the ramping rate of the voltage in kV/s, and tramp is the time of voltage application in s. The electric field can be calculated by F = −Δϕ.

2.3. Charge Dynamics

Four species of carriers, namely, free and trapped electrons and holes are taken into account in the charge dynamics. The free carriers can hop in traps which determine the effective carrier mobility. The traps are usually caused by physical or conformational defects and chemical defects [17]. The trapping and de-trapping of charges are described in this work by considering the trap of single level. When the electron and the hole encounter each other in the material, recombination will occur. The following equations represent the first order charge dynamics in polymeric material, including charge trapping/de-trapping and recombination processes [28]:
S e μ = P t r ( e ) q f r e e ( e ) ( 1 q t r a p ( e ) q e N T ( e ) ) + P d e ( e ) q t r a p ( e ) R e μ , h μ q f r e e ( e ) q f r e e ( h ) R e μ , h t q f r e e ( e ) q t r a p ( h )
S e t = P t r ( e ) q f r e e ( e ) ( 1 q t r a p ( e ) q e N T ( e ) ) P d e ( e ) q t r a p ( e ) R e t , h μ q f r e e ( h ) q t r a p ( e )
S h μ = P t r ( h ) q f r e e ( h ) ( 1 q t r a p ( h ) q e N T ( h ) ) + P d e ( h ) q t r a p ( h ) R e μ , h μ q f r e e ( e ) q f r e e ( h ) R e t , h μ q f r e e ( h ) q t r a p ( e )
S h t = P t r ( h ) q f r e e ( h ) ( 1 q t r a p ( h ) q e N T ( h ) ) P d e ( h ) q t r a p ( h ) R e μ , h t q f r e e ( e ) q t r a p ( h )
where S, Set, S, and Sht are the charge sources of mobile and trapped electrons and holes, respectively. R, is the recombination coefficient between free electrons and free holes in m3/C·s. R,ht and Ret, are the recombination coefficient between free electrons and trapped holes and the recombination coefficient between trapped electrons and free holes in m3/C·s. Based on the Langevin recombination model [32], the recombination coefficient between free electrons and free holes can be expressed as R e μ , h μ = ( μ e + μ h ) / ε 0 ε r . μe and μh are the carrier mobility for electrons and holes. According to the Shockley–Read–Hall model [33], trap-assisted recombination coefficient between free electrons and trapped holes and that between trapped-electrons and free-holes can be expressed as R e μ , h t = μ e / ε 0 ε r and R e t , h μ = μ h / ε 0 ε r . Pde(e) and Pde(h) are the de-trapping probability of trapped electrons and holes in 1/s. Ptr(e) and Ptr(h) are the trapping probability of free electrons and holes in 1/s. They are given by:
P d e = v A T E exp ( E t k B T )
P t r = q e N t μ 0 ε 0 ε r
where, Nt is the density of the trap in 1/m3, VATE is the attempt-escape frequency in 1/s, and Et represents the trap energy in eV.

3. Parameters for the BCT Model

In this work, PE-based micro/nano-composite has been employed as the sample for our numerical simulations. The fillers—20 nm-SiO2 and 5 μm-h-BN particles—were selected with a weight ratio of 1 and 30 wt %, respectively, to ensure a high thermal conductivity according to our previous work [34]. It is considered that the orientation of h-BN in the real sample should be random, as shown in Figure 2. Three categories of the orientation of the h-BN could be summarized, which are perpendicular, parallel to the normal vector of the sample surface or randomly dispersed in the polymer. The normal vector of the sample surface in this paper is defined as the direction of the electric field as depicted in Figure 2.
Figure 2 shows various filler orientations and possible charge transport mechanisms in the material, taking the electron as an example. As discussed in [34], the de-trapped charge could be trapped again quickly, by which the overall time for the carrier within the trap is increased hence the trap depth would be deepened. Such an effect is strong while the orientation of the h-BN is perpendicular to the normal vector of the test sample, but it is weak when the h-BN is parallel to the vector. It is thereby proposed that the polymer with perpendicular orientation of the filler has the deepest trap energy, the material with filler distributing randomly follows, and the trap energy of a sample having a parallel filler orientation is the shallowest. According to our previous publication [34], the trap center of PE/h-BN/SiO2 with random filler orientation is in the range of 0.84–0.95 eV. Therefore, the trap center used in this simulation is assumed to range from 0.7 eV to 1 eV. In our previous work [28], to keep the emphasis on the DC breakdown regulated by charge transport depending on trap center characteristics, the carrier mobility was set to be a constant for all samples. However, in fact, the carrier mobility is affected by the trap energy, namely, μ m o l = μ 0 P d e / ( P t r + P d e ) . μ refers to the shallow trap-controlled carrier mobility. For electrons and holes, μe and μ0h are 1 × 10⁻¹⁴ and 3 × 10⁻¹⁵ m2/Vs, respectively [35]. Table 1 shows the values of the parameters used in the BCT model [35,36,37,38,39]. In addition, the thickness of the samples used in our simulation is 200 μm, while the temperature is 298 K. It is assumed that insulation breakdown occurs when the maximum local electric field Fmax inside the material exceeds a threshold Fc. In our previous work [23], the same threshold value was employed to discuss the DC breakdown strength of the composite with different filler orientations. At present, the threshold value can be extracted on the basis of the Poole-Frenkel effect. It is generally accepted that the energy that the charge requires to de-trap is reduced by the applied external electric field [40], which is referred to as the Poole-Frenkel effect. The corresponding reduction is depicted by Equation (14):
Δ E P F = β P F F = q e 3 F / π ε 0 ε r
Assuming that the applied electric field is high enough, the potential barrier for charge de-trapping can be reduced to zero, hence the charge can migrate freely in the material [41]. Such a special condition is herein referred to as a surpassing Poole-Frenkel (SPF) conduction. The breakdown is considered to take place when charges localized by the deepest trap overcome the potential barrier following the SPF conduction. The corresponding electric field needed to reach the SPF could be regarded as the threshold electric field Fc. When the reduction of potential barrier caused by the Poole-Frenkel effect is equal to the deepest trap center, Fc can be calculated by the following expression:
F c = E t 2 π ε 0 ε r / q e 3
where Et is the deepest trap center in the polymer in eV.
The model of charge transport in this study was implemented using the finite element software COMSOL Multiphysics. The partial differential Equations (3)–(6) were solved by selecting suitable physics modules available in the software. The coupling between different modules was carried out so that the charge densities obtained as solutions of equations (3) and (4) were updated in Poisson’s Equation (6) for calculating the electric field distribution.

4. Simulation Results and Discussion

4.1. Space Charge Accumulation

Figure 3a shows the distribution of space charge in the sample with random filler orientation at different positions varying as a function of time. The cathode and anode are at the positions of x = 0 and x = 200 μm, respectively. There is little charge injection and the position of accumulated space charges is near the electrode at the initial time. As the time lapses, more charges are injected into the material and the space charge accumulation tends to distribute in the whole volume of the composite. This suggests that the accumulation of space charge becomes more serious over time. It is possible that most of the injected charges can only transport to the vicinity of the electrode at the beginning while they can migrate towards the bulk of the sample over time. Comparisons of space charge distribution as a function of time in the samples with various filler orientations are depicted in Figure 3b. As regards to samples with parallel filler orientation, at the position of 195 μm, the space charge density is 65.0 C/m3 at 20 s, 86.8 C/m3 at 40 s, 126.6 C/m3 at 60 s and 174.3 C/m3 at 80 s. It is obvious that the space charge accumulation becomes more serious with time, and this feature exists in other samples. It should be kept in mind that the polymer with perpendicular orientation of the filler is assumed to have the deepest trap energy, the material with filler distributed randomly follows, and the trap energy of sample having filler parallel orientation is the shallowest. It can be observed that the amount of accumulated charge decreases with the increase of trap energy. For example, the maximum space charge density is 530.3 C/m3 at 80 s in the sample with parallel orientation of filler whereas that is 249.2 C/m3 when the filler orientation is perpendicular to the normal vector of the material. When the micro-filler is distributed randomly in the composite, the space charge density reaches its peak at 320.7 C/m3. Another interesting feature that can be derived from Figure 3b is that the amount of accumulated holes near the anode is larger than that of electrons near the cathode in all samples. Such phenomena should be attributed to the lower mobility of holes.
The comparisons of the density of free charge and trapped charge in different samples are illustrated in Figure 4a,b, respectively. The sample with perpendicular filler orientation has been taken as an example. At x = 3 μm, the density of free charge is −8.3 C/m3 at 20 s, −9.9 C/m3 at 40 s, 13.2 C/m3 at 60 s and −22.8 C/m3 at 80 s. As a comparison, the corresponding values are −54.2, −90.6, −98.6 and −99.7 C/m3, respectively, for the trapped charge. The density of charge increases over time for both free charge and trapped charge, which is similar to the features observed from Figure 4(a1,b1) and Figure 4(a2,b2). It can be seen from Figure 4 that the density of free charge and trapped charge are affected by the trap energy. For example, at x = 5 μm nearby the cathode, the density of free and trapped electrons in the sample with parallel filler orientation are −75.9 and −41.5 C/m3 at t = 80 s, whereas they are −23.4 and −90.6 C/m3 in the sample with randomly distributed filler, respectively. As for the material with perpendicular filler orientation, the densities of free and trapped charges are −19.2 and −99.3 C/m3. As mentioned above, the probability of charge de-trapping is inversely proportional to the trap energy in the polymer [20], thus the charges captured by the deeper trap are more difficult to de-trap while the charges localized in the shallower trap are easier to de-trap. Therefore, with the growth of trap energy, the density of trapped charge increases, whereas the density of free charge decreases.

4.2. Electric Field Distribution

It has been generally accepted that the electric field in the polymer can be distorted due to the space charge accumulation [27]. The distorted electric field in the material is demonstrated in Figure 5a, taking the sample with filler random orientation as an example. At the initial moment, a uniform electric field distribution can be observed while the electric field distorts as time elapses. It can be also noticed from Figure 5a that, at the middle of the composite, the electric field is 268.6 kV/mm at 80 s whereas the values of electric field are 19.5 and 14.8 kV/mm at anode and cathode, respectively. It can be concluded that the electric field in the sample bulk is higher than that at the electrode. Similar results can be also noticed in the other two samples, as depicted in Figure 5b. Since homocharges are accumulated near the electrode as discussed in Figure 3 and the equivalent electric field formed by the charges is opposite to the applied field, the field at the electrode is weakened. As mentioned above, more positive charges accumulate near the anode than negative charges near the cathode due to their lower carrier mobility. According to Poisson’s equation (6), the derivative of the electric field with respect to position is proportional to the density of accumulated charges. Therefore, the position at which the maximum electric field appears is biased toward the anode as shown in Figure 5b. Another interesting feature that could be derived from Figure 5b is that the maximum superimposed electric field in the composite increases with time.
In order to compare the electric field distortion, the electric field distribution factor f is calculated, which is defined as the radio of the superimposed electric field to the applied electric field calculated only from the applied voltage and the sample thickness. Figure 6a depicts the factor of electric field distortion at different times as a function of position in the sample with random filler orientation. At the initial moment, the internal electric field is almost determined by the applied voltage, resulting in a uniform distribution in the bulk with the distortion of electric field only near the sample electrode. With the lapse of the time for voltage application, the electric field in the bulk distributes unevenly. Comparisons of f in various samples as a function of position in different times are exhibited in Figure 6b. For example, at 80 s, the electric field distortion factor of the material with parallel filler orientation reaches its peak at 1.28, while the maximum of f is 1.35 in the sample having randomly oriented filler. In addition, f maximizes at 1.38 in the composite with perpendicular filler orientation. It can be concluded from Figure 6b that the distortion of electric field becomes more serious with the growth of trap energy as time goes by.
Figure 7 shows comparisons of the absolute value of maximum electric field in the various samples as a function of time. The values of the assumed threshold electric field Fc calculated by Equation (15) are 250, 302 and 383.9 kV/mm. for the sample with parallel, random and perpendicular filler orientation, respectively. The breakdown of the sample with parallel filler orientation takes place firstly at 81 s while the applied electric field is 202.5 kV/mm. The breakdown is most difficult to occur for the material with perpendicular filler distribution at 106 s when the electric field with a value of 265.0 kV/mm is applied to the composite. As h-BN is distributed randomly in the sample, the time of breakdown occurred is 90 s and the corresponding electric field is 225.0 kV/mm. The possible charge transport behavior in the composite with perpendicular and parallel filler orientations is shown in Figure 8a,b. The doped particles are distributed mainly in the amorphous region. Figure 8a shows that, when the h-BN is perpendicular to the normal vector of the sample, the charge injection is suppressed and the amount of charge recombination is lower compared with the sample with parallel filler orientation. As a comparison, Figure 8b demonstrates that more charges are injected from the electrode into the material while the density of charge recombination is higher in the sample with parallel filler orientation. Meanwhile the density of trapped charge is largest in the sample with perpendicular filler orientation, whereas that is smallest when the filler is parallel to the normal vector of the sample as mentioned above and shown in Figure 8. Such behavior should be attributed to the deeper trap energy in the composite with perpendicular orientation. It was generally accepted that the addition of nano-sized particles would introduce deep traps at the interface between the polymer matrix and the particle [42] whereas the trap energy could become shallower due to the defects introduced by micro-particles [43]. In this paper, a synergistic effect between the micro- and nano-sized particles is considered in that the de-trapped charge could be captured again quickly by the trap, by which the overall time for the carrier remaining in the trap becomes longer and hence the trap depth would be deepened. Such an effect is strong for the sample with perpendicular filler orientation, but is weak while the h-BN is parallel to the normal vector of the material. Due to the different filler orientations, the synergistic effect varies in the composite, which results in differenced in trap depth in the composite, thus affecting the charge transport and breakdown behavior of the sample. It was reported that the deep trap level was beneficial for the breakdown strength [44], and such a phenomenon was also verified in this paper via numerical simulation method. It should be noted that the trend of the simulation results in this paper was consistent with the experimental results reported in [42,44], and the order of magnitude was also identical to the results described in [36], thus verifying the reasonability of our simulation results. In short, the perpendicular micro-filler orientation in the composite is suggested to suppress the charge injection and hinder the charge transport dynamics, due to the formation of deep traps originated from long-time charge capture. As a result, micro/nano-composites with perpendicular filler orientation have higher DC breakdown strength as compared with the other two cases.

5. Conclusions

The charge transport and DC breakdown behaviors of polyethylene-based micro/nano-composites with various orientations of the h-BN filler have been investigated by numerical simulation based on the BCT model in this paper. The main conclusions may be summarized as follows:
(1)
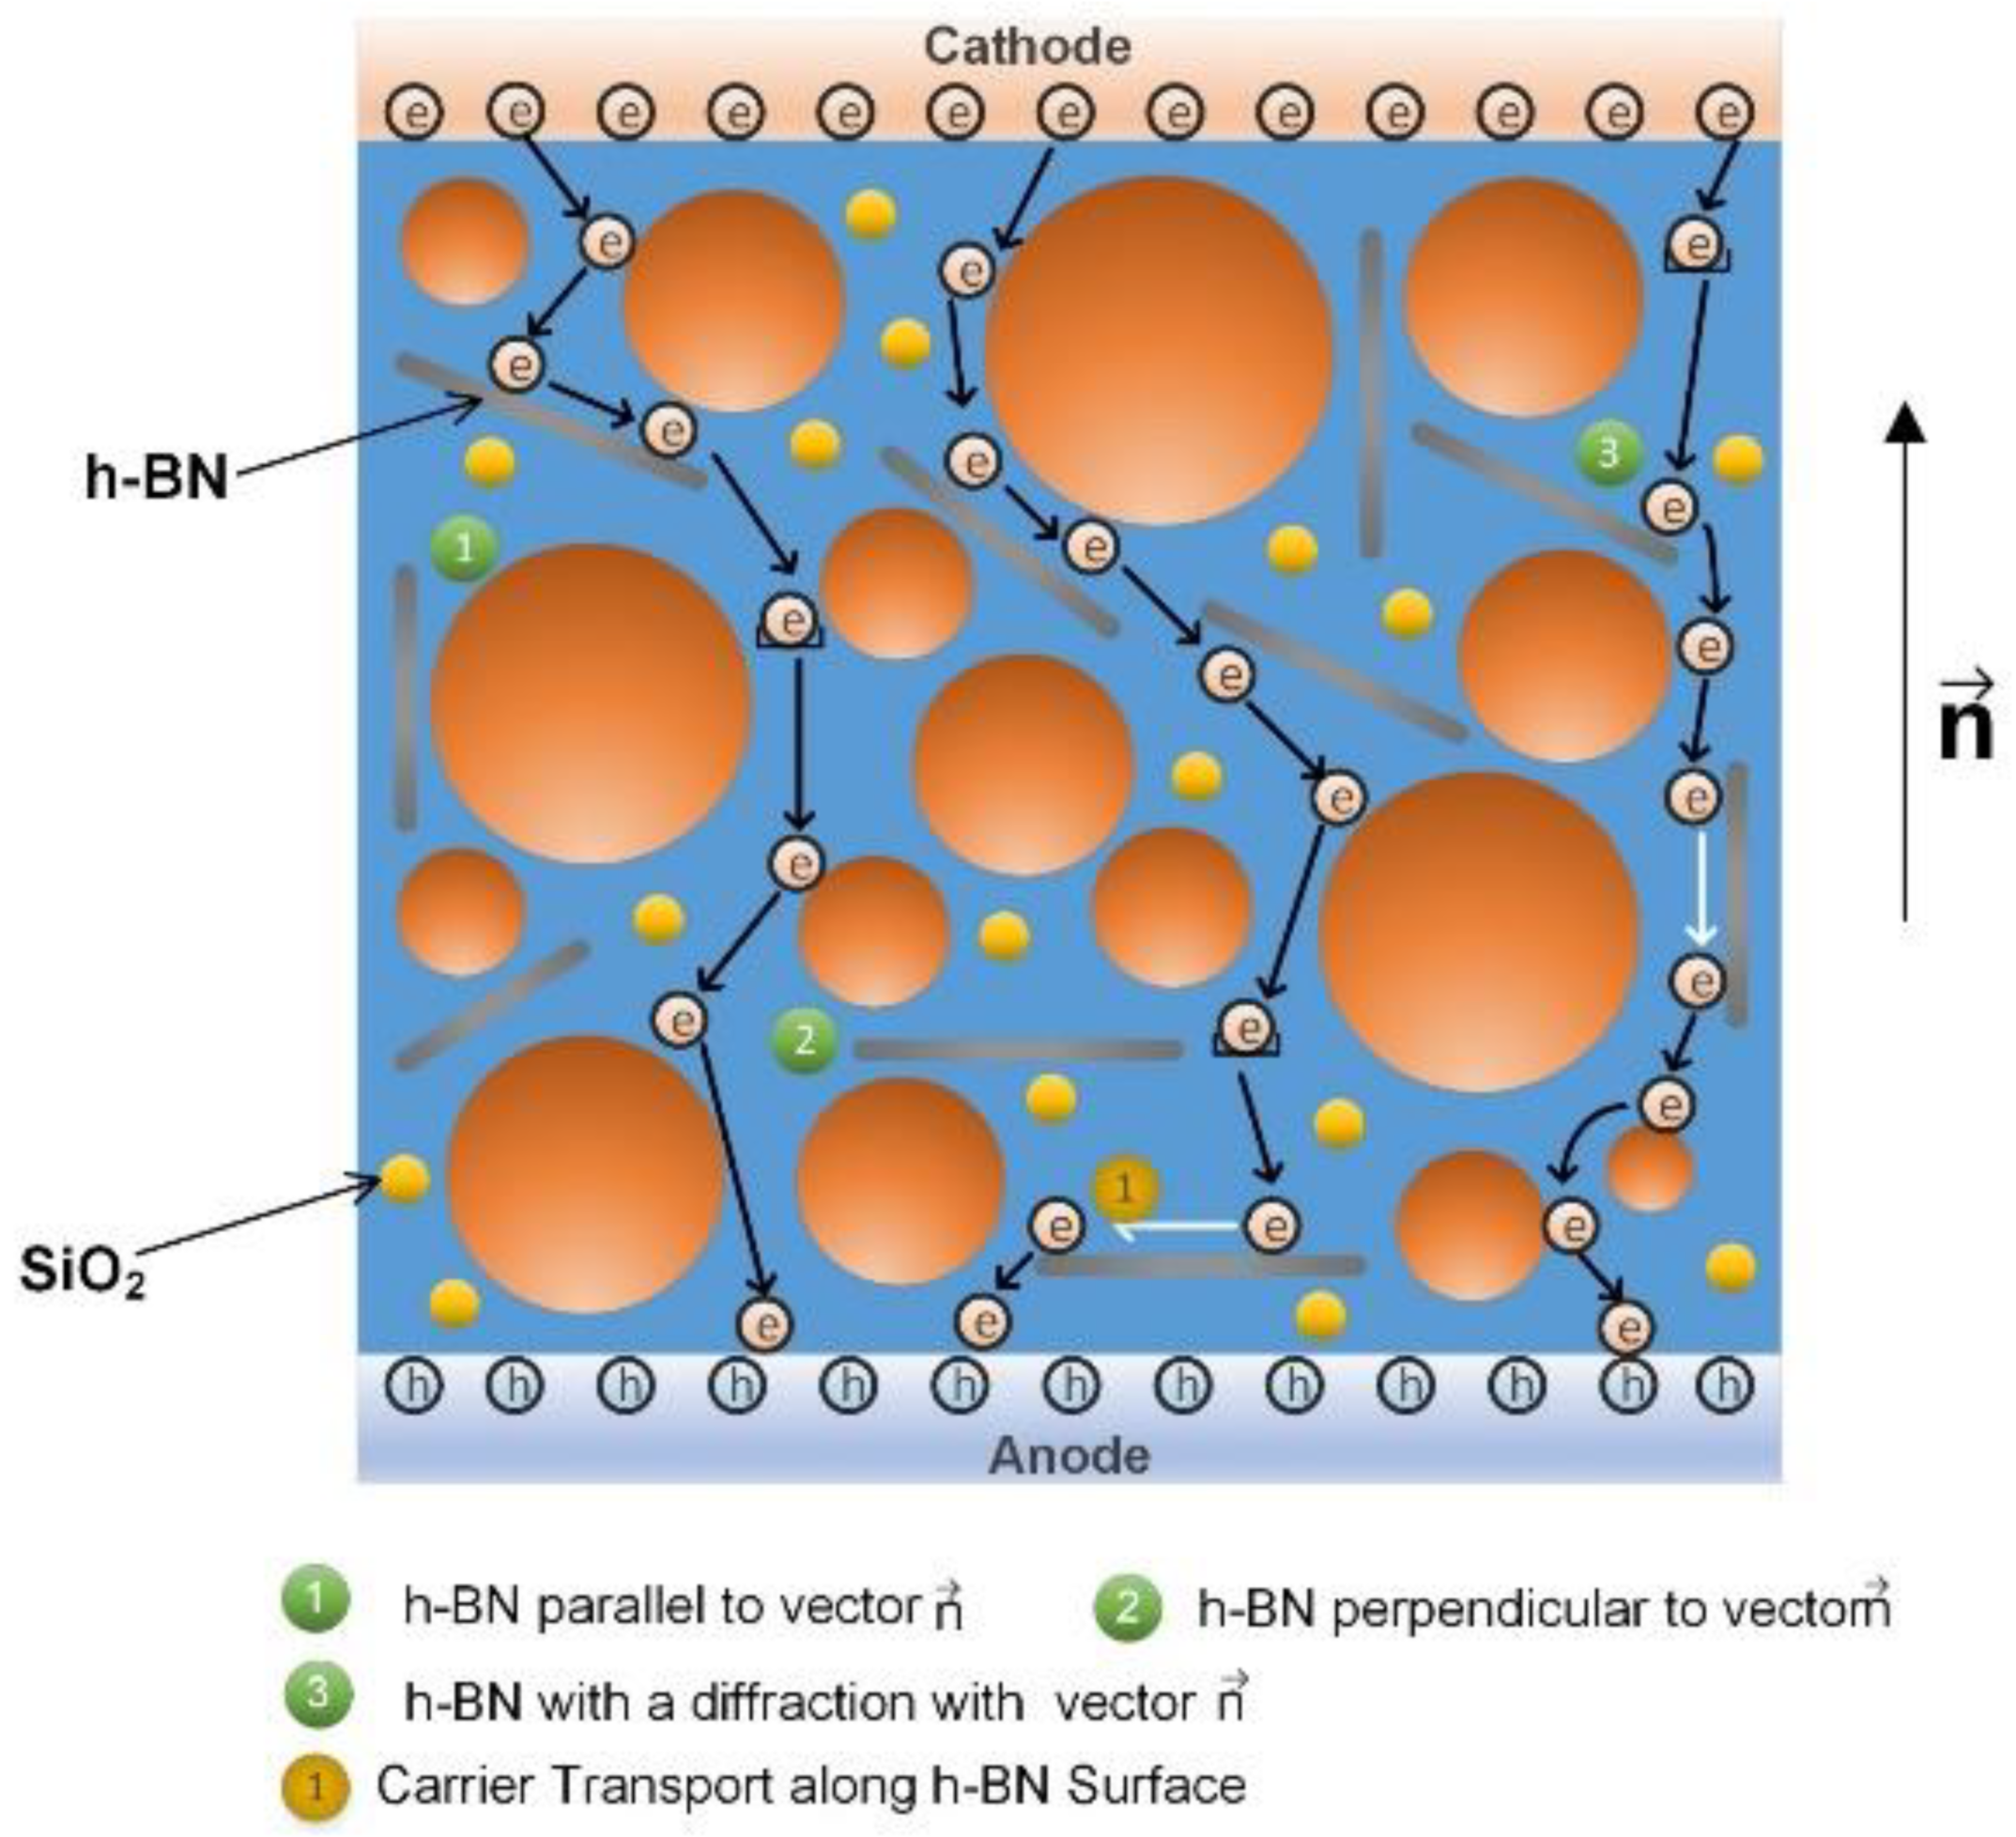
The density of accumulated space charge is the highest in the sample with parallel h-BN orientation, the material having filler distributed randomly follows and the lowest charge density appears as the h-BN is perpendicular to the normal vector of the composite surface.
(2)
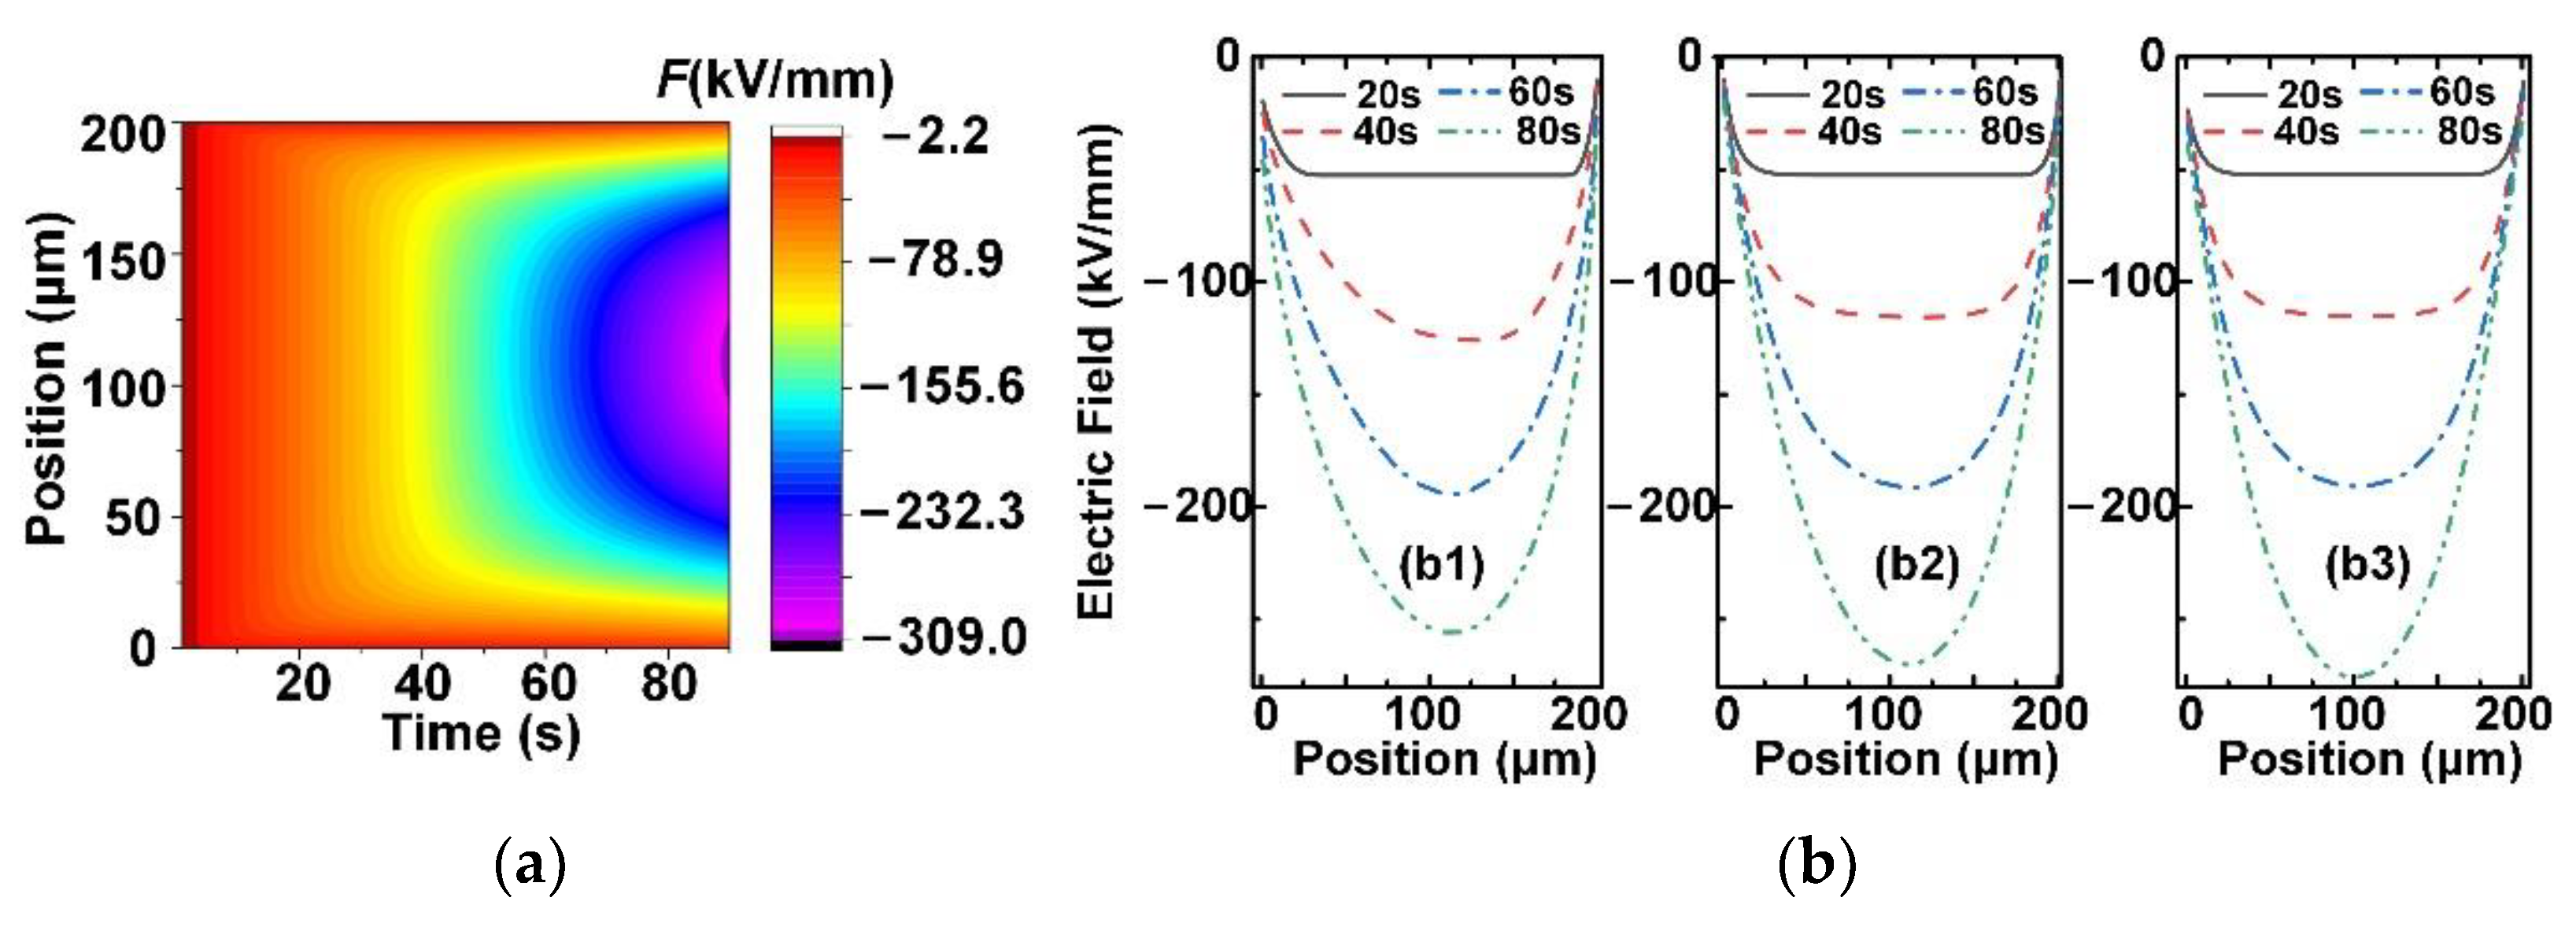
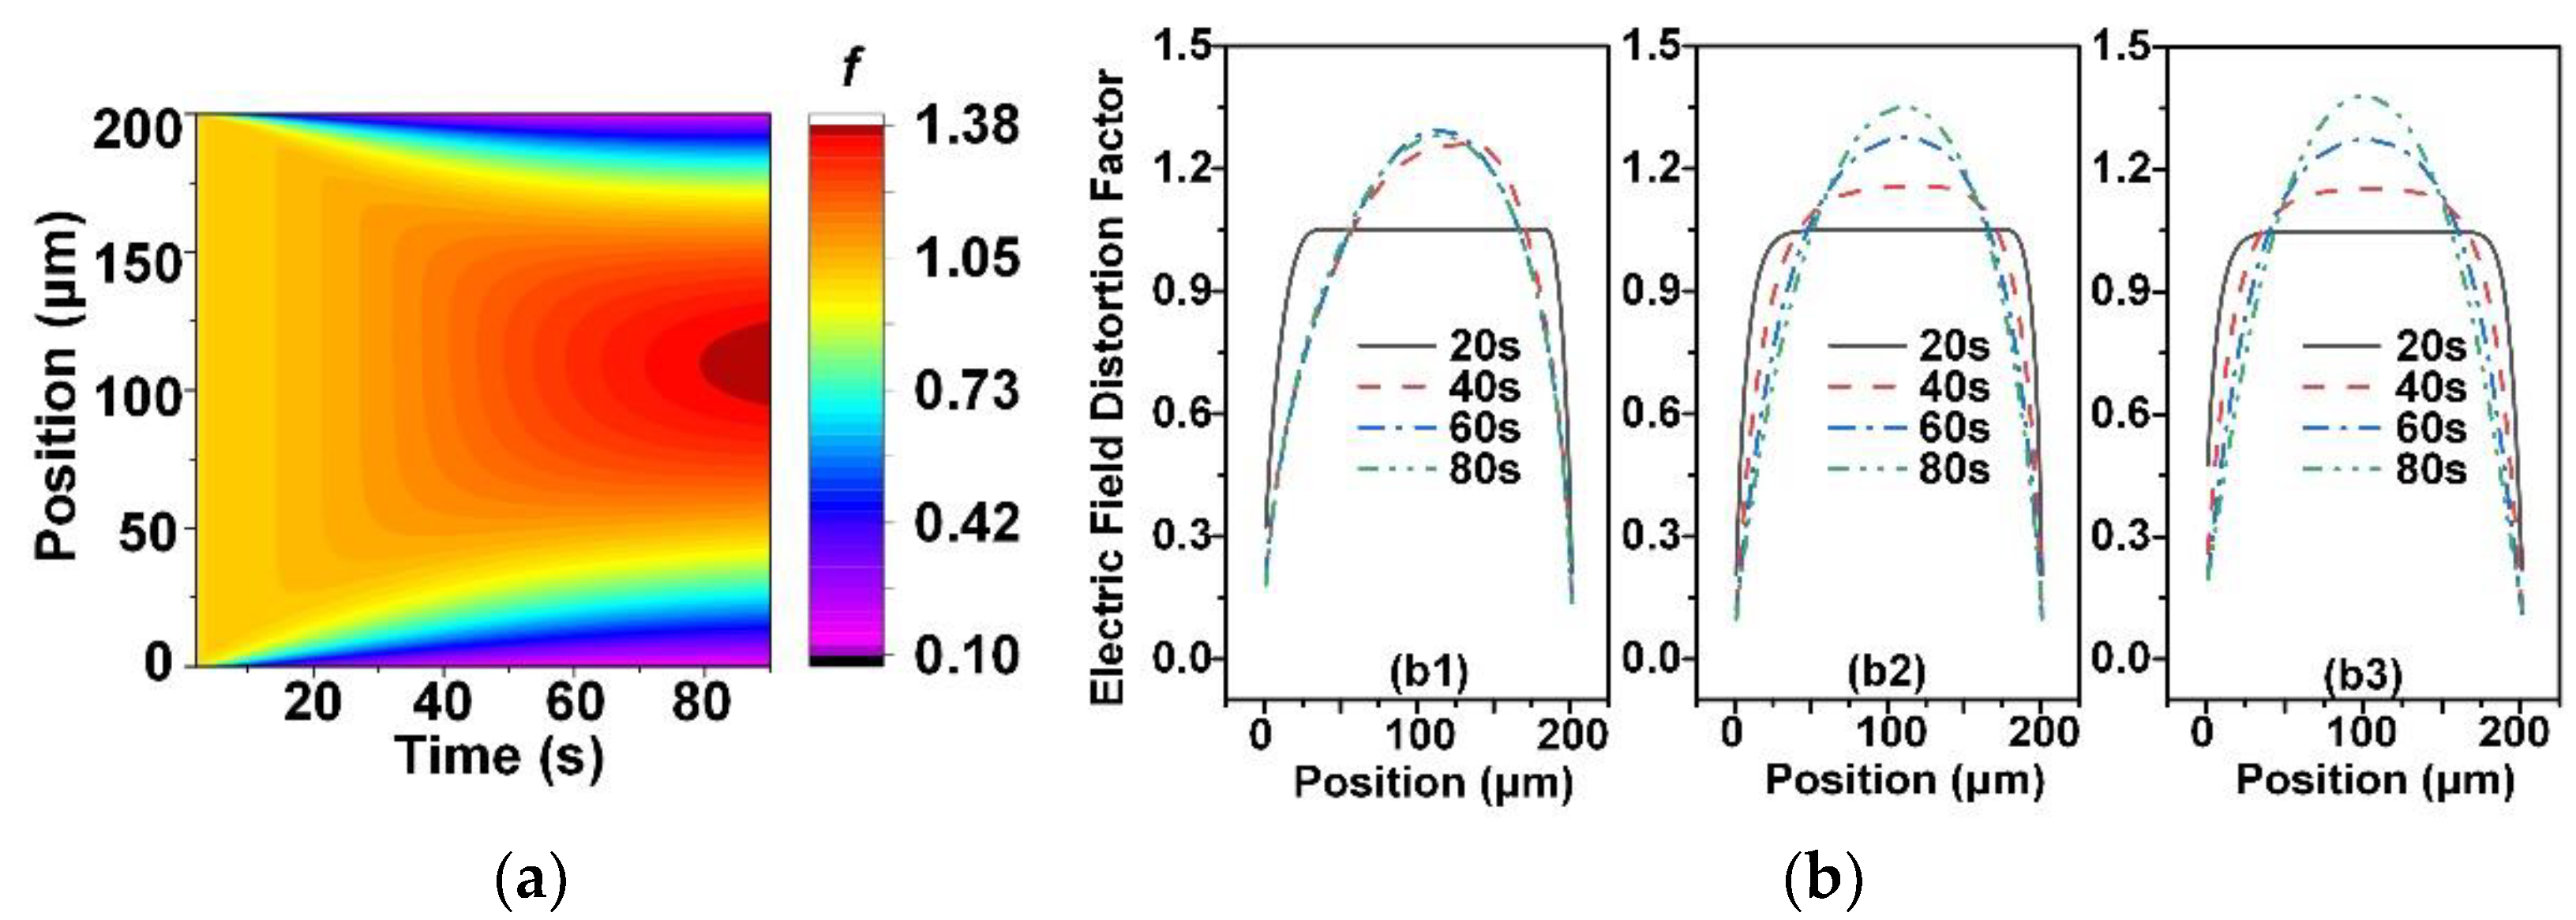
The electric field in the sample is distorted due to the space charge accumulation. The factor of electric field distortion is the smallest when the h-BN has a parallel orientation, whereas the distortion of electric field is most serious in the sample with the perpendicular orientation of h-BN.
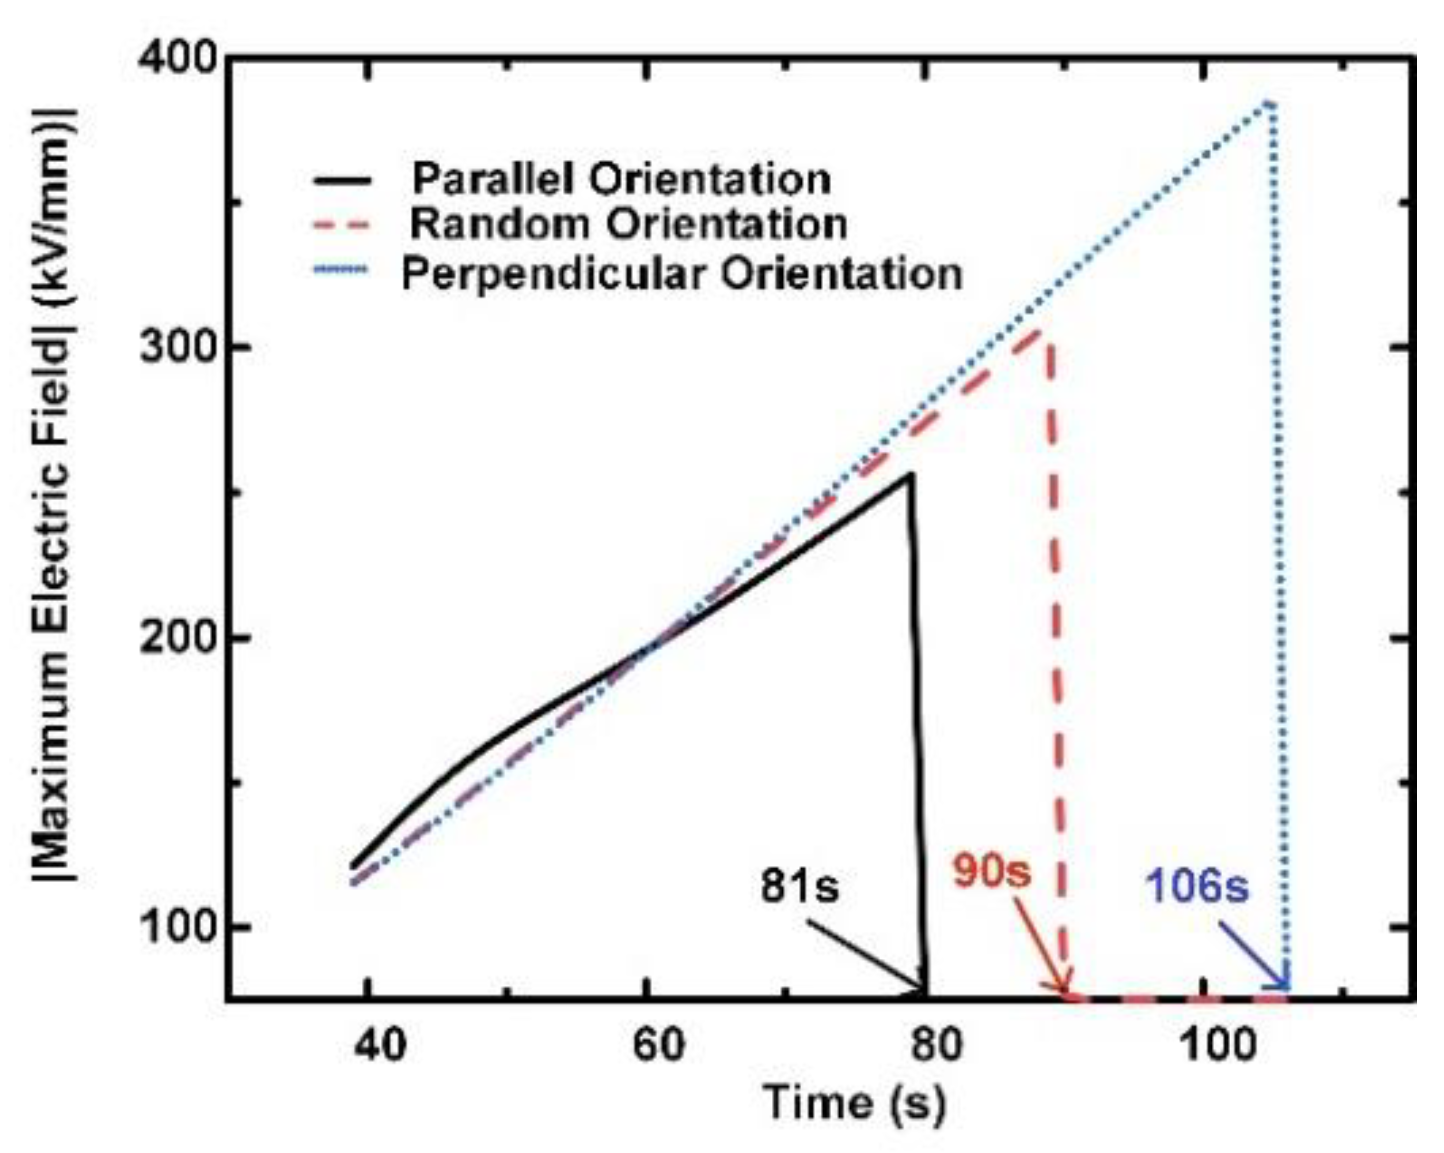
(3)
The breakdown of the sample most easily occurs when the h-BN has the parallel orientation, whereas the sample that has the highest breakdown strength as the h-BN with a perpendicular orientation.

Author Contributions

Conceptualization, X.X. and Y.G.; methodology, X.X. and Y.G.; software, X.X.; data curation, J.L.; formal analysis, X.X. and Z.S.; investigation, H.Z. and T.H.; writing—original draft preparation, X.X.; writing—review and editing, Y.G.; project administration, Y.G.; funding acquisition, Y.G. All authors have read and agreed to the published version of the manuscript.

Funding

This work is financially supported by State Grid Tianjin Electric Power Company (5500-202099277A-0-0-00).

Institutional Review Board Statement

Not applicable.

Informed Consent Statement

Not applicable.

Data Availability Statement

Not applicable.

Conflicts of Interest

The authors declare no conflict of interest.

References

  1. Chen, G.; Hao, M.; Xu, Z.; Vaughan, A.; Cao, J.; Wang, H. Review of high voltage direct current cables. CSEE J. Power Energy Syst. 2015, 1, 9–21. [Google Scholar] [CrossRef]
  2. Zhou, Y.; Peng, S.; Hu, J.; He, J. Polymeric insulation materials for HVDC cables: Development, challenges and future perspective. IEEE Trans. Dielectr. Electr. Insul. 2017, 24, 1308–1318. [Google Scholar] [CrossRef]
  3. Hanley, T.L.; Burford, R.P.; Fleming, R.J.; Barber, K.W. A general review of polymeric insulation for use in HVDC cables. IEEE Electr. Insul. Mag. 2003, 19, 13–24. [Google Scholar] [CrossRef]
  4. Huang, X.; Jiang, P.; Tanaka, T. A review of dielectric polymer composites with high thermal conductivity. IEEE Electr. Insul. Mag. 2011, 27, 8–16. [Google Scholar] [CrossRef]
  5. Huang, X.; Zhi, C.; Jiang, P.; Colberg, D.; Bando, Y.; Tanaka, T. Polyhedral oligosilsesquioxane-modified boron nitride nanotube based epoxy nanocomposites: An ideal dielectric material with high thermal conductivity. Adv. Funct. Mater. 2013, 23, 1824–1831. [Google Scholar] [CrossRef]
  6. Zhou, W.; Zuo, J.; Zhou, A.; Zhang, X. Thermal, electrical, and mechanical properties of hexagonal boron nitride–reinforced epoxy composites. J. Compos. Mater. 2013, 48, 2517–2526. [Google Scholar] [CrossRef]
  7. Zeng, X.; Yu, S.; Sun, R. Thermal behavior and dielectric property analysis of boron nitride-filled bismaleimide-triazine resin composites. J. Appl. Polym. Sci. 2013, 128, 1353–1359. [Google Scholar] [CrossRef]
  8. Wang, Z.; Iizuka, T.; Kozako, M.; Ohki, Y.; Tanaka, T. Development of epoxy/bn composites with high thermal conductivity and sufficient dielectric breakdown strength part I- sample preparations and thermal conductivity. IEEE Trans. Dielectr. Electr. Insul. 2012, 18, 1963–1972. [Google Scholar] [CrossRef]
  9. Sato, K.; Horibe, H.; Shirai, T.; Hotta, Y.; Nakano, H.; Nagai, H. Thermally conductive composite films of hexagonal boron nitride and polyimide with affinity-enhanced interfaces. J. Mater. Chem. 2010, 20, 2749–2752. [Google Scholar] [CrossRef]
  10. Gaska, K.; Kadar, R.; Rybak, A.; Siwek, A.; Gubanski, S. Gas barrier, thermal, mechanical and rheological properties of highly aligned graphene-ldpe nanocomposites. Polymers 2017, 9, 294. [Google Scholar]
  11. Tanimoto, M.; Yamagata, T.; Miyata, K.; Ando, S. Anisotropic Thermal Diffusivity of Hexagonal Boron Nitride-Filled Polyimide Films: Effects of Filler Particle Size, Aggregation, Orientation, and Polymer Chain Rigidity. ACS Appl. Mater. Interfaces 2013, 5, 4374–4382. [Google Scholar] [CrossRef] [PubMed]
  12. Tsekmes, I.A.; Morshuis PH, F.; Smit, J.J.; Kochetov, R. Enhancing the thermal and electrical performance of epoxy microcomposites with the addition of nanofillers. IEEE Electr. Insul. Mag. 2015, 31, 32–42. [Google Scholar] [CrossRef]
  13. Donnay, M.; Tzavalas, S.; Logakis, E. Boron nitride filled epoxy with improved thermal conductivity and dielectric breakdown strength. Compos. Sci. Technol. 2015, 110, 152–158. [Google Scholar] [CrossRef]
  14. Wang, Z.; Iizuka, T.; Kozako, M.; Ohki, Y.; Tanaka, T. Development of epoxy/bn composites with high thermal conductivity and sufficient dielectric breakdown strength partⅡ- breakdown strength. IEEE Trans. Dielectr. Electr. Insul. 2011, 18, 1973–1983. [Google Scholar] [CrossRef]
  15. Pourrahimi, A.M.; Olsson, R.T.; Hedenqvist, M.S. Nanocomposites: The role of interfaces in polyethylene/metal-oxide nanocomposites for ultrahigh-voltage insulating materials. Adv. Mater. 2018, 30, 1703624. [Google Scholar] [CrossRef]
  16. Pourrahimi, A.M.; Kumara, S.; Palmieri, F.; Yu, L.; Lund, A.; Hammarstr, T.; Hagstrand, P.; Scheblykin, L.; Fabiani, D.; Xu, X.; et al. Repurposing Poly(3-hexylthiophene) as a Conductivity-Reducing Additive for Polyethylene-Based High-Voltage Insulation. Adv. Mater. 2021, 33, 2100714. [Google Scholar] [CrossRef]
  17. Gaska, K.; Xu, X.; Gubanski, S.; Kadar, R. Electrical, mechanical, and thermal properties of ldpe graphene nanoplatelets composites produced by means of melt extrusion process. Polymers 2017, 9, 11. [Google Scholar]
  18. Koerner, H.; Jacobs, J.; Tomlin, D.; Busbee, J.; Vaia, R. Tuning polymer nanocomposite morphology: AC electric field manipulation of epoxy–montmorillonite (clay) suspensions. Adv. Mater. 2004, 16, 297–302. [Google Scholar] [CrossRef]
  19. Yan, H.; Tang, Y.; Long, Y.; Li, Y. Enhanced thermal conductivity in polymer composites with aligned graphene nanosheets. J. Mater. Sci. 2004, 49, 5256–5264. [Google Scholar] [CrossRef]
  20. Agarwal, S.; Khan, M.; Gupta, R. Thermal conductivity of polymer nanocomposites made with carbon nanofibers. Polym. Eng. Sci. 2008, 48, 2474–2481. [Google Scholar] [CrossRef]
  21. Shen, H.; Guo, J.; Wang, H.; Zhao, N.; Xu, J. Bioinspired modification of h-BN for high thermal conductive composite films with aligned structure. ACS Appl. Mater. Interfaces 2016, 7, 5701–5708. [Google Scholar] [CrossRef]
  22. Nan, W.; Su, J.; Wang, Y.; Chen, D. Fabrication of Ni@SiC composite nanofibers by electrospinning and autocatalytic electroless plating techniques. Results Phys. 2018, 12, 853–858. [Google Scholar]
  23. Xu, X.; Gao, Y.; Li, J.; Song, Z.; Peng, J.; Du, B. Charge Transport and DC Breakdown in Polymer Based Micro/Nano-Composite with Different Filler Orientations. In Proceedings of the 2020 IEEE International Conference on High Voltage Engineering and Application (ICHVE), Beijing, China, 6–10 September 2020; pp. 1–4. [Google Scholar]
  24. Min, D.; Li, S. Simulation on the influence of bipolar charge injection and trapping on surface potential decay of polyethylene. IEEE Trans. Dielectr. Electr. Insul. 2014, 21, 1627–1636. [Google Scholar] [CrossRef]
  25. Teyssedre, G.; Laurent, C. Charge transport modeling in insulating polymers: From molecular to macroscopic scale. IEEE Trans. Dielectr. Electr. Insul. 2005, 12, 857–875. [Google Scholar] [CrossRef]
  26. Laurent, C.; Teyssedre, G.; Roy, S.; Baudoin, F. Charge dynamics and its energetic features in polymeric materials. IEEE Trans. Dielectr. Electr. Insul. 2013, 20, 357–381. [Google Scholar] [CrossRef]
  27. Li, S.; Zhu, Y.; Min, D.; Chen, G. Space charge modulated electrical breakdown. Sci. Rep. 2016, 6, 32588. [Google Scholar] [CrossRef] [PubMed] [Green Version]
  28. Roy, S.; Teyssedre, G.; Laurent, C.; Montanari, G.; Palmieri, F. Description of charge transport in polyethylene using a fluid model with a constant mobility: Fitting model and experiments. J. Phys. D Appl. Phys. 2006, 39, 1427. [Google Scholar] [CrossRef]
  29. Chen, G.; Zhao, J.; Li, S.; Zhong, L. Origin of thickness dependent DC electrical breakdown in dielectrics. Appl. Phys. Lett. 2012, 100, 2135. [Google Scholar] [CrossRef] [Green Version]
  30. Li, S.; Min, D.; Wang, W.; Chen, G. Modelling of dielectric breakdown through charge dynamics for polymer nanocomposites. IEEE Trans. Dielectr. Electr. Insul. 2016, 23, 3476–3485. [Google Scholar] [CrossRef]
  31. Hoang, A.T.; Serdyuk, Y.V.; Gubanski, S.M. Charge transport in LDPE nanocomposites Part II—Computational approach. Polymers 2016, 8, 103. [Google Scholar]
  32. Kuik, M.; Koster, L.; Dijkstra, A.; Wetzelaer, G.; Blom, P. Non-radiative recombination losses in polymer light-emitting diodes. Org. Electron. 2012, 13, 969–974. [Google Scholar] [CrossRef] [Green Version]
  33. Shockley, W.; Read, W. Statistics of the recombinations of holes and electrons. Phys. Rev. 1952, 87, 835–842. [Google Scholar] [CrossRef]
  34. Gao, Y.; Xu, B.; Wang, X.; Jia, T. Charge transport in low density polyethylene based micro/nano-composite with improved thermal conductivity. J. Phys. D Appl. Phys. 2019, 52, 285302. [Google Scholar] [CrossRef]
  35. Min, D.; Li, Y.; Yan, C.; Xie, D.; Li, S.; Wu, Q.; Zhao, Z. Thickness-Dependent DC electrical breakdown of polyimide modulated by charge transport and molecular displacement. Polymers 2018, 10, 1012. [Google Scholar] [CrossRef] [Green Version]
  36. Min, D.; Cui, H.; Wang, W.; Wu, Q.; Zhao, Z.; Li, S. The coupling effect of interfacial traps and molecular motion on the electrical breakdown in polyethylene nanocomposites. Compos. Sci. Technol. 2019, 184, 107873. [Google Scholar] [CrossRef]
  37. Xie, D.; Min, D.; Yang, L.; Li, S. Temperature- and thickness-dependent electrical breakdown modulated by a coupling model of charge transport and molecular chain dynamics. J. Phys. D Appl. Phys. 2019, 52, 365305. [Google Scholar] [CrossRef]
  38. Min, D.; Li, S.; Ohki, Y. Numerical simulation on molecular displacement and dc breakdown of LDPE. IEEE Trans. Dielectr. Electr. Insul. 2016, 23, 507–516. [Google Scholar] [CrossRef]
  39. Bhutta, M.; Yang, L.; Ma, Z.; Nazir, M.; Akram, S.; Mehmood, M.; Faiz1, N. Simulation of thickness controlled dc breakdown of XLPE regulated by space charge & molecular chain movement. IEEE Trans. Dielectr. Electr. Insul. 2020, 27, 1143–1151. [Google Scholar]
  40. Frenkel, J. On pre-breakdown phenomena in insulators and electronic semi-conductors. Phys. Rev. 1938, 54, 647–648. [Google Scholar] [CrossRef]
  41. Wu, K.; Dissado, L.A.; Okamoto, T. Percolation model for electrical breakdown in insulating polymers. Appl. Phys. Lett. 2004, 85, 4454–4456. [Google Scholar] [CrossRef] [Green Version]
  42. Wang, W.; Li, S. Correlation between trap parameters and breakdown strength of polyethylene/alumina nanocomposites. In Proceedings of the 2014 International Symposium on Electrical Insulating Materials (ISEIM), Niigata, Japan, 1–5 June 2014; pp. 73–76. [Google Scholar]
  43. Tanaka, T.; Wang, Z.; Iizuka, T.; Kozako, M.; Ohki, Y. High thermal conductivity epoxy/BN composites with sufficient dielectric breakdown strength. In Proceedings of the 2011 Annual Report Conference on Electrical Insulation and Dielectric Phenomena (CEIDP), Cancun, Mexico, 16–19 October 2011; pp. 691–694. [Google Scholar]
  44. Wang, W.; Li, S.; Min, D. Understanding the conduction and breakdown properties of polyethylene nanodielectrics: Effect of deep traps. IEEE Trans. Dielectr. Electr. Insul. 2016, 23, 564–572. [Google Scholar] [CrossRef]
Figure 1. Scheme of BCT model of the polymeric materials, ETe and ETh are the trap energy of the electrons and holes, respectively.
Energies 14 04645 g001
Figure 2. Scheme of various filler orientations and possible charge transport mechanism within the polyethylene micro/nano-composite.
Energies 14 04645 g002
Figure 3. Space charge distribution in the sample with random orientation (a) and comparisons of space charge distribution as a function of time in the polymer with various orientations: parallel orientation (b1) random orientation (b2) perpendicular orientation (b3).
Energies 14 04645 g003
Figure 4. Comparisons of free charge (a) and trapped charge (b) in the polymer with various orientations: parallel orientation (a1,b1) random orientation (a2,b2) perpendicular orientation (a3,b3).
Energies 14 04645 g004
Figure 5. Electric field distribution in the sample with random orientation (a) and comparisons of electric field distribution as a function of position in the polymer with various orientations (b): parallel orientation (b1) random orientation (b2) perpendicular orientation (b3).
Energies 14 04645 g005
Figure 6. Electric field distribution factor in the sample with random orientation (a) and comparisons of electric field distribution factor as a function of position in the polymer with various orientations (b): parallel orientation (b1) random orientation (b2) perpendicular orientation (b3).
Energies 14 04645 g006
Figure 7. Comparisons of maximum electric field in the polymer with various orientations as a function of time.
Energies 14 04645 g007
Figure 8. Charge transport behavior in the sample with perpendicular (a) and parallel filler orientation (b).
Energies 14 04645 g008
Table 1. The values of the parameters used in BCT simulation [35,36,37,38,39].
ParametersValue
Relative permittivity, εr2.3
Carrier mobility for electron, μemol, (×10−15 m2/Vs)8–9
Carrier mobility for hole, μhmol, (×10−15 m2/Vs)2–3
Trap energy for electron, ETe, (eV)0.7–1
Trap energy for hole, ETh, (eV)0.7–1
Trap density for electron, NTe, (1/m3 )6.25 × 10²⁰
Trap density for hole, NTh, (1/m3 )6.25 × 10²⁰
Ramping rate of the voltage, kramp, (kV/s)−0.5
Publisher’s Note: MDPI stays neutral with regard to jurisdictional claims in published maps and institutional affiliations.

