Abstract
Humanity is dependent on natural resources. Use and productivity of these resources plays an important role in energy savings and circular economy. The goal of this contribution is to evaluate productivity of resources in the frame of EU countries. Single analysis deals with data from the publicly available portal database and collected data were processed in the statistical software JMP. The trend of development and analysis of variability and linear dependence helped to create cluster analysis and comparison of the EU countries. The results from the view of average value of the indicator registered the growth, and from the view of variability the statistically important differences were verified for EU member states. Some pairs of indicators recorded positive, while some pairs recorded negative linear dependence. Cluster analysis shows two groups of countries—the first one with positive results, having the lowest tax burden in the case of energy taxes and environment, and the second one with negative results, having the highest tax burden of environmental and energy policy. The results are useful for a proper setting of energy and environmental goals that can increase the effectiveness of resource productivity in the countries studied.
1. Introduction
Effective use of raw materials means the sustainable use of the limited resources of the Earth. Humanity is dependent on natural resources—metals, minerals, fuels, water, soil, wood, fertile soil, clean air and biodiversity. All mentioned resources present significant input that makes possible the operation of our economy. Raw materials are the prerequisite for the production of enterprises. Therefore, the science of materials management relates to economic benefit of an enterprise from the view of reducing costs and promoting the efficiency of materials management, which further reflects the important role of the materials classification in materials procurement [1]. Proper choice of the materials also plays a significant role in energy savings and high-quality suppliers [2,3].
Increasing the effectiveness of materials use is a key approach to providing economic growth and new workplaces in Europe [4]. It brings many economic possibilities, including decreasing costs and increasing competition [5]. Therefore, we must find new tactics toward this goal in all steps of the value chain: to improve management of resource stocks; to decrease inputs; to optimize production processes, management and business methods; to improv logistics; to change the calculation of consumption and decrease waste; and to develop new products and services.
Effective use of raw materials can help to stimulate technological innovation, increase employment in the rapidly developing sector of ecological technologies, open new export markets and bring benefits for consumers through sustainable products [6]. Effective use of raw materials also means the sustainable use of limited resources while minimizing impacts to the living environment [7,8]. This enables the creation of more products with higher value, while using less materials. This approach is a result of the main initiative of Europe to use a resource effectively as a part of Strategy Europe 2020, a strategy of EU growth for an intelligent, inclusive, and sustainable economy [9,10]. It supports the transition to sustainable growth through a low-carbon economy, effectively using the available resources. The plan for Europe to use resources effectively is one of the basic elements of the initiative of effective resources use. A road map was created that determined the framework for performing future activities. The plan also outlined structural and technological changes to be made by 2050, including milestones that should be achieved by 2020.
Fast and reliable evaluation of the materials’ efficiency is necessary [11]. Moreover, the announcement, “towards circular economy” (also referred to as circularity, which means an economic system that tackles global challenges like climate changes, biodiversity loss, waste and pollution) supports further basic transition in EU, compared to a linear economy, where the resources are not only extracted, but not reused and returned to production. In a circular economy, the resources must be returned to the circle to be used for the longest possible time. Measurements leading to the effective use of resources and the minimization of waste are determined in this study. The circular economy is presently studied by a number of authors, throughout the world and in Europe [12,13].
The goal of this contribution is to evaluate a level of the indicator, expressing source productivity in the frame of individual EU countries during 10 analyzed years, and to define a trend of the development and discover connections with other indicators, evaluated at the EU level. The structure of the contribution consists of an investigation of the present state of problem solving followed by main research, consisting of three steps: basic analysis of resource productivity in EU, analysis of linear dependence of resource productivity indicators, and cluster analysis according to the similar behavior clusters that have been created.
2. Present State of Problem Solving
In the last decades the EU established a broad scale of legal decrees in the area of the living environment. This required focus on the Triple Bottom Line approach, measuring the impacts of business on 3P (people, planet, profit) criteria [14,15,16].
Due to these decrees, the aforementioned pollution of air, water and soil considerably decreased. The legal decrees were modernized, and concerned mainly chemical elements, limiting the use of various toxic or dangerous substances. Presently, inhabitants of EU have the best quality of water worldwide and more than 18% of the EU area is registered as protected areas of nature. However, there is still a number of problems needing structural solutions.
The seventh Environmental Action Program (EAP) includes European policy in the area of the living environment to the year 2020, with a goal to give a long-term vision of EU to 2050 [17]. The goal is to live in 2050 properly, in the frame of the ecological limits of the planet. The prosperity of humanity and a healthy environment will be the result of an economy focused on the sustainable use of natural resources, and, protecting, evaluating, and renewing biodiversity. This growth, paired with a decrease of CO2 emissions, and responsible use of resources, will create a secure and sustainable global society.
Three key goals are determined in the frame of the program:
- -
- To protect, preserve and increase the natural capital of the EU;
- -
- To change the EU to an ecological and competitive low-carbon economy, effectively using available resources;
- -
- To protect EU inhabitants from the problems connected with the living environment and risks of health and comfort.
At the same time “four activators” can help the EU to meet these goals:
- -
- Better implementation and holding of legislation;
- -
- More frequent and wise investments into policy regarding the living environment and climate protection;
- -
- Full integration of environmental demand and considerations to other policies [18].
From the view of an aforementioned number of authors, evaluating materials use and their impact on the living environment from different considerations is of utmost importance. Joensuu et al. (2020) determined sectors that are most responsible for materials extractions and use [19]. This must be evaluated due to the impact it has on the protection of the living environment, as well as in reusing and recycling of materials. According to Chen et al. (2020), materials use requires safe and effective evaluation with the goal of helping to develop innovative products [20].
Rajca et al. (2020) studied materials use for refuse-derived fuel in order to use it for energy purposes [21,22]. Materials can also be used in waste. In this area, Girondi et al. (2020) studied use of biomass in ceramic materials, observing that it was possible to save costs for the ceramic industry [23]. Tian et al. (2020) studied materials use from the view of temperature [24]. According to their results, economic evaluations are significant criteria in the marketing area of any industrial product produced from raw materials.
During the economic evaluation of materials use it is necessary to also consider technical criteria and material properties [25]. Factor analysis quality and assessments of the innovations using can be used during the economic evaluation of materials from the view of innovative materials [26].
Presently, there is a drive to advance technology, such as the use of better and cheaper material [27]; increasing material efficiencies and pairing that with maintaining a clean environment for people, as well as the life cycle cost of the alternative energy proposals are compared.
Wang et al. (2019) recommend using eco-friendly materials in different industries; however, data for each eco-friendly material are managed individually, causing inefficiency, increased costs, and potentially greater environmental impacts associated with material and resource choice [28].
Long et al. (2018) studied the workability, static and dynamic mechanical properties, and environmental impact of materials from the view of thermoplastic behavior, finding through an economic and ecological evaluation a benefit to the environment [29]. Guo et al. (2018) summarized and discussed materials use based on the analysis of economic indicators, including initial cost, operating cost, revenue, subsidy, and energy cost [30]. Haider and Bhat (2020) studied the linkage between material and energy efficiency and total factor productivity, finding that not all states are equally energy intensive [31]. The increase of total factor productivity is associated with a lower level of energy per unit of output.
Material and energy consumption do not have a direct causal relationship to gross domestic product [32], which is necessary for follow-up of sustainable development. A study by Belke [33] found a long-running relationship between material and energy consumption and GDP. Productivity in the area of material recycling must also be researched [34], bringing contributions to the improvement of municipal solid waste management. Moreover, material use and recycling must be regarded in the construction industry especially [35,36], affecting entrainment factors such as energy consumption, carbon footprints, and overall construction operation productivity. The productivity of material use in the rest of the production steps can be increased. For example, Dini et al. (2018) studied how wood can be used throughout its entire production so that its production can be more economical [37].
During this research, we obtained results from previous research aiming to analyze the effectiveness of resource use at the level of individual EU states in context of the goals determined in the frame of environmental policy in 2020. Consequently, the goal of this contribution is also to define the intensity of the economic transformation necessary to influence the circular economy toward meeting the EU environmental policy goals.
3. Materials and Methods
In the frame of single analysis, we obtained results from the continuously published values of chosen indicators from the portal https://ec.europa.eu/eurostat/data/database (20 June 2020) during all available years and for all available member states. Collected data had been registered, selected, and adopted in the database, and created in MS Excel editor according to the demands of the statistical software JMP, where adapted data was transmitted and then analyzed [38].
The collected data presents the results of the eight chosen indicators during 1995–2018 (Table 1). The constructed database consists of 3765 data points and any indicator is defined for concrete EU member state and concrete year. As we can see from Table 1, the extent of published data for each indicator is considerably different, while the volume of data connects with an incompleteness of countries assigned, or the publishing of data for some indicators for any second year, as in the case of measure of recycling, waste production on GDP, and measure of waste stocking. Extend and structure of obtained data had been adapted by analysis choice and results formulation.

Table 1.
Structure of collected data.
The process of the analysis is as follows:
- Analysis of the main indicator—productivity of sources:
- -
- Trend of development;
- -
- Graphical analysis—cartographer;
- -
- Analysis of the variability—nonparametric Kruskal-Wallis test.
- Mutual analysis of a group of indicators:
- -
- Analysis of linear dependence—pair correlation analysis of indicators;
- -
- Cluster analysis;
- -
- Comparison of the countries.
Resource and material productivity represent the main indicator of the evaluation table in effectiveness of resources. It is used for the monitoring of the steps taken toward effective use of resources in the EU. The indicator is defined as gross domestic product (GDP) divided by domestic material consumption (DMC). DMC measures total volume of materials directly used in the economy, defining the annual volume of raw materials as that extracted from a domestic territory into the local economy, plus all physical import, minus all physical export. It is necessary to underline that “consumption” in DMC means net, not last consumption. DMC does not include inflows connected with import and export of raw materials and products with origin outside the local economy.
Since productivity of sources is calculated as GDP divided by DMC, measuring units are GDP units over DMC units.
PPS, standards of purchase power, present fictitious “currency” units that remove differences in purchase power, and by this way eliminate differences in price levels in individual countries used during comparison between countries.
4. Results
4.1. Basic Analysis of Sources Productivity in EU
The indicator of resource productivity is defined as the GDP and DMC rate in a concrete year and country. Due to the achievement of environmental policy goals in the EU, the effort of any country is to increase the value of the indicator.
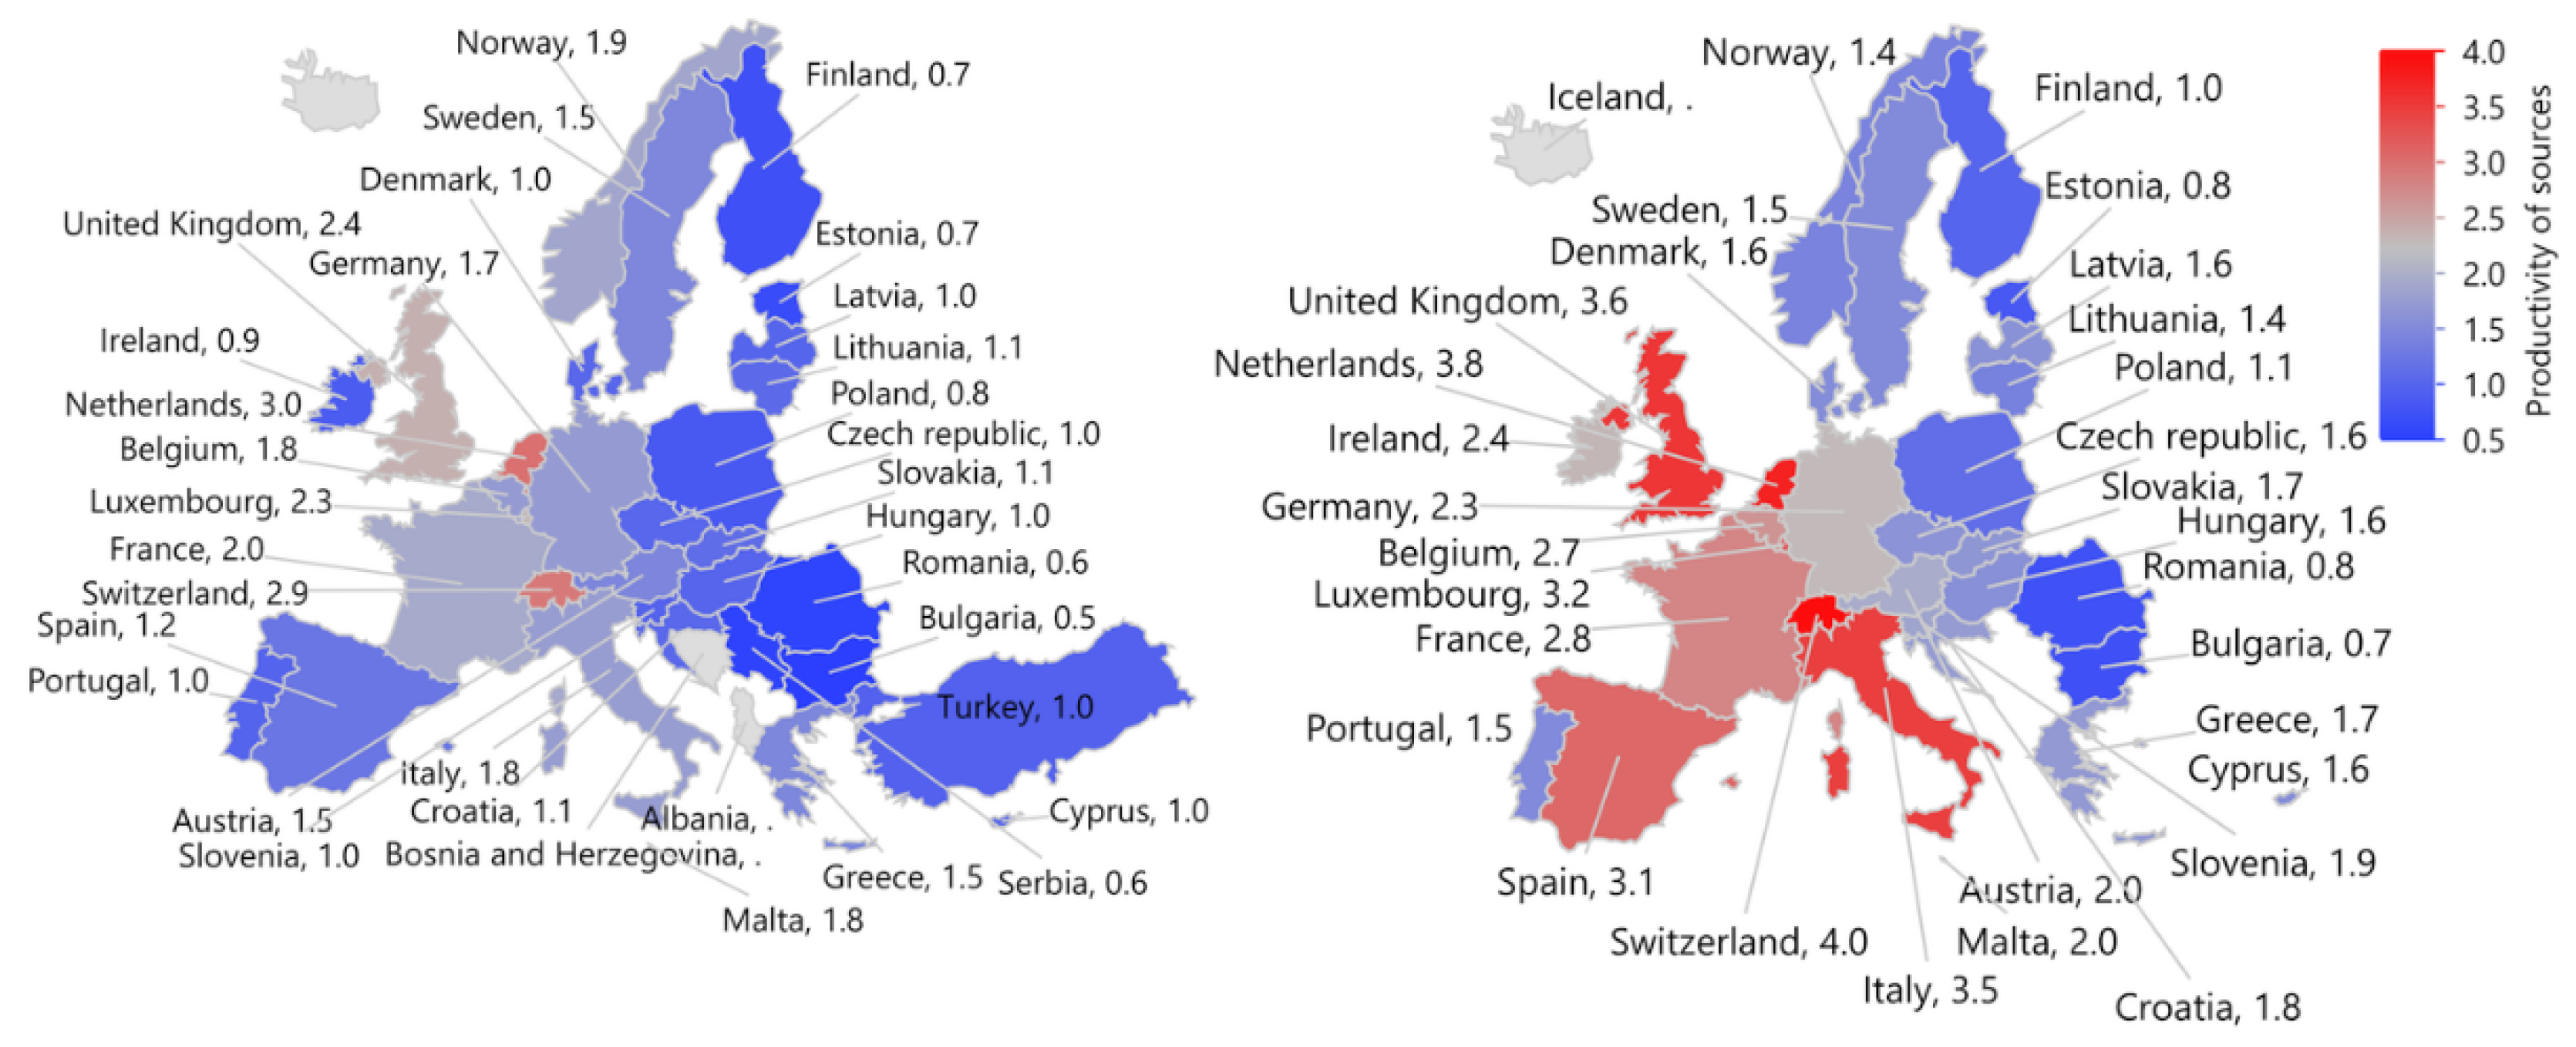
Analysis of the published results in the database Eurostat of the indicator during 2000–2018 in EU member states had been evaluated from the view of success of each country orientation in an effort to use the resources effectively. With the use of a cartographer it is possible to make visual comparisons of the countries. In 2006, Switzerland and the Netherlands belonged to the countries with the highest values of the indicator. Ten years later there is considerable change in the color scale of the countries, but still the best results are recorded in Switzerland and Netherlands. However, some additional countries are entering to this group, such as Italy, England, Spain and France (Figure 1).

Figure 1.
Cartographer—resources productivity in 2006 and 2016.
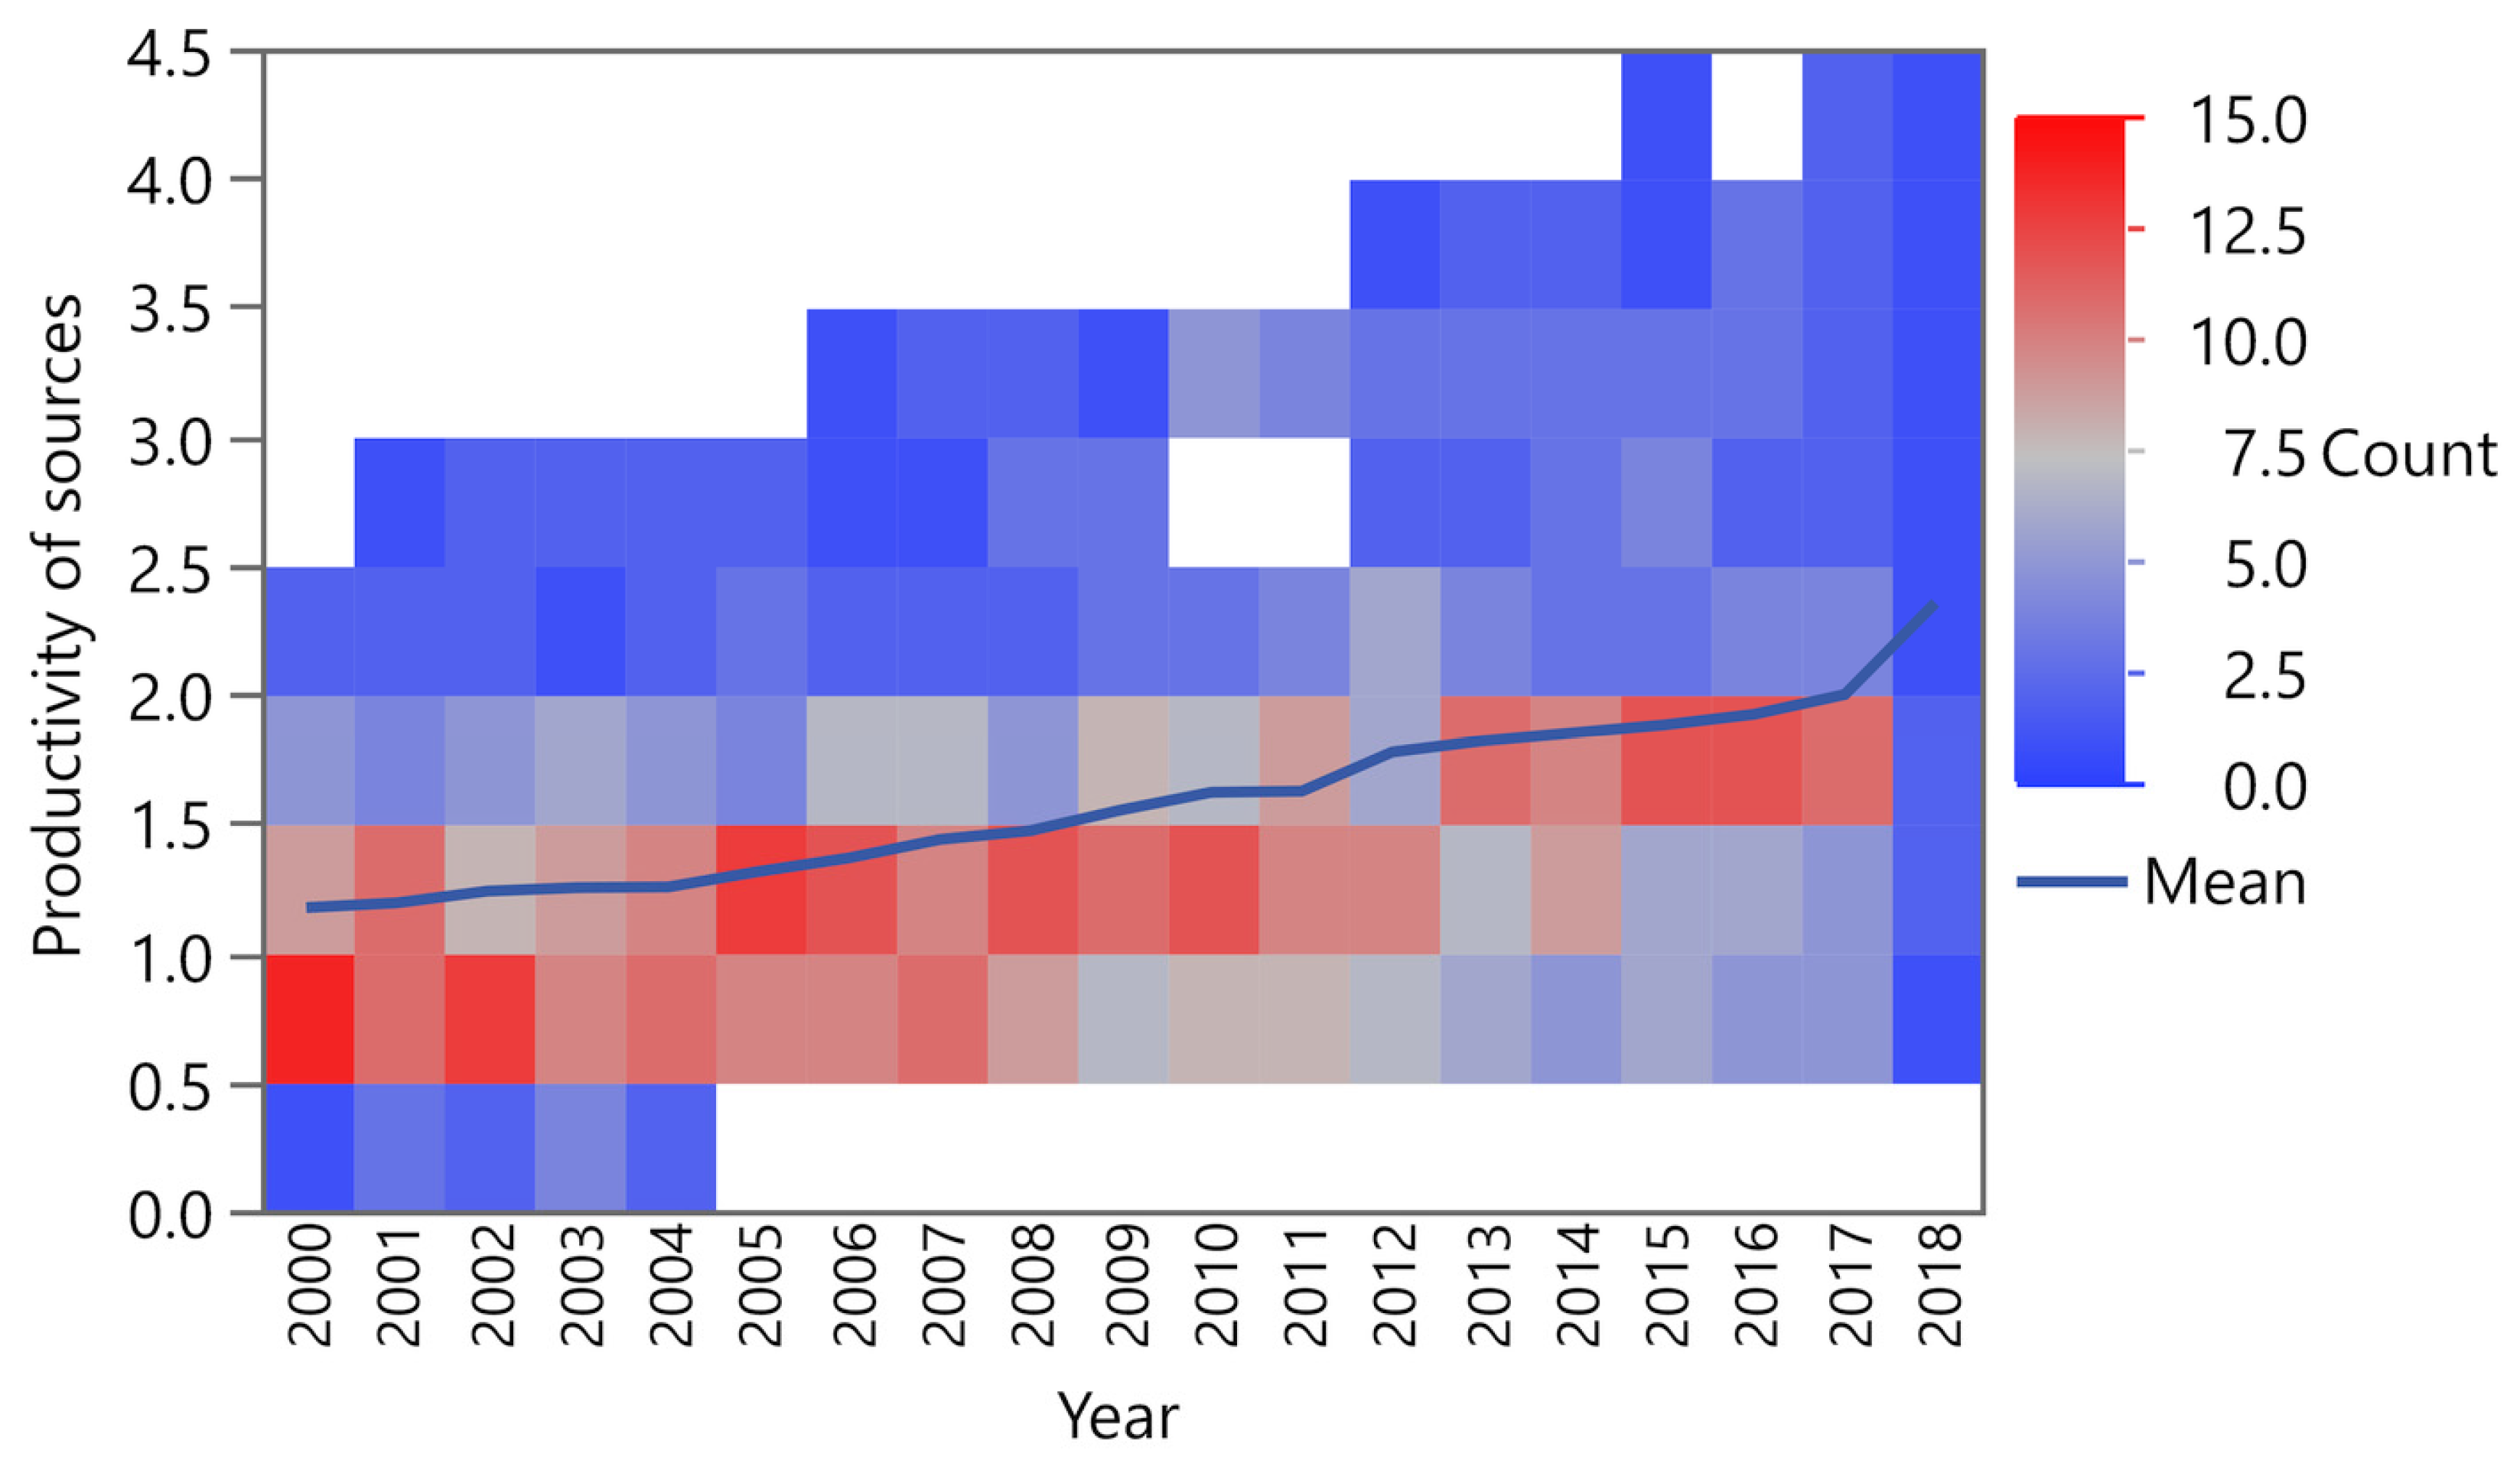
At the same time, the average value of the indicator moved from 1.17 (in 2000) to 2.35 (in 2018), which presents 200% growth during 18 years (see Figure 2). EU countries are then on average able to produce double the volume of production compared to in 2000, with the same inputs.

Figure 2.
Average resources policy in EU in 2000–2018.
According to the analysis of variability through the Kruskal-Wallis test, the statistically important differences were verified for EU member states according to achieved results of the resources productivity (see Figure 3).

Figure 3.
Results of Kruskal-Wallis test.
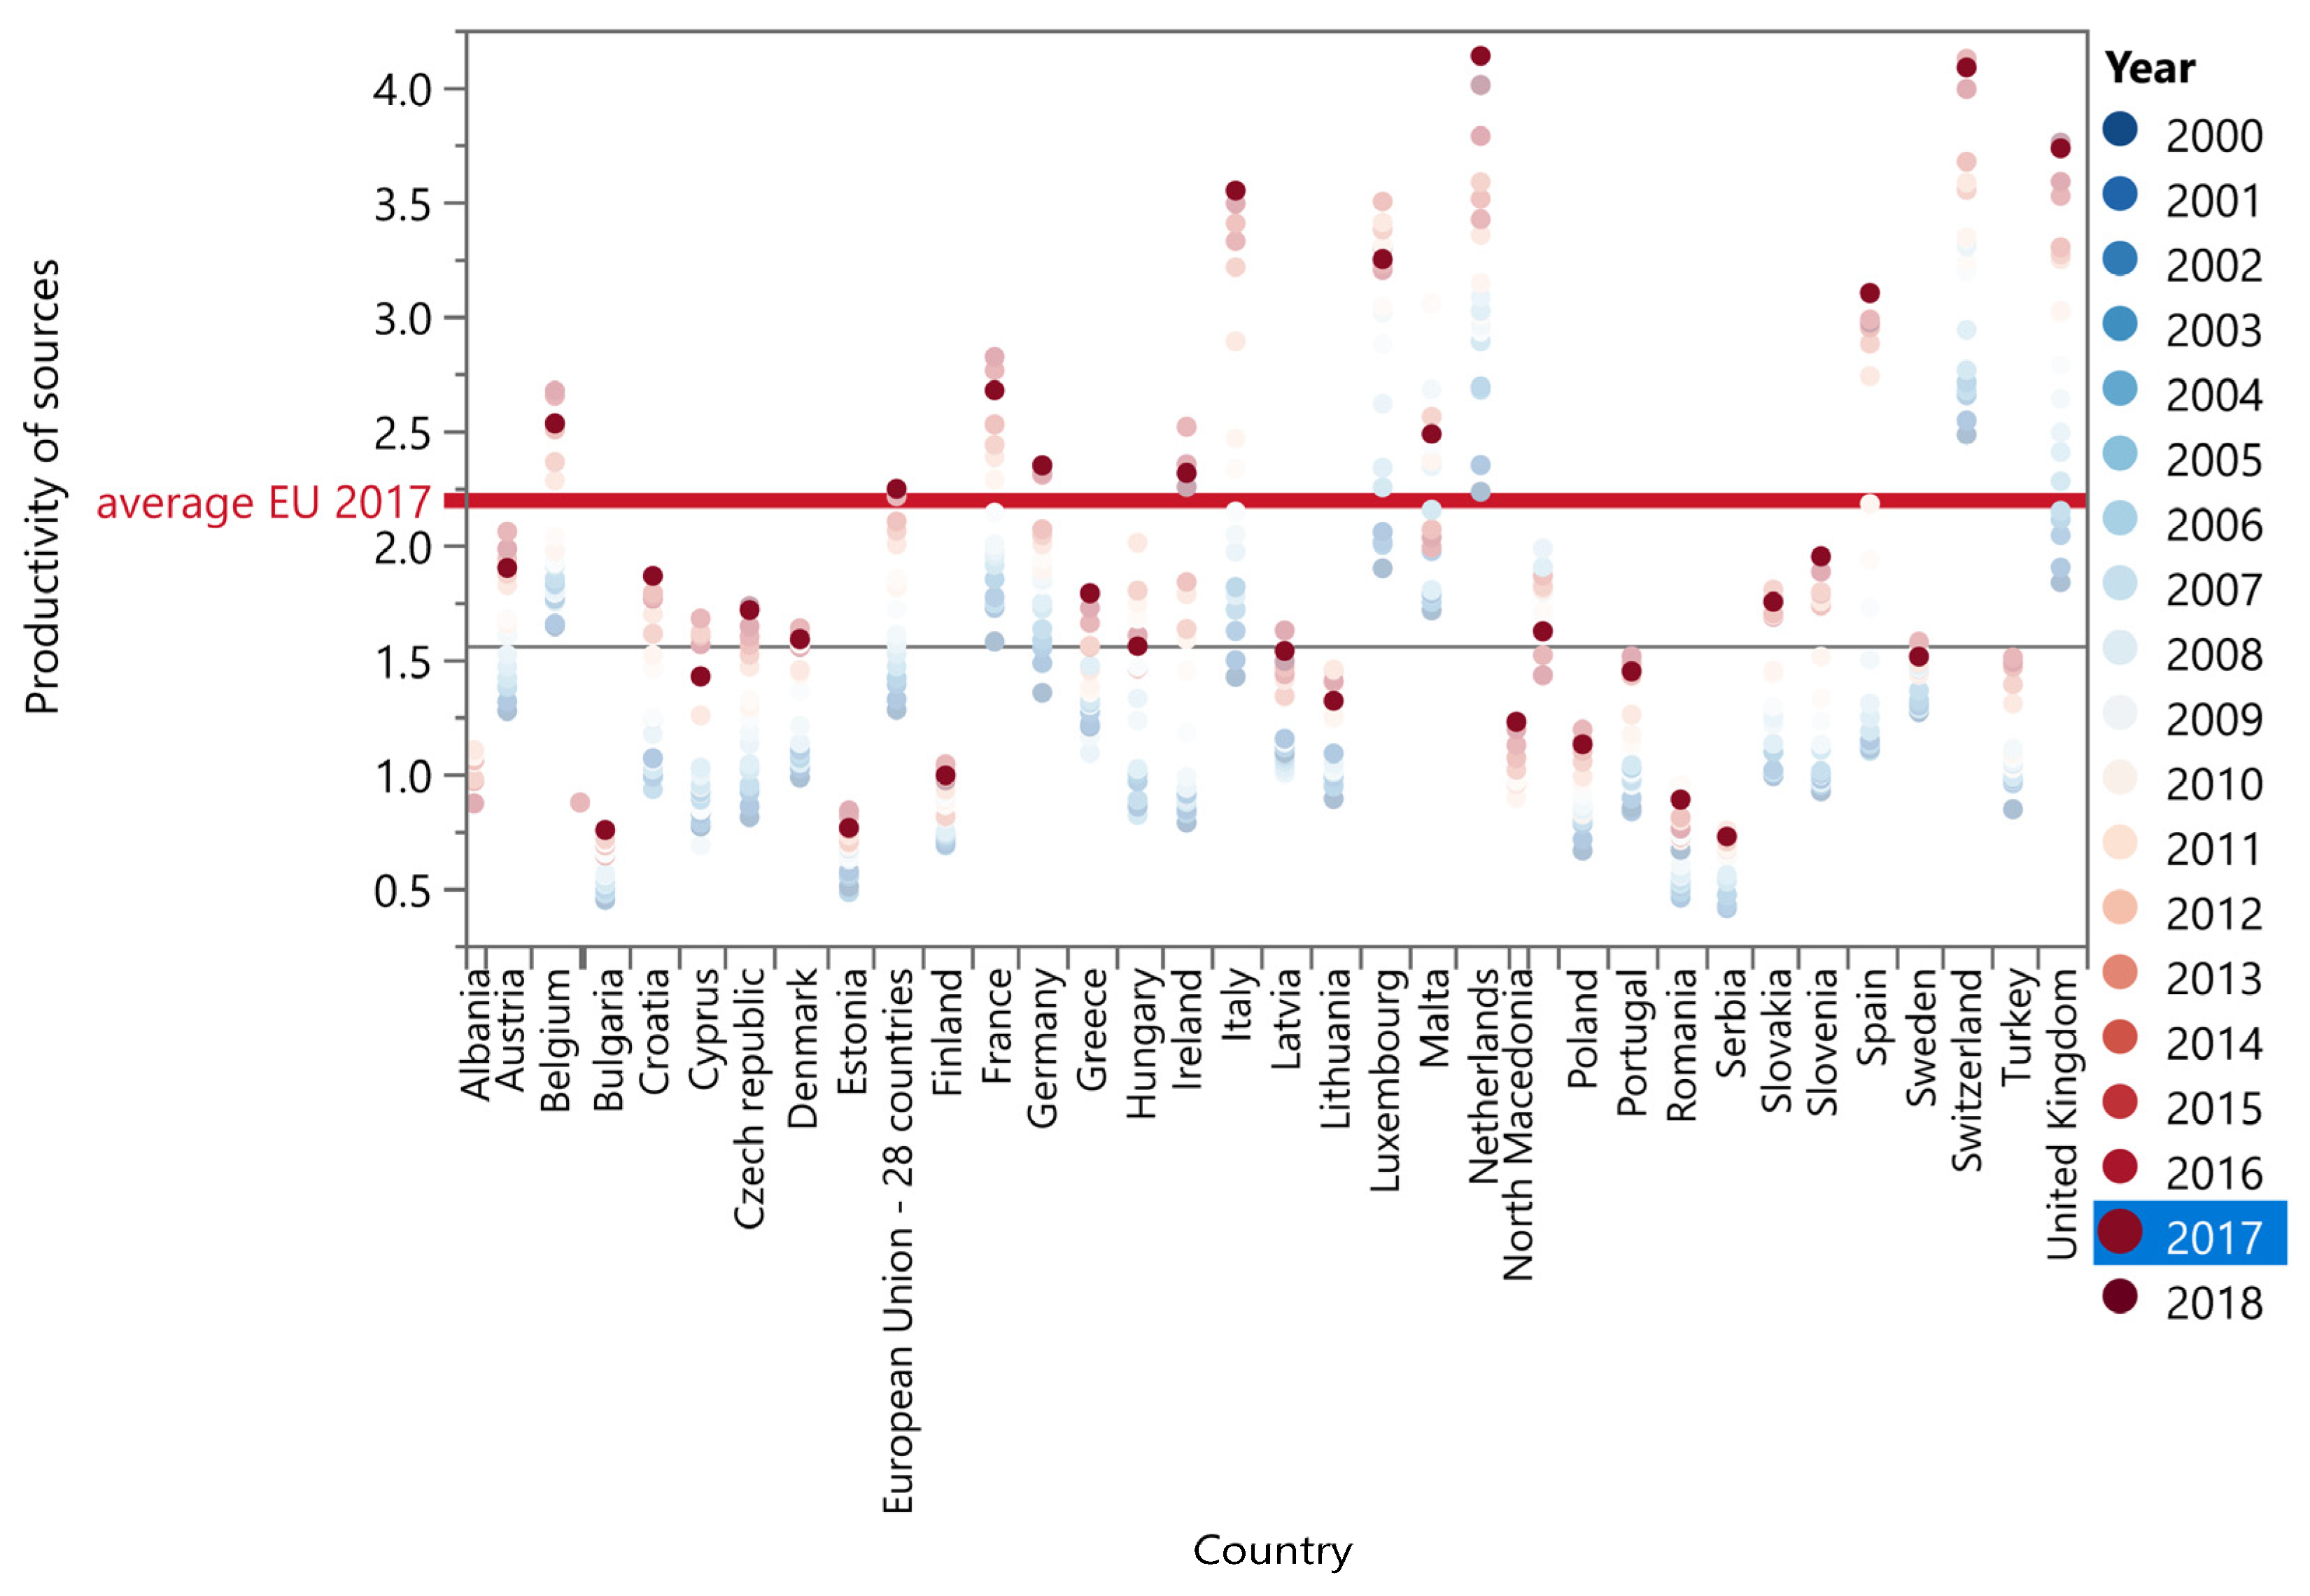
It is also illustrated by Figure 4, that the results of individual EU states are considerably different. The EU average in 2017 is at the level 2.2; significantly over-average values were registered in the Netherlands, Switzerland, United Kingdom, Italy, Luxembourg. Luxembourg at the same time belongs among countries where during the last years there is a registered undesirable trend of the indicator decrease. Moreover, Hungary, Albania, Norway and Cyprus belong here (red ellipse). We see here countries, where results of the indicator are under EU average, but the trend is significantly growing. Here belongs, for example, Slovakia, Greece, Czech Republic, Croatia and North Macedonia.
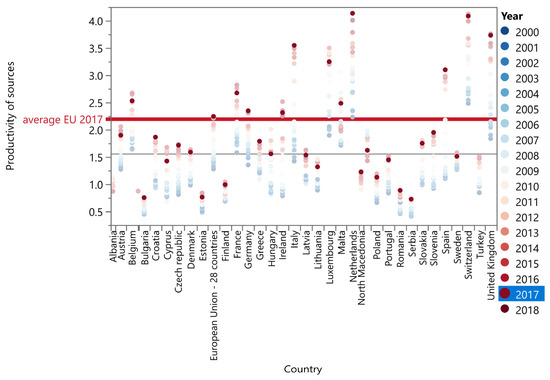
Figure 4.
Graphical comparison of resources productivity in EU in 2000–2018.
Overall, we can conclude that productivity of resources has, in most countries, an increasing trend. However, the level of the indicator proportionally different in comparing the countries. We tried to find out what the reason is for such differences by analysis of other indicators and the relations between them, which could significantly influence productivity of resources in these countries. It means choosing an indicator that defines the transformation of the economy toward a circular economy, such as:
- -
- Production of the waste on GDP [kg·1000 €−1];
- -
- Measure of material use in circulation [%];
- -
- Environmental taxes [%];
- -
- Index eco-innovation [%];
- -
- Measure of waste stocking [%];
- -
- Measure of recycling [%];
- -
- Taxes from energy per GDP.
The following descriptive statistics give basic statistical characteristics of the indicators (average, standard deviation, summary, minimum, maximum), included in the following analysis (Table 2).
Table 2.
Descriptive statistics (Univariate simple statistics) of the analyzed indicators.
4.2. Analysis of Linear Dependence of Indicators
With the use of correlation analysis, we searched the existence of the relationships between indicators and looked for possible reasons for the achieved values in the EU and at the level of individual states. The aim is to limit indicators that could participate at the Europe orientation to achieve environmental policy goals in area of increasing effective resource use. Analysis of linear dependence of indicators was performed in the software JMP by using pair correlation analysis. We analyzed all indicators mutually, and obtained statistically important correlations. Results of the analysis went through further searching, while finding important correlations with the coefficient of correlations r > 0.5 (positive linear dependence = red area) and r < −0.5 (negative linear dependence = blue area), which is illustrated by Table 3.
Table 3.
Results of pair correlation of indicators.
Results of the analysis showed in some pairs strong positive linear dependence between indicators with the coefficient of correlation at the level max 0.64. It means the following pairs of indicators:
- Productivity of sources and measure of recycling with the coefficient correlation of r = 0.56, and productivity of sources and measure of material use in a cycle with the coefficient correlation of r = 0.64. In the case that we would see productivity of sources as a variable indicator, it means that the productivity of sources is growing when in the country the measurement of recycling is growing. The same applies in the case of material use in cycle. States that have high measure of recycling and use a higher volume of material in a cycle, record at the same time a higher value of productivity of sources.
- Measure of recycling and measure of material use in a cycle with the coefficient correlation of r = 0.56. Countries with higher measure of recycling use have at the same time more recycled material in production processes.
- Waste productivity and measure of stocking with the coefficient correlation of r = 0.54. A positive rate is confirmed at the same time in the case of measure of recycling and waste production. States that record high volume of waste production on GDP also have a high level of stocking.
Results of the analysis also pointed in some pairs to the strong negative linear dependence between indicators with the coefficient correlation at the level max−0.86. It means the following pairs of indicators:
- Measure of recycling and measure of stocking with the coefficient correlation of r = −0.86. Countries that achieve a high measure of stocking, record at the same time low measure of recycling and logically vice versa.
- Measure of stocking and index of eco-innovation with the coefficient correlation of r = −0.75. In this case, measure of stocking decreases with the growing index of eco-innovation in the state.
- Measure of recycling and waste production on GDP with the coefficient correlation of r = 0.52. States that produce more waste, record at the same time lower measure of recycling, and on the other hand countries that have a high measure of waste recycling are trying at the same time to produce less waste on GDP.
- Measure of waste stocking and measure of material use in a cycle with the coefficient of correlation r = −0.52. States that meet a high measure of stocking use at the same time have less material in a cycle, or vice versa, countries that use more recycled materials, have less stockings.
4.3. Cluster Analysis
Through cluster analysis we searched common characteristics of each state, while according to similar behavior clusters had been created. The principle of the cluster analysis is to group indicators, in our case by state, by the way that inside the cluster there was achieved maximal homogeneity of indicators and between clusters maximal variabilities were recorded.
Analysis was performed by method of hierarchical clustering. The method begins with every observation by its own cluster. In any step of the clustering process the distance between all cluster pairs are calculated and the two closest clusters are determined. The process continues until all points are included in the one cluster. Hierarchical clustering is known also as agglomerate clustering due to the use of a combined approach.
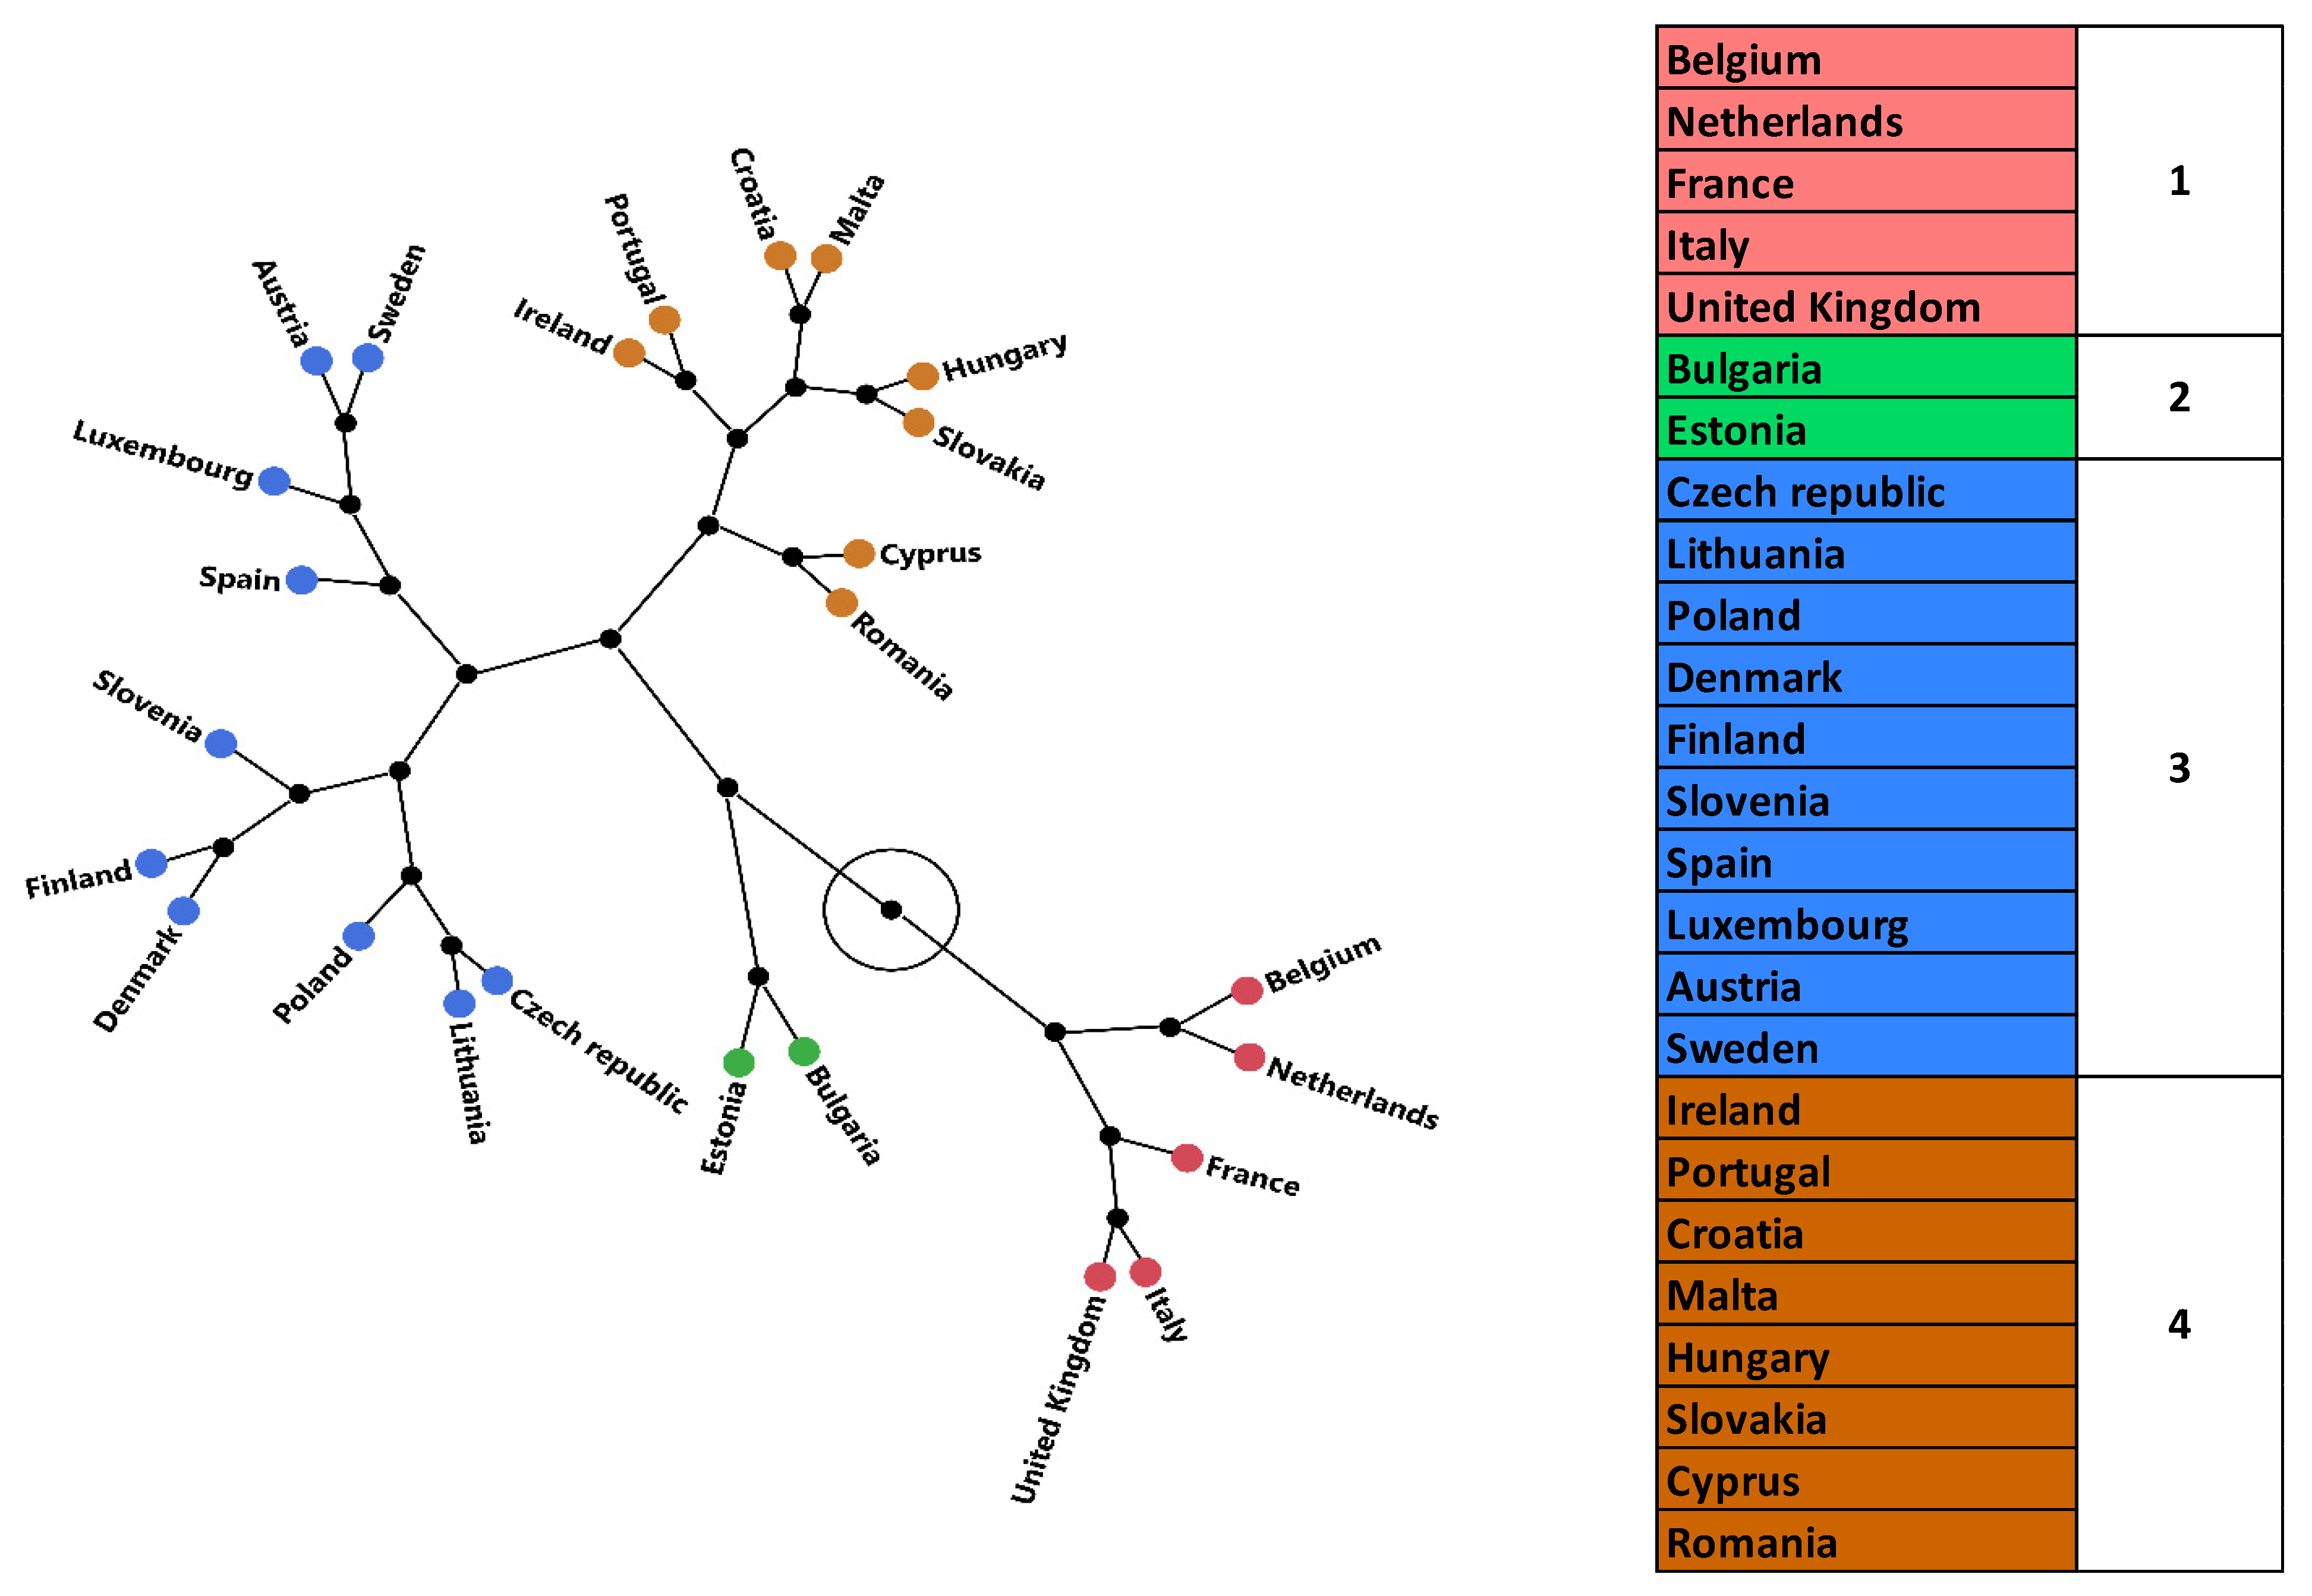
Results of the analysis in our case mean the creation of four clusters that are presented in Figure 5. In our analysis we evaluated each cluster individually.
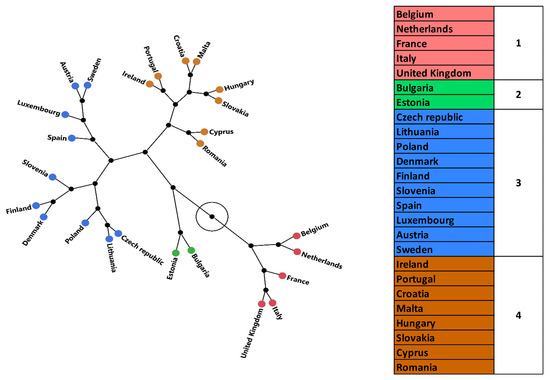
Figure 5.
Results of cluster analysis in EU states according to the effectiveness of resource use in 2016. (Own processing according to ES data in software JMP, Excel).
Individual clusters were analyzed through the analysis of average cluster values of indicators. In the frame of any indicator, average achieved values were ranked from the best to the worst value according to the target values in the EU.
Indicators with the goals to growth are (Table 4):
Table 4.
Average values of indicators in each cluster-year.
- -
- Productivity of sources;
- -
- Measure of material use in a cycle;
- -
- Index eco-innovation;
- -
- Measure of recycling.
Indicators with the goal to decrease are:
- -
- Waste productivity without main mineral waste on GDP;
- -
- Measure of waste stocking.
Finally, ranked values were scored, while the first place means 1 point, second place 0.5, and third place 0.3. According to the summary of obtained points, we constructed a chart of clusters according to the ability to use resources effectively. The best results were achieved in the first cluster, which achieved the best average values in the EU, in the case of five indicators—5.5 points. The cluster is presented by Belgium, the Netherlands, France, Italy, and England. The countries have at the same time one of the lowest tax burdens in case of energy taxes and the environment. The worst results were recorded in countries from the second cluster with 0.5 points—Bulgaria and Estonia. These countries produce almost eight times more waste and they produce waste stocks five times higher, as compared to the first cluster. At the same time, there are countries that in comparing with the first cluster achieve only one-third level of indicators, a shown in the measure of recycling, index of eco-innovation, and measure of material use in a cycle. The productivity of resources is at the level 0.79 and these countries have the highest tax burden in the frame of environmental and energy policy.
5. Discussion
As for the comparison of the results with other studies, Haider and Bhat (2020) studied a connection between material and energetic effectiveness and total productivity of factors, finding that not all states are equal from the view of energy demands [31]. Increasing of total productivity of factors is connected with lower level of energy per output unit.
In Europe annually 18 million tons of waste could be collected in the case of installing a strategy of collection according to proven processes, which could lead to a 13% decrease of greenhouse gas production in connection with packages and package wastes. In spite of the high performance of the collection being an effective use of resources, a single improvement of the system of waste collection, separate from the resources, is not enough for recycling goals achievement or decreasing emissions production. Material loss has to be decreasing in the whole value chain, which means from selection and collection to recycling [38,39]. Kuhl et al. (2018) considered business models for circular economy (CE) that have potential environmental contributions and productivity of resources [40]. Circular business models, based on refurbishment and repeated use of materials could bring significant cost savings, as well as radically decreasing negative influences on the living environment [41]. The processing of resources has to be radically changed from the model of linear use to the sustainable, circular model. In this area, Velenturf et al. (2020) created a model that considered the complex character of resource flows [42]. Environmental sustainability has to be connected with conceptions of an ecological economy, circular economy and bio-economy [43,44].
However, the connection with sustainability is not, according to Loiseau et al. (2016), always clear [45], since there are various levels of substitution and compromises are allowed between environmental and economic advantages. Additionally, structuralized changes of the human way of life are demanded [46]. It is necessary to combine the circular economy with an approach regarding human development (HD), since one of the discussions is connecting the missing social or human dimension of the circular economy [47]. Schroder et al. (2020) included social and economic elements in the transformation from linear to circular economic models in combination with HD from studies of social science and development [48]. This could be connected with application of analysis results from area of tax burden influence for inhabitants and businessmen. Setting energy and environmental taxes at manageable levels can also increase effectiveness of productivity of resources in the countries. This approach can also be linked to the possibilities of effective use of spatial data models from GIS environment [49], that are commonly used in such research.
Due to the pandemic situation the European Union is buffeted by a range of crises since 2007, not least the economic and financial crisis. One potential victim of the economic crisis is environmental policy ambition, since during economic crises environmental policy slips down the agenda with long term consequences for environmental quality. The future environmental policy trajectory and leadership of the EU may be under threat as the Union struggles to emerge from the economic crisis. Productivity of resources could be helpful for the overcoming of such struggles.
To address the challenges of reducing impacts on the environment and of resource scarcity, it must go hand in hand with sustainable development and state policy, when material efficiency is a key element of new thinking [50,51]. Directly related to material efficiency is the concept of the circular economy, which is based on the principle of optimizing the utility embodied in materials and products throughout their life cycle.
6. Conclusions
In the EU, basic strategy results from the need to provide intelligent, sustainable, and inclusive growth, along with respect to social and economic impacts and issues surrounding the living environment and its protection, all often-discussed topics. Experts on this global theme most often refer to sustainability, considering all elements of the environment. Therefore, the analysis realized in the frame of this research states that presently, the common effort is to increase the effectiveness of Earth’s resource use and protect the living environment, going hand in hand with the use of renewable energy sources [52]. It demands a follow-up of determined goals not only at the level of absolute figures for European Union and individual member states, but also at the level of each sector. The undeniable fact is that there are dependences between all sectors and processes that need higher evaluation.
Additionally, the findings of this research point to the necessity to be oriented not only to the resulting goal, but also to the secondary factors, influencing the goal achievement. It means that obtained dependencies can help countries with significant differences to orient their means to the areas that are seemingly not connected with achievement of the goal, but which finally could help speed up the goal achievement. An example could be the increasing of recycling measures that contribute to the goal achievement—a decrease of waste stocking can also considerably support a decrease of domestic consumption of material on the inhabitant or to increase energetic productivity of the state. An important finding of this research is that environmental tax policy has a positive influence on the meeting of environmental goals of the individual countries. Countries with high taxes on energy and environmental taxes are at the same time countries with the lowest ability to meet determined goals in the frame of Strategy Europe 2020.
Results of the analyses point to the fact that countries, oriented only to the decreasing of emission production connected with fossil fuel energy and transport, cannot meet the demanded progress if they will not intensively support innovation processes and research and development activities oriented to ecological processes. Due to the limitation of the research to the chosen indicators, the subject of further research would be single analysis of key indicators of productivity of resources, for example productivity of water, soil and energy in relation to the main indicator—productivity of resources. Each indicator should be searched in context of chosen indicators, defining standard of living, economic and financial self-sufficiency, level of education, etc.
Industry-level productivity analysis can be a useful diagnostic tool to better understand why some sectors and countries show faster overall productivity growth, and to direct research attention to parts of the economy that warrant more detailed scrutiny. A better understanding of productivity growth (or lack thereof) in industries should still be an important goal of researchers aiming to understand cross-country growth differences.
Author Contributions
Conceptualization, M.T. and K.Č.; methodology, M.T. and K.Č.; software, M.T.; validation, P.T. and L.D.; formal analysis, M.T.; resources, K.Č.; data curation, P.T.; writing—original draft preparation, M.T. and K.Č.; writing—review and editing, A.S.; visualization, P.T.; supervision, A.S.; project administration, A.S.; funding acquisition, A.S. All authors have read and agreed to the published version of the manuscript.
Funding
This research was funded of grant project VEGA 1/0797/20.
Institutional Review Board Statement
Not applicable.
Informed Consent Statement
Not applicable.
Data Availability Statement
Not applicable.
Acknowledgments
Contribution presents partial result of grant project VEGA 1/0797/20 and KEGA 006 TUKE-4/2019.
Conflicts of Interest
The authors declare no conflict of interest.
References
- Guo, H.; Sun, Y. Research on materials classification model building and procurement strategy of coal enterprises. J. Mines Met. Fuels 2017, 65, 691–695. [Google Scholar]
- He, M.; Wen, Y.; Jiang, W. Evaluation model of building materials suppliers considering carbon emissions. IOP Conf. Ser. Earth Environ. Sci. 2018, 189, 032067. [Google Scholar] [CrossRef]
- Ling, W.; Cui, C.; Dong, J. Application and economic analysis of energy-saving wall materials in low-income rural areas of China. IOP Conf. Ser. Mater. Sci. Eng. 2018, 423, 012185. [Google Scholar] [CrossRef]
- Soukupová, J.; Klimovský, D.; Ochrana, F. Key factors for public utility efficiency and effectiveness: Waste management services in the Czech Republic. Ekon. Časopis 2017, 65, 143. [Google Scholar]
- Herciu, M.; Ogrean, C. An overview on European Union sustainable competitiveness. Procedia Econ. Financ. 2014, 16, 651–656. [Google Scholar] [CrossRef] [Green Version]
- Magazzino, C.; Porrini, D.; Fusco, G.; Schneider, N. Investigating the link among ICT, electricity consumption and air pollution and economic growth in EU countires. Energy Sources 2021, 1–23. [Google Scholar] [CrossRef]
- Fry, J.; Lenzen, M.; Jin, Y.; Wakiyama, T.; Baynes, T.; Wiedmann, T.; Malik, A.; Chen, G.; Wang, Y.; Geschke, A.; et al. Assessing carbon footprints of cities under limited information. J. Clean. Prod. 2018, 176, 1254–1270. [Google Scholar] [CrossRef] [Green Version]
- Hughes, G. Environmental indicators. Ann. Tour. Res. 2002, 29, 457–477. [Google Scholar] [CrossRef]
- Sustainable Economic Development. 2019. Available online: https://www.vlada.gov.sk//sustainable-economicdevelopment/ (accessed on 15 September 2019).
- Miller, C.; Sarewitz, D.; Light, D. Science, Technology and Sustainability. Building a Research Agenda. National Science Foundation Supported Workshop. Available online: https://www.nsf.gov/sbe/ses/sts/Science_Technology_and_Sustainability_Workshop_Rpt.pdf. (accessed on 5 June 2019).
- Bumanis, G.; Vitola, L.; Stipniece, L.; Locs, J.; Korjakins, A.; Bajare, D. Evaluation of industrial by-products as pozzolans: A road map for use in concrete production. Case Stud. Constr. Mater. 2020, 13, e00424. [Google Scholar] [CrossRef]
- Korhonen, J.; Honkasalo, A.; Seppala, J. Circular economy: The concept and its limitations. Ecol. Econ. 2018, 143, 37–46. [Google Scholar] [CrossRef]
- Robaina, M.; Villar, J.; Pereira, E.T. The determinants for a circular economy in Europe. Environ. Sci. Pollut. Res. 2020, 27, 12566–12578. [Google Scholar] [CrossRef]
- Elkington, J. Enter the triple bottom line. In The Triple Bottom Line, Does It All Add Up? Assessing the Sustainability of Business and CSR, 5th ed.; Henriques, A., Richardson, J., Eds.; Earthscan Publications Ltd.: London, UK, 2004; pp. 1–16. [Google Scholar]
- Living Well, within the Limits of Our Planet. Available online: https://ec.europa.eu/environment/pubs/pdf/factsheets/7eap/en.pdf (accessed on 10 January 2020).
- Dainiené, R.; Dagiliené, L. A TBL approach based theoretical framework for measuring social innovations. Procedia Soc. Behav. Sci. 2015, 213, 275–280. [Google Scholar] [CrossRef] [Green Version]
- Kollmuss, A.; Agyeman, J. Mind the gap: Why do people act environmentally and what are the barriers to pro-environmental behavior? Environ. Educ. Resour. 2002, 8, 239–260. [Google Scholar] [CrossRef] [Green Version]
- Saracoglu, B.O. Selecting industrial investment locations in master plans of countries. Eur. J. Ind. Eng. 2013, 7, 416–441. [Google Scholar] [CrossRef]
- Joensuu, T.; Edelman, H.; Saari, A. Circular economy practices in the built environment. J. Clean. Prod. 2020, 276, 124215. [Google Scholar] [CrossRef]
- Chen, K.; Ren, J.; Chen, C.; Xu, W.; Zhang, S. Safety and effectiveness evaluation of flexible electronic materials for next generation wearable and implantable medical devices. Nano Today 2020, 35, 100939. [Google Scholar] [CrossRef]
- Rajca, P.; Poskart, A.; Chrubasik, M.; Sajdak, M.; Zajemska, M.; Skibiński, A.; Korombel, A. Technological and economic aspect of refuse derived fuel pyrolysis. Renew. Energy 2020, 161, 482–494. [Google Scholar] [CrossRef]
- Chen, J.; Taylor, J.E.; Wei, H.H. Toward a building occupant network agent-based model to simulate peer induced energy conservation behavior. In Proceedings of the 2011 Winter Simulation Conference (WSC), Phoenix, AZ, USA, 11–14 December 2011; IEEE: Piscataway Township, NJ, USA, 2011; pp. 883–890. [Google Scholar]
- Girondi, D.; Marvila, M.T.; Souza, D.; Sanchez, R.J.; Colorado, H.A.; Fontes, V.C.M. Evaluation of the application of macrophyte biomass Salvinia auriculata Aublet in red ceramics. J. Environ. Manag. 2020, 275, 111253. [Google Scholar] [CrossRef]
- Tian, M.W.; Mihardji, L.W.W.; Moria, H.; Assadi, S.; Sadighi, D.; Khalilarya, S.; Nguyen, P.T. A comprehensive energy efficiency study of segmented annular thermoelectric generator; thermal, exergetic and economic analysis. Appl. Therm. Eng. 2020, 181, 115996. [Google Scholar] [CrossRef]
- Stieberova, B.; Zilka, M.; Ticha, M.; Freiberg, F. Sustainability assessment of continuous-flow hydrothermal synthesis of nanomaterials in the context of other production technoologies. J. Clean. Prod. 2019, 241, 118325. [Google Scholar] [CrossRef]
- Chepachenko, N.V.; Leontiev, A.A.; Uraev, G.A.; Ardzinov, V.D. Modeling the effect of using the innovative materials on the construction organizations economic performance. IOP Conf. Ser. Mater. Sci. Eng. 2019, 698, 077038. [Google Scholar] [CrossRef]
- Mohamed, A.F. Economic evaluation of renewable energy systems, case study: An eco-house powered by nano-crystal PV in New Aswan, Egypt. IOP Conf. Ser. Earth Environ. Sci. 2019, 397, 012010. [Google Scholar] [CrossRef]
- Wang, S.; Tae, S.; Kim, R. Development of a green building materials integrated platform based on materials and resources in G-SEED in South Korea. Sustainability 2019, 11, 6532. [Google Scholar] [CrossRef] [Green Version]
- Long, W.J.; Li, H.D.; Wei, J.J.; Xing, F.; Han, N. Sustainable use of recycled crumb rubbers in eco-friendly alkali activated slag mortar: Dynamic mechanical properties. J. Clean. Prod. 2018, 204, 1004–1015. [Google Scholar] [CrossRef]
- Guo, S.; Liu, Q.; Zhao, J. Mobilized thermal energy storage: Materials, containers and economic evaluation. Energy Conserv. Manag. 2018, 177, 315–329. [Google Scholar] [CrossRef]
- Haider, S.; Bhat, J.A. Does total factor productivity affect the energy efficiency: Evidence from the Indian paper industry. Int. J. Energy Sect. Manag. 2020, 14, 108–125. [Google Scholar] [CrossRef]
- Al-Iriani, M.A. Energy—GDP relationship revisited: An example from GCC countries using panel causality. Energy Policy 2006, 34, 3342–3350. [Google Scholar] [CrossRef]
- Belke, A.; Dobnik, F.; Dreger, C. Energy consumption and economic growth: New insights into the cointegration relationship. Energy Econ. 2011, 33, 782–789. [Google Scholar] [CrossRef] [Green Version]
- Silva, H. The ergonomics of sorting recyclable materials: A case study of a Brazilian cooperative. In International Conference on Applied Human Factors and Ergonomics; Springer: Cham, Germany, 2020; Volume 970, pp. 256–265. [Google Scholar]
- Peshkov, V.V. Some aspects of construction industry development in 2018. IOP Conf. Ser. Mater. Sci. Eng. 2019, 687, 044010. [Google Scholar] [CrossRef]
- Wang, C.C.; Sepasgozar, S.M.; Wang, M.; Sun, J.; Ning, X. Green performance evaluation system for energy efficiency based planning for construction site layout. Energies 2020, 12, 4620. [Google Scholar] [CrossRef] [Green Version]
- Dini, W.; Irwan, B.; Mangara, T. Alternative selection in reducing wood scarp with green productivity approach. In E3S Web of Conferences; EDP Sciences: Ulis, France, 2018; Volume 73, p. 07023. [Google Scholar]
- Ministry of Living Environment, Slovakia. Strategy, Principles and Priorities of State Environmental Policy; Ministry of Living Environment: Bratislava, Slovakia, 2004. [Google Scholar]
- Agan, Y.; Kuzey, C.; Acar, M.F.; Acikgoz, A. The relationships between corporate social responsibility, environmental supplier development and firm performance. J. Clean. Prod. 2016, 112, 1872–1881. [Google Scholar] [CrossRef]
- Kuhl, C.; Tjahjono, B.; Bourlakis, M.; Aktas, E. Implementation of circular economy principles in PSS operations. Procedia CIRP 2018, 73, 124–129. [Google Scholar] [CrossRef]
- Linder, M.; Williander, M. Circular business model innovation: Inherent uncertainties. Bus. Strategy Environ. 2017, 26, 182–196. [Google Scholar] [CrossRef]
- Velenturf, A.P.M.; Purnell, P.; Macaskie, L.E.; Mayes, W.M.; Sapsford, D.J. A new perspective on a global circular economy (book chapter). RCS Green Chem. 2020, 62, 3–22. [Google Scholar]
- Barbier, E.B. The green economy post Rio+20. Science 2012, 338, 887–888. [Google Scholar] [CrossRef] [PubMed]
- Dyllick, T.; Hockerts, K. Beyond the business case for corporate sustainability. Bus. Strategy Environ. 2002, 11, 130–141. [Google Scholar] [CrossRef]
- Loiseau, E.; Saikku, L.; Antikainen, R.; Droste, N.; Hansjurgens, B.; Pitkänen, K.; Leskinen, P.; Kuikman, P.; Thomsen, M. Green economy and related concepts: An overview. J. Clean. Prod. 2016, 139, 361–371. [Google Scholar] [CrossRef]
- Lieskovská, Z. A few words about the history of integration in the European area and the development of environmental policy (in Slovak). Enviromagazín 2004, 9, 14–15. [Google Scholar]
- Jurkasová, Z.; Cehlár, M.; Khouri, S. Tools for organizational changes managing in companies with high qualified employees. In Production Management and Engineering Sciences: International Conference on Engineering Science and Production Management, ESPM 2015, Tatranska Strba, High Tatras Mountains, 16–17 April 2015; CRC Press: Boca Raton, FL, USA, 2016; Volume 154039, pp. 409–412. [Google Scholar]
- Schroder, P.; Lemille, A.; Desmond, P. Making the circular economy work for human development. Resour. Conserv. Recycl. 2020, 156, 104686. [Google Scholar] [CrossRef]
- Bindzárová Gergeľová, M.; Kuzevičová, Ž.; Kovanič, Ľ.; Kuzevič, Š. Automation of Spatial Model Creation in GIS Environment. Inżynieria Miner. 2014, 33, 15–22. [Google Scholar]
- Cehlár, M.; Domaracká, L.; Šimko, I.; Puzder, M. Mineral resource extraction and its political risks. In Production Management and Engineering Sciences: International Conference on Engineering Science and Production Management, ESPM 2015, Tatranska Strba, High Tatras Mountains, 16–17 April 2015; CRC Press: Boca Raton, FL, USA, 2016; Volume 154039, pp. 39–43. [Google Scholar]
- Dogan, E.; Inglesi-Lotz, R. The impact of economic structure to the environmental Kuznets curve (EKC) hypothesis: Evidence form European countries. Environ. Sci. Pollut. Res. 2020, 27, 12717–12724. [Google Scholar] [CrossRef] [PubMed]
- Horodníková, J.; Khouri, S.; Rybár, R.; Kudelas, D. TESES rules as a tool of analysis for chosen OZE projects. Acta Montan. Slovaca 2008, 13, 350–356. [Google Scholar]

Publisher’s Note: MDPI stays neutral with regard to jurisdictional claims in published maps and institutional affiliations. |
© 2021 by the authors. Licensee MDPI, Basel, Switzerland. This article is an open access article distributed under the terms and conditions of the Creative Commons Attribution (CC BY) license (https://creativecommons.org/licenses/by/4.0/).