Abstract
Liquid hydrogen (LH2) spills share many of the characteristics of liquefied natural gas (LNG) spills. LNG spills on water sometimes result in localized vapor explosions known as rapid phase transitions (RPTs), and are a concern in the LNG industry. LH2 RPT is not well understood, and its relevance to hydrogen safety is to be determined. Based on established theory from LNG research, we present a theoretical assessment of an accidental spill of a cryogen on water, including models for pool spreading, RPT triggering, and consequence quantification. The triggering model is built upon film-boiling theory, and predicts that the mechanism for RPT is a collapse of the gas film separating the two liquids (cryogen and water). The consequence model is based on thermodynamical analysis of the physical processes following a film-boiling collapse, and is able to predict peak pressure and energy yield. The models are applied both to LNG and LH2, and the results reveal that (i) an LNG pool will be larger than an LH2 pool given similar sized constant rate spills, (ii) triggering of an LH2 RPT event as a consequence of a spill on water is very unlikely or even impossible, and (iii) the consequences of a hypothetical LH2 RPT are small compared to LNG RPT. Hence, we conclude that LH2 RPT seems to be an issue of only minor concern.
1. Introduction
Hydrogen is a zero-emission fuel that can play an essential role in reaching the climate goals set by the Paris agreement. The global demand for hydrogen could reach 500 Mt/a by 2050 [1], and the ramp-up can be faster if carbon-neutral and renewable sources for hydrogen are combined [2]. Realizing this vision will require safe and reliable transport of large amounts of hydrogen across large distances.
LH2 is approximately 800 times denser than hydrogen at standard conditions. For large-scale transport where pipelines are not available, LH2 is the preferred form. In particular, it is foreseen that transport by ship will be the most effective solution to transport large amounts of hydrogen over long distances. To ensure safe handling of LH2, one should take lessons from the vast experience made with liquefied natural gas (LNG) over the last decades, while at the same time considering the distinct properties of LH2—in particular, its ultra-low boiling point and density.
When LNG is accidentally spilled on water, it is known to sometimes, seemingly at random, undergo a localized vapor explosion known as rapid phase transition (RPT). This is a major concern for the LNG industry [3,4]. As one of the many steps in deploying LH2 technology, the risk and potential consequence of an LH2 RPT must be understood and accounted for in future designs. The research on LH2 spills on water is limited and few experiments have been conducted [5]. To date, no LH2 RPT has been observed. Pritchard and Rattigan [6] reported in 2010 that no record of a RPT resulting from a LH2 spill has been found, and subsequent reports addressing hydrogen safety do not mention RPT [7,8,9,10,11,12,13,14]. The absence of LH2 RPT can be explained either by (i) the low number of experiments and the stochastic nature of the phenomena or (ii) the fact that the underlying physical mechanisms responsible for LNG RPTs are not present for LH2 spills on water.
The possibility of LNG RPT was first discovered in the 1960s. This phenomena was given attention by several research groups, and a general consensus for a theory on RPT was made in the early 1970s [15,16,17,18,19,20]. In later LNG safety reviews, the risk of RPT is given various attention, ranging from significant discussion [4,21,22,23] to little more than a brief mention [24,25,26,27,28]. The peak pressure and mechanical energy has the potential to displace and damage heavy equipment [4,22,28] and cause secondary structural damage and cascading containment failures [26]. Predicting whether an LNG RPT event will occur as a consequence of a spill has proven to be difficult. Lawrence Livermore National Laboratory performed a series of tests in the 1980s [22,29,30] that indicated that RPT occurred in about one third of the spills and that a single spill could lead to more than ten distinct RPT events. The yield of a single RPT event seems to be quite random and has been reported to have TNT equivalents in the range of a few grams up to 6 () [29,30,31,32,33]. As a reference, one of TNT can destroy (or even obliterate) a small vehicle [34]. RPT is also observed for fluid pairs other than LNG–water, e.g., liquid nitrogen–water and water–molten-metals. An overview of RPT theories and mechanisms for different configurations are provided by Ustolin et al. [35].
In this paper, we investigate the possible mechanisms that can lead to an LH2 RPT, as well as the potential consequences. This work is an extension of a conference contribution by the same authors [36]. LNG RPT has only been observed for spills on water, and not when spilled onto a solid surface. Thus, we consider only spills on water. Scenarios involving subsurface injection of cryogens into water or water spills onto a cryogenic pool will not be addressed. The assessment is based on RPT theory established for LNG and published reports on LH2 spills. In Section 2, we describe the underlying mechanisms of a cryogenic spill on water, including a potential RPT event, and present models for pool spreading, triggering of RPT, and consequence quantification. Results from applying these models to LH2 and LNG are then presented in Section 3. A discussion of the results is given in Section 4, including a note on liquid nitrogen RPT. The main conclusions of this study are drawn in Section 5.
2. Models
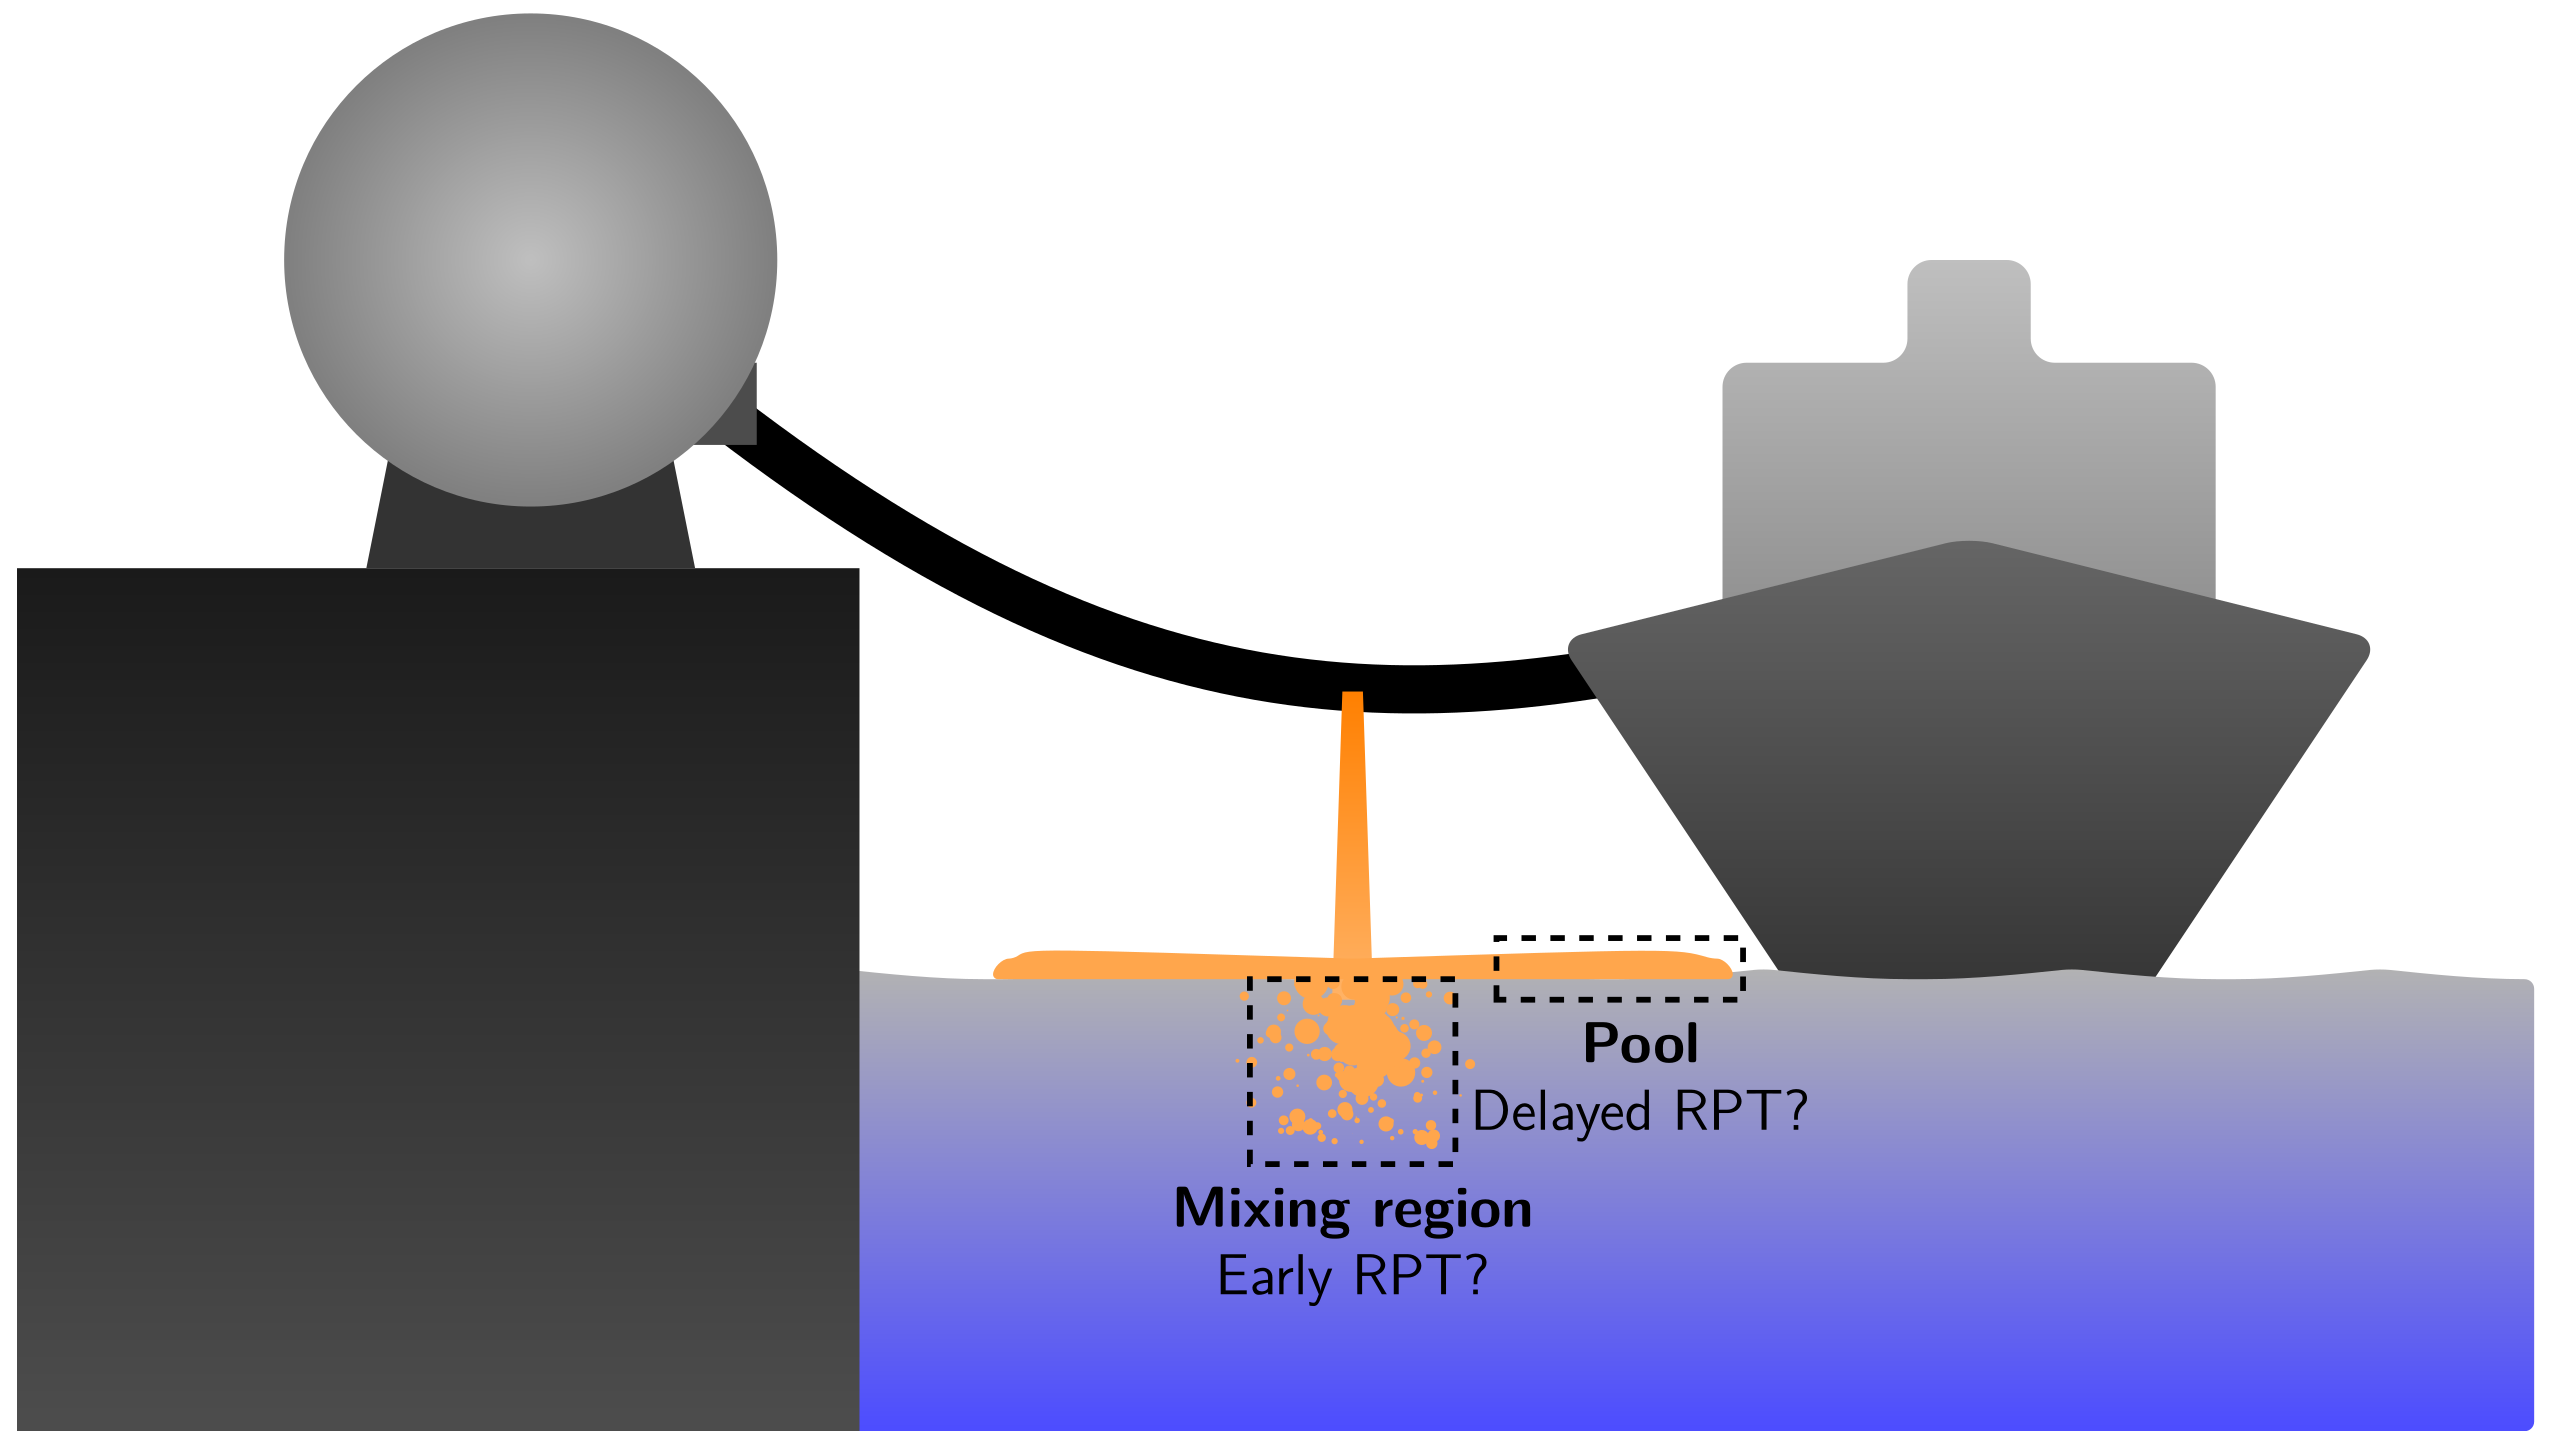
Figure 1 illustrates a potential accidental spill of a cryogenic fuel such as LNG or LH2 in a marine environment. Due to an unintended event, the containment of liquid cryogen in a tank or transfer line is lost. Since the cryogen is stored at its boiling point, it will start to boil as soon as it comes in contact with the relatively hot surroundings. When the fluid comes in contact with the water, the water–cryogen heat transfer will dominate the other heat-transfer contributions such as radiation and cryogen–air contact. Near the point of impact, there will be a chaotic mixing zone where the cryogen is broken down to droplets. Due to gravitational forces, the cryogen, which is assumed to be lighter than water, will form a pool that spreads outwards from the impact point. The supply of fluid from the containment breach will cease after some time, and eventually, the pool will have evaporated. RPTs may occur for LNG spill events that behave in this way. It has been observed that RPTs can occur after a few seconds near the point of impact (mixing zone), and sometimes also after tens of seconds further away (pool region). There are two categories of RPT, based on when and where it occurs during a spill event [22,29]:

Figure 1.
An illustration of an accidental release of a cryogenic fuel onto water. The origins of two kinds of RPT events are also shown: early RPT from the mixing zone and delayed RPT from the spreading pool.
- Early RPT: this is defined as any RPT occurring in the mixing region at any time during the spill event.
- Delayed RPT: this is defined as any RPT that is not an early RPT, which means it occurs somewhere in the spreading pool.
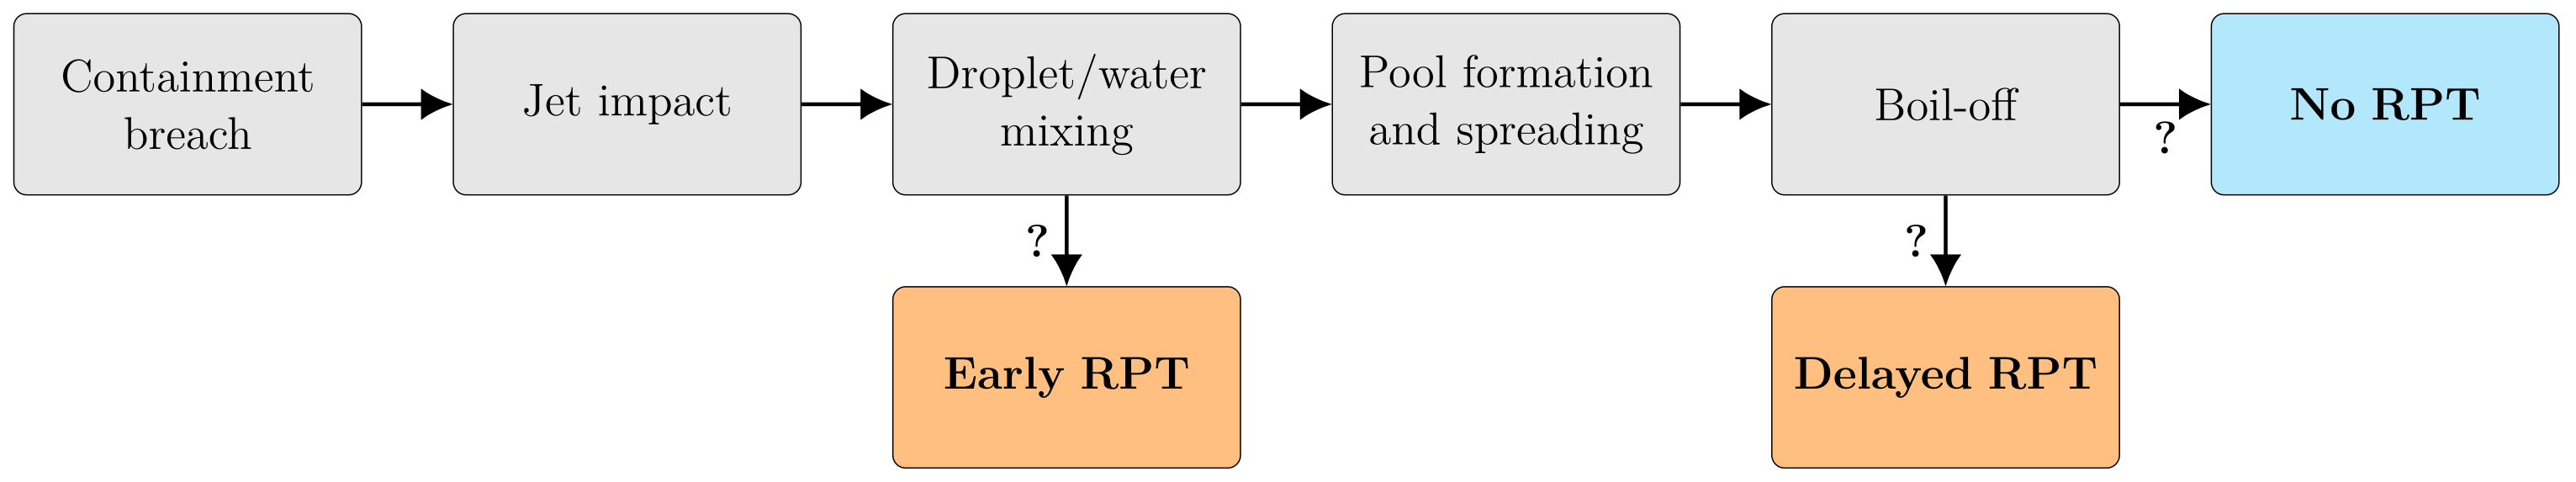
Figure 2 summarizes the macroscopic chain-of-events in a cryogenic spill on water, and the possible pathways to the two kinds of RPT events. To assess the possibility of an LH2 RPT under similar conditions, one must first be able to describe the behavior of a cryogen-spill event, and the mechanisms responsible for the RPTs observed for LNG. This includes heat transfer, evaporation, cryogen-on-water spread, and a theory for RPT triggering. One must understand how the different properties of LH2 and LNG are expected to influence this behavior. In this section, we present the models needed to describe the spill event and the RPT phenomenon. We then present the results when applied to LNG and LH2 cases in Section 3.
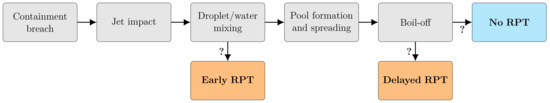
Figure 2.
The macroscopic chain-of-events in an LNG spill on water from a containment breach to the possible outcomes, including the two types of RPT events. Uncertain pathways are indicated by question marks.
2.1. Heat Flux and Evaporation
A cryogen at the boiling temperature () that comes in contact with a hot surface () will absorb a heat flux per unit area, , and start to evaporate. For a mixture, the generated vapor will be mainly the most volatile component (methane for LNG). This increases the boiling point as the mixture becomes more enriched on heavier components, and the absorbed heat goes to evaporation and heating the fluid. LH2, on the other hand, is a pure fluid, and the received heat contributes only to evaporation.
The heat transfer between a boiling fluid and the heat source is strongly dependent on the temperature difference—this is described by Nukiyama’s boiling curve, which is shown in Figure 3. If the water temperature is higher than the Leidenfrost temperature , a stable vapor film will form between the two fluids. This is known as film boiling and gives a strong reduction in heat transfer compared to when . Both LH2 and LNG are known to film boil on water. The heat flux per unit area in the film-boiling regime is roughly for LH2–water [5,37], and about for LNG–water [38].
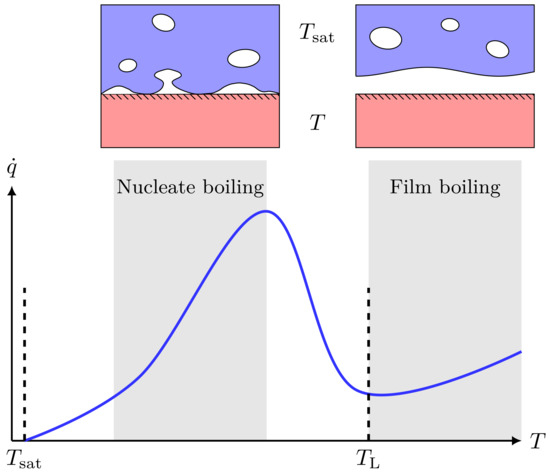
Figure 3.
Illustration of a typical boiling curve for saturated pool boiling, i.e., the boiling heat flux () as a function of surface temperature (T). When , the surface is considered superheated, and the difference is called the surface superheat. At moderate surface superheat, we are in the conventional nucleate boiling regime. However, once the surface superheat becomes larger, there is a transition into a film-boiling regime, which comes with a dramatic drop in heat flux due to the formation of a continuous vapor film. The lower end of the film-boiling regime is the Leidenfrost temperature (), and crossing this from right to left is called film-boiling collapse.
The rate of evaporation per unit area is determined by the latent heat of evaporation, . The evaporative liquid mass loss per unit area and per unit time is then
This expression holds for LH2 and is a good approximation for LNG as long as it contains significant amounts of methane. The heat of evaporation for LNG is then very close to that of methane. A detailed description of how to treat evaporation of mixtures is given by Lervg et al. [39]. The expression can be translated to an expression for the liquid-height reduction rate (volume reduction rate per unit area), , where is the density of the liquid. The vapor production in terms of mass is , and in terms of volume per area . The initial vapor temperature is assumed to be at the boiling point of the cryogen.
In addition to the heat flux between the water and the cryogen, heat is also transferred from the air and through radiation. The associated heat fluxes are much smaller than , and the error introduced by neglecting these have been estimated to be less than 10 for LH2 and LNG [5].
2.2. Spreading of Cryogens on Water
The spreading of a cryogen on water is a complex multiphase problem. In the mixing zone, this can in theory be solved with a 3-phase (LH2, H2(g), H2O(l)) computational fluid-dynamics treatment that includes heat transfer and evaporation. In the pool spreading region, one can get a reasonable description with simplified models. A detailed treatment is beyond the scope of this paper. Here, we present some insights on how different fluid properties influence the mixing, and we introduce a simplified model to describe the pool spread.
The degree of mixing is influenced by the balance between the cryogen momentum and its buoyancy. Assuming that a cryogen is dropped from a height and due to its impact displaces water at a depth , a simple balance of momentum yields
where v is the velocity of the cryogen at the point of impact and g is the gravitational acceleration. This is certainly an oversimplification since it assumes an idealized impact and does not account for vapor generation or the mixing with air. Still, the expression is useful for comparing the degree of mixing between two cryogens.
Let us assume that a spill occurs with a constant volumetric spill rate . Given the same type of breach and assuming that the spill rate from the container is driven by gravity (not the case for pressurized fluids), the spill rate will not be much affected by the cryogen properties such as density or viscosity. The net loss of liquid to evaporation is
If the spill rate is sufficiently large, most of the evaporation will occur in the pool region. In this case, one can approximate , where A is the total area covered by the cryogen. Interestingly, this simple expression can give the maximum radius for a radially symmetric spill:
This maximum radius and a steady state is reached after some tens of seconds [39]. There will be some density dependence in how fast this steady state is reached. The leading edge velocity will be lower for higher-density fluids, where the extreme limit is a fluid having the same density as water, which would not spread at all. The velocity will scale with the buoyancy factor , e.g., for instantaneous spills, the Fay model gives a square root dependence of the leading edge velocity on this buoyancy factor [40]. This is important when comparing fluids with drastically different densities, such as LH2 and LNG. The density of LNG is about 45% that of water, while the same ratio is 7% for LH2. This difference in buoyancy is illustrated in Figure 4.
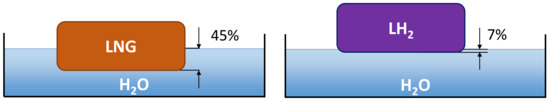
Figure 4.
Illustration of penetration depth for LNG and LH2 on a water surface.
2.3. Theory of RPT Triggering
The theory of RPT was developed after the observation of LNG RPT in the 1960s. The description is local in the sense that it treats the occurrence at small scales at the time and position of a single RPT event. This makes it applicable to both early and delayed RPT. Furthermore, the formulation is not specific to LNG. The theory is summarized by the following chain of events:
- 1.
- Film-boiling stageIf the water temperature is higher than the Leidenfrost temperature of the cryogen (see Figure 3), a stable insulating vapor film will form between the cryogen and the water. This is known as film boiling, and the lack of direct contact between the two fluids reduces heat transfer tremendously. In this stage, the cryogen stays in quasi-equilibrium, and the energy transferred from the water goes to evaporating the cryogen.
- 2.
- Film-boiling collapseAt some point, there is a sudden and localized collapse of the vapor film. The suggested mechanism that induces this film collapse depends on the cryogen properties and whether early or delayed RPT is considered.
- 3.
- Rapid superheatingThe direct contact between the water and the cryogen induces a large and rapid increase in the heat flux. There is a low number of nucleation sites at liquid–liquid interfaces, and the evaporation rate will be too low to compensate for the large heat flux. As a consequence, the cryogen is superheated, meaning that the liquid is heated above boiling temperature. A superheated liquid is in a metastable state, which equilibrates to a corresponding equilibrium if disturbed. If the metastable liquid is not disturbed, the temperature will continue to increase until a maximum temperature is reached. At this point, known as the superheat limit, the liquid will spontaneously equilibrate.
- 4.
- Homogeneous nucleationWhen the liquid gets sufficiently close to the superheat limit, spontaneous nucleation occurs throughout the volume. This initiates the RPT, where large amounts of liquid are vaporized in a very short timeframe.
- 5.
- Explosive expansionLiquid is typically 1–2 orders of magnitude more dense than vapor in mechanical equilibrium. The rapid formation of vapor leads to a large local increase in pressure that is followed by an explosive expansion. This is observed as a loud and potentially destructive vapor explosion. The expansion can be characterized and compared to conventional explosions by estimating the peak pressure and the energy released in the form of expansion work.
Once the second out of these five stages is reached (film-boiling collapse), the theory of RPT predicts that the next three stages will follow spontaneously. This chain of events can be used to explain how RPT may occur. However, recall that a spill of LNG (or another cryogen) may not necessarily trigger an RPT event. The vapor film may never collapse or the transition from film boiling to nucleate boiling could occur without any violent evaporation.
Early RPT occurs in the liquid–liquid mixing region where the cryogen impacts the water. The chaotic nature of this mixing makes it challenging to predict the vapor-film collapse. The boiling behavior diverges from the description by the simple boiling curve [41]. This is most likely due to impact forces between the liquids, and for mixtures (such as LNG), also the development of local variations in the composition. The necessary, detailed multiphase simulations of the mixing region over sufficient timescales has, to our knowledge, not yet been achieved. Predicting early RPT is thus an unsolved problem. Some remarks regarding the likelihood of an RPT event, and its dependence on fluid properties and case geometry can still be made:
- 1.
- The vapor film is more robust if the Leidenfrost temperature is low. That is, if the film boiling is “far from” transition boiling (), then film-boiling collapse is less likely to occur.
- 2.
- A low momentum impact is less likely to induce film-boiling collapse than a high-momentum impact.
- 3.
- Low-density cryogens () have a smaller and more short-lived mixing zone than high-density cryogens () due to smaller impact and increased buoyancy.
The above theory predicts that a necessary requirement for RPT is collapse of the gas film separating the liquids. For delayed RPT, this happens if the Leidenfrost temperature of the cryogen is larger than the water temperature. Hence, we formulate the following triggering model:
It can be difficult to predict the Leidenfrost temperature of a fluid with good accuracy, but in general, it has been found that it can be estimated as the liquid spinodal at atmospheric pressure, which can be approximated as [42]:
Note that for a mixture, , and thus , will change as the more volatile components evaporate. Good agreement between this model and available experimental data for methane was demonstrated by Aursand et al. [43].
2.4. Consequence Quantification
A method to partially quantify the consequence of an RPT event was presented in Aursand and Hammer [44]. This method is based on simplifying the two last steps (4→4’ and 5→5’) of the theoretical chain-of-events presented in Section 2.3. The two following idealized steps are assumed instead:
- 4’.
- Equilibration: Evaluate the energy and density of the cryogenic fluid exactly when it reaches the superheat limit after film-boiling collapse. The temperature of this state is equal to the superheat limit () corresponding to the composition at the time when the triggering criterion was reached. Then, calculate the corresponding quasi-equilibrium state with the same energy, density, and composition. This yields a new high-pressure intermediate state ().
- 5’.
- Isentropic expansion: The intermediate state () is said to be in quasi-equilibrium since it is in local equilibrium, but not in a mechanical equilibrium with the surroundings due to its elevated pressure. A rapid expansion follows, which is assumed to be isentropic and whose end-state is at atmospheric pressure and with the same entropy as the intermediate state ().
From these calculations, there are particularly two quantities of interest to evaluate the consequence of a potential RPT event:
- Peak pressure, : this is the pressure of the intermediate state before expansion, and we use this as an estimate for the peak pressure of an RPT event very close to the source.
- Explosive energy yield, E: This is the mechanical work done by the expansion process, which is assumed isentropic, and hence, also reversible and adiabatic. By classical thermodynamics theory, E is equal to the difference in total enthalpy between the initial and final states. This gives an energy per amount triggered (per or ).
The superheat-limit temperature is calculated by an algorithm described in Ref. [44]. For the thermodynamic evaluation of the two-phase equilibrium state, we use SINTEF’s software Thermopack [45,46], which is based on algorithms described by Michelsen and Mollerup [47]. To our knowledge, there is no way of predicting how much of the total spill will participate in a single, localized RPT event. Hence, we cannot predict the total energy yield of one RPT event. Assuming that the entire pool participates in the RPT event gives an upper bound on the total yield estimates. The energy yield per amount of liquid can also be used directly to compare different liquids.
3. Results
Three models have been presented in the previous section: pool-spreading estimates, RPT triggering, and potential consequences. Here we present the results obtained by applying these models to both LH2 and LNG. To describe hydrogen, we have used the multiparameter equation of state (EoS) by Leachman et al. [48], which is considered the most accurate EoS for hydrogen [49]. Since the hydrogen is stored at ( ) and all the relevant physics occurs at ( ), we assume that all the hydrogen is in the para state and we use the para version of the EoS. For the LNG, we have defined a composition in Table 1 based on the typical production compositions [50]. The LNG thermodynamics is calculated using an extended corresponding-states EoS [47], in which the Peng–Robinson EoS is used to calculate the shape factors and methane is used as a reference fluid and described by the multiparameter Benedict Webb Rubin (BWR) EoS [51]. Relevant fluid properties are specified in Table 2.

Table 1.
LNG composition used in calculations.
Table 2.
Properties of LH2 and LNG relevant for spill and RPT. The properties are calculated using the EoSs specified in the text (density error < 0.5%).
3.1. Pool Spreading
Assuming a drop height , the estimated displacement depth into water due to the impact (2) is and for LH2 and LNG, respectively. Hence, the impact on water is roughly one order of magnitude larger for LNG compared with LH2.
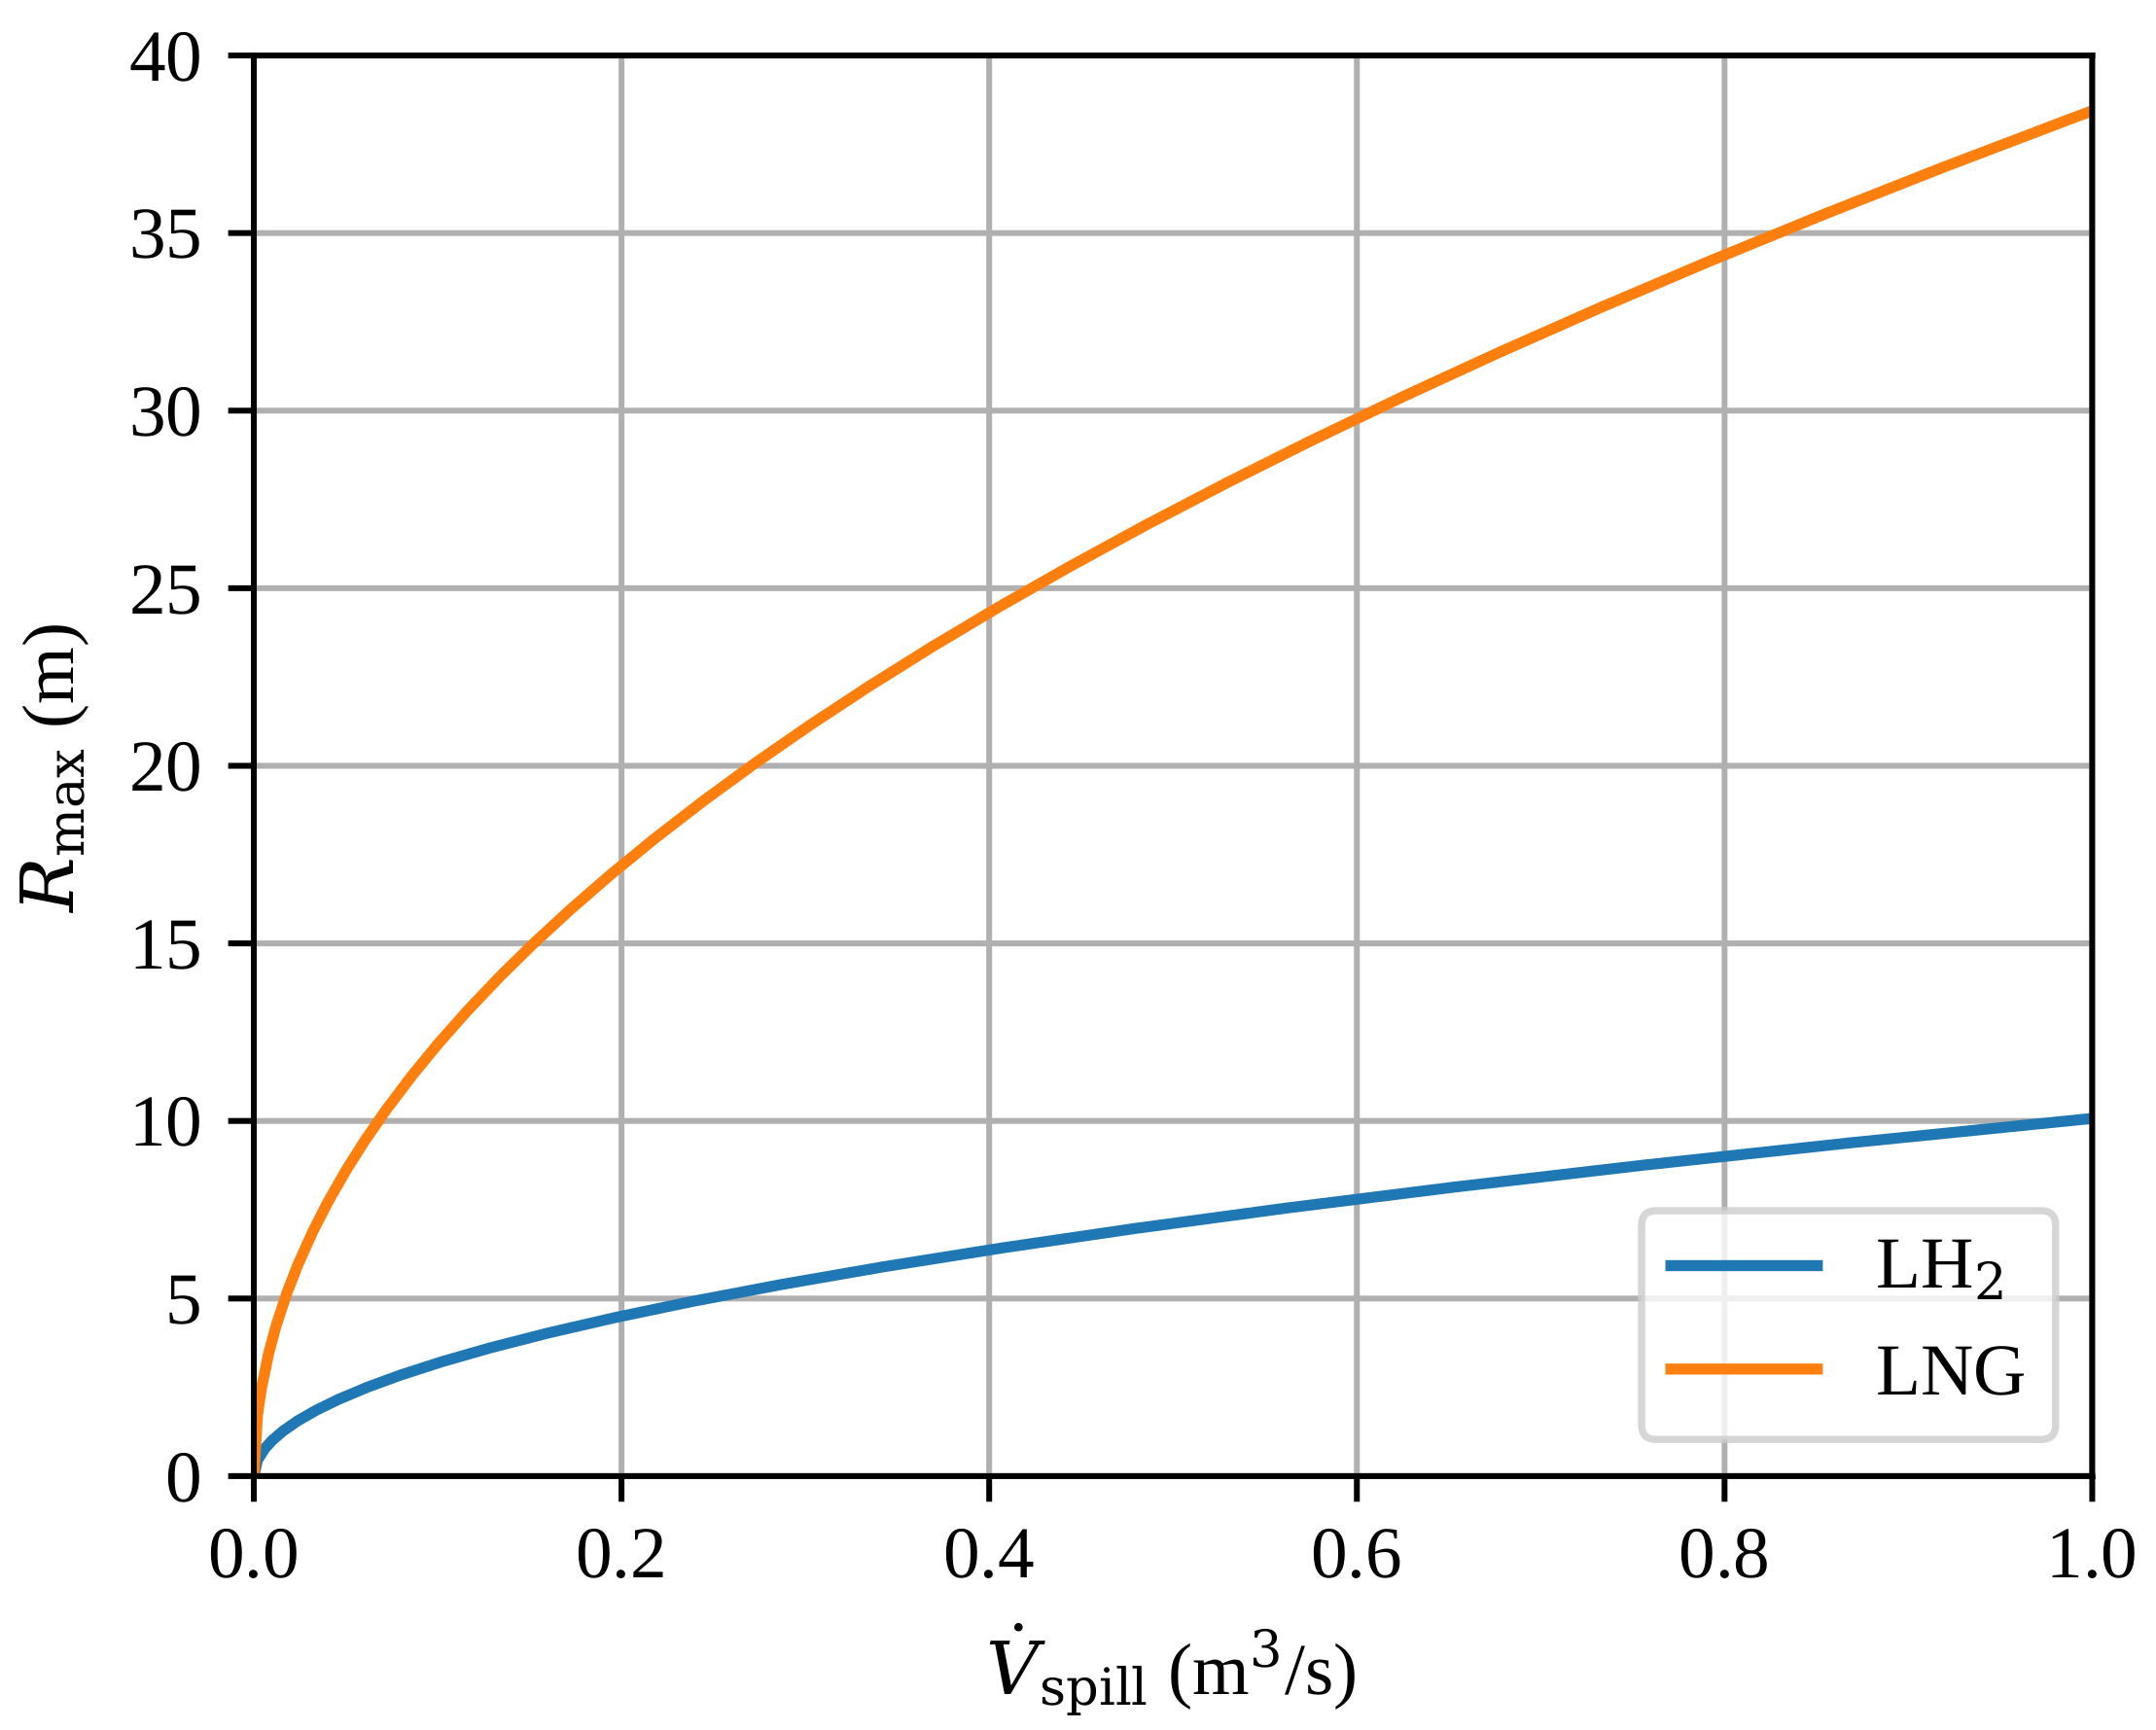
The estimated maximum radius of a steady-state spill , given by 4, is presented in Figure 5. We have used the heat fluxes for LH2 and for LNG. The analytical model predicts the maximum pool radius to be approximately four times bigger for LNG compared with LH2. This is mostly due to the large density difference giving a large difference in volumetric latent heat of evaporation, but also due to a higher boiling heat flux for LH2.
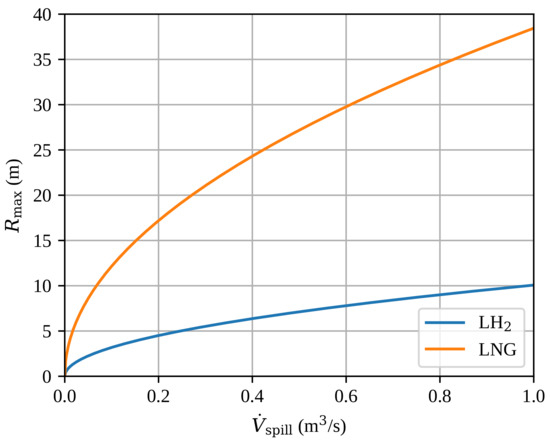
Figure 5.
The estimated maximum radius of a steady-state spill as a function of the volumetric spill rate . The results are based on the analytical model (Equation 4).
3.2. Triggering
Phase envelopes and Leidenfrost temperatures for LH2 and LNG are shown in Figure 6. As per Gibb’s phase rule, the two-phase region that separates the gas and liquid phase is a simple line for the single-component hydrogen and a region (shaded) for the multicomponent LNG. Employing 6, we obtain that for LNG. The water temperature will be close to its freezing point ( 0 ) or slightly above. Hence, the triggering criteria (5) is far from being satisfied, and the model predicts no RPT event with the initial composition. However, boil-off of the lighter components cause the critical point to increase due to the change in the composition. As a consequence, the Leidenfrost temperature will also increase. We further assume that only methane evaporates, which is a reasonable approximation as long as there are significant amounts of methane in the mixture. When the methane composition has fallen to 12 , we have that , and hence, we have a risk of RPT. This means that the boil-off effect is essential for triggering a delayed RPT event for LNG. At the point of triggering, only 11% of the LNG remains. This fraction is dependent on initial composition, and can be significantly higher for LNG rich on the heavier components.
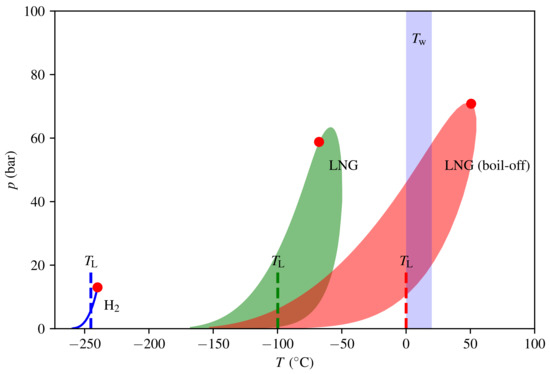
Figure 6.
Phase envelopes in the temperature and pressure domain for hydrogen and natural gas with initial and boil-off compositions. The two-phase regions are shaded and the red dots are the respective critical points. The Leidenfrost temperatures are indicated by dashed lines.
The critical temperature for hydrogen is very low; hence, its Leidenfrost temperature is also very low. The estimate (6) gives , while Wang et al. [37] reported based on a survey of experimental data specifically for hydrogen fitted to analytical models (all experiments are LH2 on solid surfaces). In any case, and delayed RPT for LH2 is not possible according to the model. Early RPT will be discussed in Section 4.1.
3.3. Consequence Quantification
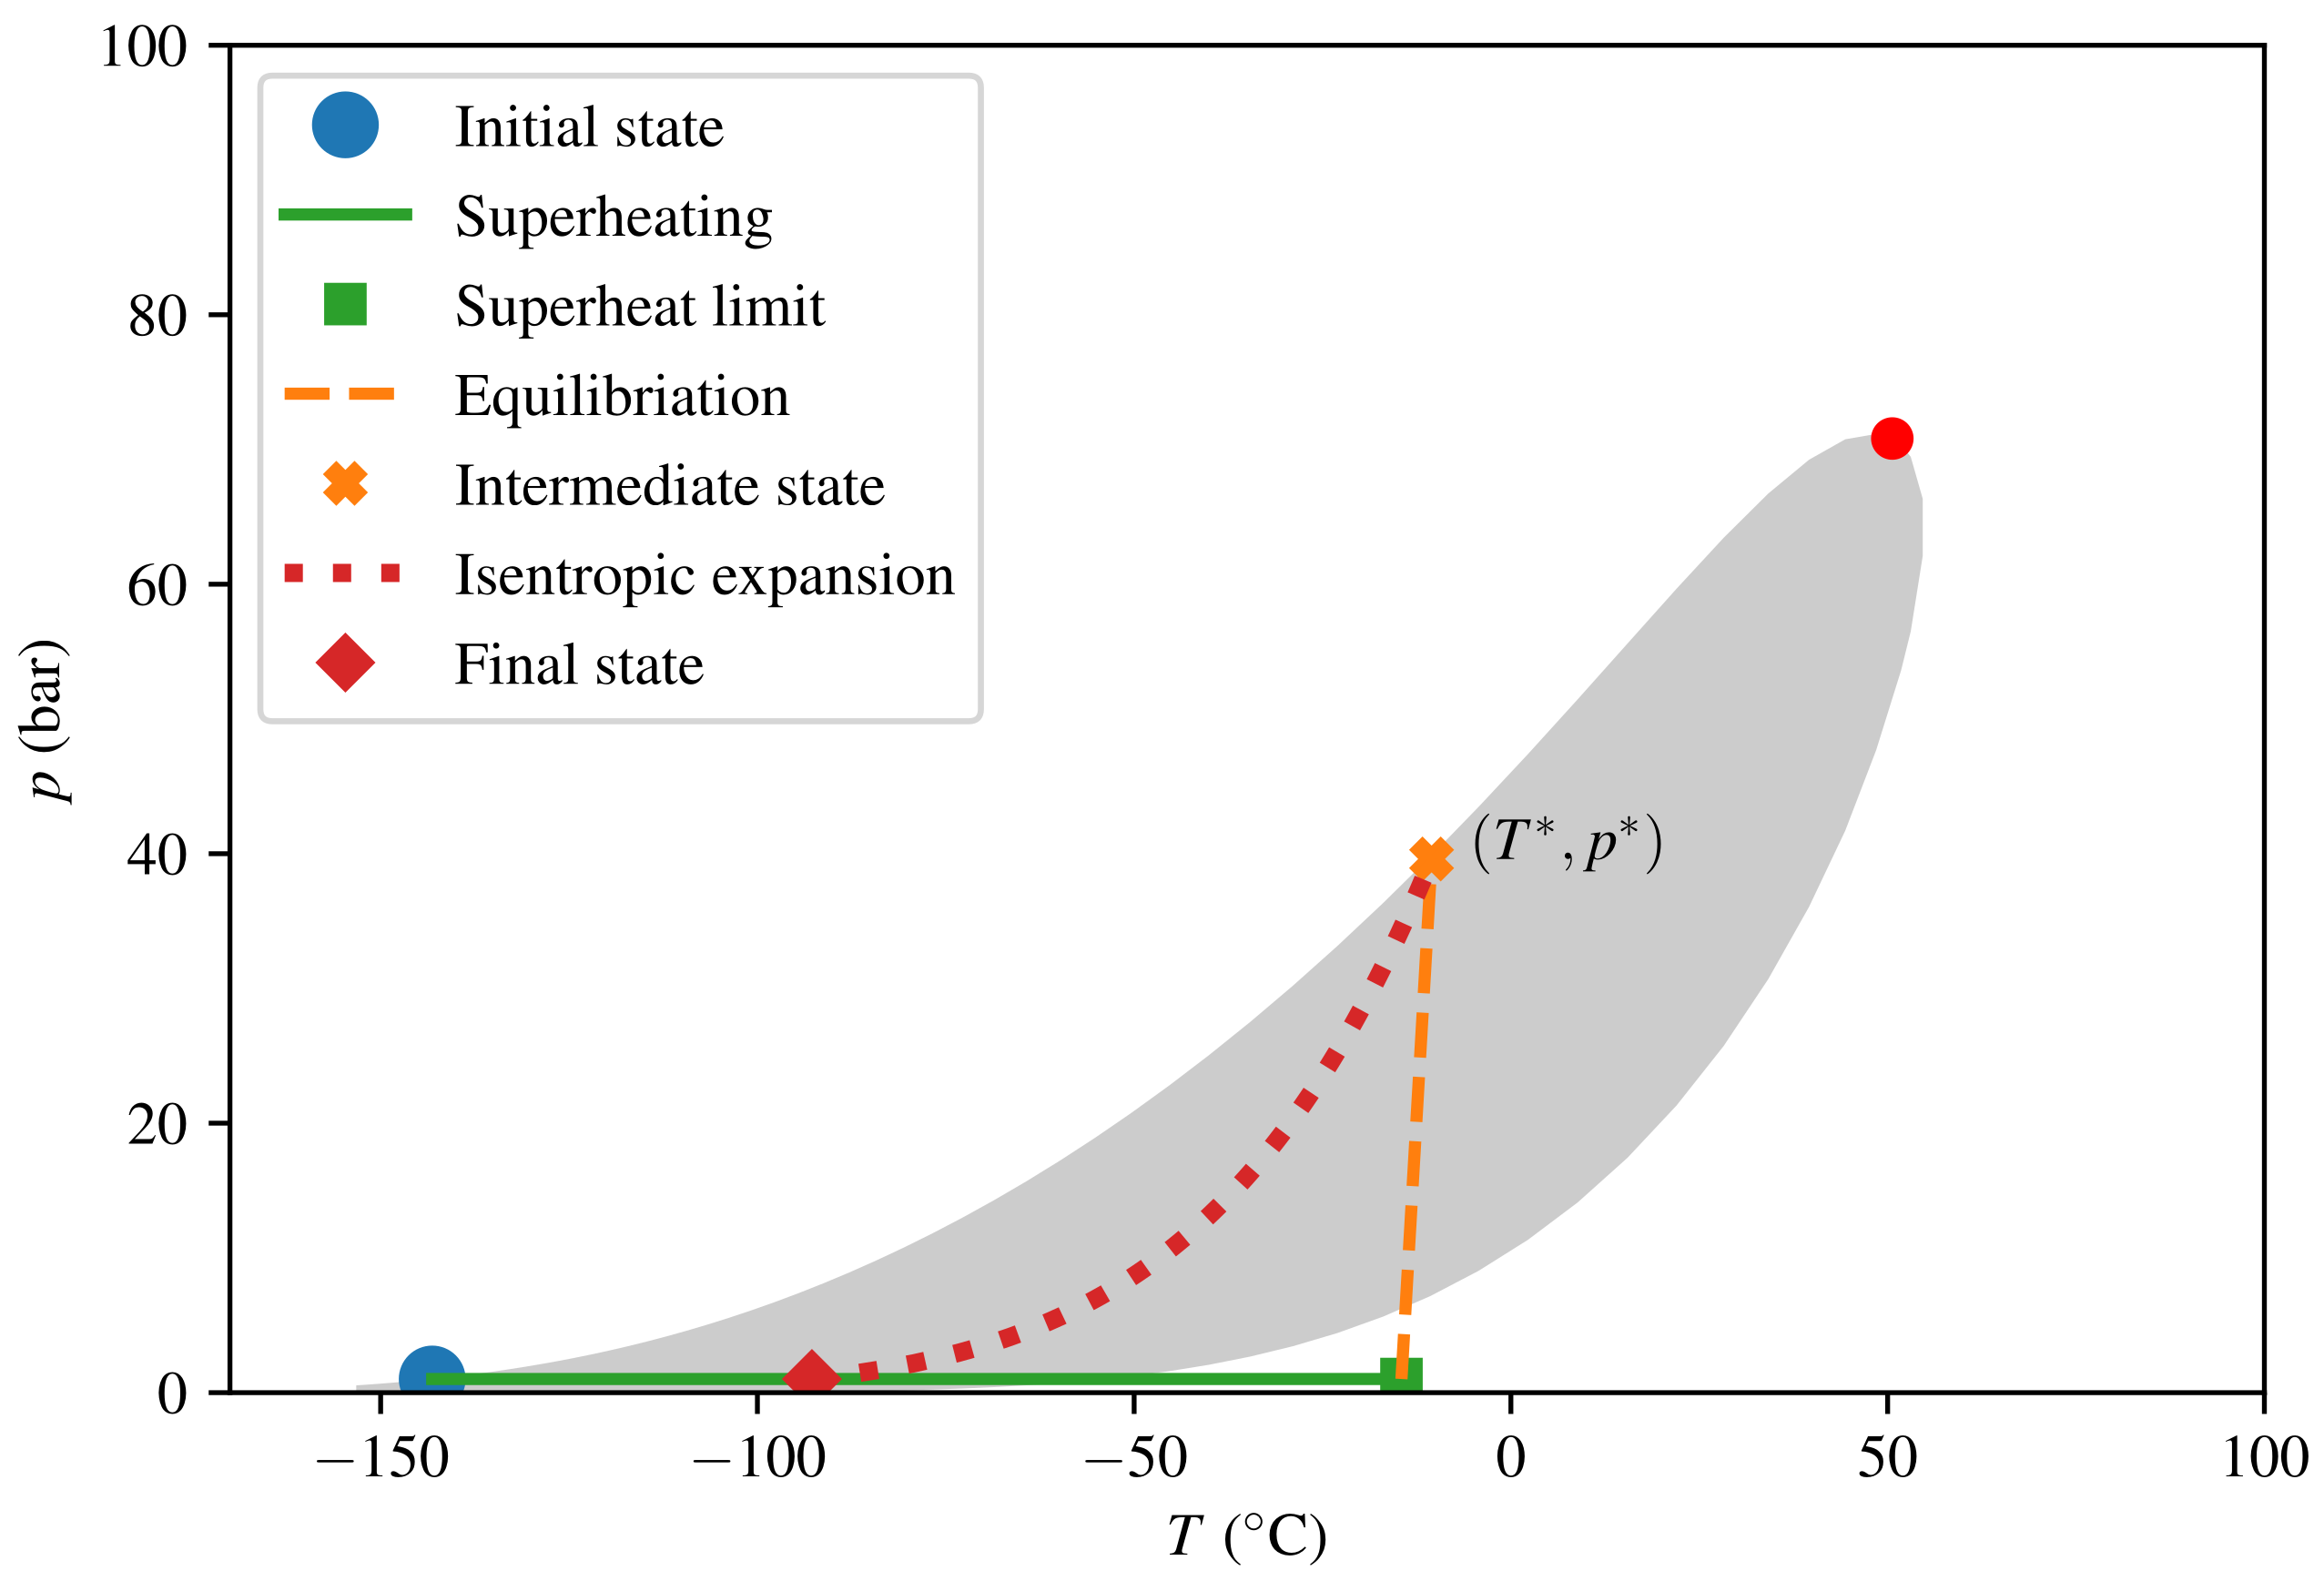
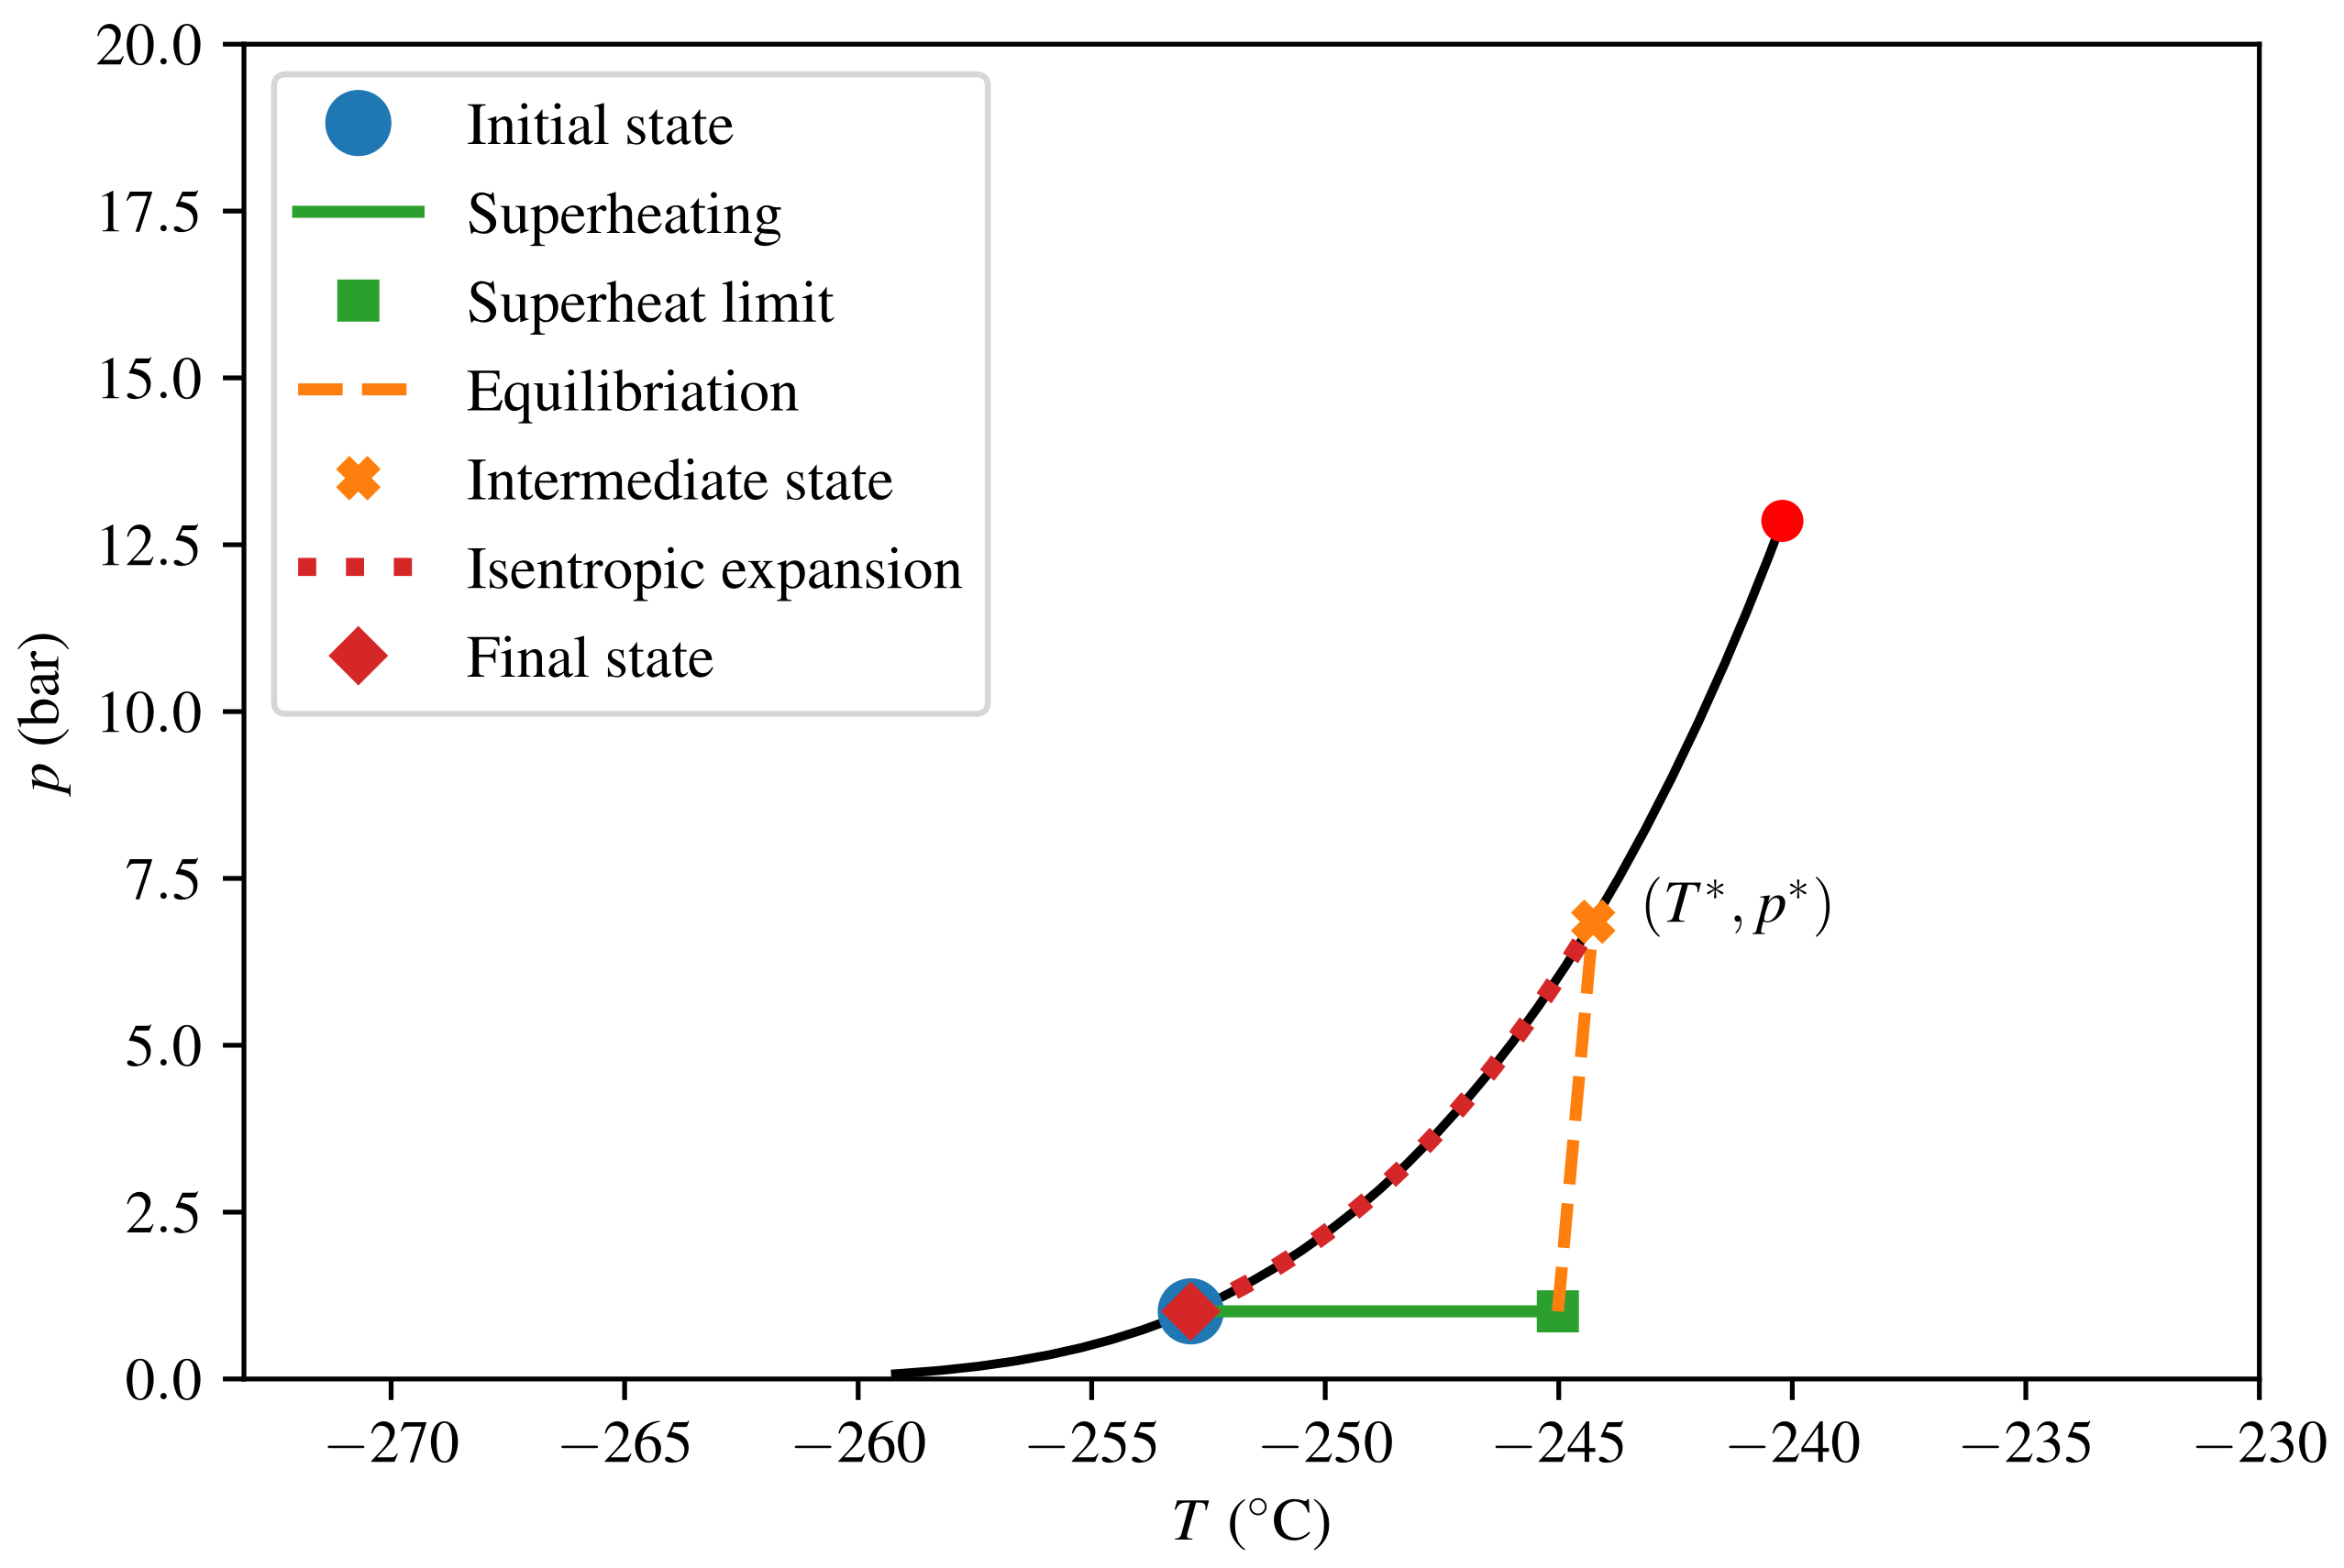
The thermodynamic paths taken in the calculations for consequence quantification are depicted in Figure 7 and Figure 8 for LNG and LH2, respectively. The intermediate steps (superheating, equilibration, and isentropic expansion) and the model algorithm were described in Section 2.4. The predicted consequences in terms of peak pressure and energy yield E are listed in Table 3. We see that the peak pressure of a theoretical LH2 RPT is only 17 of that of a theoretical LNG RPT, and that the corresponding ratio for energy yield per volume is as low as 5. The numbers given are in terms of triggered mass and not relative to the initially spilled amount. For LNG, calculating relative to the spilled amount would give a reduction by a factor of 9 in energy yields for the specified composition. This is due to the fact that approximately 90% of the initial LNG has to evaporate before the triggering criterion is met.

Figure 7.
Thermodynamic diagram for LNG from triggering the initial (post-boil-off) state to the final state.
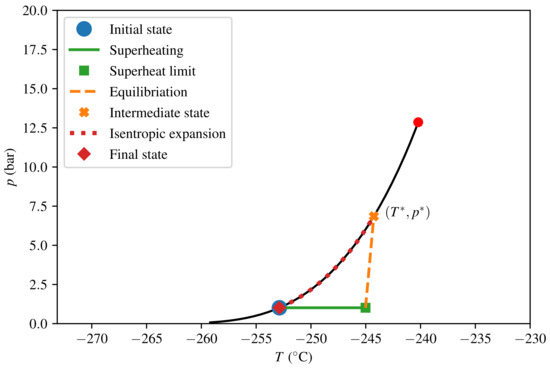
Figure 8.
Thermodynamic diagram for H2, from triggering the initial state to the final state.
Table 3.
The predicted consequences of LH2 RPT compared to LNG RPT.
4. Discussion
4.1. Interpretation of Results
While LH2 and LNG have many similarities, our results demonstrate that there are three particular differences that have significant impacts on the risk of RPT:
- 1.
- LNG is about six times denser than LH2;
- 2.
- The Leidenfrost temperature of LNG is approximately 150 larger than that of LH2;
- 3.
- LNG is multicomponent, so that boil-off will increase the Leidenfrost temperature.
All of these characteristics make LNG RPT more likely than LH2 RPT.
The density difference impacts the cryogenic spill on water event at several stages. At the containment breach, the mass (and hence, total energy) of a spill would be larger for LNG if one compares spills with equal volumetric spill rate. Next, a high-density cryogen would have a much higher impact with the water surface. The large difference in density of LH2 and LNG produces a difference in penetration depth of one order of magnitude. This means that the mixing zone will be larger and more chaotic for LNG and, thus, increase the contact area between water and LNG. Furthermore, a higher impact is expected to destabilize the insulating gas film and, hence, increase the chance of film-boiling collapse (liquid–liquid contact). This latter effect is again strengthened by the higher Leidenfrost temperature of LNG. Both effects (size of mixing zone and film-boiling stability) indicate that early RPT is more likely for LNG and very unlikely for LH2. A third effect of higher density is that the pool size (maximum radius) increases, which again increases the contact area and, thus, the likelihood of delayed RPT.
The Leidenfrost temperature is directly related to triggering since a low Leidenfrost temperature reduces the chance of film-boiling collapse, which is the main triggering mechanism. How the Leidenfrost temperature depends on high impact and high pressure should be subjected to further research. Results from the triggering model clearly demonstrate that boil-off of lighter components in LNG is an essential effect because it increases the Leidenfrost temperature and, hence, also the risk of an RPT event. It is important to note that the initial composition of LNG can have a great effect on the increase in Leidenfrost temperature during boil-off. Certain compositions (e.g., ethane-rich mixtures) may never reach the triggering criterion (), while LNG rich on heavier components will reach it earlier than the specific composition used here.
4.2. Note on Liquid Nitrogen
Liquid nitrogen (LIN) is another cryogen that has many similarities with LNG and LH2. However, its use is far from as extensive, as LNG has been for decades, or as predicted for LH2 in the future. In some ways, LIN is more equal to LH2 than LNG is to LH2: it is single-component and has a lower boiling point ( ) and critical temperature ( ) than LNG. However, LIN is quite dense ( 806 / at ). The triggering model, 5, predicts that there is no risk for delayed LIN RPT. Based on the discussion above, one could argue that the high density of LIN makes it more prone to early RPT than LH2.
LIN RPT was experimentally studied by Bang and Corradini [52]. They noticed that delayed spontaneous RPT was not possible, but explosions were observed when generating a pressure pulse with an electromagnet. It was concluded that the size of the interface area between the cryogen and water and the penetration depth appear to be the most influencing parameters for RPT triggering. One could argue that the absence of delayed LIN RPT further strengthens the conclusion that delayed LH2 RPT is impossible, since the Leidenfrost temperature and density of LIN is higher than for LH2. Subsurface injection of LIN into water has also been studied [53,54,55], and RPTs in such scenarios was observed. Bang and Corradini [52] measured quite low pressures during LIN RPT (1–2). They attributed this to the relatively low critical pressure of the expanding fluid. This could indicate that the consequence of LH2 RPT is even lower than for LIN.
4.3. Hypothetical Pathways to LH2 RPT
The presented results are based on the assumption that the water surface holds an approximately constant temperature of 0 . Moreover, we neglect other triggering criteria such as water waves or pressure pulses from different sources that both could increase the mixing region and, hence, facilitate an RPT. Despite the very low temperature of LNG, very little or no ice has been observed for large-scale LNG spills [21,22]. However, LH2 is considerably colder, which could cause noticeable ice-formation. Formation of a continuous and thick (several ) layer of ice was observed in the LH2 spill experiments by Verfondern and Dienhart [5], Verfondern and Dienhart [56]. It should be noted that the ice formation was likely enhanced due to hampered water circulation in the small pool. The presence of an ice sheet allows for a new potential mechanism for triggering delayed RPT since the surface temperature () is allowed to go below 0 . Cooling of the ice layer all the way down to the Leidenfrost temperature (≈) would require considerable subcooling and is rather unrealistic. Furthermore, the presence of an ice sheet makes the incoming jet impact a solid surface instead of a liquid surface, and one could imagine this leading to a new kind of early RPT. However, the fundamental theory of RPT triggering described in Section 2.3 often stress the importance of a liquid–liquid interface, because this interface has no nucleation sites. This allows the sudden heat-flux increase to be spent on superheating instead of rapid heterogeneous nucleation. In contrast, liquid–solid contact after film-boiling collapse merely leads to normal (but rapid) nucleate boiling. Hence, RPT due to subcooled ice seems very unlikely.
Another effect of LH2 spills is the condensation and freezing of air components, such as oxygen and nitrogen, which have higher freezing points than LH2. Such components can mix into the LH2 pool and may have unpredictable consequences that should be further studied.
5. Conclusions
LH2 spills on water have been investigated to evaluate the feasibility and consequence of a hypothetical RPT event. The assessment is based on established theory from LNG research. We present models for pool spreading, triggering of RPT, and consequence quantification. These have been applied to LH2 and LNG, and our main conclusion is that the hypothetical LH2 RPT event as a consequence of an accidental spill on water is an issue of only minor concern. For the triggering mechanism, we find that the theoretical pathways known from the LNG research are very unlikely or even impossible for LH2. This is mainly due to the very low Leidenfrost temperature of LH2. The feasibility of triggering is further reduced by the low impact forces and small degree of mixing with water due to the low density of LH2. An essential mechanism for LNG RPT is that the lighter components evaporate first, resulting in increased Leidenfrost temperature. This mixture effect is not present for LH2, which is single-component. More research on film-boiling stability for high-impact forces and in chaotic mixing regions is needed to understand triggering of early RPT more fundamentally, but the very low Leidenfrost temperature of LH2 indicates that the vapor film is stable. Moreover, the potential consequences of condensation and freezing of air components should be subjected to further studies. The estimated consequence of a hypothetical LH2 RPT event is considerably smaller than for LNG. The predicted peak pressure is only 17 of that from LNG RPT, and the predicted explosive yield per volume is only 5 compared with LNG. Our theoretical risk assessment is further supported by the fact that no LH2 RPT incidents have been reported. Experimental research on LH2 spills on water is limited, and more experiments, especially on larger scales, are recommended. An experimental campaign to investigate LH2 RPT triggering and consequence in the project “Safe H2 fuel handling and Use for Efficient Implementation (SHIFT)” is ongoing.
Author Contributions
Conceptualization, L.H.O., H.L.S., E.A., F.U., G.A.R. and N.P.; data curation, L.H.O., H.L.S., E.A. and F.U.; formal analysis, L.H.O., H.L.S. and E.A.; methodology, L.H.O., H.L.S. and E.A.; project administration, L.H.O. and N.P.; software, H.L.S. and E.A.; supervision, G.A.R. and N.P.; validation, L.H.O., H.L.S. and E.A.; visualization, L.H.O., H.L.S. and E.A.; writing—original draft, L.H.O., H.L.S. and E.A.; writing—review & editing, L.H.O., H.L.S., E.A., F.U., G.A.R. and N.P. All authors have read and agreed to the published version of the manuscript.
Funding
This work was undertaken as part of the research project “Safe H2 fuel handling and Use for Efficient Implementation (SH2IFT)”, and the authors would like to acknowledge the financial support of the Research Council of Norway under the ENERGIX programme (Grant No. 280964).
Informed Consent Statement
Not applicable.
Data Availability Statement
Data sharing not applicable.
Conflicts of Interest
The authors declare no conflict of interest.
References
- Hydrogen Council. Hydrogen Decarbonization Pathways. 2021. Available online: https://hydrogencouncil.com/en/hydrogen-decarbonization-pathways (accessed on 4 August 2021).
- Zero Emission Platform (ZEP). The Crucial Role of Low-Carbon Hydrogen Production to Achieve Europe’s Climate Ambition: A Technical Assessment. 2021. Available online: https://zeroemissionsplatform.eu/the-crucial-role-of-low-carbon-hydrogen-production-to-achieve-europes-climate-ambition-a-technical-assessment (accessed on 4 August 2021).
- Reid, R.C. Rapid phase transitions from liquid to vapor. Adv. Chem. Eng. 1983, 12, 105–208. [Google Scholar] [CrossRef]
- Pitblado, R.M.; Woodward, J.L. Highlights of LNG risk technology. J. Loss Prev. Process. Ind. 2011, 24, 827–836. [Google Scholar] [CrossRef]
- Verfondern, K.; Dienhart, B. Experimental and theoretical investigation of liquid hydrogen pool spreading and vaporization. Int. J. Hydrog. Energy 1997, 22, 649–660. [Google Scholar] [CrossRef]
- Pritchard, D.K.; Rattigan, W.M. Hazards of Liquid Hydrogen: Position Paper; Technical Report RR769; Health and Safety Laboratory: Norwich, UK, 2010. [Google Scholar]
- Batt, R. Modelling of Liquid Hydrogen Spills; Technical Report RR985; Health and Safety Laboratory: Norwich, UK, 2014. [Google Scholar]
- Royle, M.; Willoughby, D. Releases of Unignited Liquid Hydrogen; Technical Report RR986; Health and Safety Laboratory: Norwich, UK, 2014. [Google Scholar]
- Ekoto, I.W.; Hecht, E.; San Marchi, C.; Groth, K.M.; Lafleur, A.C.; Natesan, N.; Ciotti, M.; Harris, A. Liquid Hydrogen Release and Behavior Modeling: State-of-the-Art Knowledge Gaps and Research Needs for Refueling Infrastructure Safety; Technical report; Sandia National Laboratories: Albuquerque, NM, USA, 2014. [Google Scholar]
- Kotchourko, A.; Baraldi, D.; Bénard, P.; Eisenreich, N.; Jordan, T.; Keller, J.; Kessler, A.; LaChance, J.; Molkov, V.; Steen, M. State of the Art and Research Priorities in Hydrogen Safety; Science and Policy Report; Hydrogen Knowledge Centre: Derby, UK, 2013. [Google Scholar] [CrossRef]
- Rivkin, C.; Burgess, R.; Buttner, W. Hydrogen Technologies Safety Guide; Technical Report NREL/TP-5400-60948; National Renewable Energy Laboratory: Golden, CO, USA, 2015. [Google Scholar]
- Ruiz, P.; Vega, L.F.; del Mar Arxer, M.; Jimenez, C.; Rausa, A. Hydrogen: Applications and Safety Considerations, 1st ed.; MATGAS 2000 AIE: Barcelona, Spain, 2015. [Google Scholar]
- Keller, J.; Hill, L.; Kiuru, K.; Groth, K.M.; Hecht, E.; James, W. HySafe Research Priorities Workshop Report; Technical Report SAND2016-2644; Sandia National Laboratories: Albuquerque, NM, USA, 2016. [Google Scholar]
- European Hydrogen Safety Panel. Safety Planning for Hydrogen and Fuel Cell Projects. Version 1.31. 2019. Available online: https://www.fch.europa.eu/page/european-hydrogen-safety-panel (accessed on 4 August 2021).
- Katz, D.L.; Sliepcevich, C.M. LNG/Water Explosions: Cause & Effect. Hydrocarb. Process. 1971, 50, 240–244. [Google Scholar]
- Katz, D.L. Superheat-limit explosions. Chem. Eng. Prog. 1972, 68, 68. [Google Scholar]
- Nakanishi, E.; Reid, R. Liquid Natural Gas—Water Reactions. Chem. Eng. Prog. 1971, 67, 36–41. [Google Scholar]
- Enger, T.; Hartman, D.E. Explosive Boiling of Liquefied Gases on Water. In Proceedings of the Conference on LNG Import and Terminal Safety, Boston, MA, USA, 13–14 June 1972. [Google Scholar]
- Enger, T.; Hartman, D. Mechanics of the LNG-water interaction. In Proceedings of the AGA Distribution Conference, Atlanta, GA, USA, 8–10 May 1972. [Google Scholar]
- Enger, T.; Hartman, D.E.; Seymour, E.V. Explosive Boiling of Liquefied Hydrocarbon/Water Systems. In Advances in Cryogenic Engineering; Timmerhaus, K.D., Ed.; Springer US: Boston, MA, USA, 1973; pp. 32–41. [Google Scholar] [CrossRef]
- Cleaver, P.; Johnson, M.; Ho, B. A summary of some experimental data on LNG safety. J. Hazard. Mater. 2007, 140, 429–438. [Google Scholar] [CrossRef] [PubMed]
- Luketa-Hanlin, A. A review of large-scale LNG spills: Experiments and modeling. J. Hazard. Mater. 2006, 132, 119–140. [Google Scholar] [CrossRef]
- Shaw, S.; Baik, J.; Pitblado, R. Consequences of underwater releases of LNG. Process. Saf. Prog. 2005, 24, 175–180. [Google Scholar] [CrossRef]
- Alderman, J.A. Introduction to LNG safety. Process. Saf. Prog. 2005, 24, 144–151. [Google Scholar] [CrossRef]
- Hightower, M.; Gritzo, L.; Luketa-Hanlin, A. Safety implications of a large LNG tanker spill over water. Process. Saf. Prog. 2005, 24, 168–174. [Google Scholar] [CrossRef]
- Havens, J.; Spicer, T. United states regulations for siting LNG terminals: Problems and potential. J. Hazard. Mater. 2007, 140, 439–443. [Google Scholar] [CrossRef]
- Raj, P.K.; Bowdoin, L.A. Underwater LNG release: Does a pool form on the water surface? What are the characteristics of the vapor released? J. Loss Prev. Process. Ind. 2010, 23, 753–761. [Google Scholar] [CrossRef]
- Forte, K.; Ruf, D. Safety Challenges of LNG Offshore Industry and Introduction to Risk Management. In Proceedings of the ASME 2017 36th International Conference on Ocean, Offshore and Arctic Engineering. American Society of Mechanical Engineers, Trondheim, Norway, 25–30 June 2017. [Google Scholar] [CrossRef]
- Koopman, R.; Ermak, D. Lessons learned from LNG safety research. J. Hazard. Mater. 2007, 140, 412–428. [Google Scholar] [CrossRef] [PubMed]
- Melhem, G.; Saraf, S.; Ozog, H. Understanding LNG Rapid Phase Transitions (RPT); An ioMosaic Corporation Whitepaper: Houston, TX, USA, 2006. [Google Scholar]
- Cleaver, P.; Humphreys, C.; Gabillard, M.; Nédelka, D.; Heiersted, R.; Dahlsveen, J. Rapid Phase Transition of LNG. In Proceedings of the 12th International Conference on Liquefied Natural Gas, Barcelona, Spain, 24–27 April 1998. [Google Scholar]
- ABS Consulting. Consequence Assessment Methods for Incidents Involving Releases from Liquefied Natural Gas Carriers; Technical Report GEMS 1288209; Federal Energy Regulatory Commission: Washington, DC, USA, 2004. [Google Scholar]
- Hightower, M.; Gritzo, L.; Luketa-Hanlin, A.; Covan, J.; Tieszen, S.; Wellman, G.; Irwin, M.; Kaneshige, M.; Melof, B.; Morrow, C.; et al. Guidance on Risk Analysis and Safety Implications of a Large Liquified Natural Gas (LNG) Spill Over Water; Technical Report SAND2004-6258; Sandia National Laboratories: Albuquerque, NM, USA, 2004. [Google Scholar]
- Wikipedia. TNT Equivalent. Available online: https://en.wikipedia.org/wiki/TNT_equivalent (accessed on 26 July 2021).
- Ustolin, F.; Odsæter, L.; Reigstad, G.; Skarsvåg, H.; Paltrinieri, N. Theories and Mechanism of Rapid Phase Transition. Chem. Eng. Trans. 2020, 82, 253–258. [Google Scholar]
- Aursand, E.; Odsæter, L.H.; Skarsvåg, H.; Reigstad, G.; Ustolin, F.; Paltrinieri, N. Risk and Consequences of Rapid Phase Transition for Liquid Hydrogen. In Proceedings of the 30th European Safety and Reliability Conference and the 15th Probabilistic Safety Assessment and Management Conference, Venice, Italy, 21–26 June 2020; Baraldi, B., Di Maio, F., Zio, E., Eds.; Research Publishing: Singapore, 2020. [Google Scholar]
- Wang, L.; Li, Y.; Zhang, F.; Xie, F.; Ma, Y. Correlations for calculating heat transfer of hydrogen pool boiling. Int. J. Hydrog. Energy 2016, 41, 17118–17131. [Google Scholar] [CrossRef]
- Sciance, C.T. Pool Boiling Heat Transfer to Liquefied Hydrocarbon Gases. Ph.D. Thesis, The University of Oklahoma, Norman, OK, USA, 1966. [Google Scholar]
- Lervåg, K.Y.; Skarsvåg, H.L.; Aursand, E.; Ouassou, J.A.; Hammer, M.; Reigstad, G.; Ervik, Å.; Fyhn, E.H.; Gjennestad, M.A.; Aursand, P.; et al. A combined fluid-dynamic and thermodynamic model to predict the onset of rapid phase transitions in LNG spills. J. Loss Prev. Process. Ind. 2021, 69, 104354. [Google Scholar] [CrossRef]
- Fay, J. Spread of large LNG pools on the sea. J. Hazard. Mater. 2007, 140, 541–551. [Google Scholar] [CrossRef]
- Bøe, R. Pool boiling of hydrocarbon mixtures on water. Int. J. Heat Mass Transf. 1998, 41, 1003–1011. [Google Scholar] [CrossRef]
- Spiegler, P.; Hopenfeld, J.; Silberberg, M.; Bumpus, C.F.; Norman, A. Onset of stable film boiling and the foam limit. Int. J. Heat Mass Transf. 1963, 6, 987–989. [Google Scholar] [CrossRef]
- Aursand, E.; Davis, S.H.; Ytrehus, T. Thermocapillary instability as a mechanism for film boiling collapse. J. Fluid Mech. 2018, 852, 283–312. [Google Scholar] [CrossRef] [Green Version]
- Aursand, E.; Hammer, M. Predicting triggering and consequence of delayed LNG RPT. J. Loss Prev. Process. Ind. 2018, 55, 124–133. [Google Scholar] [CrossRef]
- Wilhelmsen, Ø.; Aasen, A.; Skaugen, G.; Aursand, P.; Austegard, A.; Aursand, E.; Gjennestad, M.; Lund, H.; Linga, G.; Hammer, M. Thermodynamic Modeling with Equations of State: Present Challenges with Established Methods. Ind. Eng. Chem. Res. 2017, 56, 3503–3515. [Google Scholar] [CrossRef]
- Hammer, M.; Aasen, A.; Wilhelmsen, O. Thermopack. 2020. Available online: https://github.com/SINTEF/thermopack/ (accessed on 4 August 2021).
- Michelsen, M.L.; Mollerup, J.M. Thermodynamic Models: Fundamentals and Computational Aspects, 2nd ed.; Tie-Line Publictions: Holte, Denmark, 2007. [Google Scholar]
- Leachman, J.W.; Jacobsen, R.T.; Penoncello, S.; Lemmon, E.W. Fundamental equations of state for parahydrogen, normal hydrogen, and orthohydrogen. J. Phys. Chem. Ref. Data 2009, 38, 721–748. [Google Scholar] [CrossRef]
- Nasrifar, K. Comparative study of eleven equations of state in predicting the thermodynamic properties of hydrogen. Int. J. Hydrog. Energy 2010, 35, 3802–3811. [Google Scholar] [CrossRef]
- Department of Energy USA. Liquified Natural Gas: Understanding the Basic Facts. 2013. Available online: https://www.energy.gov/sites/prod/files/2013/04/f0/LNG_primerupd.pdf (accessed on 4 August 2021).
- Younglove, B.; Ely, J. Thermophysical Properties of Fluids. II. Methane, Ethane, Propane, Isobutane, and Normal Butane. J. Phys. Chem. Ref. Data 1987, 16, 577. [Google Scholar] [CrossRef]
- Bang, K.H.; Corradini, M.L. Vapor explosions in a stratified geometry. Nucl. Sci. Eng. 1991, 108, 88–108. [Google Scholar] [CrossRef]
- Anderson, R.P.; Armstrong, D.R. Experimental study of vapor explosions. In Proceedings of the LNG-3 Conference, Washington, DC, USA, 24–28 September 1972. [Google Scholar]
- Archakositt, U.; Nilsuwankosit, S.; Sumitra, T. Effect of volumetric ratio and injection pressure on water-liquid nitrogen interaction. J. Nucl. Sci. Technol. 2004, 41, 432–439. [Google Scholar] [CrossRef]
- Zhang, B.; Zhang, X.D.; Wu, W.Q. Experimental study on cryogen injection into water. Appl. Ecol. Environ. Res. 2017, 15, 441–456. [Google Scholar] [CrossRef]
- Verfondern, K.; Dienhart, B. Pool spreading and vaporization of liquid hydrogen. Int. J. Hydrog. Energy 2007, 32, 2106–2117. [Google Scholar] [CrossRef]


Publisher’s Note: MDPI stays neutral with regard to jurisdictional claims in published maps and institutional affiliations. |
© 2021 by the authors. Licensee MDPI, Basel, Switzerland. This article is an open access article distributed under the terms and conditions of the Creative Commons Attribution (CC BY) license (https://creativecommons.org/licenses/by/4.0/).