Abstract
Only recently, smart cities are taking shape, thanks to the rapid development of Internet of Things (IoT), cloud computing, and other similar technologies. Given the high demands placed on advanced technologies such as autonomous driving, cloud data services, and high-precision sensors, smart cities are creating an intelligent transportation environment conducive to the introduction of autonomous vehicles (AVs). In this context, the use of AVs in transportation is also considered a form of transportation innovation. As a result, AVs are considered more favorable to people interested in new technologies because they appear to be technologically superior. Their association with the most up-to-date technology can serve as a symbol for those who wish to demonstrate their interest in new technologies through their appearance. The positive image of technological innovation projected by AVs may influence their acceptance among technology enthusiasts to a significant degree. In this context, this study investigates the effects of perceived advantage, perceived risk, and perceived safety on the intention to use autonomous vehicles. For this purpose, data were collected from vehicle users living in Turkey by survey method. Secondly, factor analyses and regression analyses were performed with the data set obtained from 611 participants. As a result of the analyses, it has been determined that the perceived advantage and perceived security increase the intention to use autonomous vehicles. In contrast, the perceived risk reduces this intention to use. According to these results, recommendations were made to the companies about the level of acceptance of this technology by the users to assess their investments in autonomous vehicles better.
1. Introduction
AVs will become part of our roadways soon, much as the vehicle’s introduction did, and this will significantly transform how we get around in cities. At this point, it is unclear what the future will look like. AVs are expected to deliver several benefits, such as fewer traffic accidents, fewer vehicle maintenance costs, lower fuel prices, and less pollution [1]. The transportation sector is currently in a state of fast transition in this direction. An increasing number of studies are being conducted on the expected user response to the growing number of AV trials worldwide [2]. Because of this, it is predicted that autonomous vehicles will have a significant impact on future transportation systems and hence will garner much attention [3].
In order to meet the complex demands of today’s society, cities must utilize a broad range of technological innovations in conjunction with multiple functional elements. There are numerous cities nowadays that are making efforts to attain sustainability and intelligence. The smart city system is developing quickly due to many Internet of Things, cloud computing, and other technologies. To support the implementation of AVs, smart cities promote an intelligent transportation environment that incorporates autonomous driving, cloud data services, and high-precision sensors [4]. It integrates a range of environmental, social, and economic initiatives to increase human capital while also reducing environmental impacts and resolving ecological emergencies. Specific factors relating to transportation supply and demand and the size of the city play a significant role in city development [5]. On the other hand, AVs will enhance road safety, help combat carbon emissions, and decrease travel times to meet smart cities’ standards [6]. Since companies are also a part of social life and play a role in urban development, they closely follow technological developments and engage in innovative activities [7]. While technological breakthroughs and innovations have risen to prominence as the driver of sustainable urban development, recent years have seen a relative decrease in their influence [8]. More specifically, they are regarded as a sort of transportation innovation in this context [9]. When considered together, this indicates that individuals interested in newer technology will regard AVs as superior, as the instruments will appear to be technically impressive.
Such people use new technologies as a symbol of their interest in them. AVs portray an image of technological advancement that reflects how consumers would adopt new technology, and the results of the study by Bennett et al. (2019) [10] show that these images can impact adoption by technology enthusiasts. The TAM (Theory of Action Model) uses beliefs and attitudes to explore how people’s intentions to perform behaviors are intertwined. TAM holds that two beliefs, perceived utility and perceived ease of use, influence people’s intention to utilize technology [11]. Traffic accidents, traffic delays, and the additional time spent in the vehicle all contribute to reducing the quality of life in the cities. Innovative vehicles, which are viewed as technology advancements, can considerably cut down on these issues. An AV can carry out numerous technologies and sensors to arrive at a predefined destination without human interaction [12]. It may encourage those who are interested in cutting-edge technology to regard vehicles with AVs as applicable. AVs have a favorable influence on those who are technologically aware because they represent an image of technical innovation that benefits the general population. It suggests that those willing to adopt new technology early will be more comfortable and secure when using AVs [13].
Conversely, technology anxiety negatively impacts perceived ease of use because users’ fears may overshadow the advantages of technology. Individuals with higher levels of technology anxiety will find it challenging to evaluate the benefits of new technology objectively. As a result, they will be more reluctant to learn how to operate new technology and generally adopt a more negative attitude, refusing to acknowledge its benefits [14].
Consumers who search for pleasure seek fresh, varied, and complicated events that provide a high degree of sensationalism. They are more likely to accept the innovations and risks of self-driving automobiles due to their willingness to take risks [15].
As global warming and governments’ environmental policies go hand in hand, the significance of environmentally friendly technologies has increased [16]. Reducing the usage of cars, dealing with traffic congestion, fighting global warming, and conserving resources by limiting mobility is a vital component to building sustainable urban futures. More people will use electricity to fuel personal vehicles and public transportation [8]. Autonomous cars will have a significant impact on the environment, especially greenhouse gas emissions and fuel economy. People concerned about the environment can benefit from this characteristic [4].
Especially during the pandemic period, people started to prefer personal vehicles more as a mode of transportation. Before the pandemic, personal vehicles were preferred for more comfortable and convenient travel opportunities [17]. As a result of the pandemic, local governments and public transport agencies have been left with no choice but to redesign their travel systems for the future by using new paradigms and new strategies. There has been a 50% reduction in the carrying capacity of buses, trams, trains, and similar land vehicles. It has also reduced the number of trips and created some regions that are difficult to access. These constant cleanings and social distancing have impacted all modes of transportation [18]. This situation changed the transportation preferences of the users and led them to prefer autonomous systems where human contact is minimized [19]. This preference may be to reduce the risk of transmission of the virus by providing social distance and obtaining more hygienic travel opportunities. At this point, the importance of AVs emerges once again, because AVs can enable people to travel safely, with a minimum of human error and a maximum of social distance.
This study focuses on AVs that can become a certainty in our future and investigates three perspectives that we believe will impact the intention of users to utilize AVs. Perceived benefit, perceived risk, and perceived safety are the three types of perceptions to consider. Customers believe that AVs are more beneficial technologies than conventional tools encourage them to use these systems. As with any innovative action, there may be positive and negative responses, and customers may be wary of some of the risks associated with AVs, which is understandable. The usage of AVs will be discouraged if consumers believe the risks outweigh the benefit. Users will also choose to utilize these vehicles if they have confidence in the safety provided by AVs.
Section 2 of this study provides with a review of pertinent literature. Following that, Section 3 discusses the materials and procedures. Then, in Section 4, the survey analysis’s findings are described. Finally, the Section 5 discusses the study’s findings, and the conclusion in Section 6 summarizes our major findings.
2. Literature Review and Establishment of Research Hypotheses
Rapid innovation is commonplace in the automotive business, just like in many other industrial sectors. Artificial intelligence, the Internet of Things, robots, and autonomous production have made much progress with Industry 4.0, specifically. The Internet of Things (IoT) uses web technologies to connect with and control robots. Implementing this type of robotic control does not require programming because it is performed through learning algorithms and cognitive decision making. A new industrial environment where intelligent, autonomous machines work together with powerful predictive analytics and machine–human communication to boost productivity, efficiency, and dependability is known as the Internet of Things [20]. Autonomous programmable systems that employ robotics and machine learning are further enabled in this environment [21]. According to its definition, the Internet of Things is expansive. A few of the most popular IoT systems applications include intelligent industrial, smart city, smart building, smart home, intelligent transportation, healthcare, vehicle, and wearable devices [22].
An impressive number of novelties have emerged in the motor sector thus far. A simple sensor can identify whether the car is cornering too quickly, automatically activating the Electronic Stability Control (ESP) system. Examples of systems advancements that work automatically outside the drivers’ control include automatic lane tracking systems, autonomous braking systems that detect the vehicle’s speed in front, and more. It is different, though, from other systems of self-driving technology since the driver relinquishes control of the car entirely. Nevertheless, self-driving vehicles with artificial intelligence can learn without external guidance [23]. It is a perfect replica of human intelligence. It analyzes data and incorporates that information to create a comprehensive descriptive, predictive, or prescriptive analysis of that data [24]. AVs can be utilized in air, sea, and rail transportation, and they can even be operated on the road. Airships, which are utilized in military defense, are another excellent example [25]. Additionally, our study will have restrictions on modes of transportation used on the roadway to affect daily life.
AVs are in a prevalent position thanks to their automatic control systems that reduce the need for the human factor. AVs can provide unmanned driving by sensing conditions such as road, traffic situation, and environment thanks to these automatic control systems [26].
The working cycle of AVs starts with receiving information from internal and external sensors. While internal sensors determine the vehicle’s orientation, such as skidding and yaw, by controlling the speed and acceleration of the vehicle, external sensors determine its localization according to the external environment. The raw data from the sensors is interpreted during the detection phase, and meaningful information is generated about the vehicle’s location, road, and existing obstacles [27].
The International Society of Automotive Engineers (SAE) has offered six levels to assess the degree to which a vehicle has self-driving capabilities. The report was developed on 16 January 2014 and revised on 3 April 2021. According to the report, these levels are as follows [28]:
- Level 0: represents traditional vehicles fully controlled by a driver.
- Level 1: The driver and the system collaborate on specific functions, such as adaptive cruise control and parking assistance.
- Level 2: While the system manages acceleration, braking, and steering, the driver must monitor the process and be prepared to take over in a system failure. At this technological level, the driver must constantly grasp the driving process in order to conduct interventions.
- Level 3: The driver can read, write, or rest while driving, but a significant issue is that the driver must take control if automatic functions fail or the vehicle cannot cope with complex traffic situations.
- Level 4: At this level, the driver can sit or sleep in the passenger seat. At the same time, the vehicle provides all the necessary operations of driving control without the need for human intervention. The driver can handle and steer the vehicle by hand, at his or her request, or with system malfunctions, but the car can drive itself in general.
- Level 5: Human participation is no longer needed. A possible example is a robotic vehicle. In other words, we can talk about a fully autonomous vehicle. Vehicles at this level are robots that can transport passengers and goods independently.
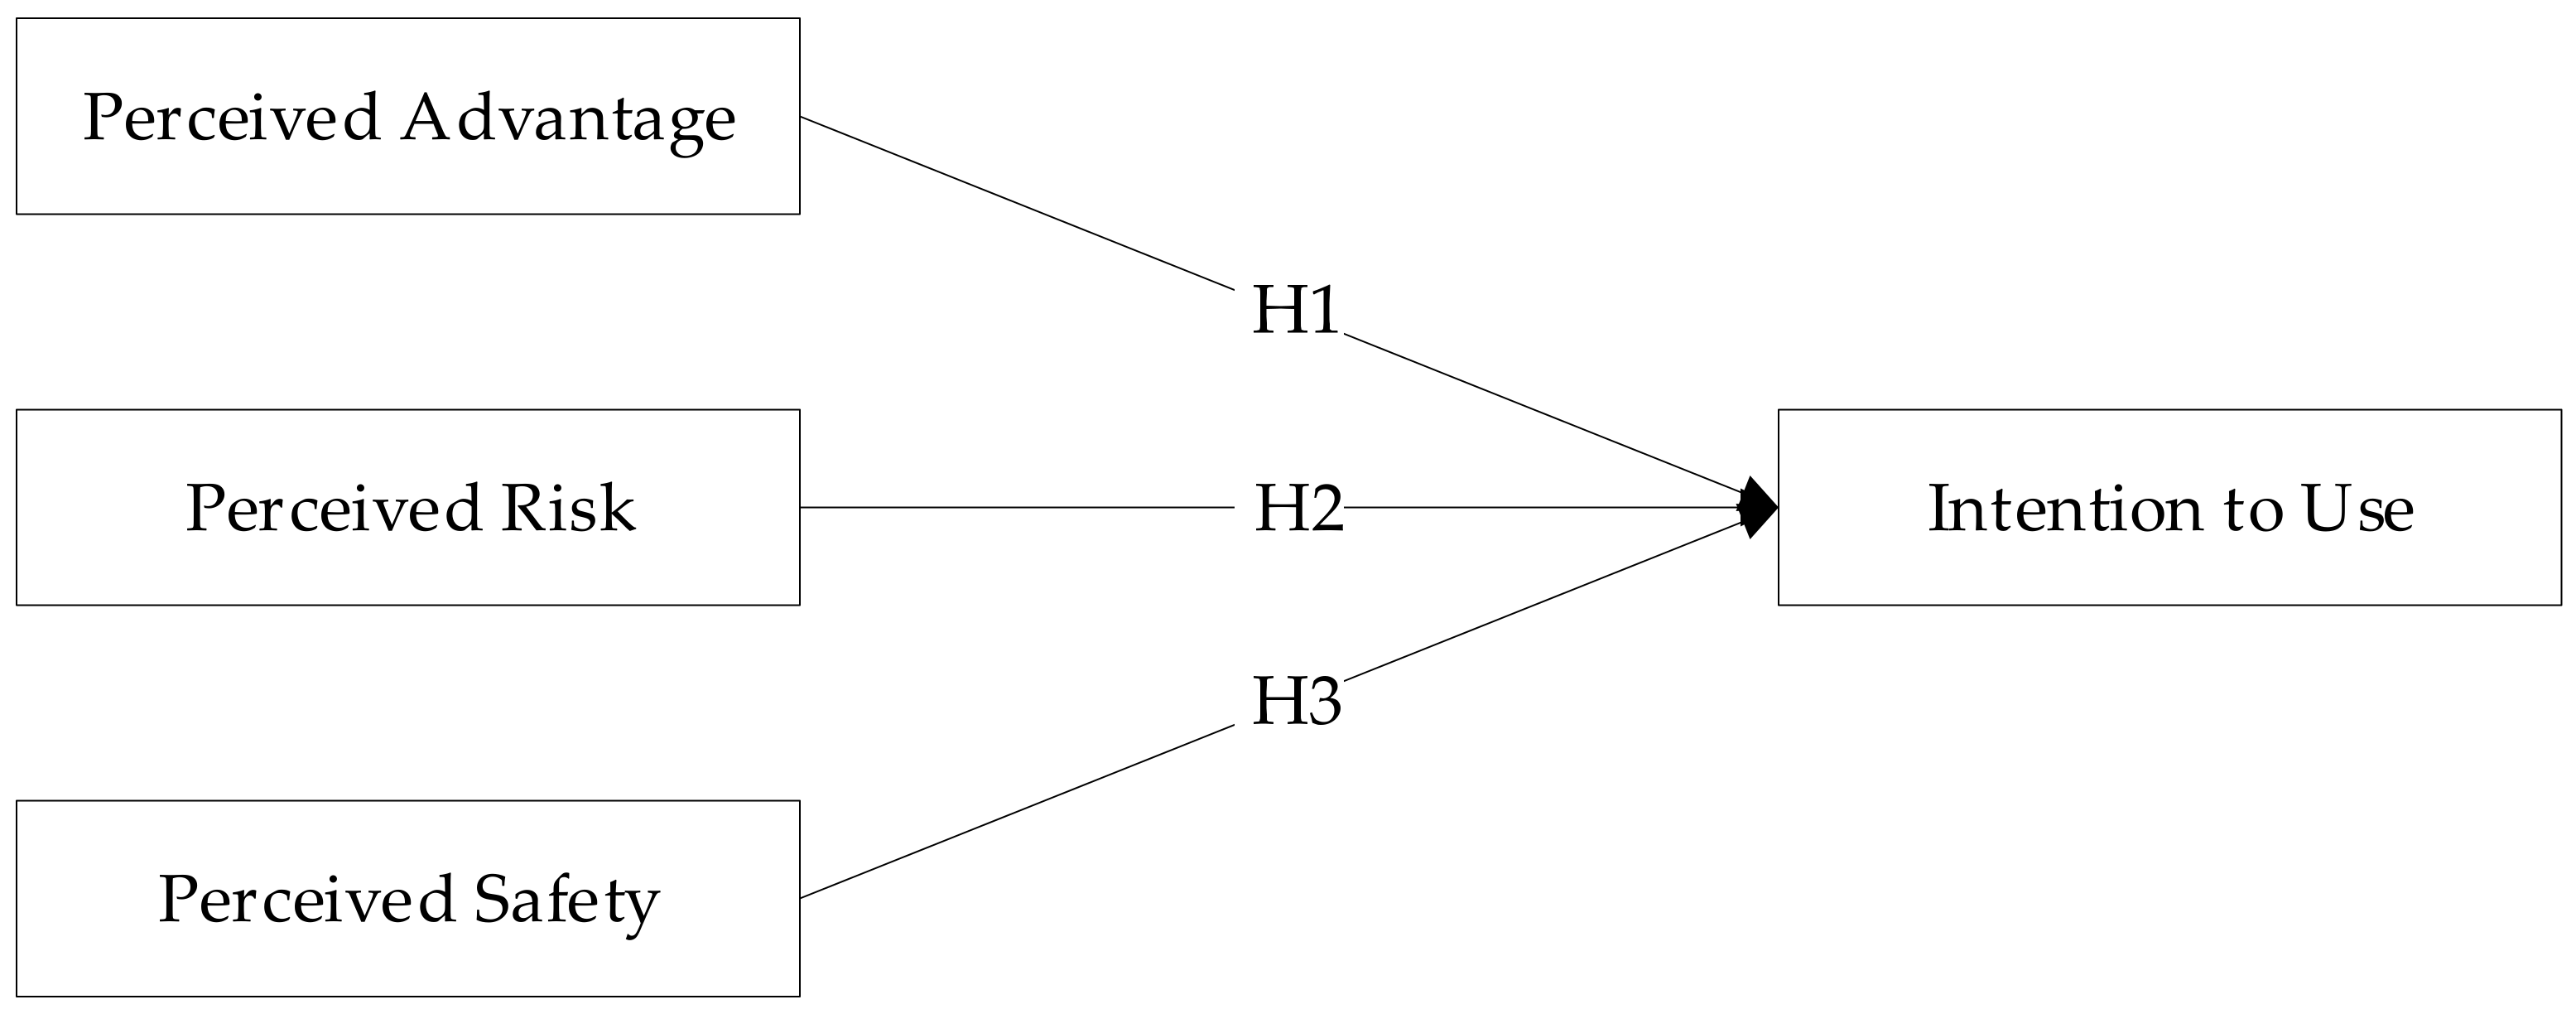
- The research model is given in Figure 1.
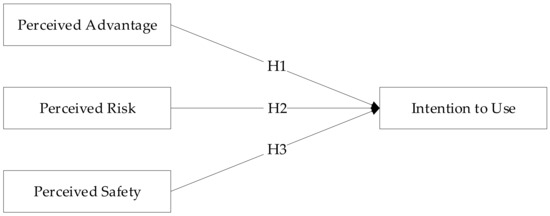 Figure 1. Research Model.
2.1. Perceived Advantage
The successful use of autonomous vehicles will have a significant impact on human life. It will bring more comfortable and more accessible driving experiences for people [29]. With AVs, drivers do not need to drive or sit behind the wheel all the time, and thus the driver has free time to perform non-driving activities [30].
The second pillar of new technology adoption is perceived ease of use, which refers to the effort necessary to operate a system. When a system is simple to use, the effort required to master it is minimal. As a result, individuals gravitate toward technologies that demand the least amount of work. For AVs, this means that if they are perceived as easier to use than existing alternatives, people will be more willing to adopt them. Therefore, individuals may consider adopting AVs if they can master them [14]. Furthermore, based on the user’s perception of having no barriers to using an AV, i.e., high ease of use, the user will perceive low risk and decide whether to use the AV. In addition, it is thought that the perception of benefit, lower risk for AVs compared to traditional tools, higher comfort, and innovation perception will be effective in the adoption of vehicles [31].
It is believed that relative advantage may correlate favorably with perceived utility and inclination to employ autonomous vehicles [32]. In addition, according to the Technology acceptance model, the easier a system is to use, the higher the perceived usefulness. It means that consumers who can drive an autonomous vehicle will better understand its functions and benefits [14]. In general, lower perception of risk and a higher perception of benefit are positive predictors of greater acceptance of technologies. For example, it was observed that perceived usefulness was a positive indicator of participants’ willingness to drive autonomously. Perceived usefulness was also a positive predictor of self-driving car acceptance [33].
Although humans can gather environmental information more efficiently than AVs using high-sensitivity sensors, AVs can accomplish this task using higher-sensitivity sensors. While AVs could help prevent some of the usual driving mistakes people make, such as weariness, inefficiency, and risky driving, this outcome is by no means guaranteed. AVs are expected to provide a viable alternative to traditional transportation solutions such as traffic safety, efficiency, and environmental impact [34]. By minimizing driver errors, autonomous vehicles can eliminate 90% of traffic accidents. AVs can increase fuel economy by lowering vehicle ownership and parking space and boosting road capacity. Because AVs do not require human input, they allow passengers to focus on their work while on the go. They can also help to give movement to those who are elderly or disabled [35]. People often talk about the benefits of AVs, including helping the environment by reducing greenhouse gas emissions, easing traffic congestion, and improving road safety. They also show the ability to cut travel expenses and better accessibility and provide more mobility options for those who do not have driving licenses [3]. AVs can make traveling more accessible and less stressful in certain conditions, including night trips, bad weather, and long journeys because these vehicles do not have to drive under harsh conditions [36]. AVs will also make it easier for drunk people to drive [12]. It is also predicted that the transition to autonomous technology will reduce traffic congestion [37]. Furthermore, AVs improve users’ experience by providing more comfortable driving thanks to smoother braking and acceleration. It also allows users to participate in other related activities on their way to their destination, freeing up their time initially allocated to driving. It is also noted that AVs are more energy-efficient than conventional vehicles. These reduce congestion, pollution, and free parking for commercial or recreational use [38].
Panagiotopoulos and Dimitrakopoulos (2018) [39] examined how consumers plan to use autonomous vehicles in the future by using an adaptation of the original Technology Acceptance Model (TAM). Additionally, how people view the utility, convenience of use, trust, and social influence regarding autonomous vehicles impact their behavioral intentions. This study indicated that perceived utility was the most critical factor in people’s intent to use autonomous vehicles. Acheampong et al. (2019) [40] discovered that people who have positive feelings about the environment tend to utilize public transit and share autonomous vehicles more, while those who do not care about the environment are less likely to do so. There were signs in the survey that electricity and hybrid energy sources such as hybrids were used in conjunction with autonomous vehicles. Many people have pro-environmental attitudes, which may be why their choice of fuel sources is less polluting [8].
Therefore, the following hypothesis has been formed:
Hypotesis 1 (H1).
The perceived advantage of autonomous vehicles positively affects the intention to use them.
2.2. Perceived Risk
Perceived risk is crucial because it influences consumers’ desire to buy. Individuals may not feel comfortable using AVs because of their perceived risk. Additionally, market research studies on AVs reveal that risk-related issues are critical to the acceptance of AVs [41]. The perceived risk in AVs is primarily evaluated due to system errors because users have almost no responsibility for accidents that occur while driving [31]. The decision to use or not use an automated technology is greatly influenced by perceived risk. It all depends on how likely a person thinks an undesirable event will occur. Drivers feel that AVs will operate in a predictable manner, which reduces the perceived danger in a potential accident [11]. People do not use AVs if they do not trust them. There is some evidence to suggest that trust may alter the intention of AV users by influencing their risk perception, perceived benefit, or perceived safety [42].
People place a great deal of importance on safety when purchasing a vehicle. Jing et al. (2020) [4] found that participants perceive autonomous vehicles as riskier than human-driven vehicles. As a result, it was discovered that participants were more accepting of vehicles that offered manual driving options than those that featured complete automatic transmission. Further, they found that individuals are deeply concerned about the safety of AVs. The most important reason for this is that AVs are perceived as risky.
Once powered up, AVs will operate without human intervention, using computerized systems to gather information about the environment, identify routes and hazards, and guide the vehicle’s control functions such as acceleration and steering based on this information. Thus, despite not needing a human driver, AVs’ passengers would become passengers who could face some identified significant risky situations without theoretically posing a threat to themselves or others. It should be noted here that AVs will not altogether remove the human element from driving because people will be the ones who write the code that develops the algorithms of AVs and controls them. Therefore, human error can still cause collisions and casualties, albeit at a potentially lower incidence rate [43]. This situation may cause AVs to be perceived as risky by people.
Respondents to the Zandieh & Acheampong (2021) [36] study cited safety as a significant concern in AV use. They have seen potential safety risks for themselves as both passengers and pedestrians interacting with AVs on the street. They were concerned that autonomous driving technologies might fail to recognize and cope with all conditions and situations on the road. Other concerns raised by respondents include unexpected technological failures, unforeseen issues not addressed in security tests, and poor performance of certain parts of the tool or software. Concerns about vehicle-to-human communication were also reported due to the research. These findings also point to perceived risk.
Therefore, the following hypothesis has been formed:
Hypotesis 2 (H2).
The perceived risk of autonomous vehicles significantly affects the intention to use them.
2.3. Perceived Safety
Driving safety is today’s road vehicles’ primary requirement. It may be achieved by creating and implementing easy-to-use systems with the least amount of decision-making error. Driving task performance is one of the most critical AV components [44]. Therefore, it is imperative to present accurate, stable, and reliable navigation information to keep AVs safe [29]. Although the previous study reports that human errors and bad decisions are the significant causes of traffic accidents, automated vehicles are shown to be safer choices than their traditional counterparts. Reducing the risk of car collisions can increase the safety of roadways. Some AVs use trustworthy technologies such as radar (Radio Detection and Ranging), Global Positioning System (GPS), infrared sensor, and computer vision to circumvent human perceptions and reflexes [9]. A revolution in ground transportation is possible due to the advances in AVs. Reduced collisions and related injuries and deaths, smoother travel, enhanced traffic management, and increased productivity are among the expected economic and societal benefits to be obtained from these cars [45]. In order to reduce accidents resulting from driver mistakes, AVs have been offered as an effective and growing option [46]. Human error resulting from exhaustion, disruption while driving, and environmental factors are projected to be reduced by AVs [38].
In autonomous driving, the control authority is transferred to vehicles; therefore, trust is an essential issue for autonomous vehicle users [47]. Like people’s social interactions, trust is essential in human-automation interaction. Similarly, reliance on information and computer technologies was effective in predicting behavioral intention and willingness to use. Concerning AVs, trust in AV was accepted as one of the most critical determinants of intention to use it [33]. It is also linked to perceived benefit because AV technology will potentially eliminate accidents involving human error such as speeding, looking back, distraction, drowsiness, etc. Therefore, safety is often touted as the primary benefit [37].
The trustworthiness of emerging technologies has been shown repeatedly in various sectors, especially concerning their adoption. Studies on automation have often been observed that trust is a critical component in people’s willingness to adopt technology [11]. Traffic accidents are reduced with AV technology because it avoids excessive braking, minimizes wasteful braking, and, most importantly, provides a better solution for road safety, traffic congestion, and energy consumption [41]. Highly reliable automation is likely to boost drivers’ confidence levels [48]. In their study, Choi and Ji (2015) [11] discovered that trust influences users’ intentions to drive autonomous vehicles.
AVs can save fuel due to their ability to optimize routes and perform smoother braking and acceleration. As a result of the above functions, AVs can also offer users greater comfort and shorter journey times [38].
Therefore, the following hypothesis has been formed:
Hypotesis 3 (H3).
The perceived safety of autonomous vehicles significantly affects the intention to use them.
The literature emphasizes that all three independent variables of the research are related to each other. For example, although perceived safety seems to describe the reduction of accidents [40] and therefore the increase in life safety [49] at first glance, potential accidents will have heavy costs that will force third parties such as maintenance and insurance [50]. Therefore, perceived security becomes indirectly related to the perception of advantage [9]. In addition, perceived advantage in the literature is accepted as an antecedent of ease of use. When users see autonomous vehicles as easy-to-use vehicles, the risk they perceive against this technology also decreases [31].
3. Materials and Methods
3.1. Sample and Data Collection
The sample of the study consists of adults aged 18 and over residing in Turkey. The sample of the study consists of 611 people reached by the convenience sampling method. Research data were collected between May 2021 and June 2021 with an online questionnaire. The questionnaire form was shared on social media platforms (Facebook, Instagram, Twitter, etc.). In the first two weeks, 396 participants answered the questionnaire. Afterwards, the posts were renewed and a total of 636 answers were obtained, but it was determined that 25 questionnaires were filled ambiguously and these were not included in the analysis.
3.2. Measurement Instrument
The questionnaire used in the study consisted of 2 parts; the first part included questions about some demographic characteristics of the participants. In the second part (see Appendix A, Table A1), there are questions to measure research variables Perceived Advantage (ADV), Perceived Risk (PR), Perceived Safety (PS), and Intention to Use (ITU) on a 1–5 Likert scale. It asked to informants to indicate their degree of agreement with statements (1—strongly disagree, 3—neither agree nor disagree, and 5—strongly agree). The questionnaire was adopted from the studies listed below to measure four variables:
- Perceived Advantage (ADV); adopted from Acheampong & Cugurullo (2019) [40], Yuen et al. (2020) [9], and Yuen et al. (2020) [35], and based on eleven items.
- Perceived Risk (PR); adopted from Lee et al. (2019) [31], and based on four items.
- Perceived Safety (PS); adopted from Lijarcio et al. (2019) [49] and Acheampong & Cugurullo (2019) [40], and based on six items.
- Intention to use (ITU); adopted from Lijarcio et al. (2019) [49] and Yuen et al. (2020) [35] and based on nine items.
3.3. Data Analysis
The analysis in this study consisted of two stages.
In the first stage, the scales’ construct validity and reliability were verified. To reach this conclusion, exploratory and confirmatory factor analysis was applied. The Kaiser–Meyer–Oklin (KMO) and Bartlett’s sphericity tests were conducted to determine whether the observations were appropriate for factor analysis. KMO value can have a value between 0 and 1; it is interpreted as usual between 0.5 and 0.7, good between 0.7 and 0.8, very good between 0.8 and 0.9, and excellent if it is above 0.9. If Bartlett’s sphericity test is significant, the sample size is good, and the correlation matrix is suitable for factor analysis [51]. Confirmatory factor analysis (CFA) was used to confirm the measurement tool. CFA is a technique for determining how effectively measured items represent a set of predefined constructs and for specifying which items load on those constructs [52]. The composite reliability of the factors and the variance (AVE) explained by them were calculated [53]. It is acceptable for structural reliability when the structure value is more than 0.70 [54], and the explained variance is 0.40 and more [55].
Additionally, skewness and kurtosis values were examined to ensure that the data were normally distributed. To test the constructs’ reliability and validity, we used confirmatory factor analysis (CFA). We utilized four tests to determine the reflective constructs’ convergent validity and internal consistency: item loading, Cronbach’s alpha, composite reliability (CR), and average variance extracted (AVE) [56].
The analysis was carried out in the second stage with the structural equation model established to test the hypotheses. Structural equation modeling (SEM) is a statistical method that enables the measurement of complex models applied in different disciplines and compares alternative models and has been used predominantly in recent studies. SEM consists of a system of linear equations. The main thing in regression analysis is determining how much of the change in the dependent variable is explained by the independent variable/variables [57]. One of SEM’s most critical advantages over other methods is that it effectively takes measurement errors into account in the analysis. Another advantage is that it is a statistical method in which the direct and indirect effects of structures in multiple relationships on each other can be measured clearly.
Additionally, SEM gives highly accurate statistical assessments for convergent validity, discriminant validity, and dependability of a construct [53]. The total model fit was evaluated (using indices from multiple families of fit criteria: 2 and normalized fit 2, root mean square residual (RMR), root mean square error of approximation (RMSEA), and goodness-of-fit index (GFI)). We examined these structural regression coefficients to determine whether the stated hypotheses were supported [58,59].
4. Results
The demographic characteristics of the participants are shown in Table 1. As shown in the table, 56.1% of the participants are female, and 43.9% are male. More than two-thirds (~66.7%) of the participants are between the ages of 26–45, and more than half (55.6%) have a university education or higher.

Table 1.
Demographic Characteristics.
Before testing the research model, the construct validity and reliability of the scales were tested. The Kaiser–Meyer–Olkin (KMO) value shows the proportion of the common variance related to the latent structure of the variables. It should be as large as possible for sampling adequacy (>0.70) [53]. After that, the construct validity and reliability of the scales used in the research were tested. For this purpose, exploratory and confirmatory factor analysis and reliability analysis were performed. The exploratory factor analysis (EFA) findings of the scales are shown in Table 2.
Table 2.
Exploratory Factor Analysis.
As a result of exploratory factor analysis, factor loads of the scales were obtained above 0.50. The KMO value was above 0.70. The Barlett test of sphericity was obtained as significant. This finding means that the sample size is sufficient for factor analysis. All scales explain the total variance over 50%. The kurtosis and skewness values for the scales were determined between −2 and +2. This finding also shows that the data have a normal distribution [58]. The third (A driverless/automated vehicle may be not ““““smart”””” enough for guaranteeing my safety during the journey) and fourth (AV-related systems could easily break down, or be hacked, thus compromising my safety) items of perceived safety and the fourth (I am totally against the option of buying an autonomous car) item of intention to use were excluded for further analyses because their factor loads were low. Since these are reverse items, they may not be sufficiently understood by the participants. However, other items are thought to explain the variables adequately.
After exploratory factor analysis, confirmatory factor analysis (CFA) was performed for the scales. The goodness of fit values obtained as a result of confirmatory factor analysis is shown in Table 3.
Table 3.
CFA Goodness of Fit.
As a result of CFA, it was found that the scales met the acceptable goodness of fit criteria.
Reliability analysis was performed for the scales after EFA and CFA. The alpha coefficient and AVE (Average Variance Extracted) and CR (Composite Reliability) values obtained from the reliability analysis are given in Table 4.
Table 4.
Validity and Reliability.
As a result of the reliability analysis, alpha coefficients were obtained above 0.70. This finding shows that the scales are reliable. AVEs were above 0.50, excluding the advantage scale, and CR values greater than 0.70 for all scales. The AVE of the advantage scale was found to be 0.46, which is very close to 0.50. These findings also show that the scales have component validity [55].
After the construct validity and reliability tests, correlation analysis was performed in order to determine the direction and strength of the relationship between the variables, before proceeding to the analysis of the structural equation model. Analysis findings are shown in Table 5.
Table 5.
Correlation Analysis.
As a result of the correlation analysis, it is seen that perceived risk has a significant negative relationship with the other three research variables. Although these relationships are significant, they can be considered weak relationships. However, the other three research variables were in a significant positive relationship with each other. In particular, the relationship between perceived advantage and perceived safety may be due to the fact that some users may also perceive safety as an advantage.
After determining that the scales provided construct validity and reliability and correlation analysis, structural equation model analysis was performed to test the research hypotheses. The analyzed model is given in Figure 2.
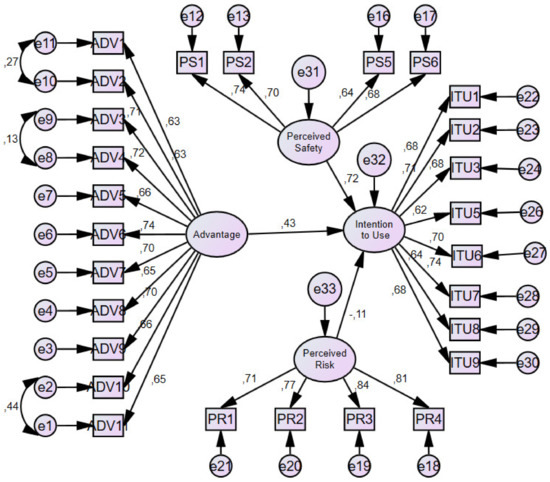
Figure 2.
Structural Equation Model.
The model’s goodness-of-fit values are shown in Table 6.
Table 6.
Research Model’s Goodness of Fit.
It was determined that the model met the acceptable goodness-of-fit criteria. With the GFI and AGFI, values are below the 0.90 level. However, these GFI and AGFI values are still acceptable because they are within the range of 0.80–0.90 recommended by Joreskog and Sorbom (1989) [60]. The analysis results of the model are shown in Table 7.
Table 7.
Analysis Result.
As a result, it has been determined that perceived safety and perceived advantage affect the intention to use positively. Conversely, it has been found that the perceived risk affects the intention to use negatively and significantly. As a result of the analysis, H1, H2, and H3 hypotheses were supported.
Although this study does not have the main goal of trying to compare participants’ sociodemographic characteristics, the following comparisons have been made in order to contribute to the related field. These comparisons were made in terms of four basic sociodemographic characteristics. These characteristics are gender, age, education level, and occupation. In the tests performed, no significant difference was found between the research variables in terms of the genders and occupations of the participants. However, some research variables are significantly different in terms of participants’ ages and educational status (see Appendix B for Table A2 and Table A3).
In order to test whether there is a significant difference according to age, a one-way ANOVA (Analysis of variance) test was performed. As a result of the analysis, it was determined that the perceived advantage and perceived safety differed significantly according to age. When Tukey results were examined, it was found that the perceived advantage differed significantly between the 18–25 age group and the 26–35 and 36–45 age groups. Since the mean value of this difference is higher, it has been found that it is in favor of the 26–35 age group. In other words, those in the 26–35 age group perceive autonomous vehicles as more advantageous. Perceived safety also differs significantly between the 18–25 age group and the 26–35 and 36–45 age groups. The difference is in favor of the 26–35 age group because the mean value is higher. In other words, those in the 26–35 age group have a higher perception of safety regarding autonomous vehicles.
In order to test whether there is a significant difference according to education, a one-way ANOVA test was performed. As a result of the analysis, it was determined that the perceived risk and perceived safety differed significantly according to the education level. According to Tukey results, perceived risk differs significantly between all groups. The difference is in favor of primary school graduates since the mean value is higher. In other words, primary school graduates have more risk perception about autonomous vehicles. Perceived safety, on the other hand, shows a significant difference between doctoral graduates and primary and associate degree graduates. The difference is in favor of doctoral graduates since the mean value is higher. In other words, PhD graduates have a higher perception of safety. Therefore, according to these results, perceived safety related to technology is directly proportional to education.
5. Discussion: Implications and Limitations
5.1. Implications
Autonomous Vehicles are still in their infancy and therefore can only be evaluated to a certain degree. Although there are many autonomous features such as lane-keeping assistants and autonomous cruise control in modern cars, fully autonomous driving in cities is still a concept rather than a reality [61]. Numerous governments have said that by 2040, they want the majority of vehicles on their country’s roadways to be driverless. Thus, manufacturers and the government are tasked with the critical responsibility of promoting positive public sentiment toward AVs and designing transportation infrastructures and systems [10]. Our world will evolve into a world of smart cities, with autonomous vehicles at the forefront of intelligent mobility [62]. Automobiles’ future will be merged with completely autonomous vehicle functions using present technologies.
In this study, we investigated the effects of perceived advantage, perceived risk, and perceived safety on the intention to use autonomous vehicles. Accordingly, we tested three hypotheses and found that all three hypotheses were supported as a result of the analysis. The first hypothesis of our research (H1) is that perceived advantage will increase the intention to use autonomous vehicles. In our analysis, we found that this hypothesis was supported. The idea that autonomous vehicles can shorten transportation times [63], to be an alternative to reduce traffic congestion [64], and to contribute to solving the parking problem in settlements with high vehicle density [65], was perceived by users as important advantages. In addition, other advantages such as increased safety, more efficient road use, energy saving, and a low energy consumption environmental product are also considered by users [14]. In other words, when users think that they will gain some advantages related to autonomous vehicles, their intention to use them increases positively. We state that this finding overlaps with the findings of other studies in the literature [66,67]. Therefore, we can advise manufacturers to consider perceived usefulness and advantage. The perceived usefulness of autonomous technology is a significant driver of consumers’ adoption intentions. Experts claim that self-driving cars, due to their automation and advanced steering capabilities, will benefit people who cannot drive themselves, such as the elderly, the disabled, and the unlicensed [68]. Many failed innovations have already demonstrated how critical it is to understand the value of technology from the consumer’s perspective. To increase perceived usefulness, communication activities should be designed to clarify how a new technological solution creates benefits for its users and the pain points it solves. It can be achieved by highlighting the benefits of an autonomous technology compared to the current (non-autonomous) solution [14].
The second hypothesis of our study (H2) is that perceived risk will negatively affect the intention to use AVs. As a result of the analysis, this hypothesis was also supported. In some cases, users may think that autonomous vehicles cannot perform the required performance. For example, they may think that human-specific intuitive reactions will produce more positive results in difficult driving conditions such as rain, snow, and similar ones. Such difficult driving conditions can be perceived as risks for autonomous vehicles [69]. The risks that may arise in using AVs in the literature are classified under the titles of liability, privacy, cybersecurity, and industry influence [70]. Within the scope of this study, the users’ risk perception was focused and the perceptions of the autonomous system not working were questioned. If users find autonomous vehicles to be risky, their intention to use them is negatively affected, and this result is in line with the studies in the literature [71].
The third hypothesis of the study (H3) suggests that users’ perceived safety will positively affect their intention to use AVs. The analysis has produced results that support this hypothesis. No other industry has had as many fatalities and property losses as the automobile business. According to statistics, someone dies in an automobile accident every 30 s on average. Additionally, 90% of these mishaps are caused by human mistakes. Inadequate vehicle handling is another issue that requires attention. On average, a car is used for less than two hours every day, increasing the cost of ownership of underutilized property. Accidents and insufficient utilization can result in both internal and external costs. As a result, it is past time for serious consideration of automobile ownership and use. The solution to minimizing or eliminating these significant issues is hidden in AV, sometimes referred to as self-driving cars, self-driving vehicles, and robotic vehicles [72].
What we can say about the analyses made on the sociodemographic characteristics of the participants is that it follows that people interested in new technologies view AVs more positively because these tools will appear technically superior, and the association with the latest technology can serve as a symbol for people who want to show their affinity for new technologies. AVs reflect an image of technological innovation that can strongly influence adoption by tech enthusiasts [10]. The young population is more curious about new technology. Therefore, the perceived advantage and perceived safety of autonomous vehicles are expected to be higher in younger participants, because AVs reflect an image of technological innovation that can positively influence the adoption propensity of technology-savvy individuals. It means that enthusiasts are willing to try new technologies before others can perceive greater comfort and security through AVs and are likely to adopt AV early [13].
Conversely, technology anxiety negatively impacts perceived ease of use because users’ fears may overshadow the advantages of technology. Individuals with higher levels of technology anxiety will find it challenging to evaluate the benefits of a new technology objectively. They will be more reluctant to learn how to operate new technology and generally adopt a more negative attitude, refusing to acknowledge its benefits [14]. Therefore, according to the research results, perceived advantage and perceived safety did not differ significantly for the elderly.
AVs use advanced technology. So, it puts education at the forefront. Individuals with a higher education level will be more capable of learning and adapting to new technology. The results of the research show that primary school graduates perceive autonomous vehicles as riskier. This perception, on the other hand, stems from a fear of advanced technology based on education. Decision-makers in AV have direct control over emotional states. Keszey (2020) [15] asserts that sentiments concerning AV have a considerable effect on behavioral intention to use. Trust and anxiety are critical determinants of behavioral intention to use among these characteristics, making it critical to cultivate trust and reduce anxieties through communication. Adopting AVs can significantly reduce the number of traffic accidents involving human drivers, increase mobility of people with disabilities and aging populations, and reduce air pollution, fuel efficiency, etc. [33]. In many places of the world, traffic safety and congestion are serious transportation issues. Driver error continues to be the leading cause of vehicle collisions, and the growing number of private automobiles exacerbates congestion. With advancements in in-vehicle technology, the introduction of AV provides individuals with a more sustainable means of transportation that is alternative, safer, and more environmentally friendly [41]. Users’ potential engagement with AV technology will almost certainly be more potent if the future benefits are suitably combined and if decision-makers provide appropriate and effective solutions for potential users’ safer commuting to boost adoption of such advances [13].
It shows that the computer science and engineering disciplines face a series of technological challenges whose solutions will affect how and how AVs are used. For example, more advanced sensing technologies in the context of severe weather conditions such as snow are currently much needed for AVs to detect potential obstacles [73].
As is the case with other technology items such as cell phones, the technology required for AVs will mature and become more affordable over time. A new transportation system and accompanying transportation infrastructure will emerge to prepare for the impending era of autonomous vehicles, including signaling devices, traffic rules and regulations, traffic hubs, and management strategies such as vehicle-to-vehicle communication. Additionally, security concerns, such as insurance coverage, should be carefully established and prepared [74].
In line with the findings of the study, we can say that: while it is expected that technology will change the usage habits and affect the product variety in the market, thus raising some doubts about user acceptance, it reveals that users will have no difficulty in accepting new technologies that they see as advantageous. For this reason, companies should focus on technological activities in order to achieve higher and sustainable performance and increase their investments in autonomous vehicles by adding features that will provide advantages to users. In addition, issues related to technological anxiety (for example, the system suddenly stops working), which users see as a risk, should be considered during these investments. In order to overcome such problems, companies should carry out literacy activities related to these tools, if necessary.
5.2. Limitations of the Study
We can say the following about the limitations of the study and further research:
The first limitation of this study is that the sample consisted of only participants from Turkey. Since we could not determine a sampling frame, we tried to reach as many users as we could with the convenience sampling method. Thus, we aimed to obtain a sampling frame that could reflect the general characteristics of users in Turkey. Therefore, future research should consider user profiles in other countries.
The second limitation of the study may be the heterogeneity of the sample. Study data were collected online due to the COVID-19 pandemic. The fact that young and middle-aged people mostly use online platforms may have caused heterogeneity in the sample. It is recommended that future studies (especially when the effects of the pandemic disappear) ensure demographic homogeneity by using different sampling and data collection methods and analyze the differences that may arise from demographic characteristics. In addition, advanced technological products such as autonomous vehicles will be of interest to certain income groups due to their high cost. Therefore, it is recommended that future studies include income groups of users as a research variable in their research models.
The third limitation of the study is the study variables themselves. The study focused on perceptions of customer acceptance. Future studies may focus on ease of use, environmentalist attitude, social transformation brought by smart cities, energy efficiency, hedonic and utilitarian value perceptions of users, and enable the efficient development of the relevant field. We also acknowledge the high variability in responses between respondents’ responses. Fourth, this research focused only on user perceptions. Future research is recommended to include the technical dimensions of autonomous vehicles in the research model.
6. Conclusions
Sustainable development requires societies to make extensive use of technology, especially artificial intelligence. Smart cities are beginning to take shape due to the rapid growth of technologies such as the Internet of Things, cloud computing, and other similar ones. Because smart cities place high demands on advanced technologies such as autonomous driving, cloud data services, and high-precision sensors, they foster an intelligent transportation environment that facilitates the emergence of AVs. The use of autonomous vehicles (AVs) in transportation is also considered a form of transportation innovation in this context. Therefore, AVs are thought to be more favorable to people interested in new technologies because they appear to be technologically superior, and the association with the most up-to-date technology can serve as a symbol for those who wish to demonstrate their interest in new technologies. AVs project a positive image of technological innovation, which can significantly impact their adoption among technology enthusiasts. In this context, in recent years, the importance of technological advancements and innovations has come to the fore in searching for sustainable urban development paths, which has inspired and prompted us to conduct this research.
In this study, we investigated the effects of some user perceptions on the intention to use autonomous vehicles. Autonomous vehicles are high-cost technologies. For this reason, companies do not want to lose their productivity while investing in this field. It is estimated that autonomous vehicles will bring significant advantages to cities and human life in sustainability. In order to reveal the conditions under which users would prefer these tools to invest in this technology, we chose the variables of perceived advantage, perceived risk, and perceived safety as user perceptions.
As a result of our analysis, we saw that:
- Perceived advantage positively affects the intention to use;
- Perceived risk negatively affects the intention to use;
- Perceived safety positively affects the intention to use.
In the literature review we made at the beginning of this study, few studies examined autonomous vehicles and user perceptions. There is a continuing need for a review of the subject in the literature. In addition, we could not find a study examining the perspectives of users in Turkey. In this respect, we think that the research model we established in our research is original and we hope that the study will make an important contribution to the literature. We also believe that the findings of the study will benefit all companies that have an investment in this field.
Author Contributions
Conceptualization, Ş.Ç. and I.M.-K.; methodology, B.Y.; software, Ş.Ç.; validation, I.M.-K., B.Y., and R.Č.; formal analysis, B.Y. and R.Č.; investigation, I.M.-K.; resources, Ş.Ç. and R.Č.; data curation, B.Y.; writing—original draft preparation, Ş.Ç.; writing—review and editing, I.M.-K.; visualization, R.Č.; supervision, I.M.-K. All authors have read and agreed to the published version of the manuscript.
Funding
This research received no external funding.
Institutional Review Board Statement
Not applicable.
Informed Consent Statement
Not applicable.
Data Availability Statement
The data of this study is available from the authors upon request.
Conflicts of Interest
The authors declare no conflict of interest.
Appendix A
Table A1.
Measurement instrument.
Table A1.
Measurement instrument.
| Perceived Advantage | |
| 1 | AVs would reduce my travel time compared with other methods of transportation. (Yuen et al. (2020) [35]) |
| 2 | AVs would lead to fewer traffic jams compared to conventional vehicles. (Yuen et al. (2020) [35]) |
| 3 | AVs would allow better access to my intended destinations. (Yuen et al. (2020) [35]) |
| 4 | Using AVs will decrease my accident risk compared to conventional vehicles. (Yuen et al. (2020) [35]) |
| 5 | AVs would allow me to spend my time on things other than driving. (Yuen et al. (2020) [35]) |
| 6 | AVs would be more advantageous compared to using conventional vehicles. (Yuen et al. (2020) [35]) |
| 7 | AVs would solve problems that I have encountered with conventional cars. (Yuen et al. (2020) [9]) |
| 8 | AVs would be an environmentally friendly option. (Yuen et al. (2020) [9]) |
| 9 | Traveling in a driverless car would enable me to communicate with my family, friends and colleagues. (Acheampong & Cugurullo (2019) [40]) |
| 10 | Driverless cars would reduce the stress of driving. (Acheampong & Cugurullo (2019) [40]) |
| 11 | Traveling in a driverless car would be comfortable. (Acheampong & Cugurullo (2019) [40]) |
| Perceived Risk | |
| 1 | A system in the autonomous vehicle may not enough to drive. (Lee et al. (2019) [31]) |
| 2 | Using an autonomous vehicle may not perform well and create problems. (Lee et al. (2019) [31]) |
| 3 | An autonomous vehicle may not work properly. (Lee et al. (2019) [31]) |
| 4 | An autonomous vehicle may perform unstably and incorrectly. (Lee et al. (2019) [31]) |
| Perceived Safety | |
| 1 | Overall. AVs would help make my journeys safer than they are when I use conventional cars. (Lijarcio et al. (2019) [49]) |
| 2 | AVs would act better than myself in a complicated traffic situation. (Lijarcio et al. (2019) [49]) |
| 3 | A driverless/automated vehicle may be not ““““smart”””” enough for guaranteeing my safety during the journey (-). (Lijarcio et al. (2019) [49]) |
| 4 | AV-related systems could easily break down, or be hacked, thus compromising my safety (-). (Lijarcio et al. (2019) [49]) |
| 5 | AVs would respond adequately to unexpected situations that commonly require rapid responses from drivers. (Lijarcio et al. (2019) [49]) |
| 6 | Driverless cars will reduce crashes. (Acheampong & Cugurullo (2019) [40]) |
| Intention to Use | |
| 1 | I would prefer using an AV more than a conventional car when driving on urban/city roads. (Lijarcio et al. (2019) [49]) |
| 2 | If during the next years I will have enough budget, I plan to buy an AV. (Lijarcio et al. (2019) [49]) |
| 3 | I would prefer using an AV than a conventional car if I were tired. (Lijarcio et al. (2019) [49]) |
| 4 | I am totally against the option of buying an autonomous car (-). (Lijarcio et al. (2019) [49]) |
| 5 | Considering the need of adapting to transport dynamics, planning to buy an AVs at some point in the next years sounds adequate. (Lijarcio et al. (2019) [49]) |
| 6 | I intend to use AVs in the future. (Yuen et al. (2020) [35]) |
| 7 | I plan to use AVs in the future. (Yuen et al. (2020) [35]) |
| 8 | I have positive things to say about AVs. (Yuen et al. (2020) [35]) |
| 9 | I would encourage others to use AVs. (Yuen et al. (2020) [35]) |
Appendix B
Table A2.
One-Way ANOVA Results of Age Groups.
Table A2.
One-Way ANOVA Results of Age Groups.
| Sum of Squares | df | Mean Square | F | Sig. | ||
|---|---|---|---|---|---|---|
| Perceived Advantage | Between Groups | 8.018 | 4 | 2.004 | 4.273 | 0.002 |
| Within Groups | 284.269 | 606 | 0.469 | - | - | |
| Total | 292.286 | 610 | - | - | - | |
| Perceived Risk | Between Groups | 4.588 | 4 | 1.147 | 1.744 | 0.139 |
| Within Groups | 398.618 | 606 | 0.658 | - | - | |
| Total | 403.206 | 610 | - | - | - | |
| Perceived Safety | Between Groups | 6.398 | 4 | 1.600 | 2.888 | 0.022 |
| Within Groups | 335.621 | 606 | 0.554 | - | - | |
| Total | 342.019 | 610 | - | - | - | |
| Intention to Use | Between Groups | 4.833 | 4 | 1.208 | 2.248 | 0.063 |
| Within Groups | 325.647 | 606 | 0.537 | - | - | |
| Total | 330.480 | 610 | - | - | - | |
Table A3.
One-Way ANOVA Results of Education Groups.
Table A3.
One-Way ANOVA Results of Education Groups.
| Sum of Squares | df | Mean Square | F | Sig. | ||
|---|---|---|---|---|---|---|
| Perceived Advantage | Between Groups | 3.248 | 5 | 0.650 | 1.360 | 0.238 |
| Within Groups | 289.038 | 605 | 0.478 | - | - | |
| Total | 292.286 | 610 | - | - | - | |
| Perceived Risk | Between Groups | 19.894 | 5 | 3.979 | 6.280 | 0.000 |
| Within Groups | 383.312 | 605 | 0.634 | - | - | |
| Total | 403.206 | 610 | - | - | - | |
| Perceived Safety | Between Groups | 7.619 | 5 | 1.524 | 2.757 | 0.018 |
| Within Groups | 334.400 | 605 | 0.553 | - | - | |
| Total | 342.019 | 610 | - | - | - | |
| Intention to Use | Between Groups | 4.041 | 5 | 0.808 | 1.498 | 0.189 |
| Within Groups | 326.440 | 605 | 0.540 | - | - | |
| Total | 330.480 | 610 | - | - | - | |
References
- Le Hong, Z.; Zimmerman, N. Air quality and greenhouse gas implications of autonomous vehicles in Vancouver, Canada. Transp. Res. Part D Transp. Environ. 2021, 90, 102676. [Google Scholar] [CrossRef]
- Pettigrew, S.; Nelson, J.D.; Norman, R. Autonomous vehicles and cycling: Policy implications and management issues. Transp. Res. Interdiscip. Perspect. 2020, 7, 100188. [Google Scholar] [CrossRef] [PubMed]
- Wu, J.; Liao, H.; Wang, J.-W. Analysis of consumer attitudes towards autonomous, connected, and electric vehicles: A survey in China. Res. Transp. Econ. 2020, 80, 100828. [Google Scholar] [CrossRef]
- Jing, P.; Xu, G.; Chen, Y.; Shi, Y.; Zhan, F. The Determinants behind the Acceptance of Autonomous Vehicles: A Systematic Review. Sustainability 2020, 12, 1719. [Google Scholar] [CrossRef] [Green Version]
- Campisi, T.; Severino, A.; Al-Rashid, M.A.; Pau, G. The Development of the Smart Cities in the Connected and Autonomous Vehicles (CAVs) Era: From Mobility Patterns to Scaling in Cities. Infrastructures 2021, 6, 100. [Google Scholar] [CrossRef]
- Severino, A.; Curto, S.; Barberi, S.; Arena, F.; Pau, G. Autonomous Vehicles: An Analysis Both on Their Distinctiveness and the Potential Impact on Urban Transport Systems. Appl. Sci. 2021, 11, 3604. [Google Scholar] [CrossRef]
- Meidute-Kavaliauskiene, I.; Yıldız, B.; Çiğdem, Ş.; Činčikaitė, R. An Integrated Impact of Blockchain on Supply Chain Applications. Logistics 2021, 5, 33. [Google Scholar] [CrossRef]
- Acheampong, R.A.; Cugurullo, F.; Gueriau, M.; Dusparic, I. Can autonomous vehicles enable sustainable mobility in future cities? Insights and policy challenges from user preferences over different urban transport options. Cities 2021, 112, 103134. [Google Scholar] [CrossRef]
- Yuen, K.F.; Wong, Y.D.; Ma, F.; Wang, X. The determinants of public acceptance of autonomous vehicles: An innovation diffusion perspective. J. Clean. Prod. 2020, 270, 121904. [Google Scholar] [CrossRef]
- Bennett, R.; Vijaygopal, R.; Kottasz, R. Attitudes towards autonomous vehicles among people with physical disabilities. Transp. Res. Part A Policy Pr. 2019, 127, 1–17. [Google Scholar] [CrossRef]
- Choi, J.K.; Ji, Y.G. Investigating the Importance of Trust on Adopting an Autonomous Vehicle. Int. J. Hum. Comput. Interact. 2015, 31, 692–702. [Google Scholar] [CrossRef]
- Silva, D.; Földes, D.; Csiszár, C. Autonomous Vehicle Use and Urban Space Transformation: A Scenario Building and Analysing Method. Sustainability 2021, 13, 3008. [Google Scholar] [CrossRef]
- Golbabaei, F.; Yigitcanlar, T.; Paz, A.; Bunker, J. Individual Predictors of Autonomous Vehicle Public Acceptance and Intention to Use: A Systematic Review of the Literature. J. Open Innov. Technol. Mark. Complex. 2020, 6, 106. [Google Scholar] [CrossRef]
- Baccarella, C.V.; Wagner, T.F.; Scheiner, C.W.; Maier, L.; Voigt, K.-I. Investigating consumer acceptance of autonomous technologies: The case of self-driving automobiles. Eur. J. Innov. Manag. 2021, 24, 1210–1232. [Google Scholar] [CrossRef]
- Keszey, T. Behavioural intention to use autonomous vehicles: Systematic review and empirical extension. Transp. Res. Part C Emerg. Technol. 2020, 119, 102732. [Google Scholar] [CrossRef]
- Dirsehan, T.; Can, C. Examination of trust and sustainability concerns in autonomous vehicle adoption. Technol. Soc. 2020, 63, 101361. [Google Scholar] [CrossRef]
- Miralles-Guasch, C.; Melo, M.M.; Sarda, O.M. On user perception of private transport in Barcelona Metropolitan area: An experience in an academic suburban space. J. Transp. Geogr. 2014, 36, 24–31. [Google Scholar] [CrossRef]
- Campisi, T.; Basbas, S.; Al-Rashid, M.A.; Tesoriere, G.; Georgiadis, G. A region-wide survey on emotional and psychological impacts of COVID-19 on public transport choices in Sicily, Italy. Trans. Transp. Sci. 2021. [Google Scholar] [CrossRef]
- Bellone, M.; Ismailogullari, A.; Kantala, T.; Mäkinen, S.; Soe, R.-M.; Kyyrö, M. A cross-country comparison of user experience of public autonomous transport. Eur. Transp. Res. Rev. 2021, 13, 1–13. [Google Scholar] [CrossRef]
- Kamble, S.S.; Gunasekaran, A.; Gawankar, S.A. Sustainable Industry 4.0 framework: A systematic literature review identifying the current trends and future perspectives. Process Saf. Environ. Prot. 2018, 117, 408–425. [Google Scholar] [CrossRef]
- Vermesan, O.; Bahr, R.; Ottella, M.; Serrano, M.; Karlsen, T.; Wahlstrøm, T.; Sand, H.-E.; Ashwathnarayan, M.; Gamba, M.T. Internet of robotic things intelligent connectivity and platforms. Front. Robot. AI 2020, 7, 104. [Google Scholar] [CrossRef] [PubMed]
- Reggio, G.; Leotta, M.; Cerioli, M.; Spalazzese, R.; Alkhabbas, F. What are IoT systems for real? An experts’ survey on software engineering aspects. Internet Things 2020, 12, 100313. [Google Scholar] [CrossRef]
- Koopman, P.; Wagner, M. Autonomous Vehicle Safety: An Interdisciplinary Challenge. IEEE Intell. Transp. Syst. Mag. 2017, 9, 90–96. [Google Scholar] [CrossRef]
- Tang, C.S.; Veelenturf, L.P. The strategic role of logistics in the industry 4.0 era. Transp. Res. Part E Logist. Transp. Rev. 2019, 129, 1–11. [Google Scholar] [CrossRef]
- Schneiderman, R. Unmanned Drones are Flying High in the Military/Aerospace Sector [Special Reports]. IEEE Signal Process. Mag. 2011, 29, 8–11. [Google Scholar] [CrossRef]
- Fagnant, D.J.; Kockelman, K. Preparing a nation for autonomous vehicles: Opportunities, barriers and policy recommendations. Transp. Res. Part A Policy Pract. 2015, 77, 167–181. [Google Scholar] [CrossRef]
- Aufrère, R.; Gowdy, J.; Mertz, C.; Thorpe, C.; Wang, C.-C.; Yata, T. Perception for collision avoidance and autonomous driving. Mechatronics 2003, 13, 1149–1161. [Google Scholar] [CrossRef]
- SAE. J3016B: Taxonomy and Definitions for Terms Related to Driving Automation Systems for On-Road Motor Vehicles—SAE International. Available online: https://www.sae.org/standards/content/j3016_201806/ (accessed on 13 June 2021).
- Guang, X.; Gao, Y.; Leung, H.; Liu, P.; Li, G. An Autonomous Vehicle Navigation System Based on Inertial and Visual Sensors. Sensors 2018, 18, 2952. [Google Scholar] [CrossRef] [Green Version]
- Sun, X.; Cao, S.; Tang, P. Shaping driver-vehicle interaction in autonomous vehicles: How the new in-vehicle systems match the human needs. Appl. Ergon. 2021, 90, 103238. [Google Scholar] [CrossRef]
- Lee, J.; Lee, D.; Park, Y.; Lee, S.; Ha, T. Autonomous vehicles can be shared, but a feeling of ownership is important: Examination of the influential factors for intention to use autonomous vehicles. Transp. Res. Part C Emerg. Technol. 2019, 107, 411–422. [Google Scholar] [CrossRef]
- Pakusch, C.; Stevens, G.; Boden, A.; Bossauer, P. Unintended Effects of Autonomous Driving: A Study on Mobility Preferences in the Future. Sustainability 2018, 10, 2404. [Google Scholar] [CrossRef] [Green Version]
- Liu, H.; Yang, R.; Wang, L.; Liu, P. Evaluating Initial Public Acceptance of Highly and Fully Autonomous Vehicles. Int. J. Hum.-Comput. Interact. 2019, 35, 919–931. [Google Scholar] [CrossRef]
- Zhao, C.; Li, L.; Pei, X.; Li, Z.; Wang, F.-Y.; Wu, X. A comparative study of state-of-the-art driving strategies for autonomous vehicles. Accid. Anal. Prev. 2021, 150, 105937. [Google Scholar] [CrossRef] [PubMed]
- Yuen, K.F.; Cai, L.; Qi, G.; Wang, X. Factors influencing autonomous vehicle adoption: An application of the technology acceptance model and innovation diffusion theory. Technol. Anal. Strateg. Manag. 2021, 33, 505–519. [Google Scholar] [CrossRef]
- Zandieh, R.; Acheampong, R.A. Mobility and healthy ageing in the city: Exploring opportunities and challenges of autonomous vehicles for older adults’ outdoor mobility. Cities 2021, 112, 103135. [Google Scholar] [CrossRef]
- Sheela, P.V.; Mannering, F. The effect of information on changing opinions toward autonomous vehicle adoption: An exploratory analysis. Int. J. Sustain. Transp. 2020, 14, 475–487. [Google Scholar] [CrossRef]
- Yuen, K.F.; Chua, G.; Wang, X.; Ma, F.; Li, K.X. Understanding Public Acceptance of Autonomous Vehicles Using the Theory of Planned Behaviour. Int. J. Environ. Res. Public Health 2020, 17, 4419. [Google Scholar] [CrossRef] [PubMed]
- Panagiotopoulos, I.; Dimitrakopoulos, G. An empirical investigation on consumers’ intentions towards autonomous driving. Transp. Res. Part C Emerg. Technol. 2018, 95, 773–784. [Google Scholar] [CrossRef]
- Acheampong, R.A.; Cugurullo, F. Capturing the behavioural determinants behind the adoption of autonomous vehicles: Conceptual frameworks and measurement models to predict public transport, sharing and ownership trends of self-driving cars. Transp. Res. Part F Traffic Psychol. Behav. 2019, 62, 349–375. [Google Scholar] [CrossRef] [Green Version]
- Jing, P.; Huang, H.; Ran, B.; Zhan, F.; Shi, Y. Exploring the Factors Affecting Mode Choice Intention of Autonomous Vehicle Based on an Extended Theory of Planned Behavior—A Case Study in China. Sustainability 2019, 11, 1155. [Google Scholar] [CrossRef] [Green Version]
- Dai, J.; Li, R.; Liu, Z. Does initial experience affect consumers’ intention to use autonomous vehicles? Evidence from a field experiment in Beijing. Accid. Anal. Prev. 2021, 149, 105778. [Google Scholar] [CrossRef]
- Hulse, L.M.; Xie, H.; Galea, E.R. Perceptions of autonomous vehicles: Relationships with road users, risk, gender and age. Saf. Sci. 2018, 102, 1–13. [Google Scholar] [CrossRef]
- Tork, N.; Amirkhani, A.; Shokouhi, S.B. An adaptive modified neural lateral-longitudinal control system for path following of autonomous vehicles. Eng. Sci. Technol. Int. J. 2021, 24, 126–137. [Google Scholar] [CrossRef]
- Ahmed, S.S.; Pantangi, S.S.; Eker, U.; Fountas, G.; Still, S.E.; Anastasopoulos, P.C. Analysis of safety benefits and security concerns from the use of autonomous vehicles: A grouped random parameters bivariate probit approach with heterogeneity in means. Anal. Methods Accid. Res. 2020, 28, 100134. [Google Scholar] [CrossRef]
- Li, G.; Yang, Y.; Zhang, T.; Qu, X.; Cao, D.; Cheng, B.; Li, K. Risk assessment based collision avoidance decision-making for autonomous vehicles in multi-scenarios. Transp. Res. Part C Emerg. Technol. 2021, 122, 102820. [Google Scholar] [CrossRef]
- Ha, T.; Kim, S.; Seo, D.; Lee, S. Effects of explanation types and perceived risk on trust in autonomous vehicles. Transp. Res. Part F Traffic Psychol. Behav. 2020, 73, 271–280. [Google Scholar] [CrossRef]
- Tang, P.; Sun, X.; Cao, S. Investigating user activities and the corresponding requirements for information and functions in autonomous vehicles of the future. Int. J. Ind. Ergon. 2020, 80, 103044. [Google Scholar] [CrossRef]
- Lijarcio, J.I.; Useche, S.A.; Llamazares, F.J.; Montoro, L. Perceived benefits and constraints in vehicle automation: Data to assess the relationship between driver’s features and their attitudes towards autonomous vehicles. Data Brief 2019, 27, 104662. [Google Scholar] [CrossRef]
- Penmetsa, P.; Adanu, E.K.; Wood, D.; Wang, T.; Jones, S.L. Perceptions and expectations of autonomous vehicles—A snapshot of vulnerable road user opinion. Technol. Forecast. Soc. Chang. 2019, 143, 9–13. [Google Scholar] [CrossRef]
- Field, A. Discovering Statistics Using IBM SPSS Statistics, 5th ed.; SAGE Publications: Thousand Oaks, CA, USA, 2017; ISBN 978-1-5264-1952-1/978-1-5264-1951-4. [Google Scholar]
- Kim, S.-T.; Han, C.-H. Measuring Environmental Logistics Practices. Asian J. Shipp. Logist. 2011, 27, 237–258. [Google Scholar] [CrossRef] [Green Version]
- Fornell, C.; Larcker, D.F. Structural Equation Models with Unobservable Variables and Measurement Error: Algebra and Statistics. J. Mark. Res. 1981, 18, 382–388. [Google Scholar] [CrossRef]
- Hair, J.; Anderson, R.; Black, B.; Babin, B. Multivariate Data Analysis; Pearson Education: UK, London, 2016; ISBN 978-0-13-379268-3. [Google Scholar]
- Huang, C.-C.; Wang, Y.-M.; Wu, T.-W.; Wang, P.-A. An Empirical Analysis of the Antecedents and Performance Consequences of Using the Moodle Platform. Int. J. Inf. Educ. Technol. 2013, 3, 217–221. [Google Scholar] [CrossRef] [Green Version]
- Straub, D.; Boudreau, M.-C.; Gefen, D. Validation guidelines for IS positivist research. Commun. Assoc. Inf. Syst. 2004, 13, 24. [Google Scholar] [CrossRef]
- Kline, R.B. Principles and Practice of Structural Equation Modeling, 3rd ed.; Guilford Press: New York, NY, USA, 2011; ISBN 978-1-60623-877-6/978-1-60623-876-9. [Google Scholar]
- Lin, Y.; Luo, J.; Cai, S.; Ma, S.; Rong, K. Exploring the service quality in the e-commerce context: A triadic view. Ind. Manag. Data Syst. 2016, 116, 388–415. [Google Scholar] [CrossRef]
- Lloret, S.; Ferreres, A.; Hernández, A.; Tomás, I. The exploratory factor analysis of items: Guided analysis based on empirical data and software. Anales de Psicología 2017, 33, 417–432. [Google Scholar] [CrossRef] [Green Version]
- Joreskog, K.G.; Sorbom, D. LISREL 8: User’s Reference Guide; Scientific Software Inc.: Chicago, IL, USA, 1989. [Google Scholar]
- Müller, J.M. Comparing Technology Acceptance for Autonomous Vehicles, Battery Electric Vehicles, and Car Sharing—A Study across Europe, China, and North America. Sustainability 2019, 11, 4333. [Google Scholar] [CrossRef] [Green Version]
- Kim, K.; Kim, J.S.; Jeong, S.; Park, J.-H.; Kim, H.K. Cybersecurity for autonomous vehicles: Review of attacks and defense. Comput. Secur. 2021, 103, 102150. [Google Scholar] [CrossRef]
- Singleton, P.A. Discussing the “positive utilities” of autonomous vehicles: Will travellers really use their time productively? Transp. Rev. 2018, 39, 50–65. [Google Scholar] [CrossRef] [Green Version]
- Zhang, T.; Gao, K. Will autonomous vehicles improve traffic efficiency and safety in urban road bottlenecks? The penetration rate matters. In Proceedings of the 2020 IEEE 5th International Conference on Intelligent Transportation Engineering (ICITE), Beijing, China, 11–13 September 2020; pp. 366–370. [Google Scholar]
- Zhang, W.; Guhathakurta, S.; Fang, J.; Zhang, G. Exploring the impact of shared autonomous vehicles on urban parking demand: An agent-based simulation approach. Sustain. Cities Soc. 2015, 19, 34–45. [Google Scholar] [CrossRef]
- Moták, L.; Neuville, E.; Chambres, P.; Marmoiton, F.; Monéger, F.; Coutarel, F.; Izaute, M. Antecedent variables of intentions to use an autonomous shuttle: Moving beyond TAM and TPB? Eur. Rev. Appl. Psychol. 2017, 67, 269–278. [Google Scholar] [CrossRef]
- Rahman, M.M.; Lesch, M.F.; Horrey, W.J.; Strawderman, L. Assessing the utility of TAM, TPB, and UTAUT for advanced driver assistance systems. Accid. Anal. Prev. 2017, 108, 361–373. [Google Scholar] [CrossRef] [PubMed]
- Wang, S.; Jiang, Z.; Noland, R.B.; Mondschein, A.S. Attitudes towards privately-owned and shared autonomous vehicles. Transp. Res. Part F Traffic Psychol. Behav. 2020, 72, 297–306. [Google Scholar] [CrossRef]
- Zang, S.; Ding, M.; Smith, D.; Tyler, P.; Rakotoarivelo, T.; Kaafar, M.A. The Impact of Adverse Weather Conditions on Autonomous Vehicles: How Rain, Snow, Fog, and Hail Affect the Performance of a Self-Driving Car. IEEE Veh. Technol. Mag. 2019, 14, 103–111. [Google Scholar] [CrossRef]
- Taeihagh, A.; Lim, H.S.M. Governing autonomous vehicles: Emerging responses for safety, liability, privacy, cybersecurity, and industry risks. Transp. Rev. 2018, 39, 103–128. [Google Scholar] [CrossRef] [Green Version]
- Ward, C.; Raue, M.; Lee, C.; D’Ambrosio, L.; Coughlin, J.F. Acceptance of automated driving across generations: The role of risk and benefit perception, knowledge, and trust. In Human-Computer Interaction. User Interface Design, Development and Multimodality; Kurosu, M., Ed.; Springer International Publishing: Cham, Switzerland, 2017; pp. 254–266. ISBN 978-3-319-58071-5. [Google Scholar]
- Wintersberger, S.; Azmat, M.; Kummer, S. Are We Ready to Ride Autonomous Vehicles? A Pilot Study on Austrian Consumers’ Perspective. Logistics 2019, 3, 20. [Google Scholar] [CrossRef] [Green Version]
- Cugurullo, F.; Acheampong, R.A.; Gueriau, M.; Dusparic, I. The transition to autonomous cars, the redesign of cities and the future of urban sustainability. Urban Geogr. 2020, 1–27. [Google Scholar] [CrossRef]
- Chen, H.-K.; Yan, D.-W. Interrelationships between influential factors and behavioral intention with regard to autonomous vehicles. Int. J. Sustain. Transp. 2018, 13, 511–527. [Google Scholar] [CrossRef]

Publisher’s Note: MDPI stays neutral with regard to jurisdictional claims in published maps and institutional affiliations. |
© 2021 by the authors. Licensee MDPI, Basel, Switzerland. This article is an open access article distributed under the terms and conditions of the Creative Commons Attribution (CC BY) license (https://creativecommons.org/licenses/by/4.0/).