Article

The Use of Artificial Neural Networks to Determine the Engine Power and Fuel Consumption of Modern Bulk Carriers, Tankers and Container Ships

Faculty of Navigation, Maritime University of Szczecin, ul. Wały Chrobrego 1-2, 70-500 Szczecin, Poland
*
Author to whom correspondence should be addressed.
Energies 2021, 14(16), 4827; https://doi.org/10.3390/en14164827
Submission received: 8 July 2021 / Revised: 3 August 2021 / Accepted: 5 August 2021 / Published: 7 August 2021
(This article belongs to the Special Issue Energy Intensity of Transport and Environmentally Friendly Mobility)

Abstract

:
The 2007–2008 financial crisis, together with rises in fuel prices and stringent pollution regulation, led to the need to update the methods concerning ship propulsion system design. In this article, a set of artificial neural networks was used to update the design equations to estimate the engine power and fuel consumption of modern tankers, bulk carriers, and container ships. Deadweight or TEU capacity and ship speed were used as the inputs for the ANNs. This study shows that even a linear ANN with two neurons in the input and output layers, with purelin activation functions, offers an accurate estimation of ship propulsion parameters. The proposed linear ANNs have simple mathematical structures and are straightforward to apply. The ANNs presented in the article were developed based on the data of the most recent ships built from 2015 to present, and could have a practical application at the preliminary design stage, in transportation or air pollution studies for modern commercial cargo ships. The presented equations mirror trends found in the literature and offer much greater accuracy for the features of new-built ships. The article shows how to estimate CO2 emissions for a bulk carrier, tanker, and container carrier utilizing the proposed ANNs.

1. Introduction

Due to its massive trade volume and low ship transportation cost, maritime transport has become the bedrock of global goods transportation around the world. In a study of goods transport by sea, the form of transport is analyzed in terms of:
  • Financial benefit, which consists of the amount of cargo transported and the duration of transportation;
  • The cost of transporting the cargo, which consists primarily of the cost of energy supplied to the ship.
For this purpose, various mathematical relationships are examined between parameters encompassing:
  • The transport efficiency of the ship, such as deadweight and vessel speed;
  • The energy efficiency of the ship, affected by the total power and fuel consumption of the vessel.
As a result, a total engine power and fuel consumption estimation of vessels is most often performed at the general transport study stage of the process, with the goal of selecting the mode of transport [1,2]. Various indicators which illustrate transportation efficiency were used to achieve this task. Papanikolaou [3] argued that transport efficiency may be defined as a function of the vessel’s deadweight DWT, service speed V in knots and total engine power P in kW, as follows:
E = DWT · V P
where:
  • E—the transport efficiency, DWT—deadweight capacity, V—speed, and P—total engine power.
Based on Formula (1), design requirements for a cargo ship that will meet these transport requirements more completely can be developed. To accomplish this, a simple, accurate relationship between vessel speed, deadweight and engine power must be determined.
Maritime shipping, among other things, has become an major contributor to global air pollution. The International Maritime Organization (IMO) has developed design and operating requirements in shipping to limit pollution emissions. An Energy Efficiency Design Index (EEDI) was adopted by the IMO as the MARPOL Annex VI amendment for new ships, with the goal of using highly energy-efficient, low-pollution equipment and engines. The EEDI index can be used to calculate ship CO2 emissions by using, inter alia, the vessel’s engine power and fuel consumption. Reducing pollutant emissions from ships is also an additional objective of the transport studies. The most common initial method to estimate pollutant emissions is a fuel-based approach based on marine fuel consumption data and fuel-related emission factors [4]. Eyring et al. [5], Coello et al. [6], and Nunes et al. [7] proposed a detailed approach method that also takes the activities of vessels into account and requires a comprehensive dataset on the propulsion characteristics and operations of particular ships. Czermanski et al. [8] argued that container shipping is a major source of pollution in the maritime shipping trade and proposed an energy consumption approach to measuring ship emissions that takes both the size and the operational energy parameters of the container shipping fleet into account. As a result, methods that estimate engine power and fuel consumption using ship speed and deadweight are critical, because they may be used to calculate the EEDI index, as well as exhaust emissions in a “fuel-based”, “energy consumption based” or other approaches.
Estimations of engine power and total fuel consumption are also carried out at the preliminary design stage of a new ship. The most important approach in ship design is to optimize key ship characteristics in terms of energy efficiency. The optimization of ship characteristics should be carried out correctly in order to establish ship design with the highest operational values according to Ekincia et al. [9], Lin and Shaw et al. [10], MAN Diesel & Turbo [11], and Petersen et al. [12]. Total ship power can also be used to estimate the building costs of the ship, which include ship propulsion system parameters, among other considerations. Celik et al. [13] argued that at the preliminary design stage, ship engine power is required to estimate the weight and cost of the tanker engine. The weight of the engine foundation, engine plant and gearbox, as well as other engine loads such as pumps, valves, sound absorbers and other components, are all functions of propulsion power according to Schneekluth and Bertram [14]. Lin and Shaw [10] proposed that container ship propulsion power be used to estimate the weight of the stern frame, rudder, power generator, propellers and shafts, as well as the overall cost. The following methods are widely used for main engine power estimation at the preliminary design stage, according to Papanikolaou [3]:
  • Geometrically similar ship methods based on the British Admiralty coefficient;
  • Use of technical diagrams, for example, MAN B&W Diesel diagrams [11].
For preliminary design, computational multicriteria optimization approaches are often used. Simple mathematical equations which map relationships of design characteristics are needed to apply such methods. Geometrically related ship methods and technical diagrams may have limited application in the estimation of the total power of a main engine for this reason. A collection of regression equations based on ship databases may be more practical in this situation.

2. Background

2.1. The Estimation of Propulsion Power

There are not many scientific papers on the estimation of propulsion power at the preliminary design stage. Piko [15] published one of the first sets of regression analyses in 1980. Length, width, draught, gross and net registered ton capacities, as well as power and speed, were regressed against deadweight and speed, respectively. The publication made use of the Lloyd’s Register of Shipping database, which included 10,334 ships. The database is now outdated, which is the key weakness of the research. Żelazny [16] proposed regression equations to estimate propulsion power for container ships, tankers, and bulk carriers. However, the regressions were generated with a limited database that only included 41 bulk carriers, 53 container ships and 32 tankers, and the author did not take ship capacity parameters into account. The key parameters of contemporary oil/chemical tankers, including main engine power, were calculated using various computational intelligence techniques [9]. Rather than using deadweight to calculate engine speed, Ekinci et al. [9] only considered length between perpendiculars. Data from 114 oil/chemical tankers with lengths ranging from 53 to 182 m were collected from the Turkish Shipbuilders Association website for the analysis. A Levenberg–Marquardt neural network was used to estimate engine total power in the study.

2.2. The Estimation of Fuel Consumption

In ship design and operation, fuel consumption is most often predicted through the use of propulsion characteristics. If detailed propulsion data are not available, fuel consumption can be estimated by using general specifications, such as engine power or other ship parameters. The simplest method is to estimate fuel consumption using total engine power and specific fuel consumption. Kim et al. [17] proposed a method for estimating fuel consumption based on theoretical resistance calculations, which applied methods [18,19] and the ship’s propulsion parameters, among others. Bialystocki and Konovessis [20] proposed an operational approach to estimate fuel consumption and speed based on the main influencing factors, such as ship draught and displacement, wind speed and direction, hull and propeller roughness. Beşikçia et al. [21] and Petersen et al. [12] developed an artificial neural network (ANN) to predict fuel consumption by using ship service parameters such as revolutions per minute, average draught, trim, cargo capacity, and wind and wave influence as input parameters. Simonsen et al. [22] proposed a model for the calculation of cruise ship fuel consumption through the use of Automatic Identification System (AIS) data and technical information, such as service speed, total power and specific fuel consumption. Townsin and Kwon [23], Lin et al. [24] and Vettor and Soares [25] estimated fuel oil consumption by using detailed calculations of the added resistance due to wind and waves. Park et al. [26] proposed a second-order polynomial function to estimate fuel consumption by using ship service parameters. Roh [27], Wei and Zhou [28] and Chen [29] estimated the fuel oil consumption through the use of the ship’s resistance calculated by using the ISO 15016: 2002 method [30]. Eniram [31] and Samsung Heavy Industries (SHI) [32] developed a weather route planning software that uses a statistical approach

2.3. Cargo Capacity and Ship Velocity as Design Parameters

Key ship design parameters are determined during the preliminary design stage based on the most important ship functions. Papanikolau [3] classified ship types based on major design features, as follows:
  • Deadweight carriers, where deadweight capacity is a critical design characteristic—tankers and bulk carriers are typical representatives of this ship category;
  • Volume carriers, where hold volume capacity is the most important design characteristic—RO-RO cargo ships, car carriers, and container vessels are representative of this ship category.
This indicates that deadweight capacity may be a major design criterion for tankers and bulk carriers, whereas TEU container capacity is a critical design parameter for container ships. The key design parameters required to estimate the total power of the main engines of ships, according to Watson and Papanikolaou [2,3], are deadweight or TEU capacity and design speed.
As a result, the following ship design parameters were considered and then chosen as independent variables for the estimation of the main engine power in this study:
  • Maximum possible deadweight tonnage for tankers and bulk carriers, which corresponds to fully loaded deadweight at full summer saltwater draught (normally of 1025 t/m3 density);
  • Maximum number of TEU containers that could be carried by a container ship,
  • The design speed of a tanker, bulk carrier or container ship.

2.4. The Aims of Research

Market and trade demands have had an impact on ship design patterns for many years, and this is still true today. These trends were influenced by the financial crisis of 2007–2008, as well as increases in fuel prices, and stringent pollution regulations. Current legislation restricting ship exhaust emissions have also affected these changes. These shifts have provided a radically new structure for the design of commercial vessels, as discussed in [33,34]. This implies that approaches for estimating power and fuel consumption developed before this date to 2015 either require very careful welding or are already outdated. The updating of empirical formulas has become an important issue and is the main aim of this study in order to take these developments into account in transportation studies or the design of modern ships.
While considering the aforementioned information, equations to estimate engine power and fuel consumption through the use of ship capacity and speed for newly built cargo ships after 2015 are yet to be created. Therefore, the first aim of this research was to develop a set of formulas to estimate total engine power and fuel consumption for new tankers, bulk carriers and container ships built after 2015, as follows:
MCR = f1 (DWT/TEU, V)
FC = f2 (DWT/TEU, V)
where:
  • DWT—maximum possible deadweight tonnage which corresponds to fully loaded deadweight at full summer saltwater draught (normally of 1025 t/m3 density), for tankers and bulk carriers;
  • TEU—maximum number of TEU containers that could be carried by a container ship;
  • V—design speed of a tanker, bulk carrier and container ship;
  • MCR—maximum continuous rating (i.e., maximum power output of an engine that can be produced while running continuously at safe limits and conditions);
  • FC—the daily heavy fuel consumption of main engines;
  • f1, f2—approximating functions.
Artificial neural networks were applied to determine approximating functions f1, f2 in Equations (2) and (3).
Artificial neural networks have been used in a number of scientific ship design theory publications in recent years. For example, Alkan et al. [35] used neural networks to calculate the initial stability parameters of a fishing vessel. Artificial neural networks were trained on sample ship data to estimate the vertical center of gravity, transverse metacenter height above the keel and the vertical center of buoyancy. Gurgen et al. [36] developed an artificial neural network to estimate chemical tanker dimensions such as overall length, length between perpendiculars, breadth, draught and freeboard by using deadweight and vessel speed as inputs. Gurgen et al. [36] concluded that the initial key characteristics of chemical tankers determined by using ANNs offer highly accurate estimates compared to sample ship data. Ekincia et al. [9] estimated the key design parameters of oil/chemical tankers using 18 computational intelligence methods (including neural network methods). Abramowski [37] used an ANN to determine the effective power of a ship. Cepowski [14] used artificial neural networks to estimate added resistance in regular head waves while taking into account ship design parameters including length, breadth, draught and Froude number. In this case, only experimental data determined by model test measurements were used to train the neural network in order to create a reliable model. Song et al. [4] used an artificial neural network with a radial base function to predict ship rolling motion. Disturbing moment and roll time series were calculated using this method. Sahin et al. [38] estimated dilution factors at the preliminary design stage using an artificial neural network model connected to main ship parameters. Likely dilution factors were estimated using gross and deadweight tonnage, passenger number, freeboard, engine power, propeller number and block coefficient values in [38]. Luan et al. [39] used artificial neural networks to predict container vessel fuel consumption by using ship service parameters. Cheng et al. [40] presented a detailed review of a sensitivity analysis and a simplification of the artificial neural network for ship motion prediction. The use of artificial neural networks offered excellent results in a number of experimental studies. Artificial neural networks have not been used to estimate the propulsion parameters of a cargo ship by using cargo capacity and velocity in the input layer. Therefore, the second aim of this research was to investigate the effectiveness of using artificial neural networks to estimate engine power and ship fuel consumption through the use of either DWT or TEU capacity, as well as speed as input parameters.

3. Materials and Methods

3.1. Data

The SeaWeb Ships database [41] was used as a data source in this research. The database, which contains the technical specifications of over 200,000 ships, is considered an up-to-date document of the world fleet.
The technical data of modern tankers, bulk carriers and container vessels built between 2015 and 2021 were collected from the database and used in this study. When using a regression approach, the data used have to be of the highest quality and clearly representative. Inaccurate predictive analyses and mathematical models are always the result of poor data quality. The SeaWeb Ships database provides information on all ships, including sister ships with identical or similar characteristics. The ship database was thoroughly checked in this study, and sister ships were excluded. The total sample sizes after this elimination were as follows:
  • 276 tankers;
  • 196 bulk carriers;
  • 81 container ships.
The range and mean values of total engine power, fuel consumption, deadweight, TEU capacity, design speed, length and Froude number for particular types of ships are shown in Table 1, Table 2 and Table 3. Figure 1 shows the relationship between velocity V and TEU/DWT capacity of vessels used in the study. This figure indicates that there are no significant correlations between these variables and that there will be no multicollinearity problems within the estimation model.
The research was limited to ships which were only powered by heavy fuel, due to the insufficient data available for ships powered by other types of fuel.

3.2. General Research Framework

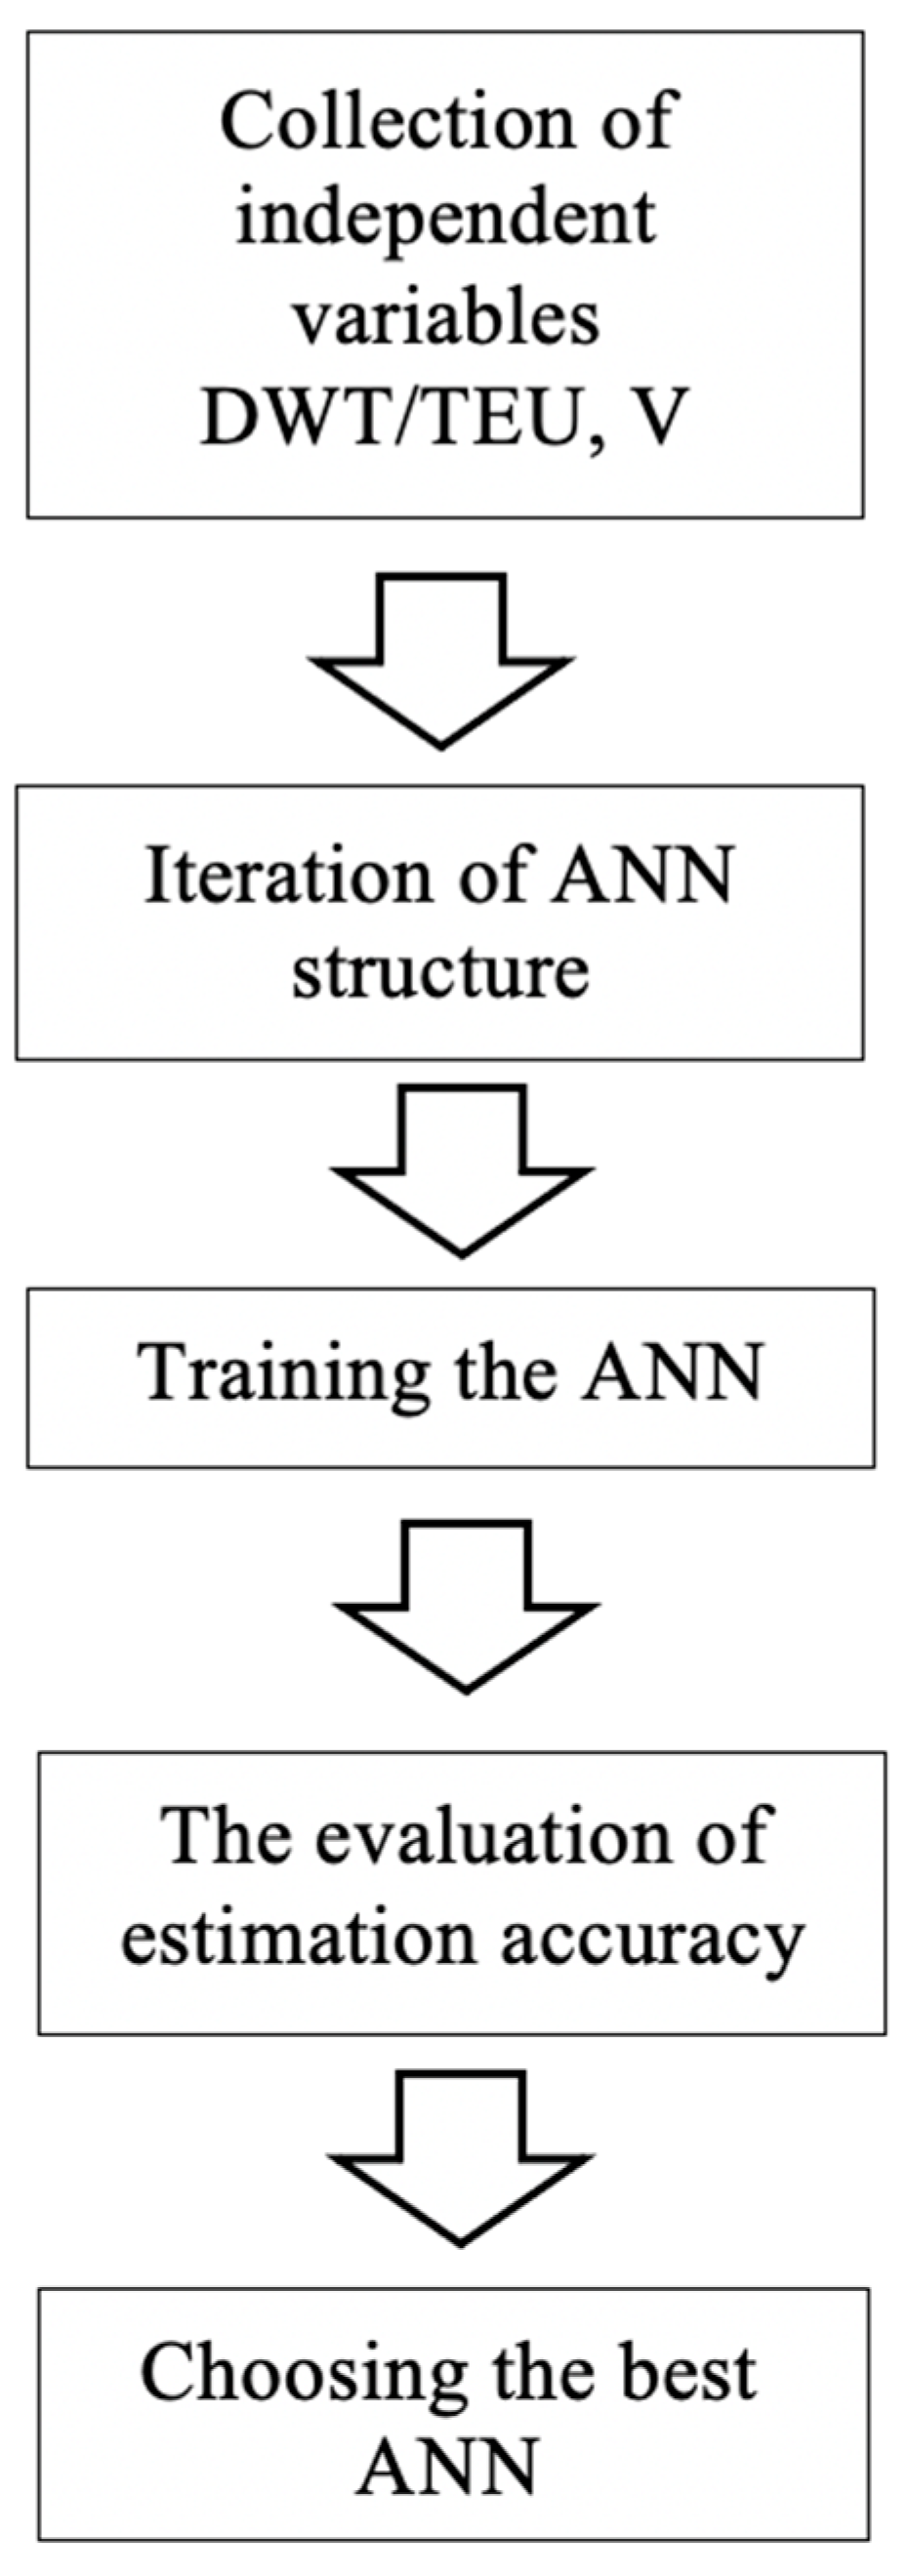
The general research framework scheme is shown in Figure 2.
According to this flowchart, the initial stage of this method was to select appropriate datasets depending on ship type. Deadweight capacity (DWT) and speed (V) were used as independent variables to estimate the propulsion parameters of bulk carriers and tankers. The number of containers (TEU) and speed (V) were used as independent variables to estimate the propulsion parameters of a container ship. Both engine power (MCR) and fuel consumption (FC) were used as dependent variables in the estimation models of all of the ship types.
The different types and structures of the neural networks were then tested iteratively. Simple and complex neural network topologies were tested at this stage. The ANN was trained, tested and evaluated for estimation accuracy at each stage of the iteration.
Finally, the ANN with the highest estimation accuracy and the smallest errors was chosen from all of the developed neural networks. In addition, the following additional criteria were used to select the best neural network:
The type and complexity of the ANN topology, which affects the complexity of the mathematical form;
ANN characteristics, which influence the phenomena of overfitting.
Details about ANN structures, the training process and overfitting phenomena are described in the next part of the article.

3.3. Artificial Neural Networks

An artificial neural network theory was developed on the basis of a biological nervous system. A biological nervous system is a network composed of neurons and their connections. An artificial neural network’s numerical model focuses on the structure and signal processing of a biological nervous system and is a collection of artificial neurons organized into input, output, and one or more hidden layers [42].
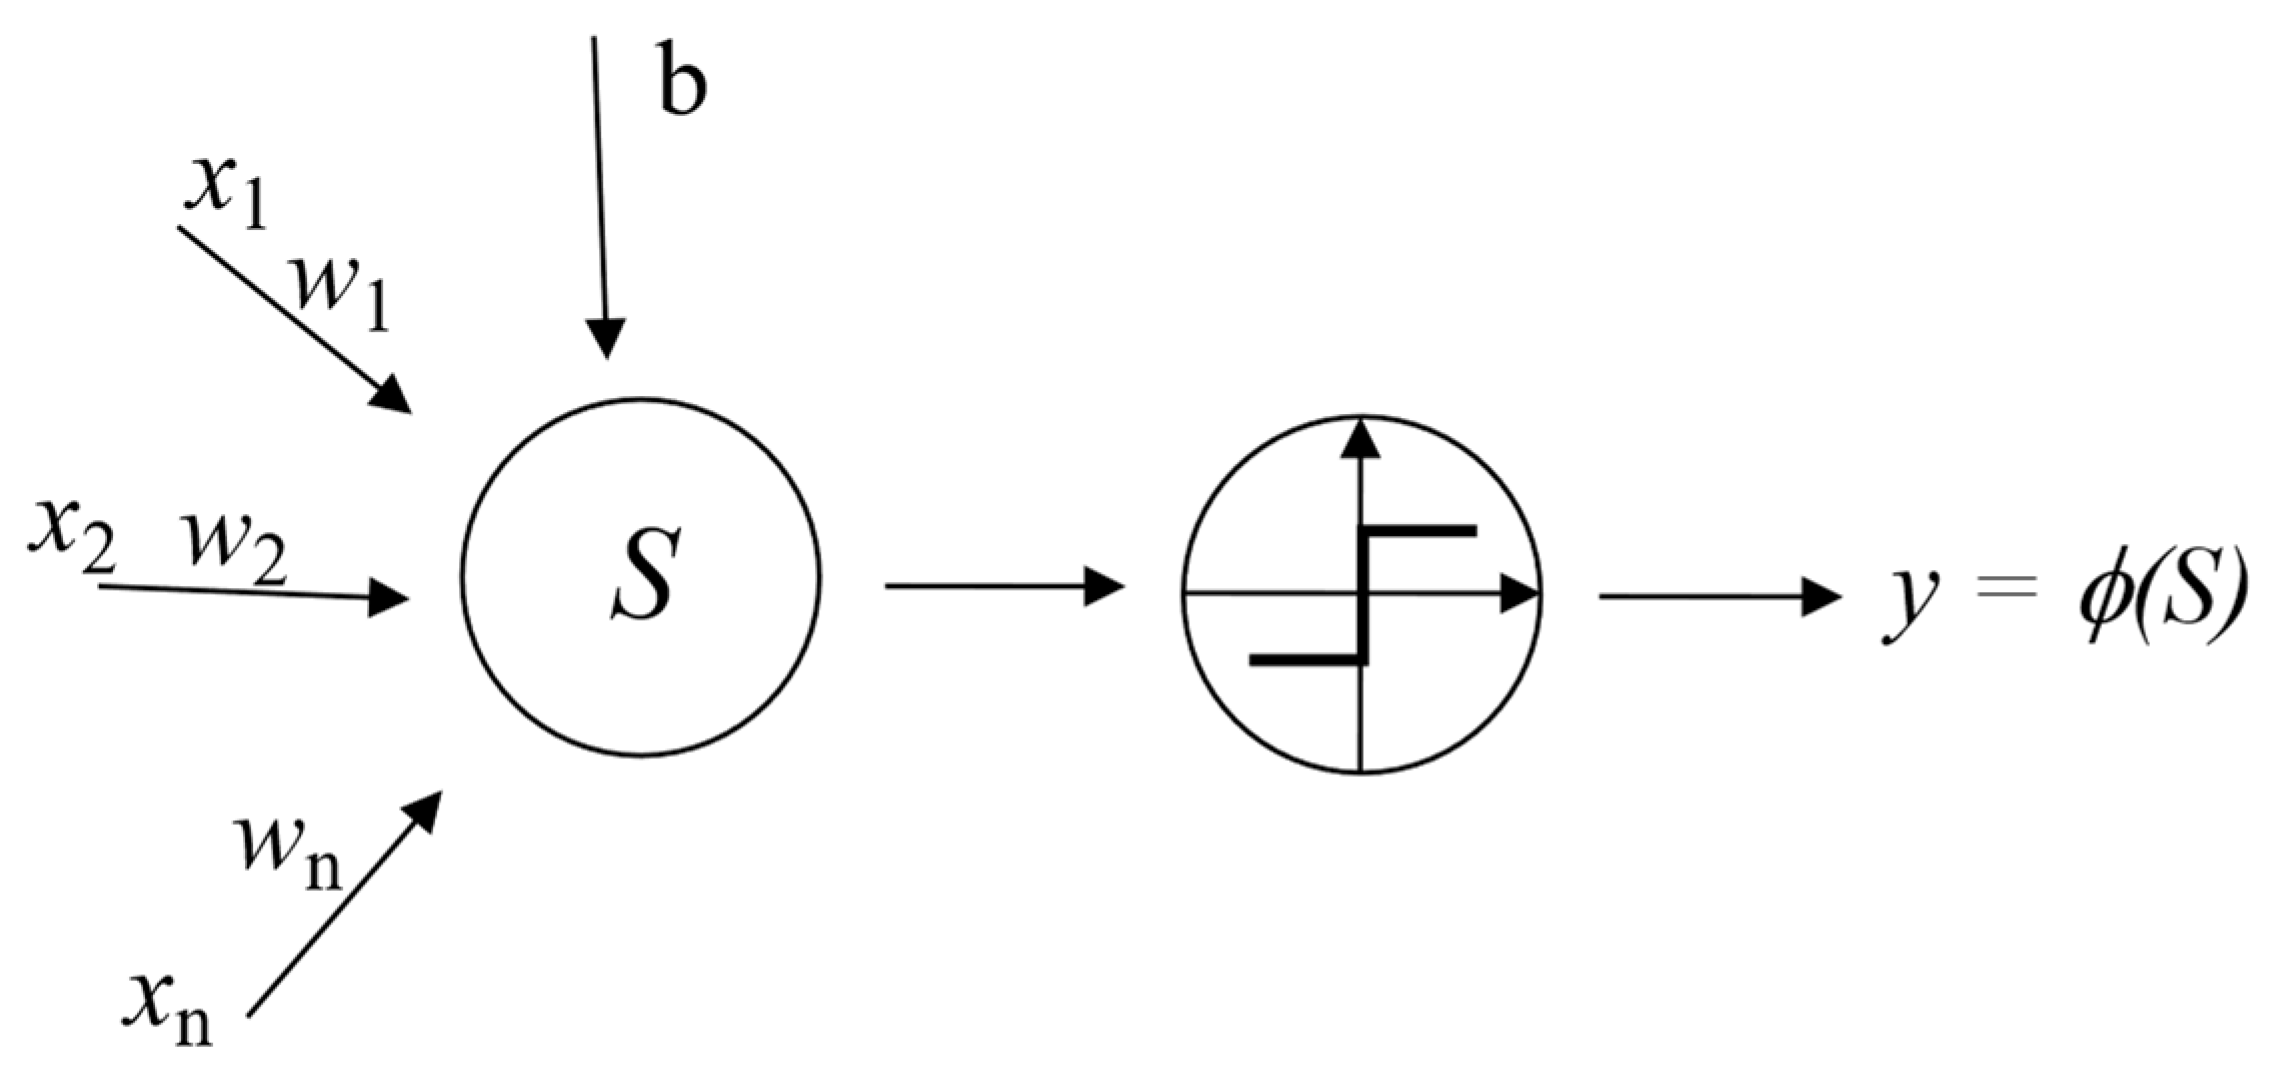
In a single artificial neuron, input values (xi) are processed from previous layers up to the sum (S) using bias (b) and weights (wi), as shown below:
S = b + i = 1 n w i x i
where:
  • xi—input values;
  • wi—weight;
  • b—bias,
  • S—sum.
Finally, activation function φ transforms the sum value (S) to output node value (y). As activation functions in the hidden and output neural network layers, a number of binary, linear, and nonlinear functions are often used. The following activation functions were used in this study:
  • Purelin (where the neuron activation is passed directly on as the output):
    ϕ ( S ) = S
  • Standard logistic function:
    ϕ ( S ) = 1 1 + e x p ( S )
Signal processing in an artificial neuron is shown in Figure 3.
The network structure, composed of neurons, activation functions and weights, determines the relationship between input and output data (Lee et al., 2016). The selection of an optimal network architecture and the computation of weight values are the two most difficult challenges in the design of neural networks. Weight values are calculated on the basis of input and output data in this method until the network response is consistent with the output data. Various ANN structures and training methods are used for this purpose.
A back-propagation training method [42,43,44] with Levenberg–Marquardt algorithm [45,46] and Broyden–Fletcher–Goldfarb–Shanno method [45,46,47,48,49,50] was used in this study.
An additional issue in the creation of neural networks is the phenomenon known as over-fitting. This occurs when the model includes many variables in comparison to the sample size used to develop a neural network. Usually, a cross-validation approach is used to detect and prevent over-fitting. The dataset is usually subdivided in this process as follows:
  • Data used for network training—the training set;
  • Data used for network validation during training—the validation set;
  • Data used for network testing only—the test set.
In this study, 50 percent of all cases were chosen at random for training, 25 percent for validation, and 25 percent of the data that had never been used for training were used again for testing.
Input and output data were standardized to a range of “−1” to “1” prior to the training phase. Normalization normally accelerates network training and leads to faster convergence. During the implementation method, the sum of the square error function (SOS) is often used as an error function.

4. Results and Analysis

4.1. Design Equations Developed through the Use of Artificial Neural Networks

In this study, artificial neural networks were trained and tested with Statistica software [51]. The following neural networks were found:
  • Multilayer perceptron (MLP) with a single hidden layer and the standard logistic activation functions presented in Equation (6);
  • Linear network (LN) with the purelin activation functions presented in Equation (5).
Multilayer perceptron is the most popular ANN structure [52] and is often used in data-driven modeling. In many aspects, the structure of linear neural networks is similar to that of perceptron networks, the differences being that the linear network usually has no hidden layer and linear neurons use a linear activation function.
Deadweight or TEU capacity and ship speed were used as an input layer, while engine power and fuel consumption were used as the output layer for the neural networks. Various numbers of neurons in the hidden layer(s) and training methods were tested in order to acquire the closest output values to the data observed.
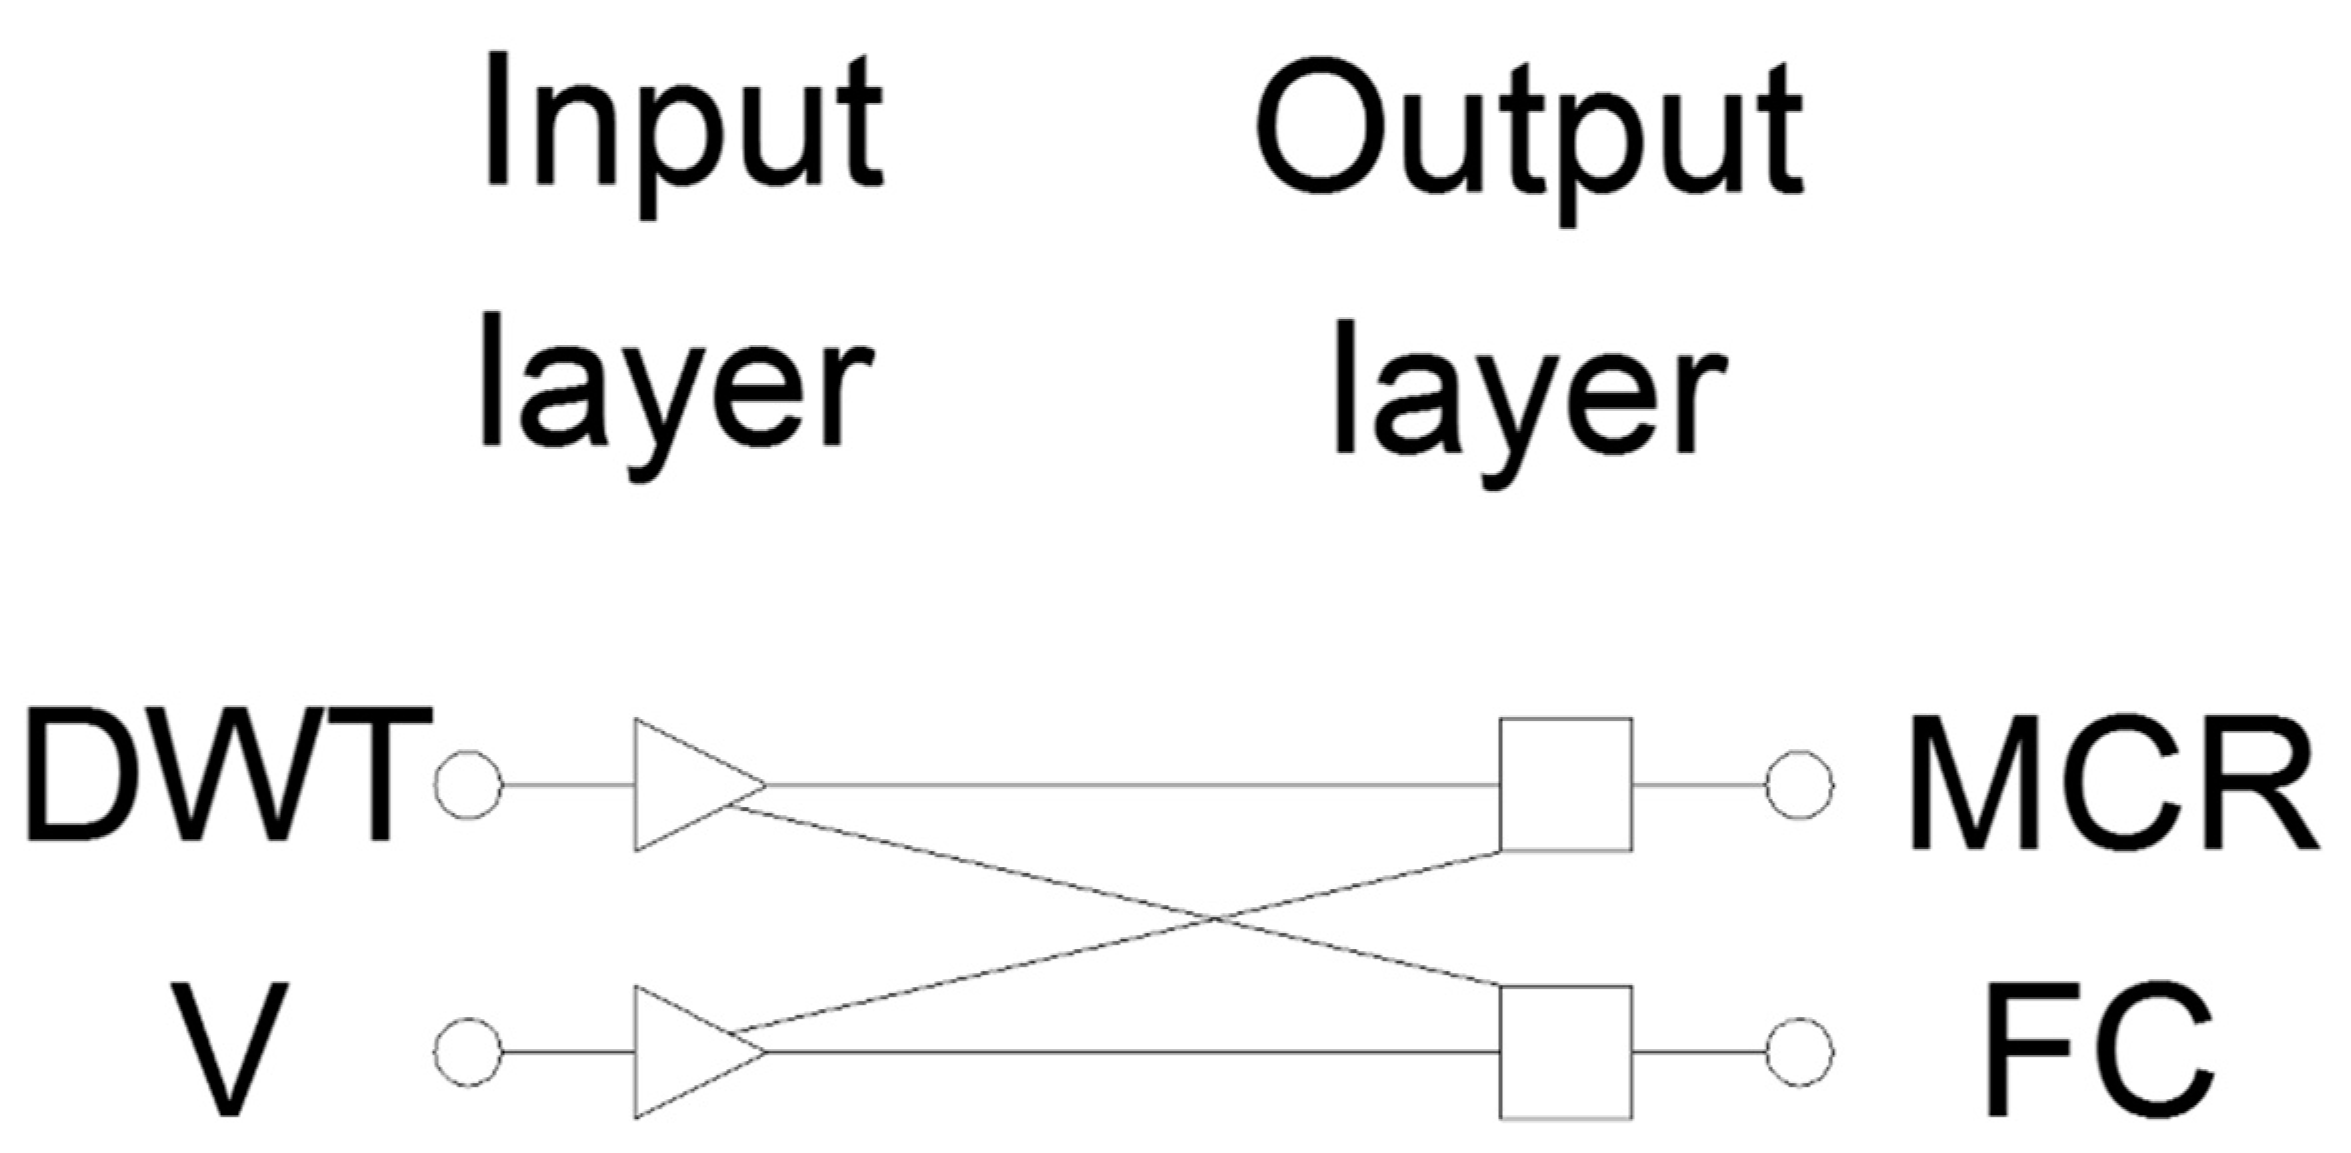
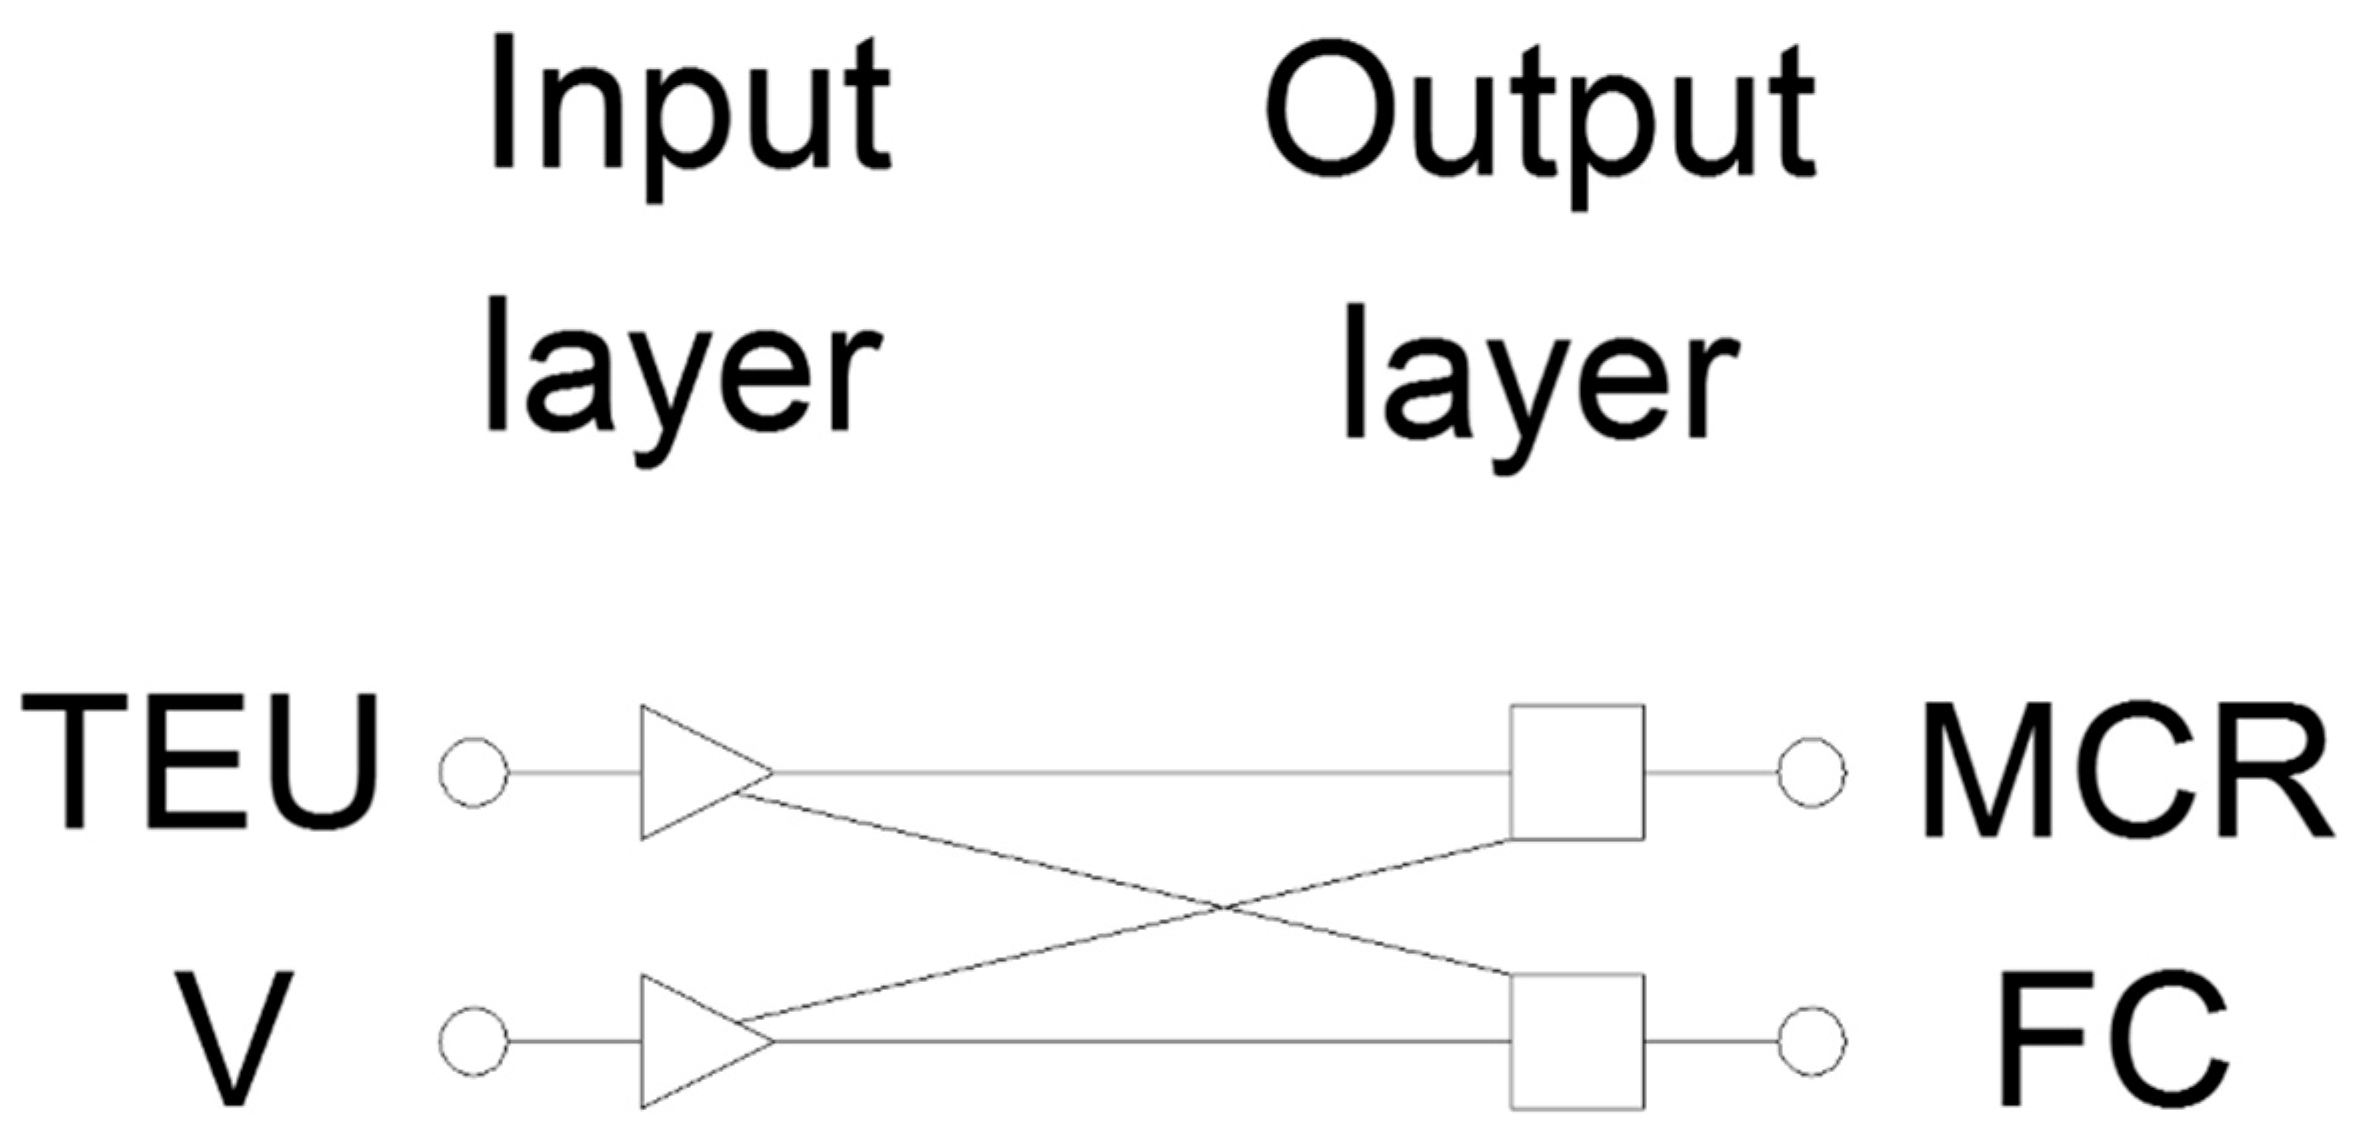
Table 4, Table 5 and Table 6 show the types and number of neurons in the hidden layers, as well as the training methods and RMSE errors of the developed neural networks to estimate the engine power and fuel consumption broken down into training, validation, test and all sets. A network which offers the lowest error is usually referred to as the best neural network. It can be observed in Table 4, Table 5 and Table 6 that the best solution was obtained while using a linear neural network without any neurons in the hidden layer. The structures of these neural networks are shown visually in Figure 4 and Figure 5. These figures illustrate the connections between the neurons in the input and output layers, as well as the network input and output parameters. The mathematical form of the linear neural networks to estimate the engine power MCR and fuel consumption FC of various vessels is shown in the following relations:
  • Bulk carriers:
    MCR = 25,062.66 · [ ( DWT · 2.58 · 10 6 0.04178 ) · 0.956618 + ( V · 0.294118 3.52941 ) · 0.08579 + 0.15713 ]
    FC = 87.108 · [ ( DWT · 2.58 · 10 6 0.04178 ) · 0.90469 + ( V · 0.294118 3.52941 ) · 0.130693 + 0.14126 ]
  • Tankers:
    MCR = 28,121.485 · [ ( DWT · 3.14 · 10 6 0.002959 ) · 0.760155 + ( V · 0.1265823 1.139241 ) · 0.2054171 + 0.03265 ]
    FC = 103.4019 · [ ( DWT · 3.14 · 10 6 0.002959 ) · 0.6973259 + ( V · 0.1265823 1.139241 ) · 0.2062511 + 0.02419 ]
  • Container carriers:
    MCR = 71,684.588 · [ ( TEU · 4.332 · 10 5 0.03812 ) · 0.7543861 + ( V · 0.08696 1.130435 ) · 0.3726194 0.02784 ]
    FC = 190.01 · [ ( TEU · 4.332 · 10 5 0.03812 ) · 0.8162732 + ( V · 0.08696 1.130435 ) · 0.6714974 0.09751 ]
    where:
    • MCR is engine power (kW);
    • FC is fuel consumption (t/day);
    • DWT is deadweight capacity (t);
    • TEU is the number of containers;
    • V is velocity (kts).
The RMSE values of the linear neural network to estimate:
(a)
the engine power of the following vessels, which were calculated as:
  • Bulk carriers, 1016, 1060, 1559 and 1163 kW for training, validation, test and all sets, respectively;
  • Tankers, 1761, 1456, 1647 and 1656 kW for training, validation, test and all sets, respectively;
  • Container carriers, 5137, 4233, 7012 and 5380 kW for training, validation, test and all sets, respectively.
(b)
The fuel consumption of the following vessels were calculated as:
  • Bulk carriers, 6.0, 5.1, 6.6 and 5.9 t/day for training, validation, test and all sets, respectively;
  • Tankers, 9.8, 8.3, 7.4 and 8.8 t/day for training, validation, test and all sets, respectively;
  • Container carriers, 24.3, 24.1, 19.5 and 23.1 t/day for training, validation, test and all sets, respectively;
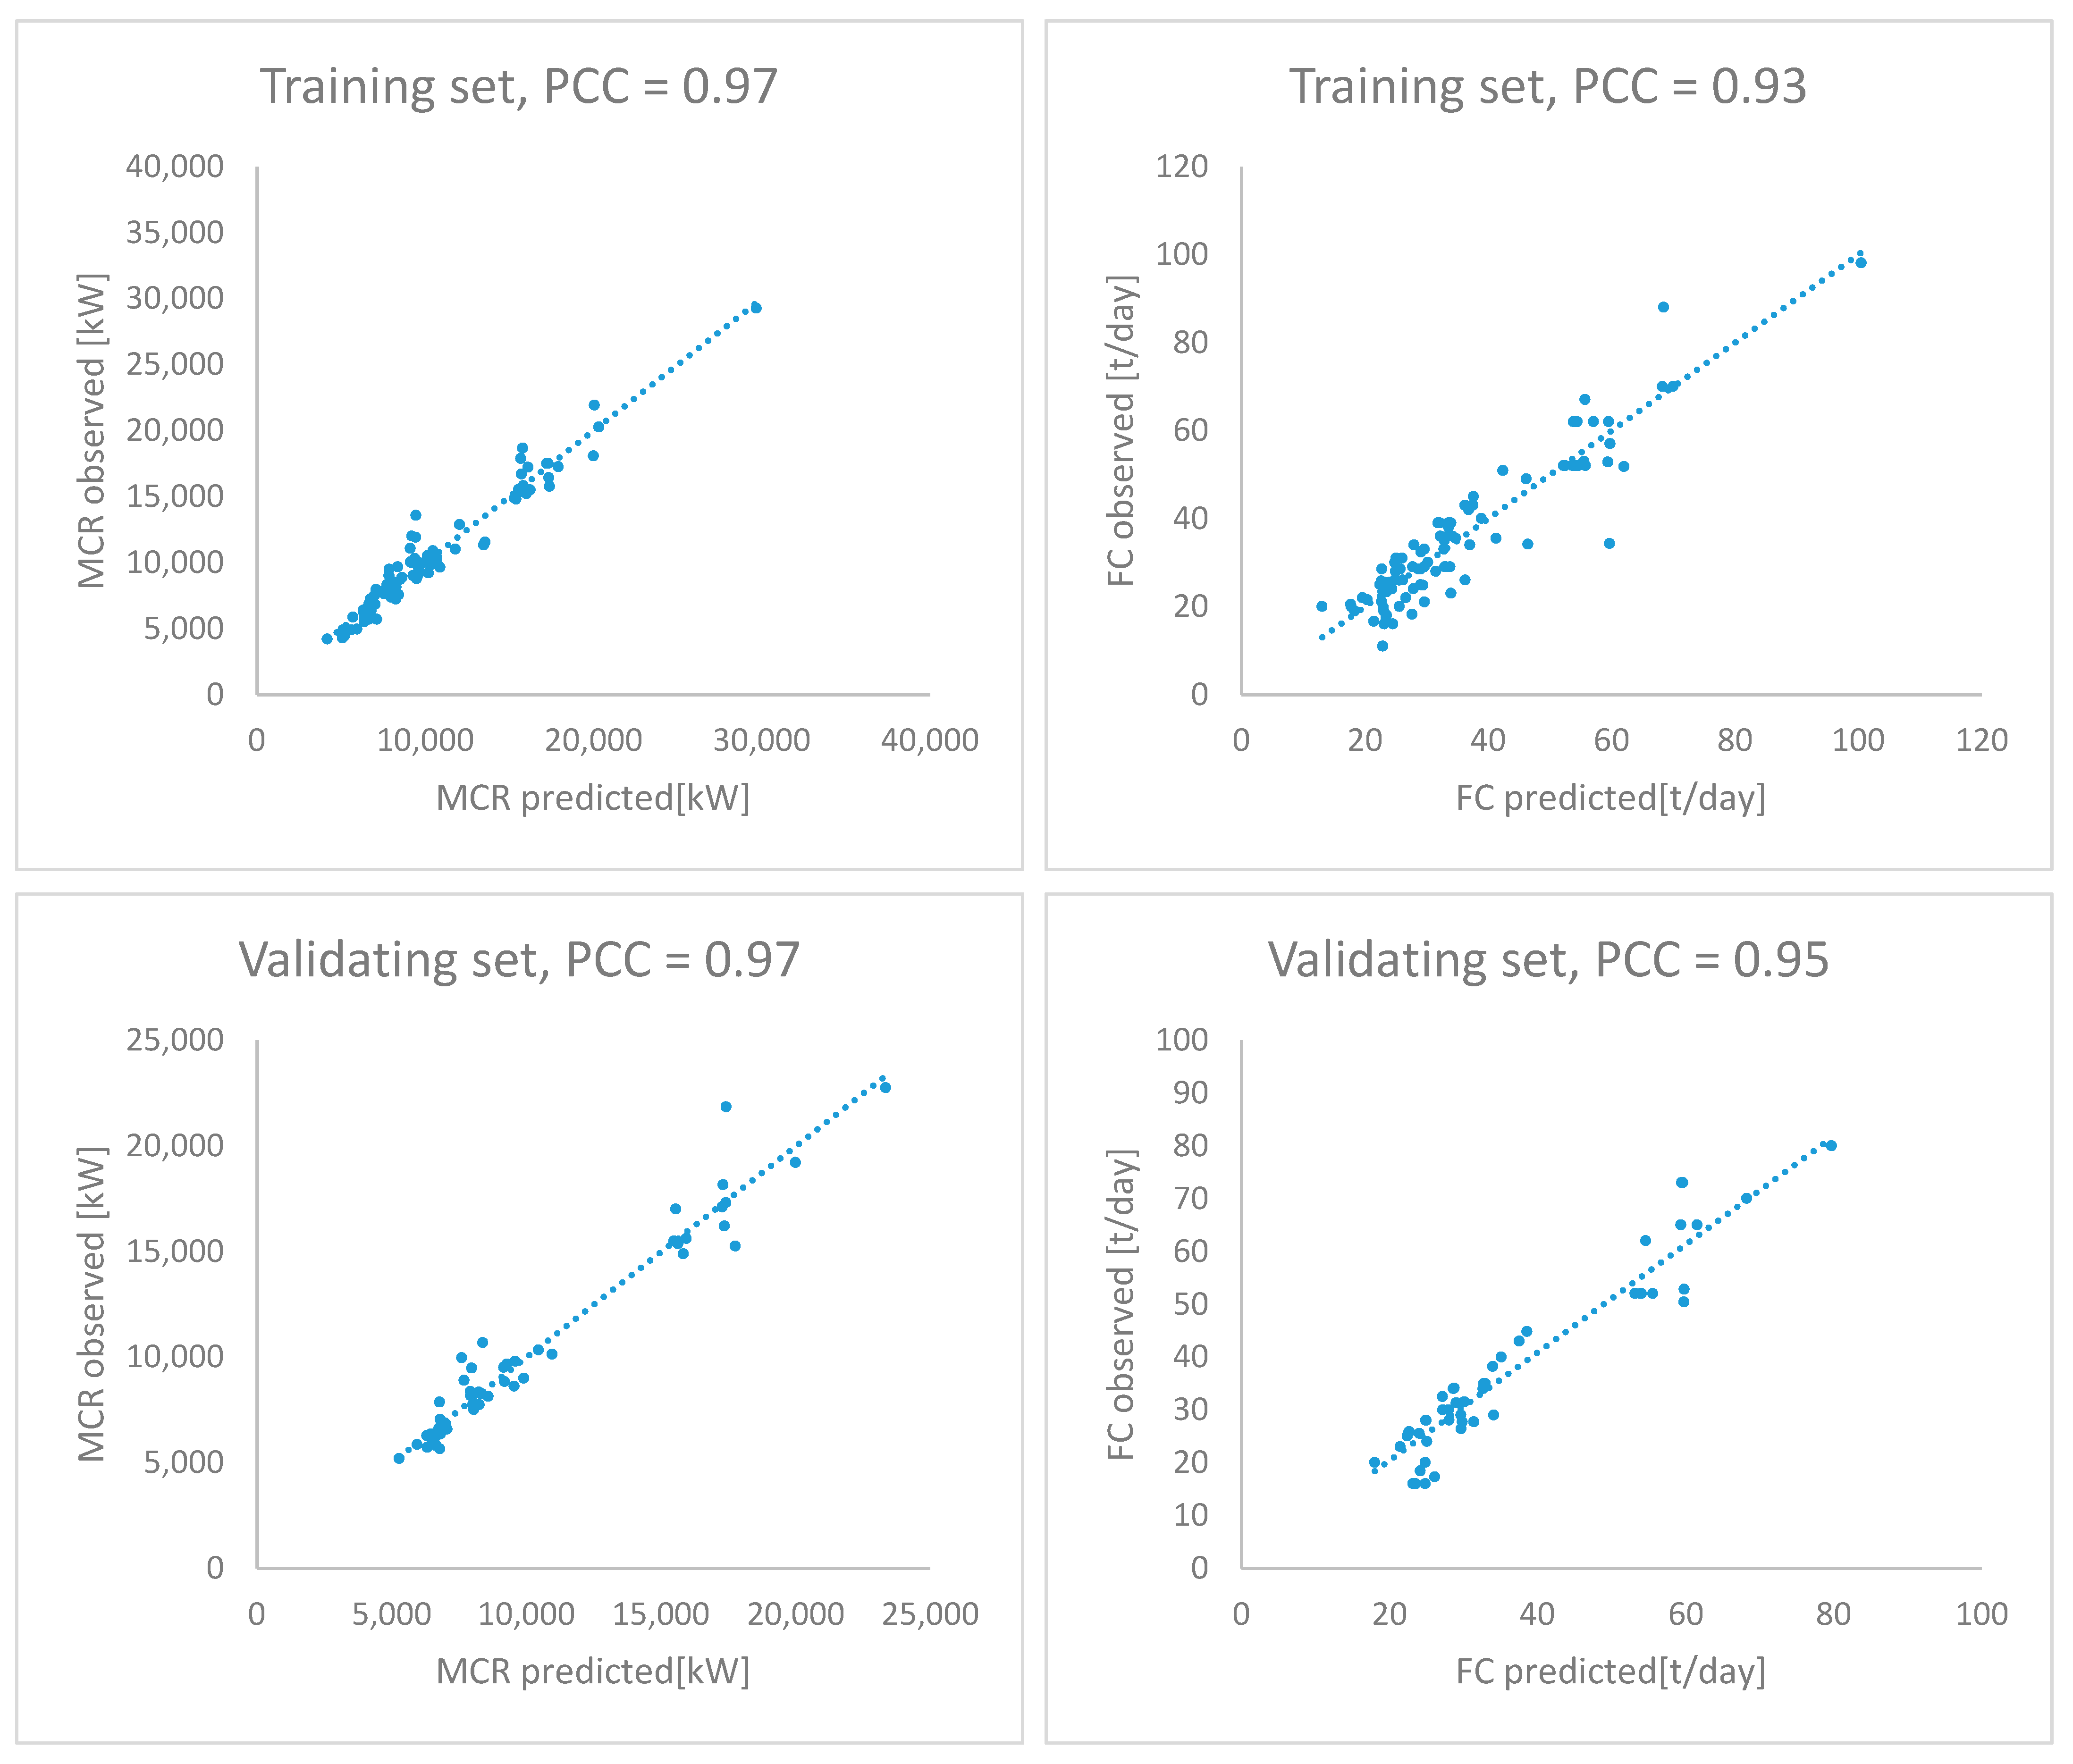
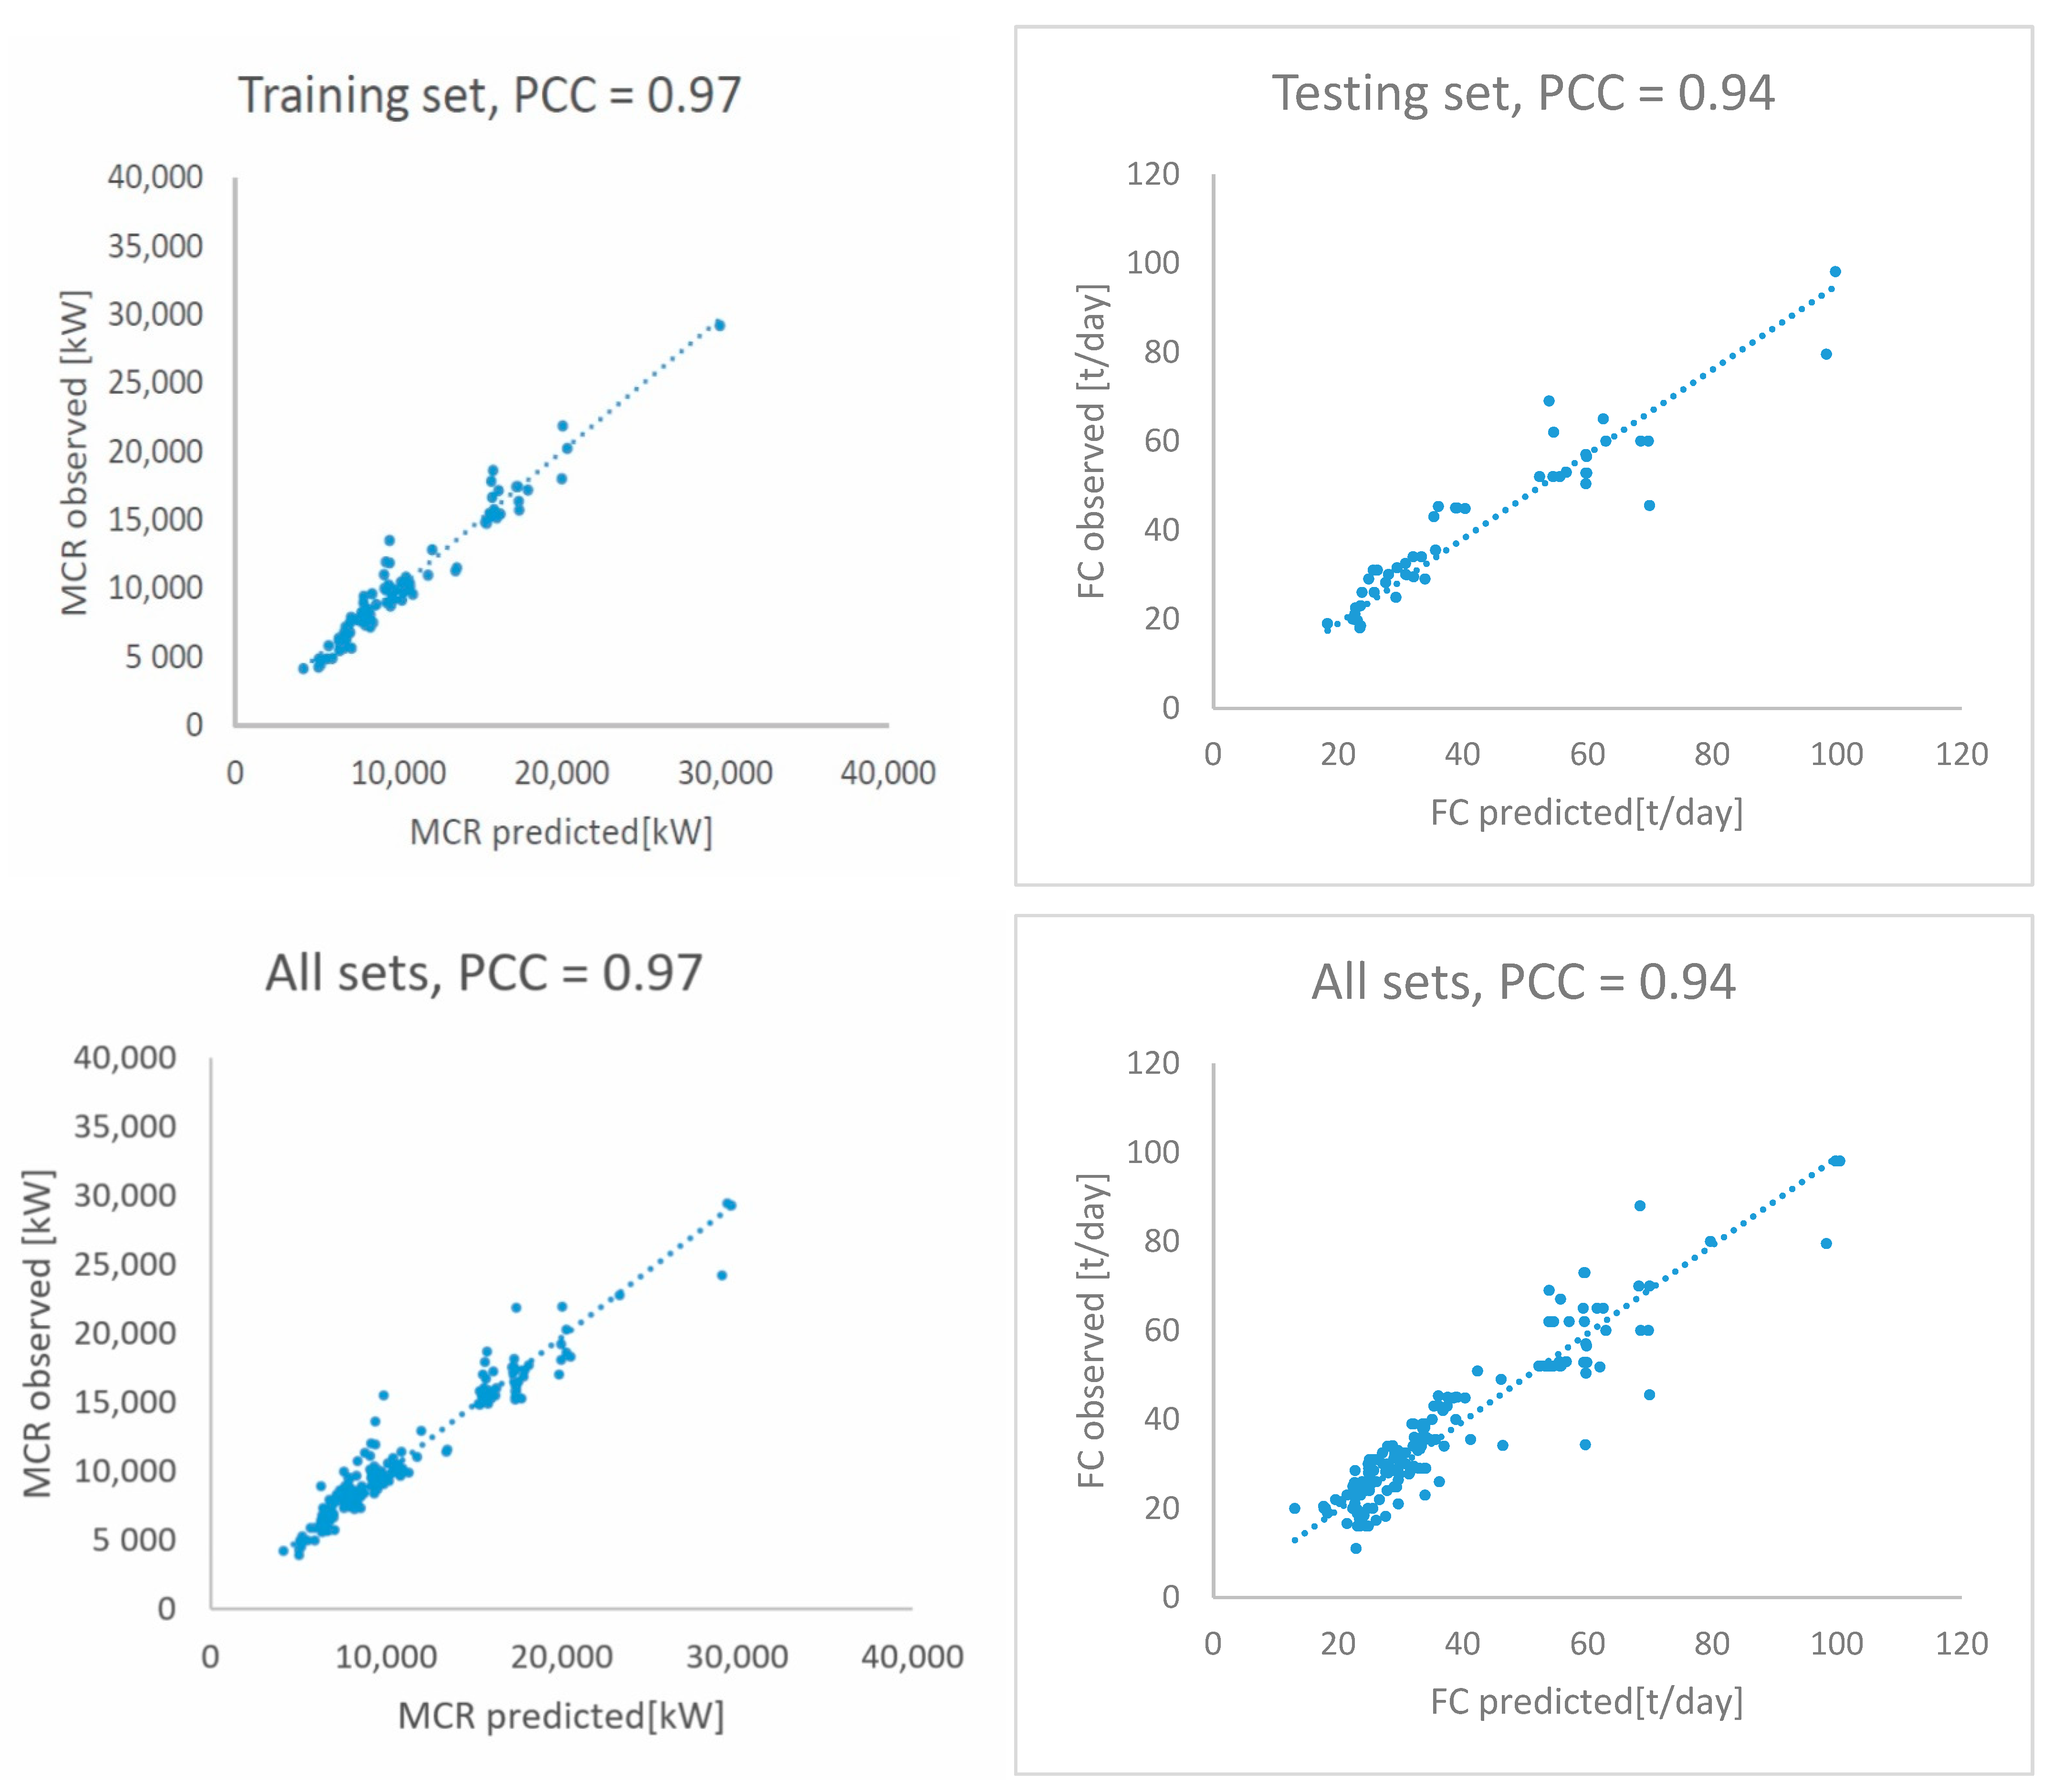
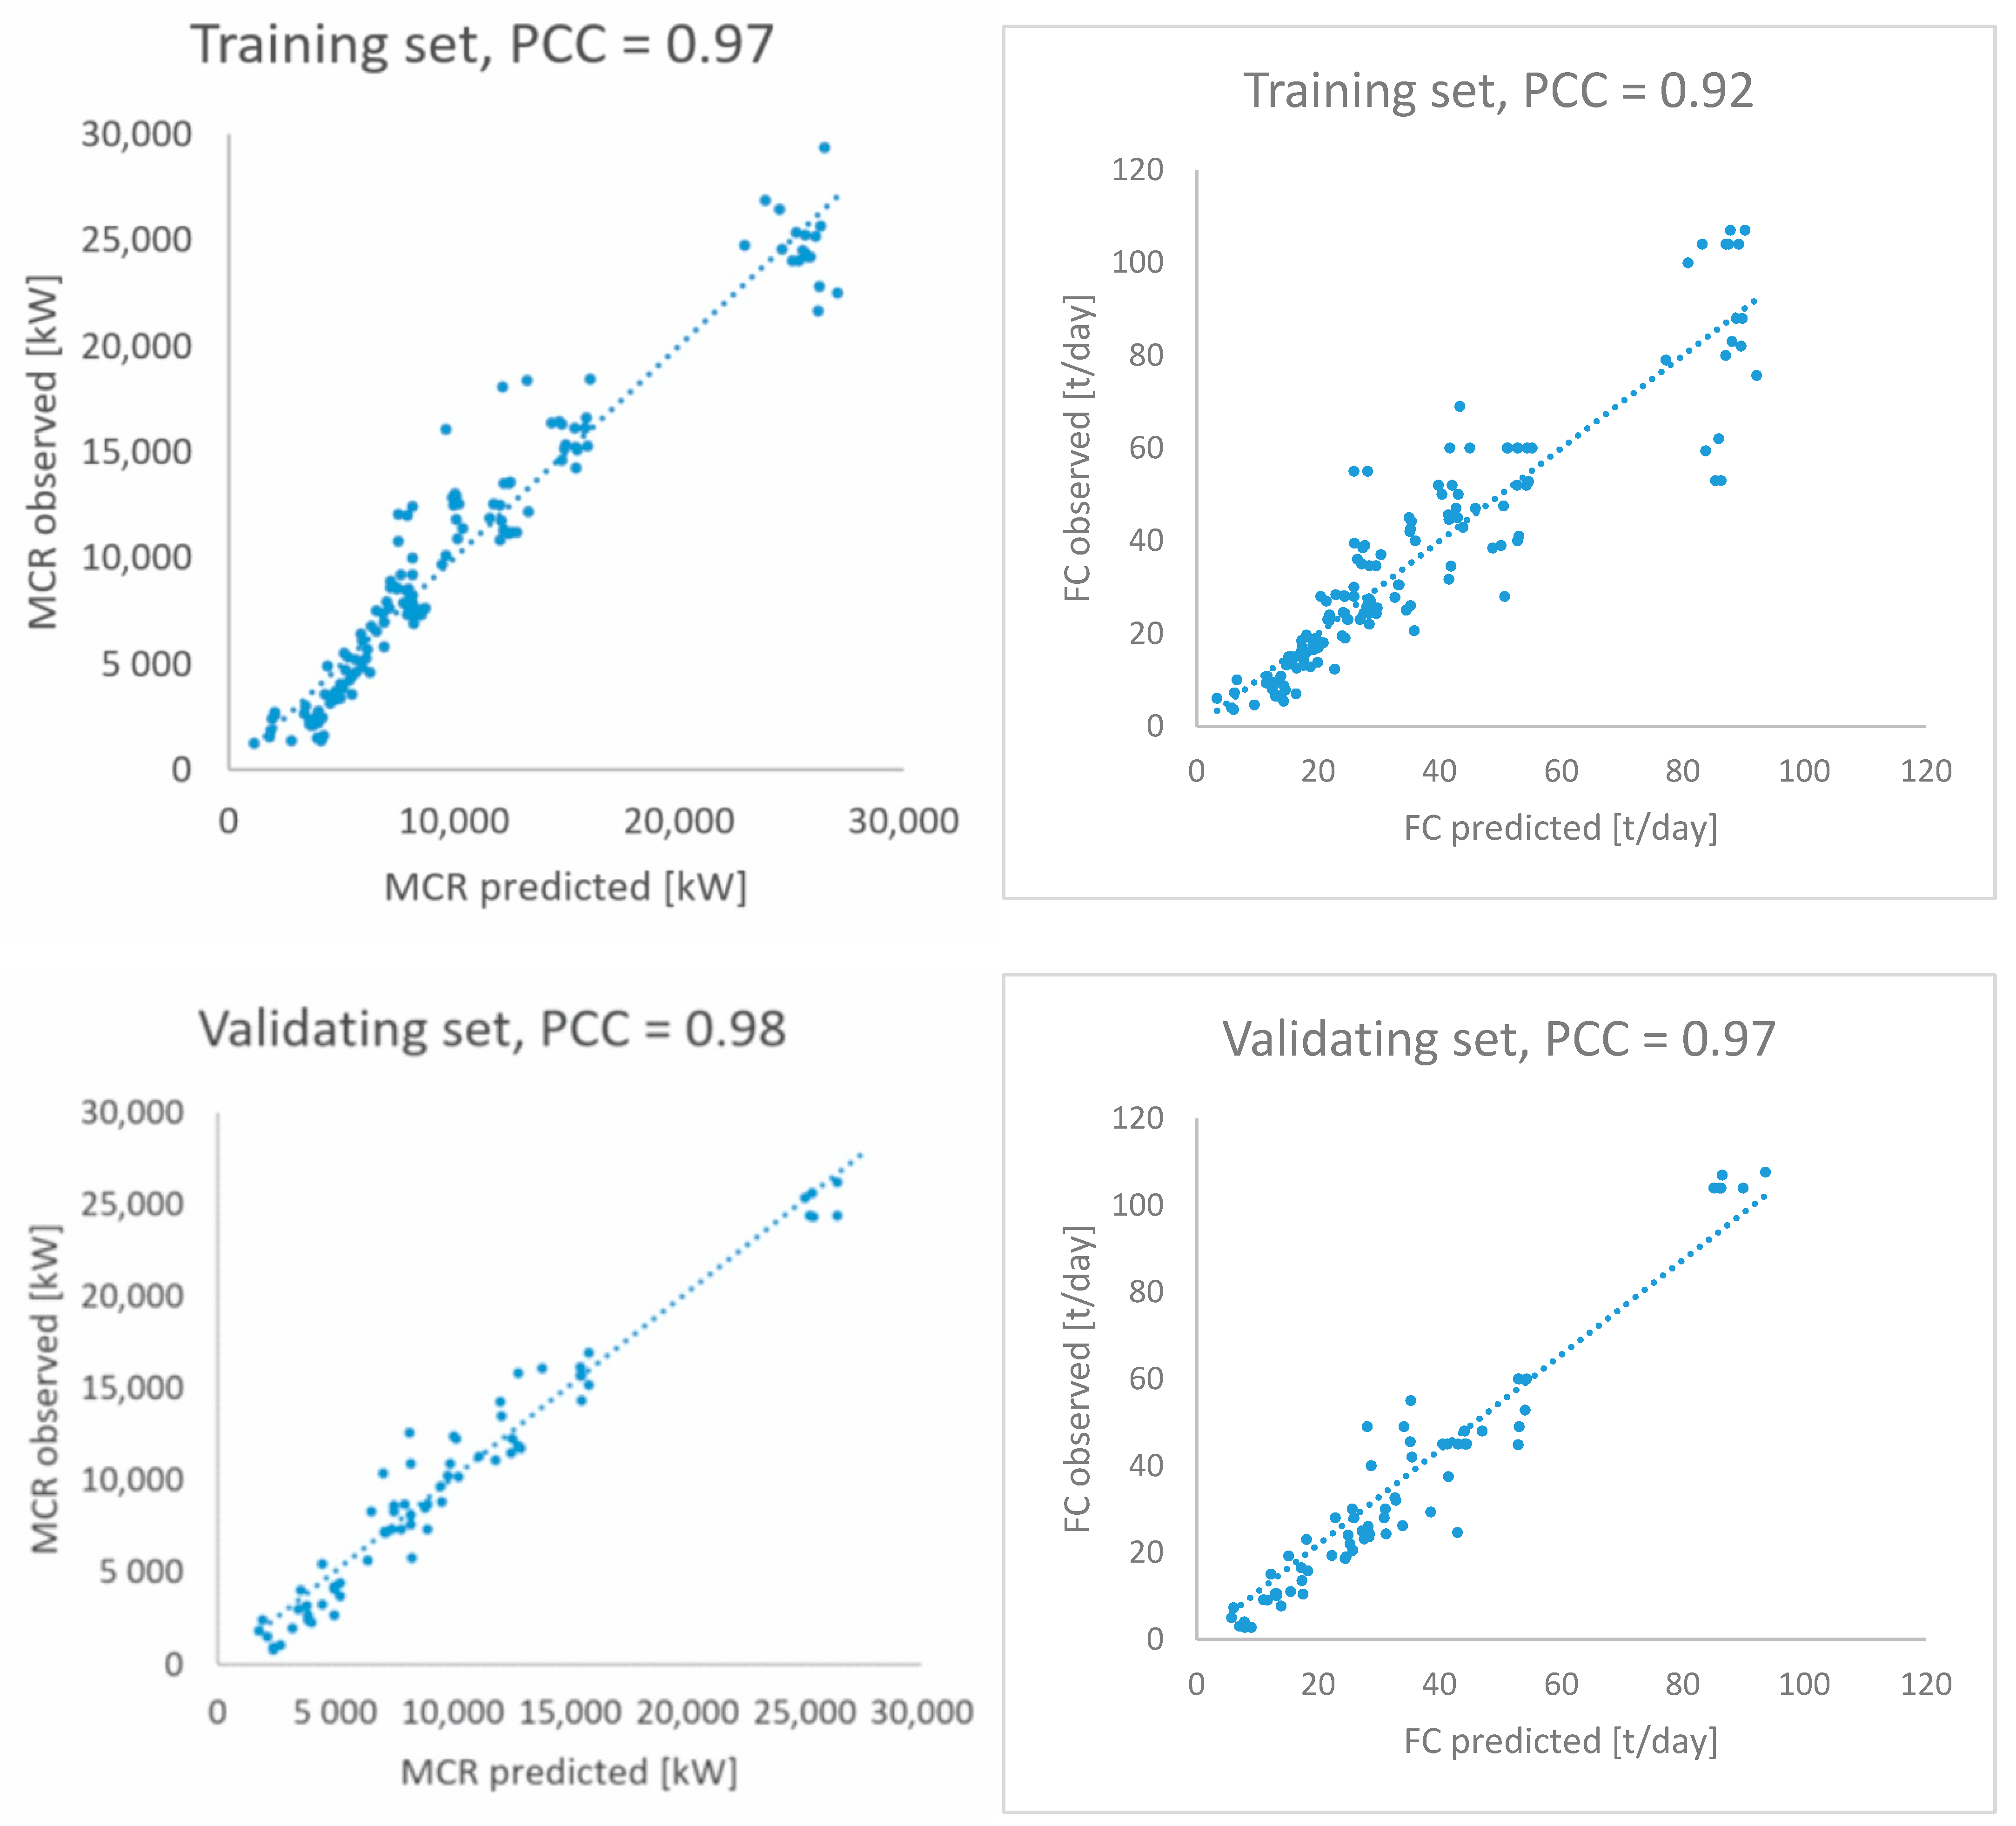
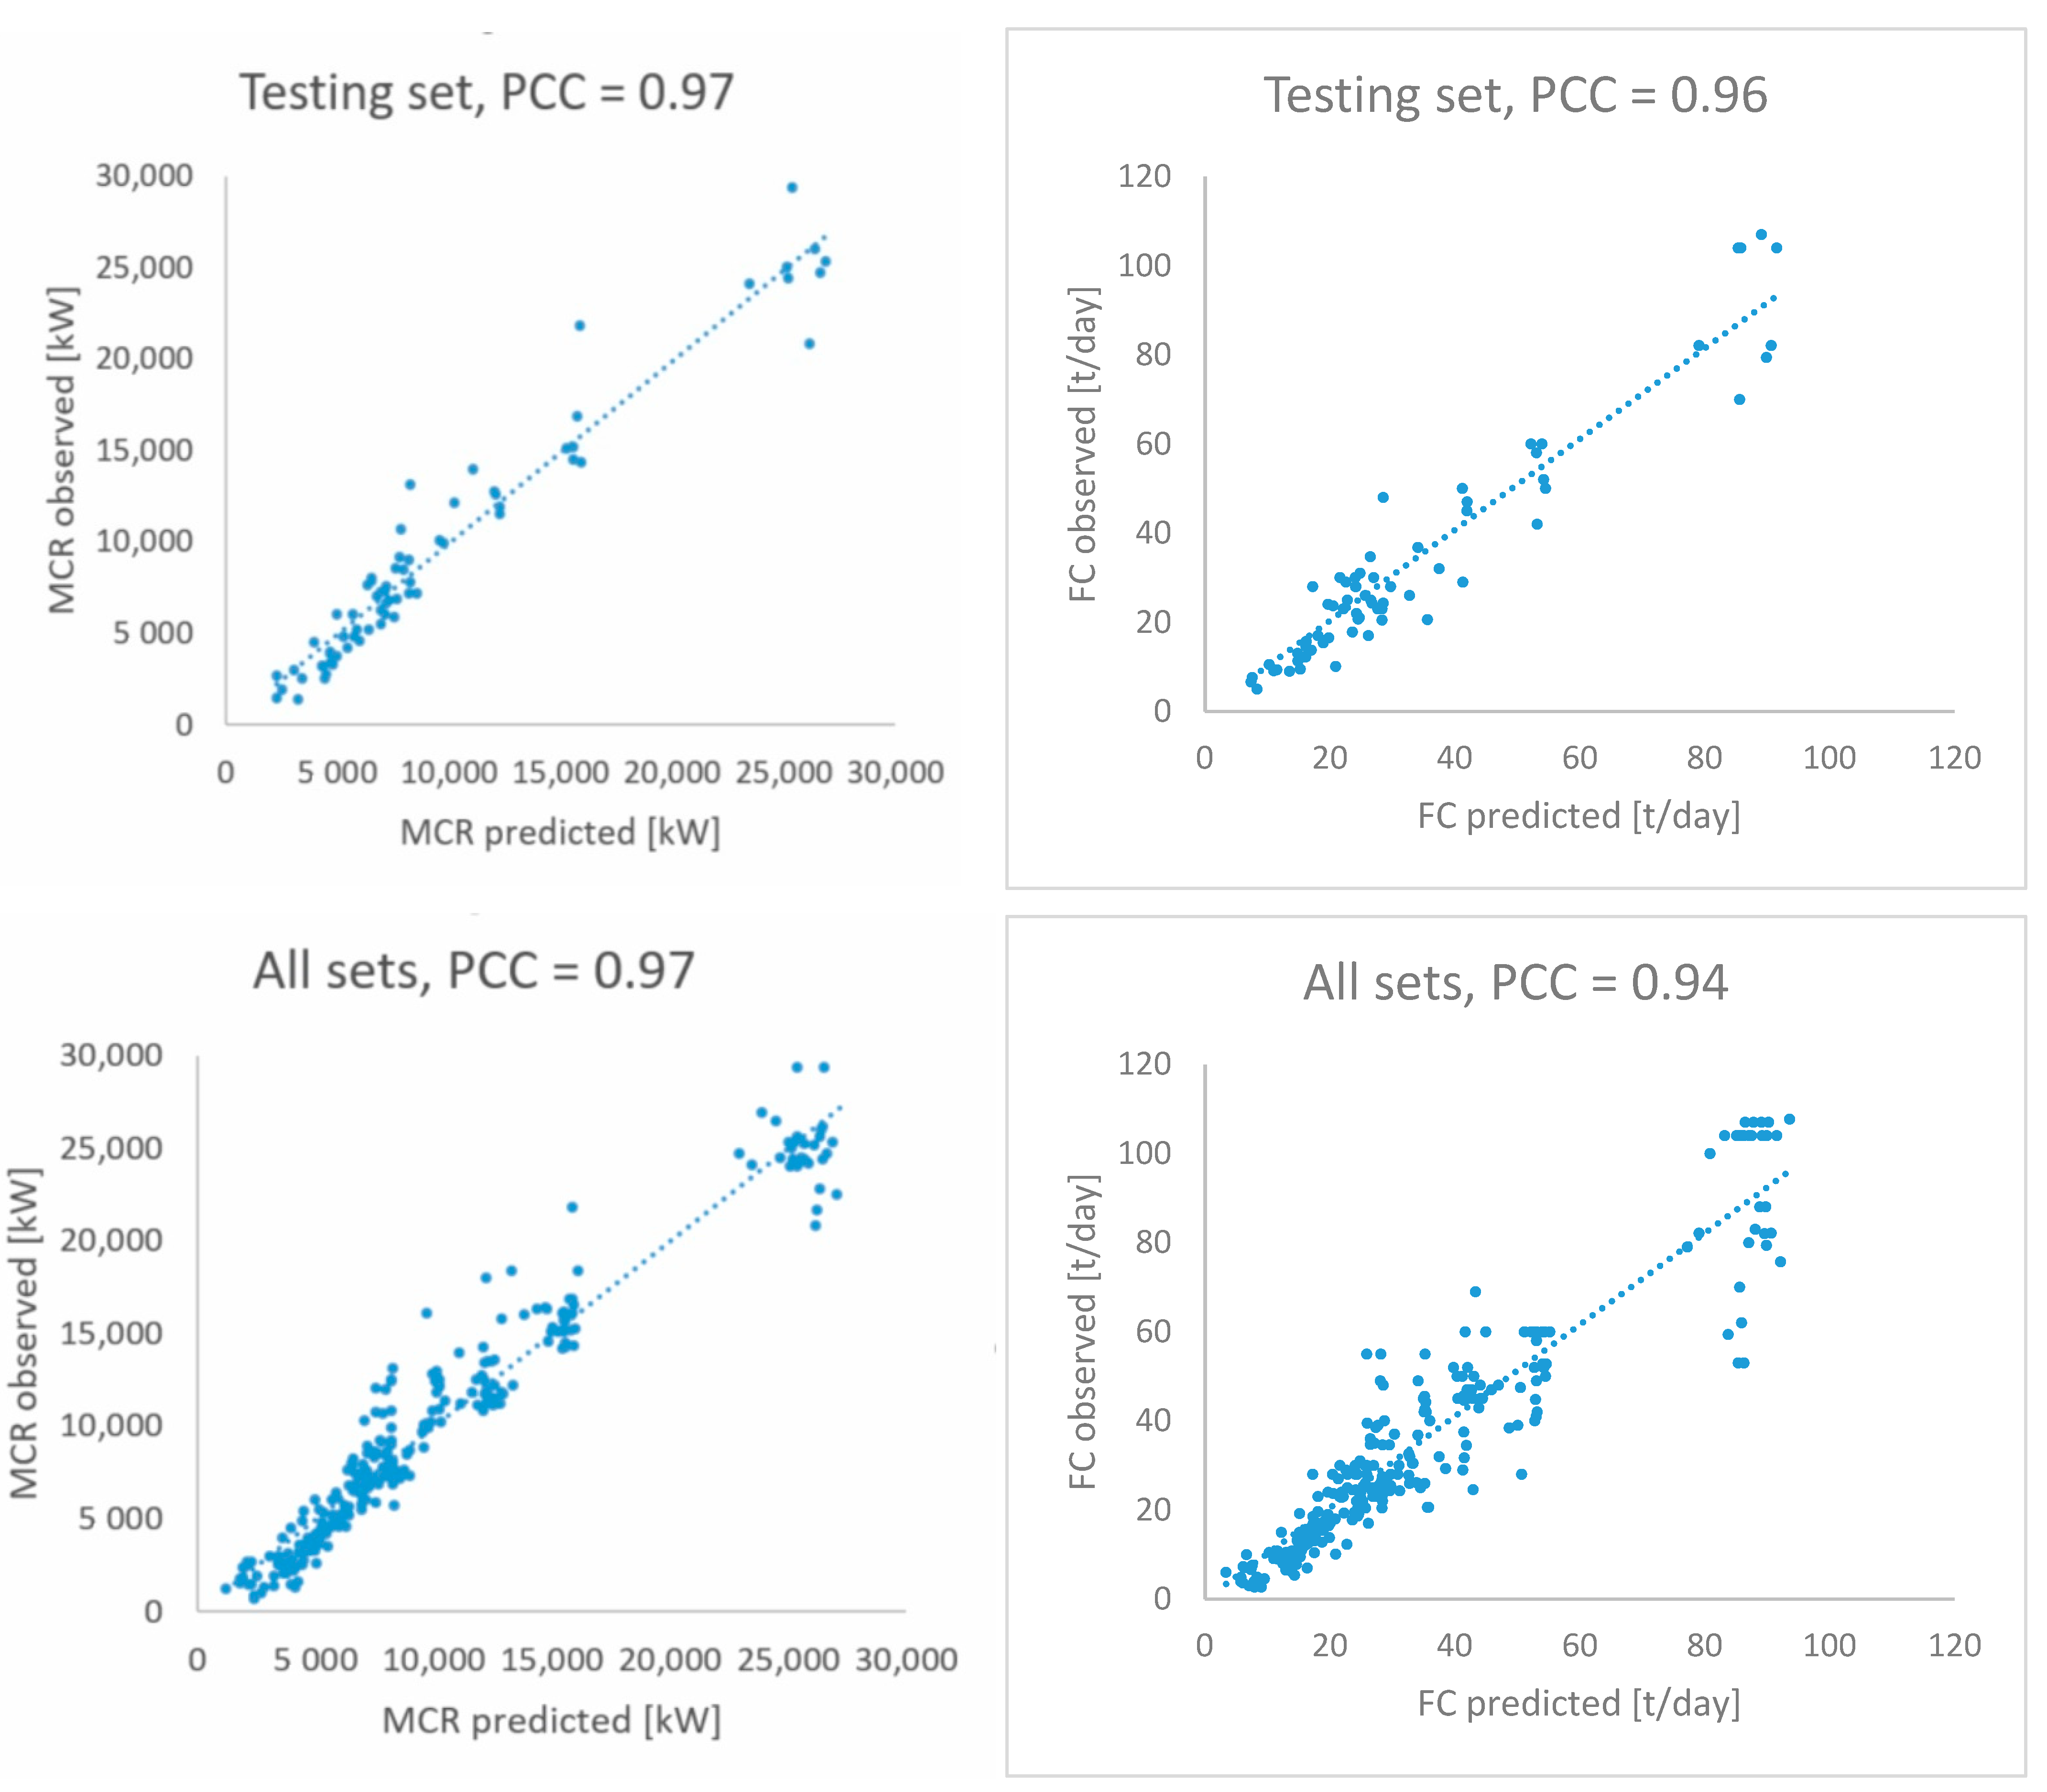
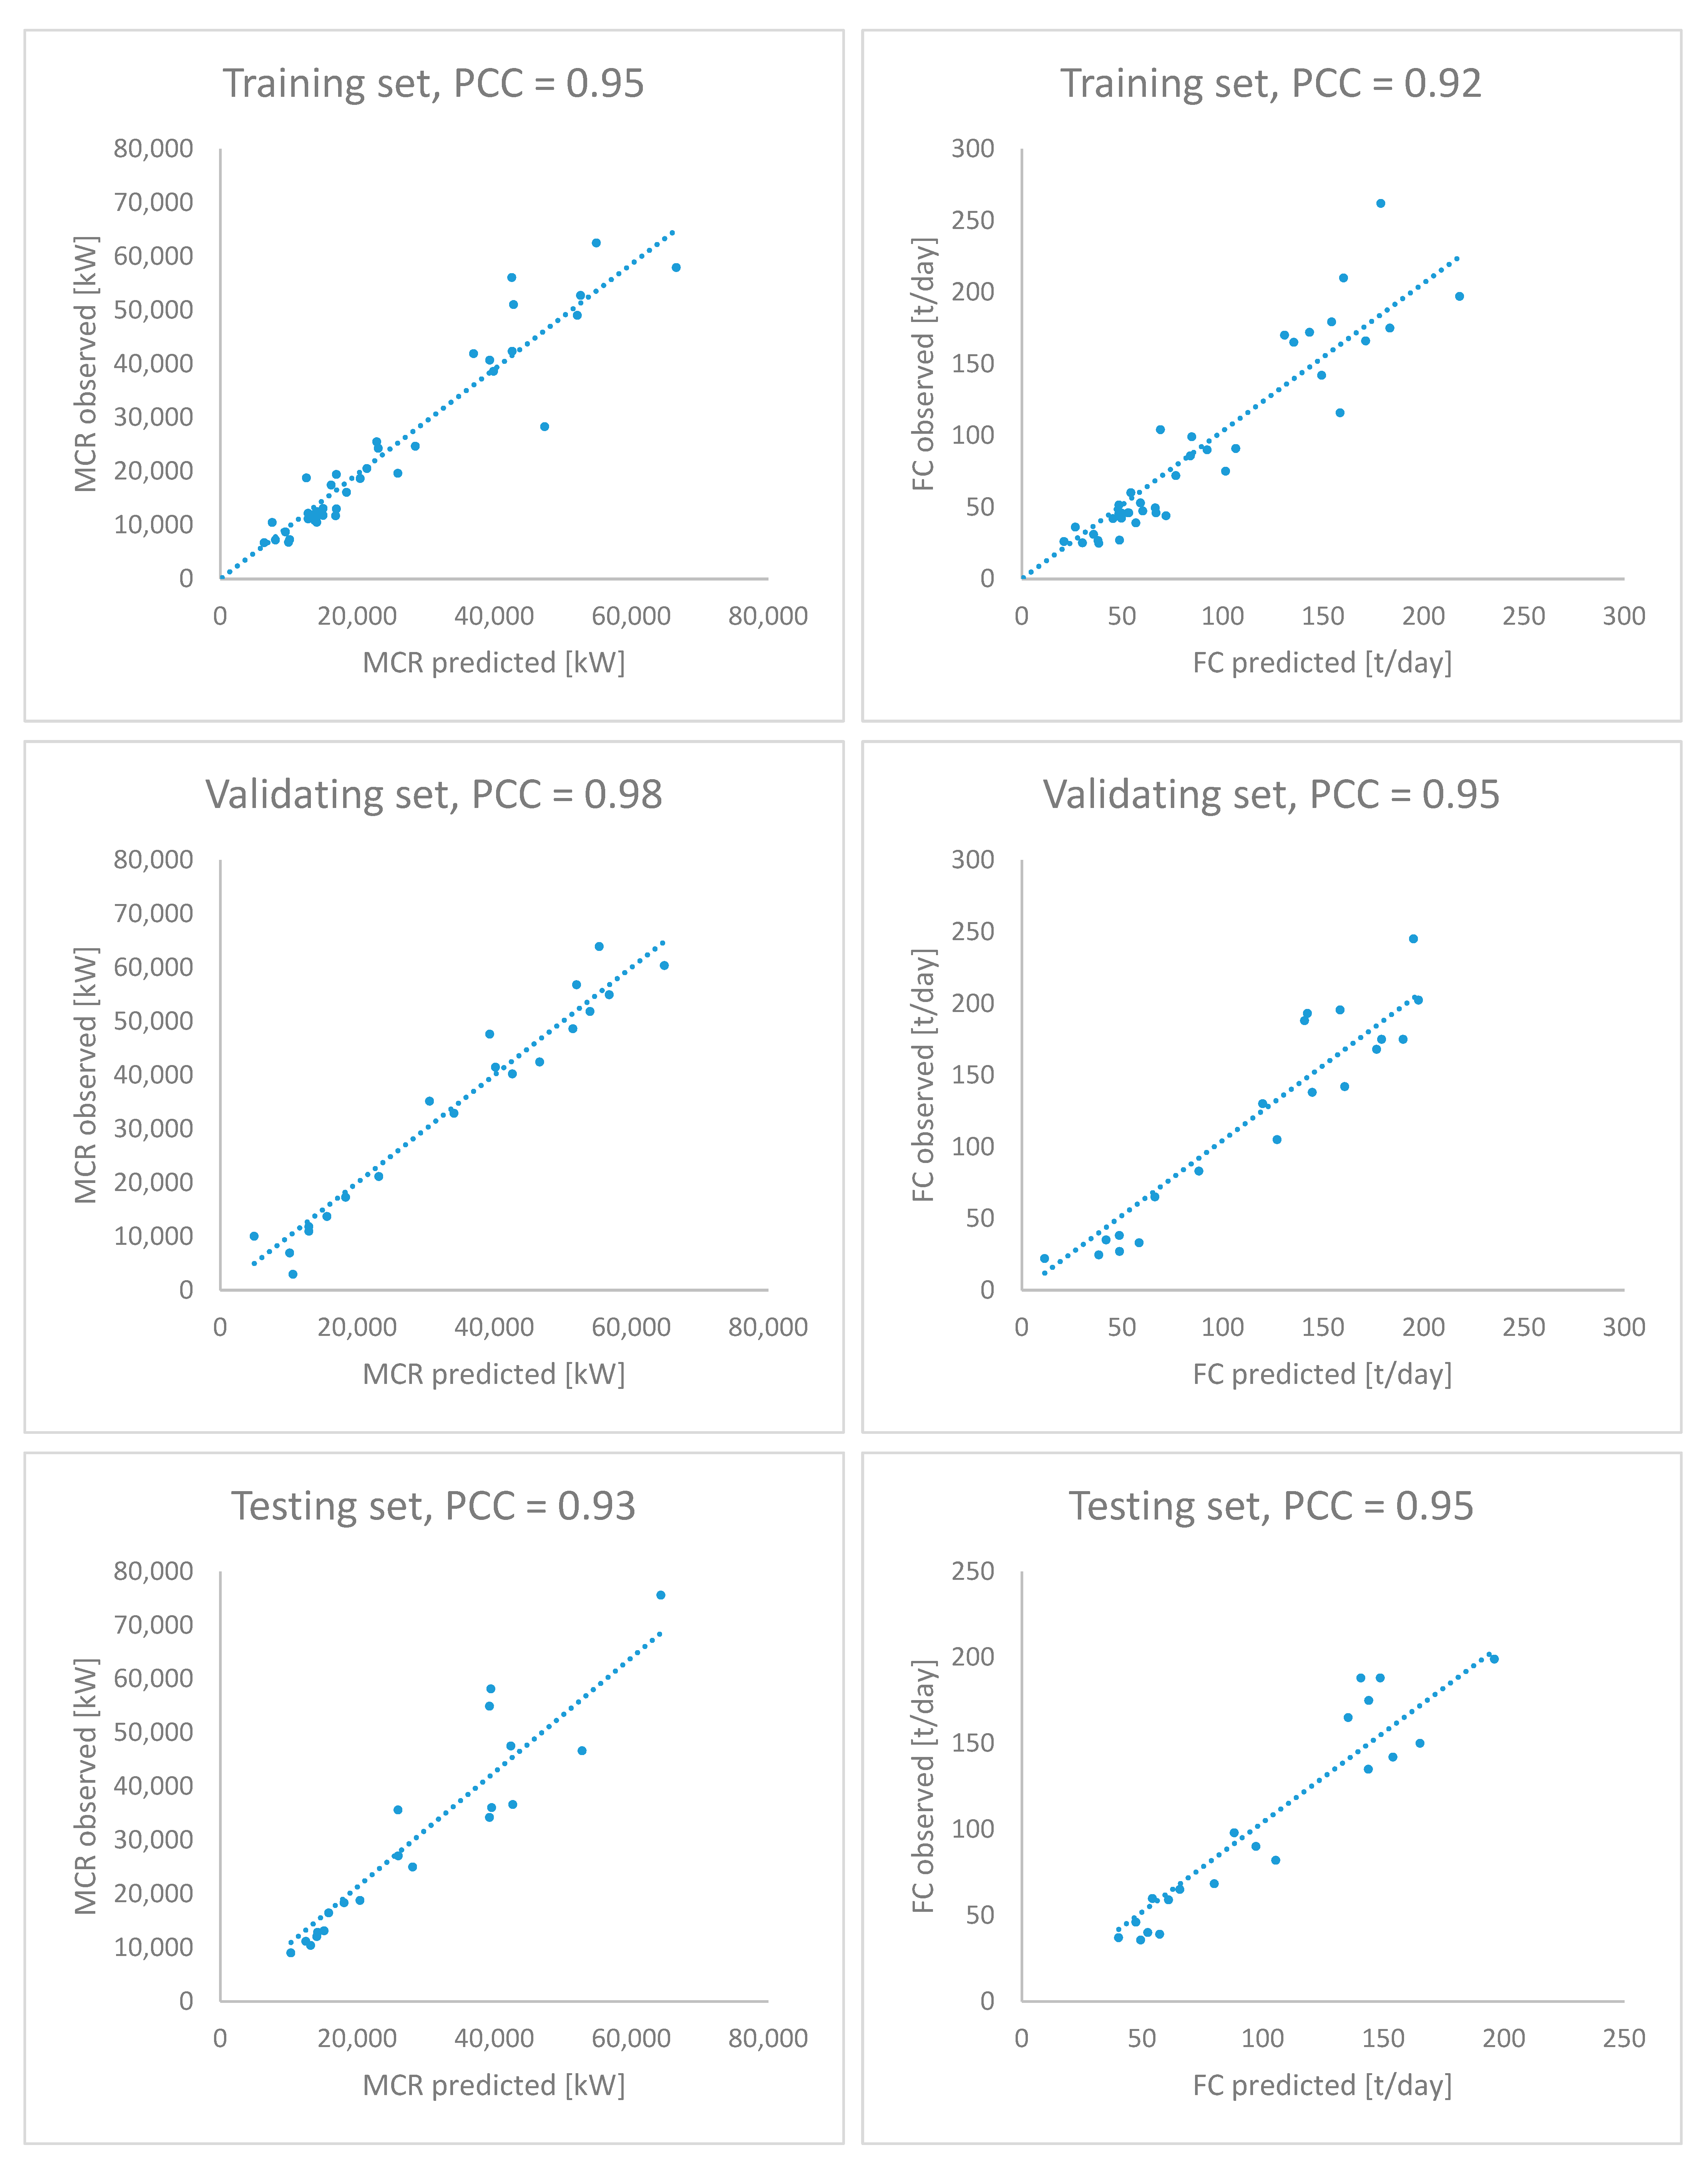
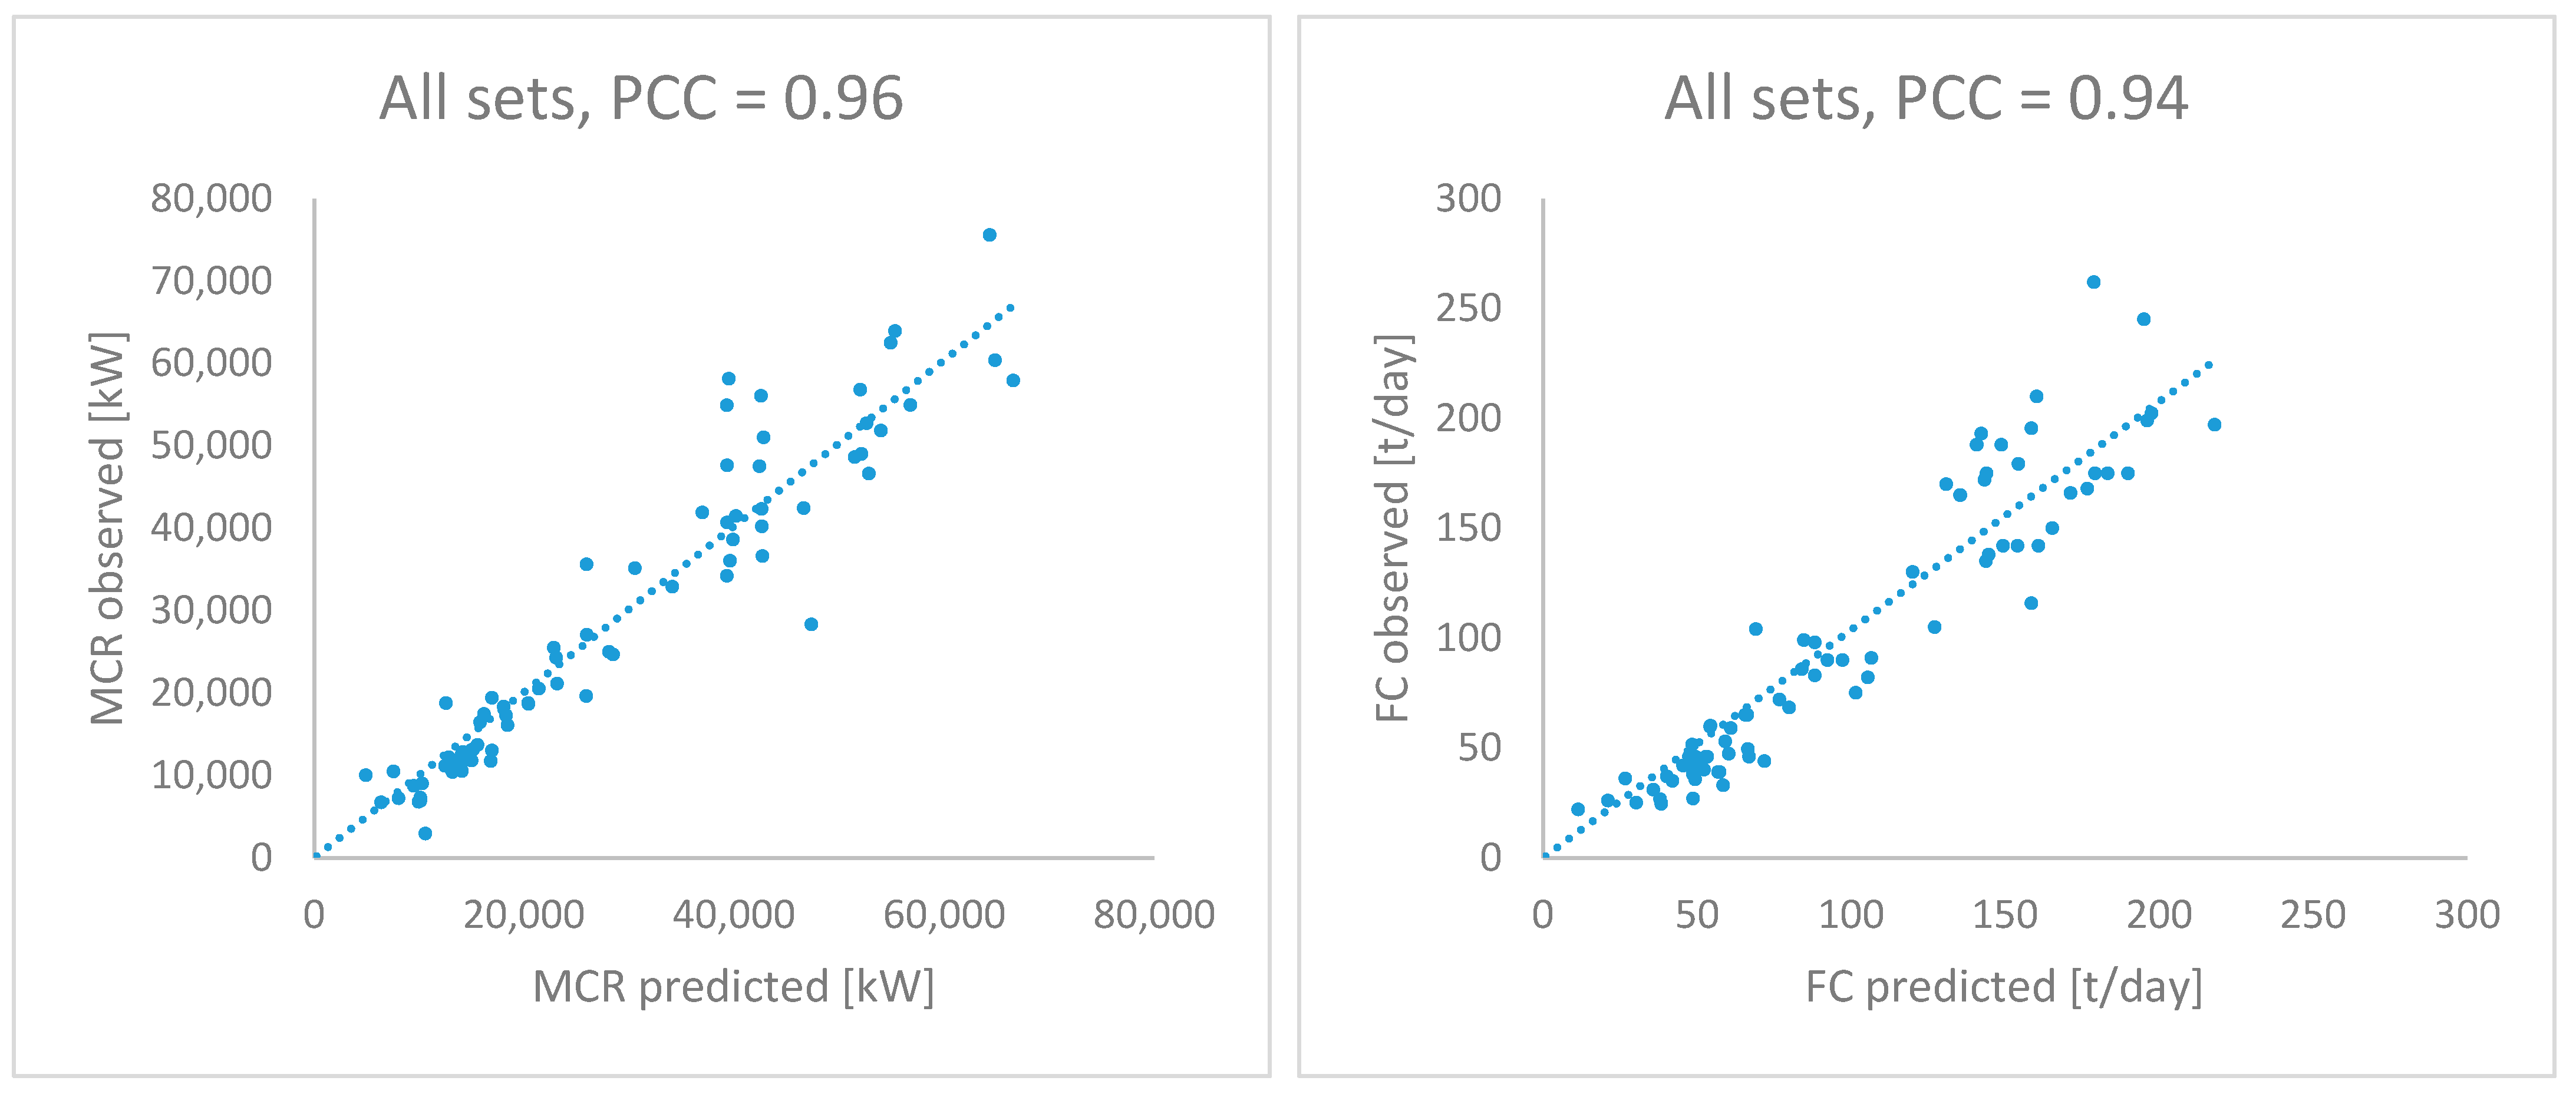
These values are relatively low. The statistics for the test sets are especially important since the data in these sets are only used to test the networks, not to develop them. The test set statistic values were used to verify the ability of the neural network to generalize new cases. The RMSE values for test data vary slightly from the statistics for training and validation sets for all developed networks. Regressions between the estimated and observed values through the use of the ANNs are shown in Figure 6, Figure 7 and Figure 8. These figures show the values of engine power (MCR) and fuel consumption (FC), observed and calculated by the use of neural networks, broken down into training, validation, test and all sets for each vessel type. Each plot in these figures shows the Pearson correlation coefficient (PCC), calculated between the observed and estimated values. Pearson correlation coefficient values were calculated as:
  • 0.97 for training, validation, test and all datasets of the ANN estimating the engine power of bulk carriers;
  • 0.93, 0.95, 0.94 and 0.94 for training, validation, test and all datasets, respectively, of the ANN estimating the fuel consumption of bulk carriers;
  • 0.97, 0.98, 0.97 and 0.97 for training, validation, test and all datasets, respectively, of the ANN estimating the engine power of tankers;
  • 0.92, 0.97, 0.96 and 0.94 for training, validation, test and all datasets, respectively, of the ANN estimating the fuel consumption of tankers;
  • 0.95, 0.98, 0.93 and 0.96 for training, validation, test and all datasets, respectively, of the ANN estimating the engine power of container carriers;
  • 0.92, 0.95, 0.95 and 0.94 for training, validation, test and all datasets, respectively, of the ANN estimating the fuel consumption of container carriers.
These results indicate that the measured and estimated values are all consistent. As a result, the developed neural networks are probably not overfitted and could have good generalization abilities.
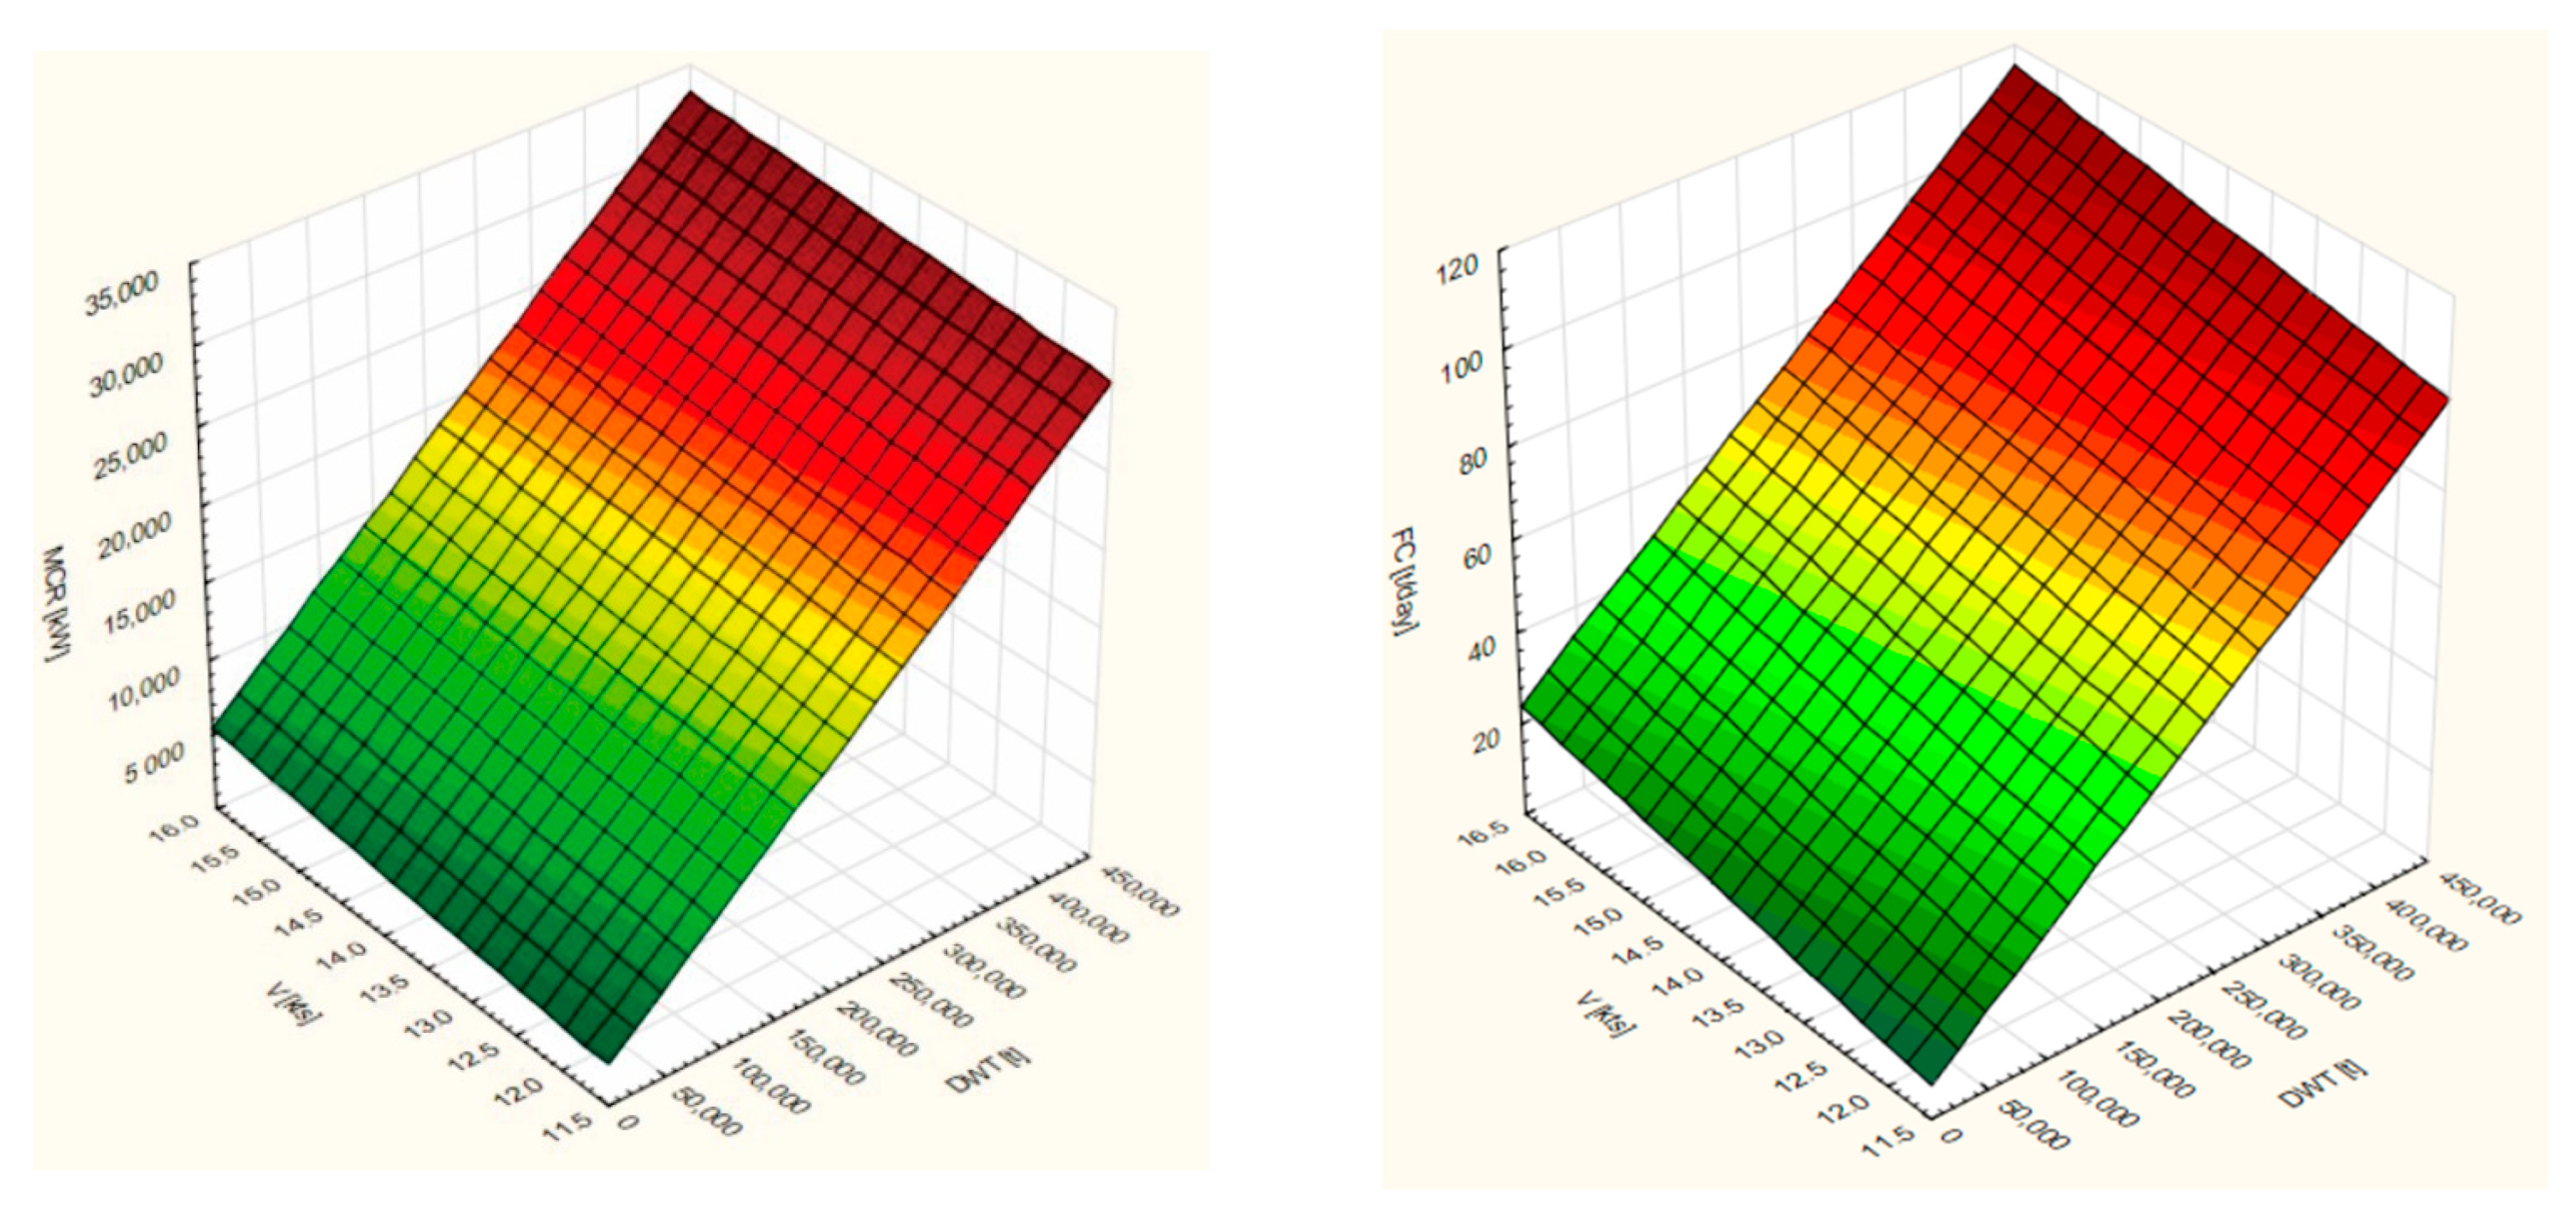
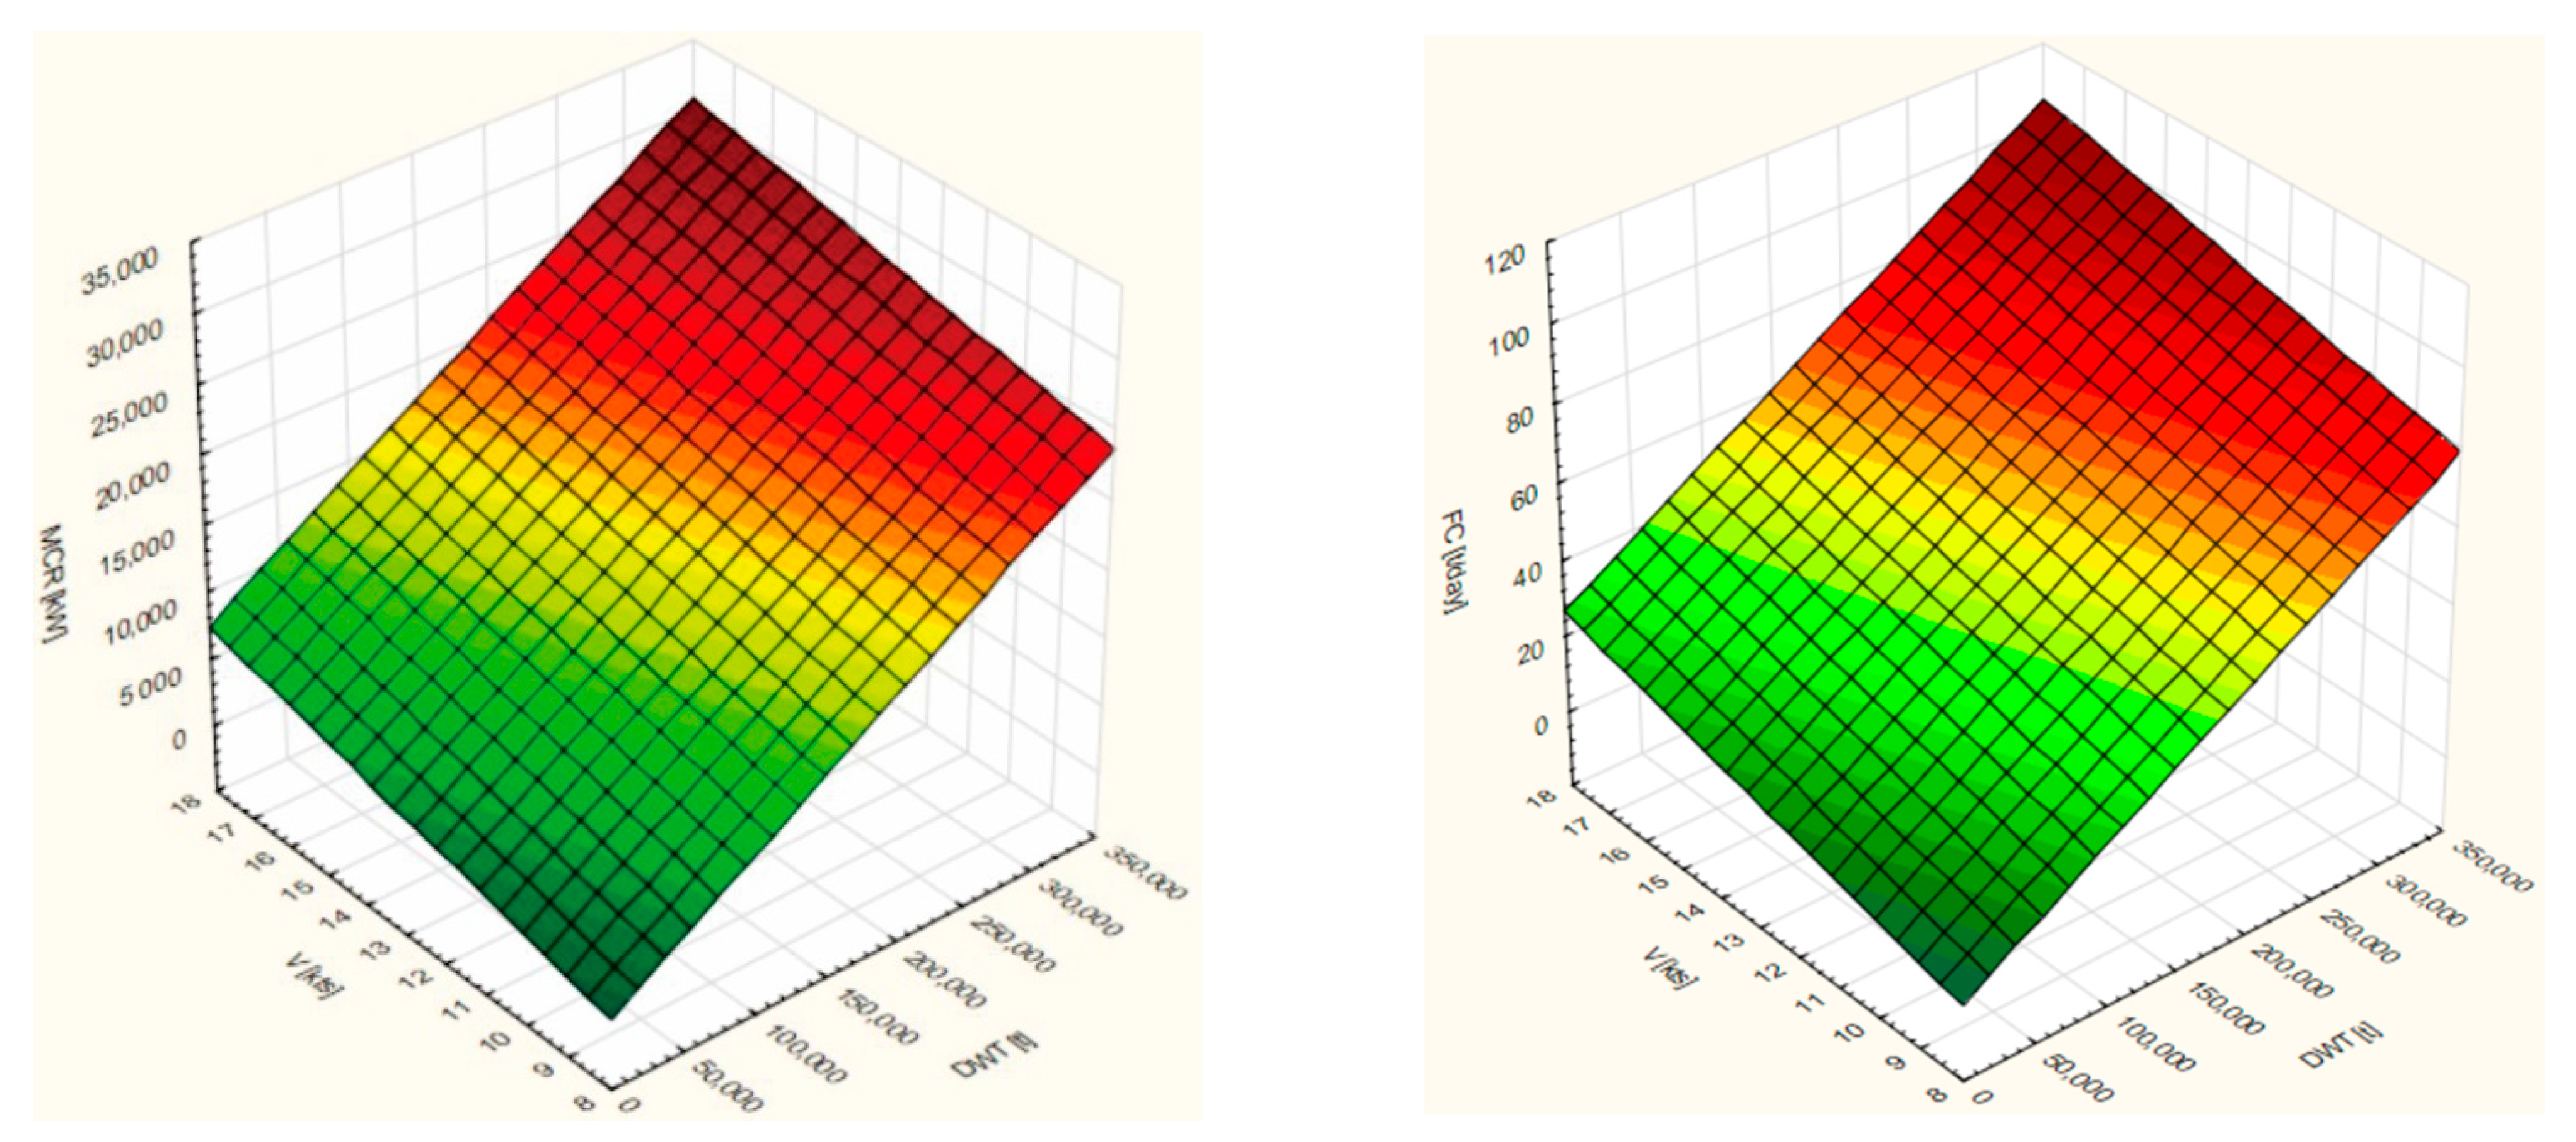
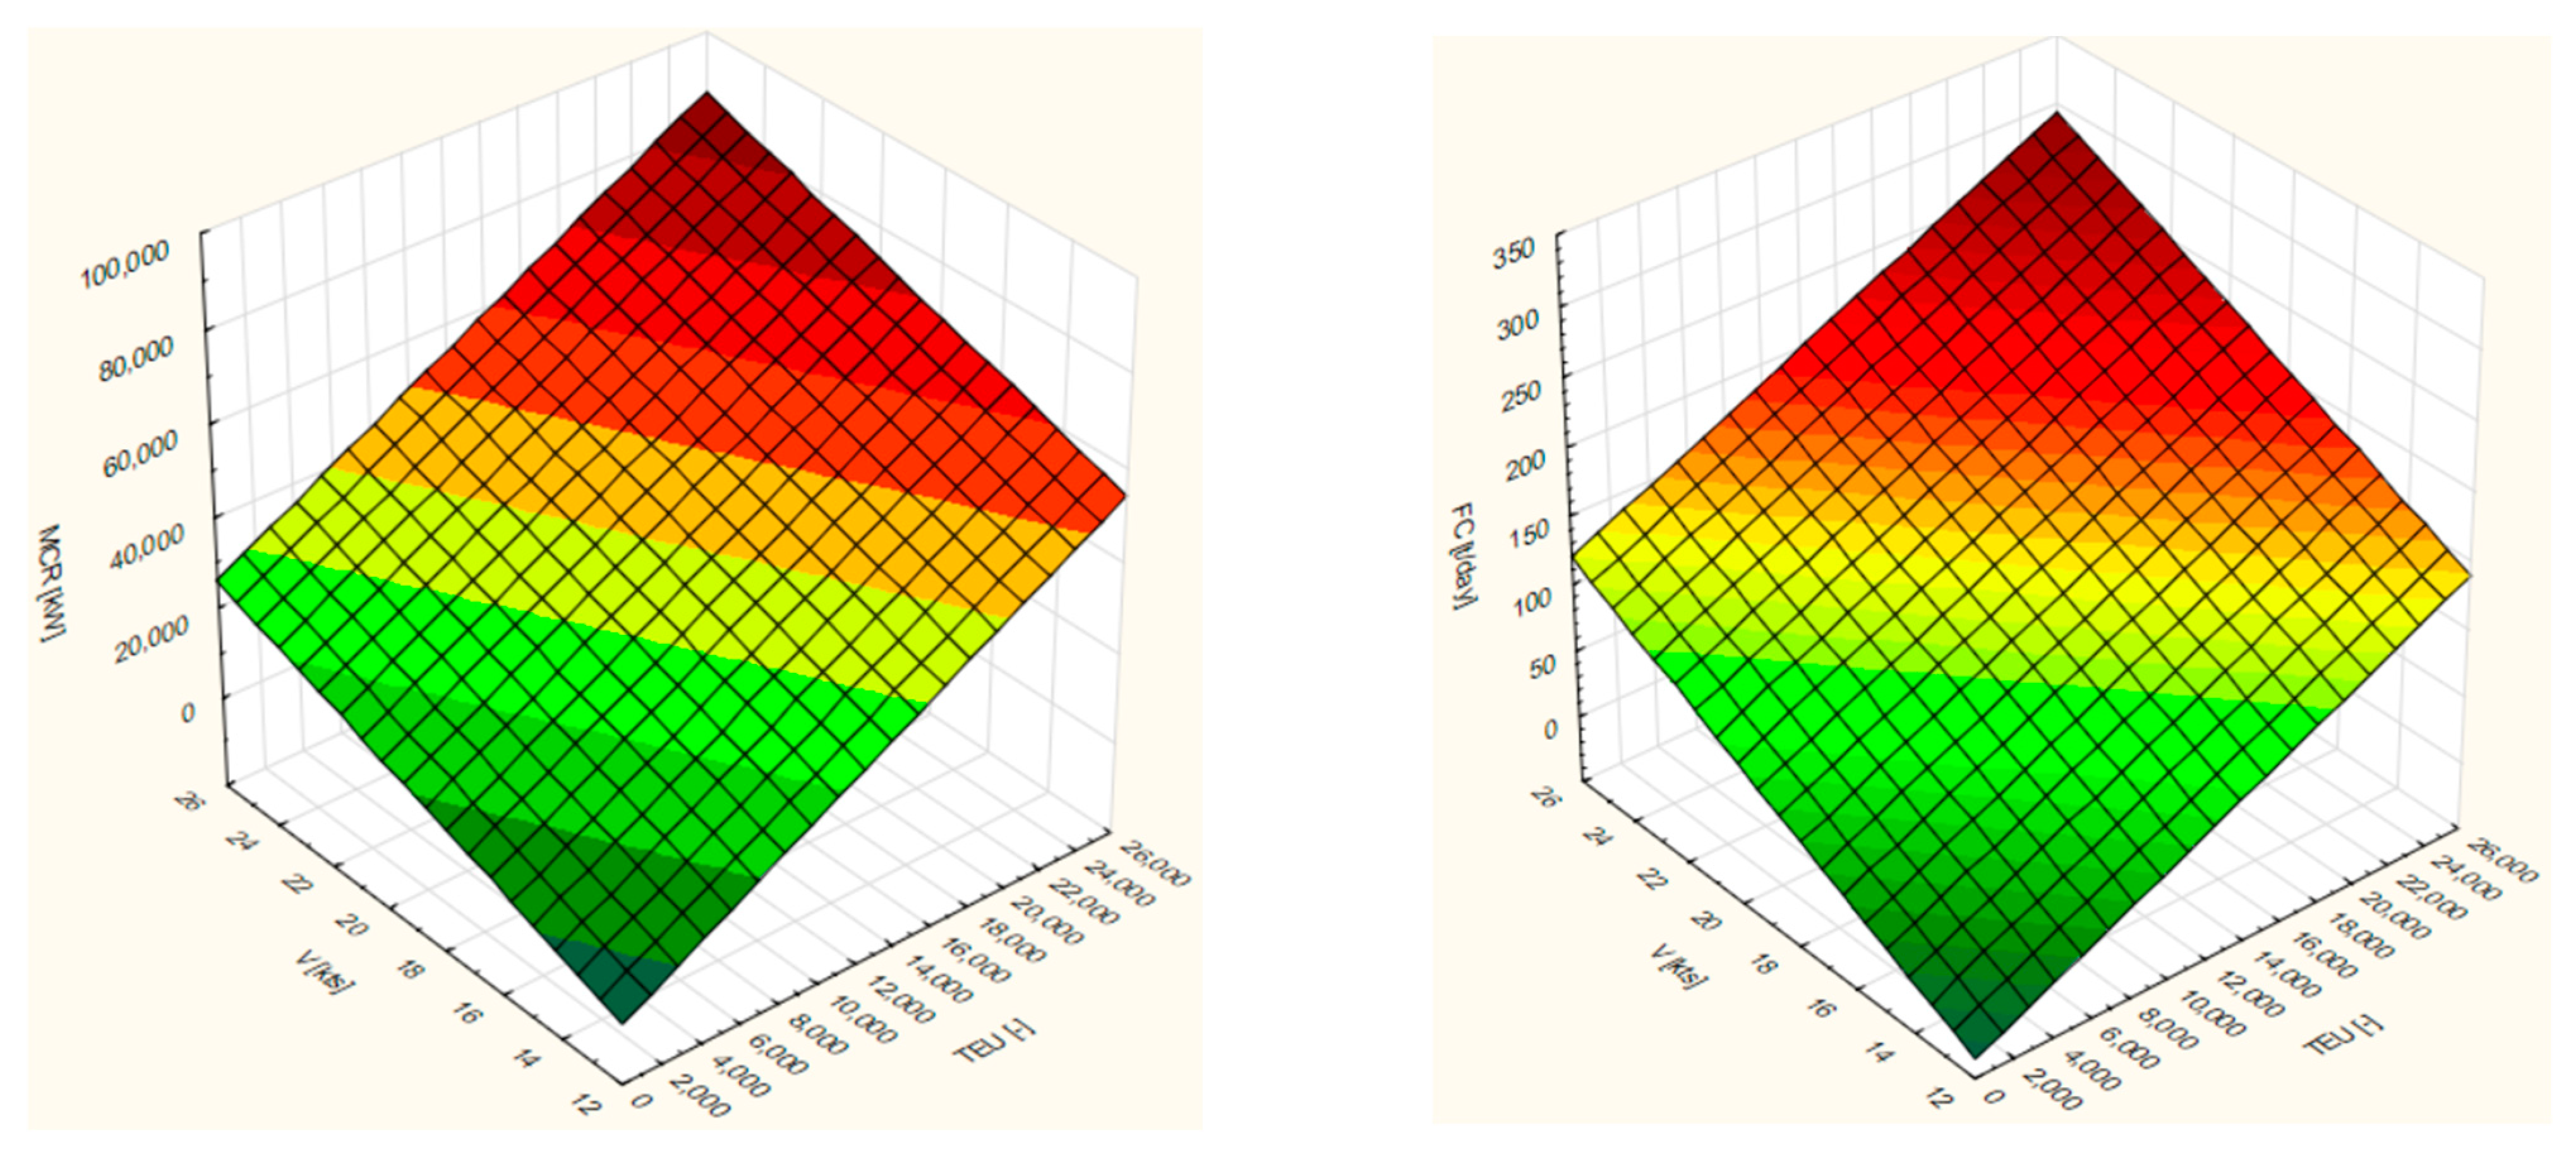
Figure 9, Figure 10 and Figure 11 show the estimated MCR and FC values in the full range of DWT/TUE capacity and ship velocity calculated through the use of Equations (7)–(12). The surfaces in these graphs show that the neural network estimations are characterized by appropriate trends, i.e., fuel consumption and engine power rise as TEU/DWT capacity and vessel speed increase.
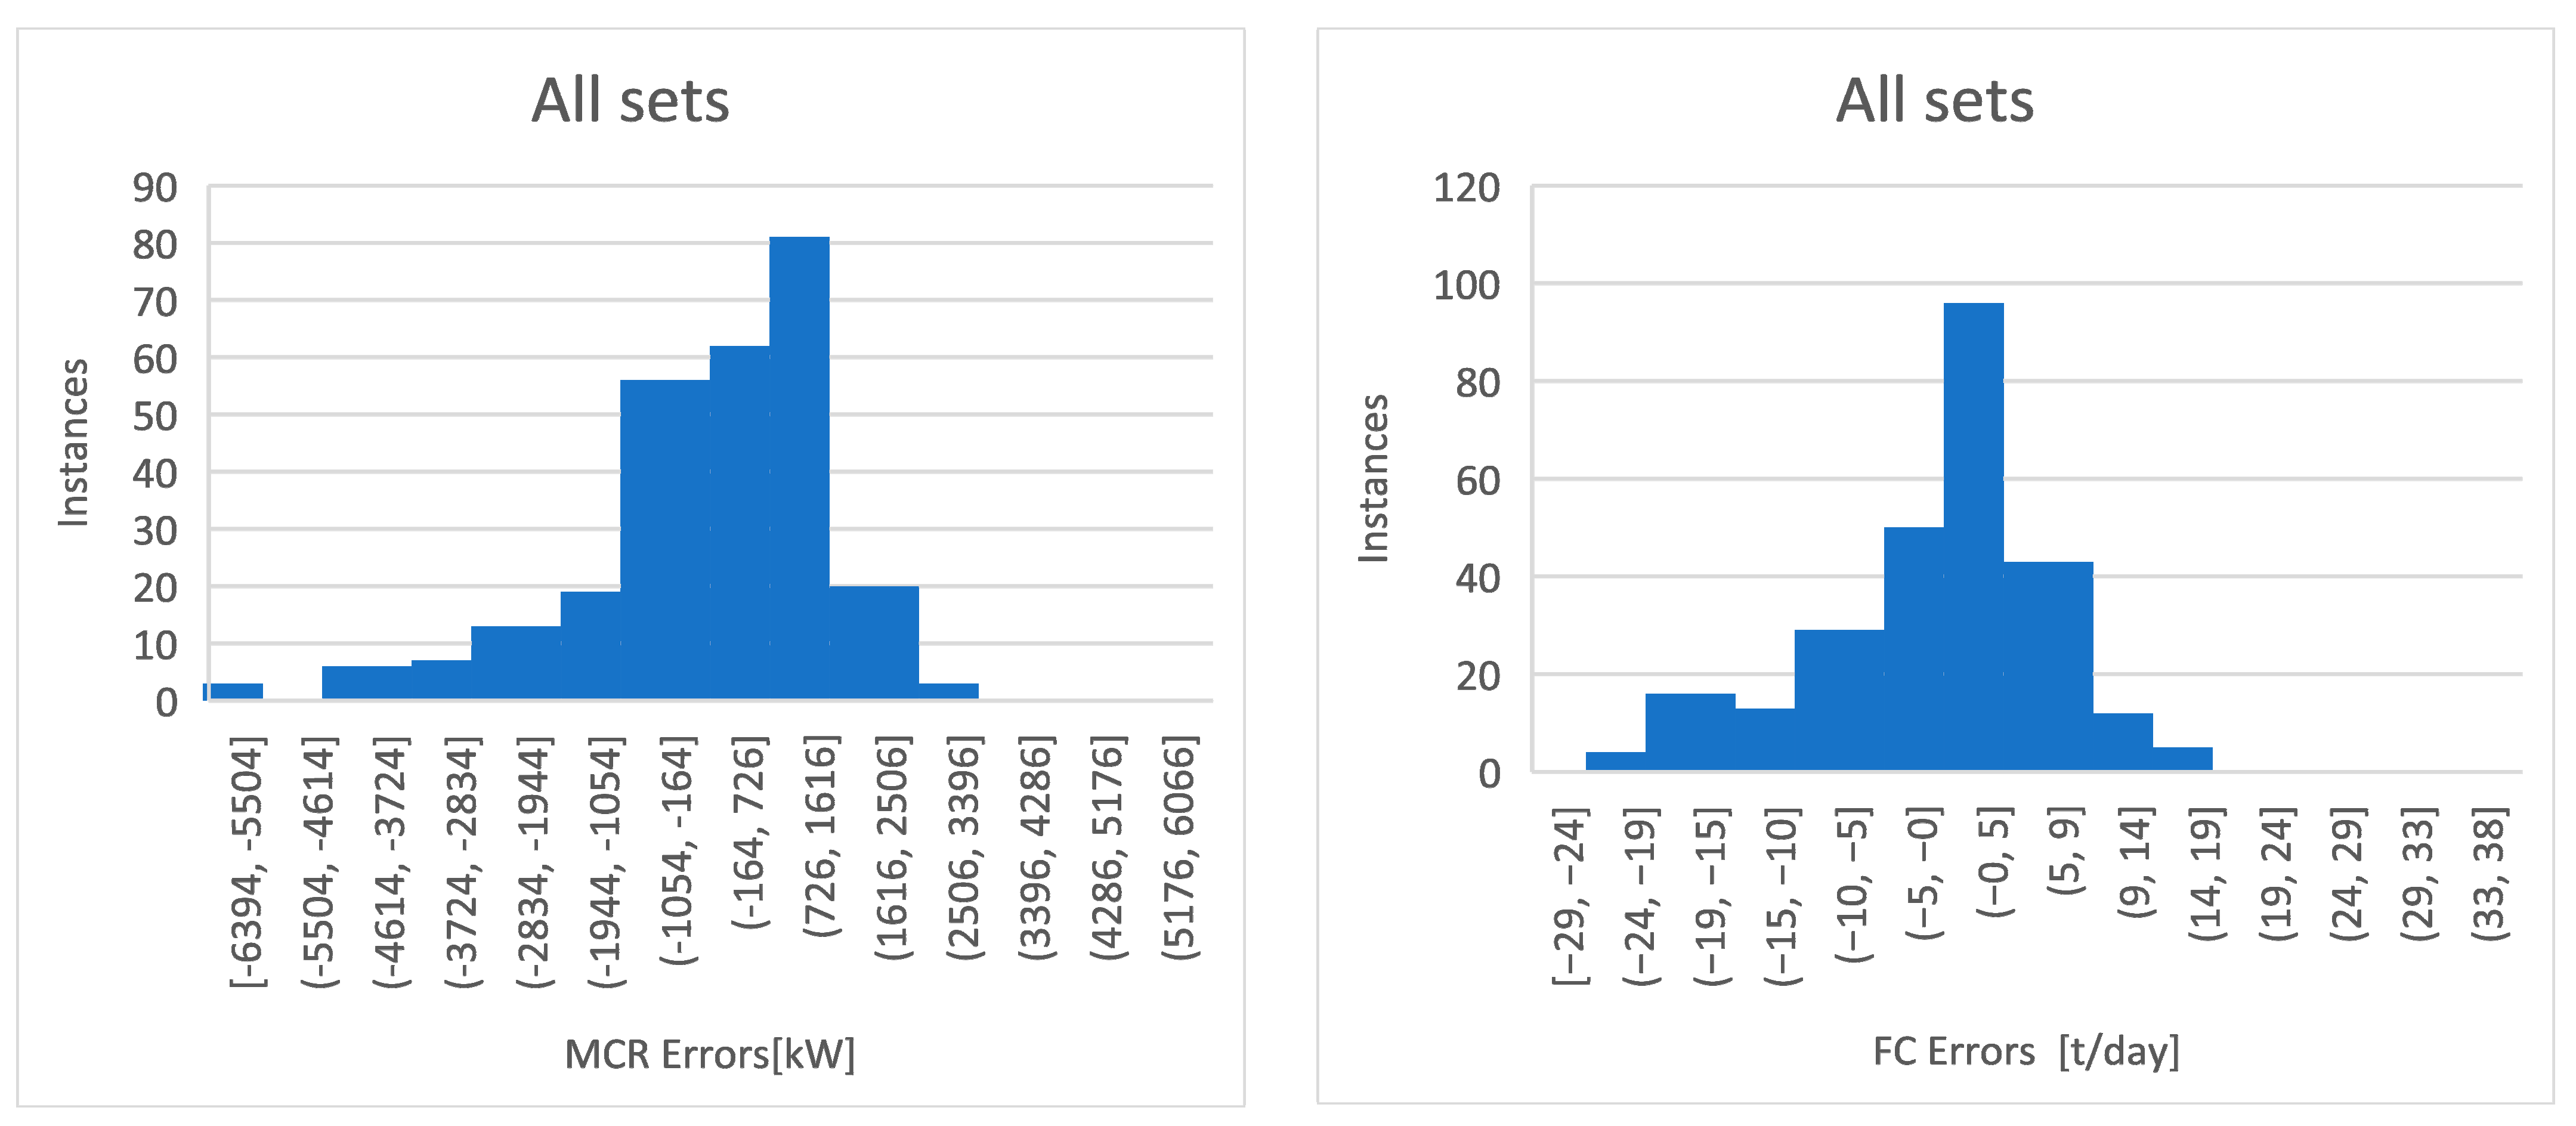
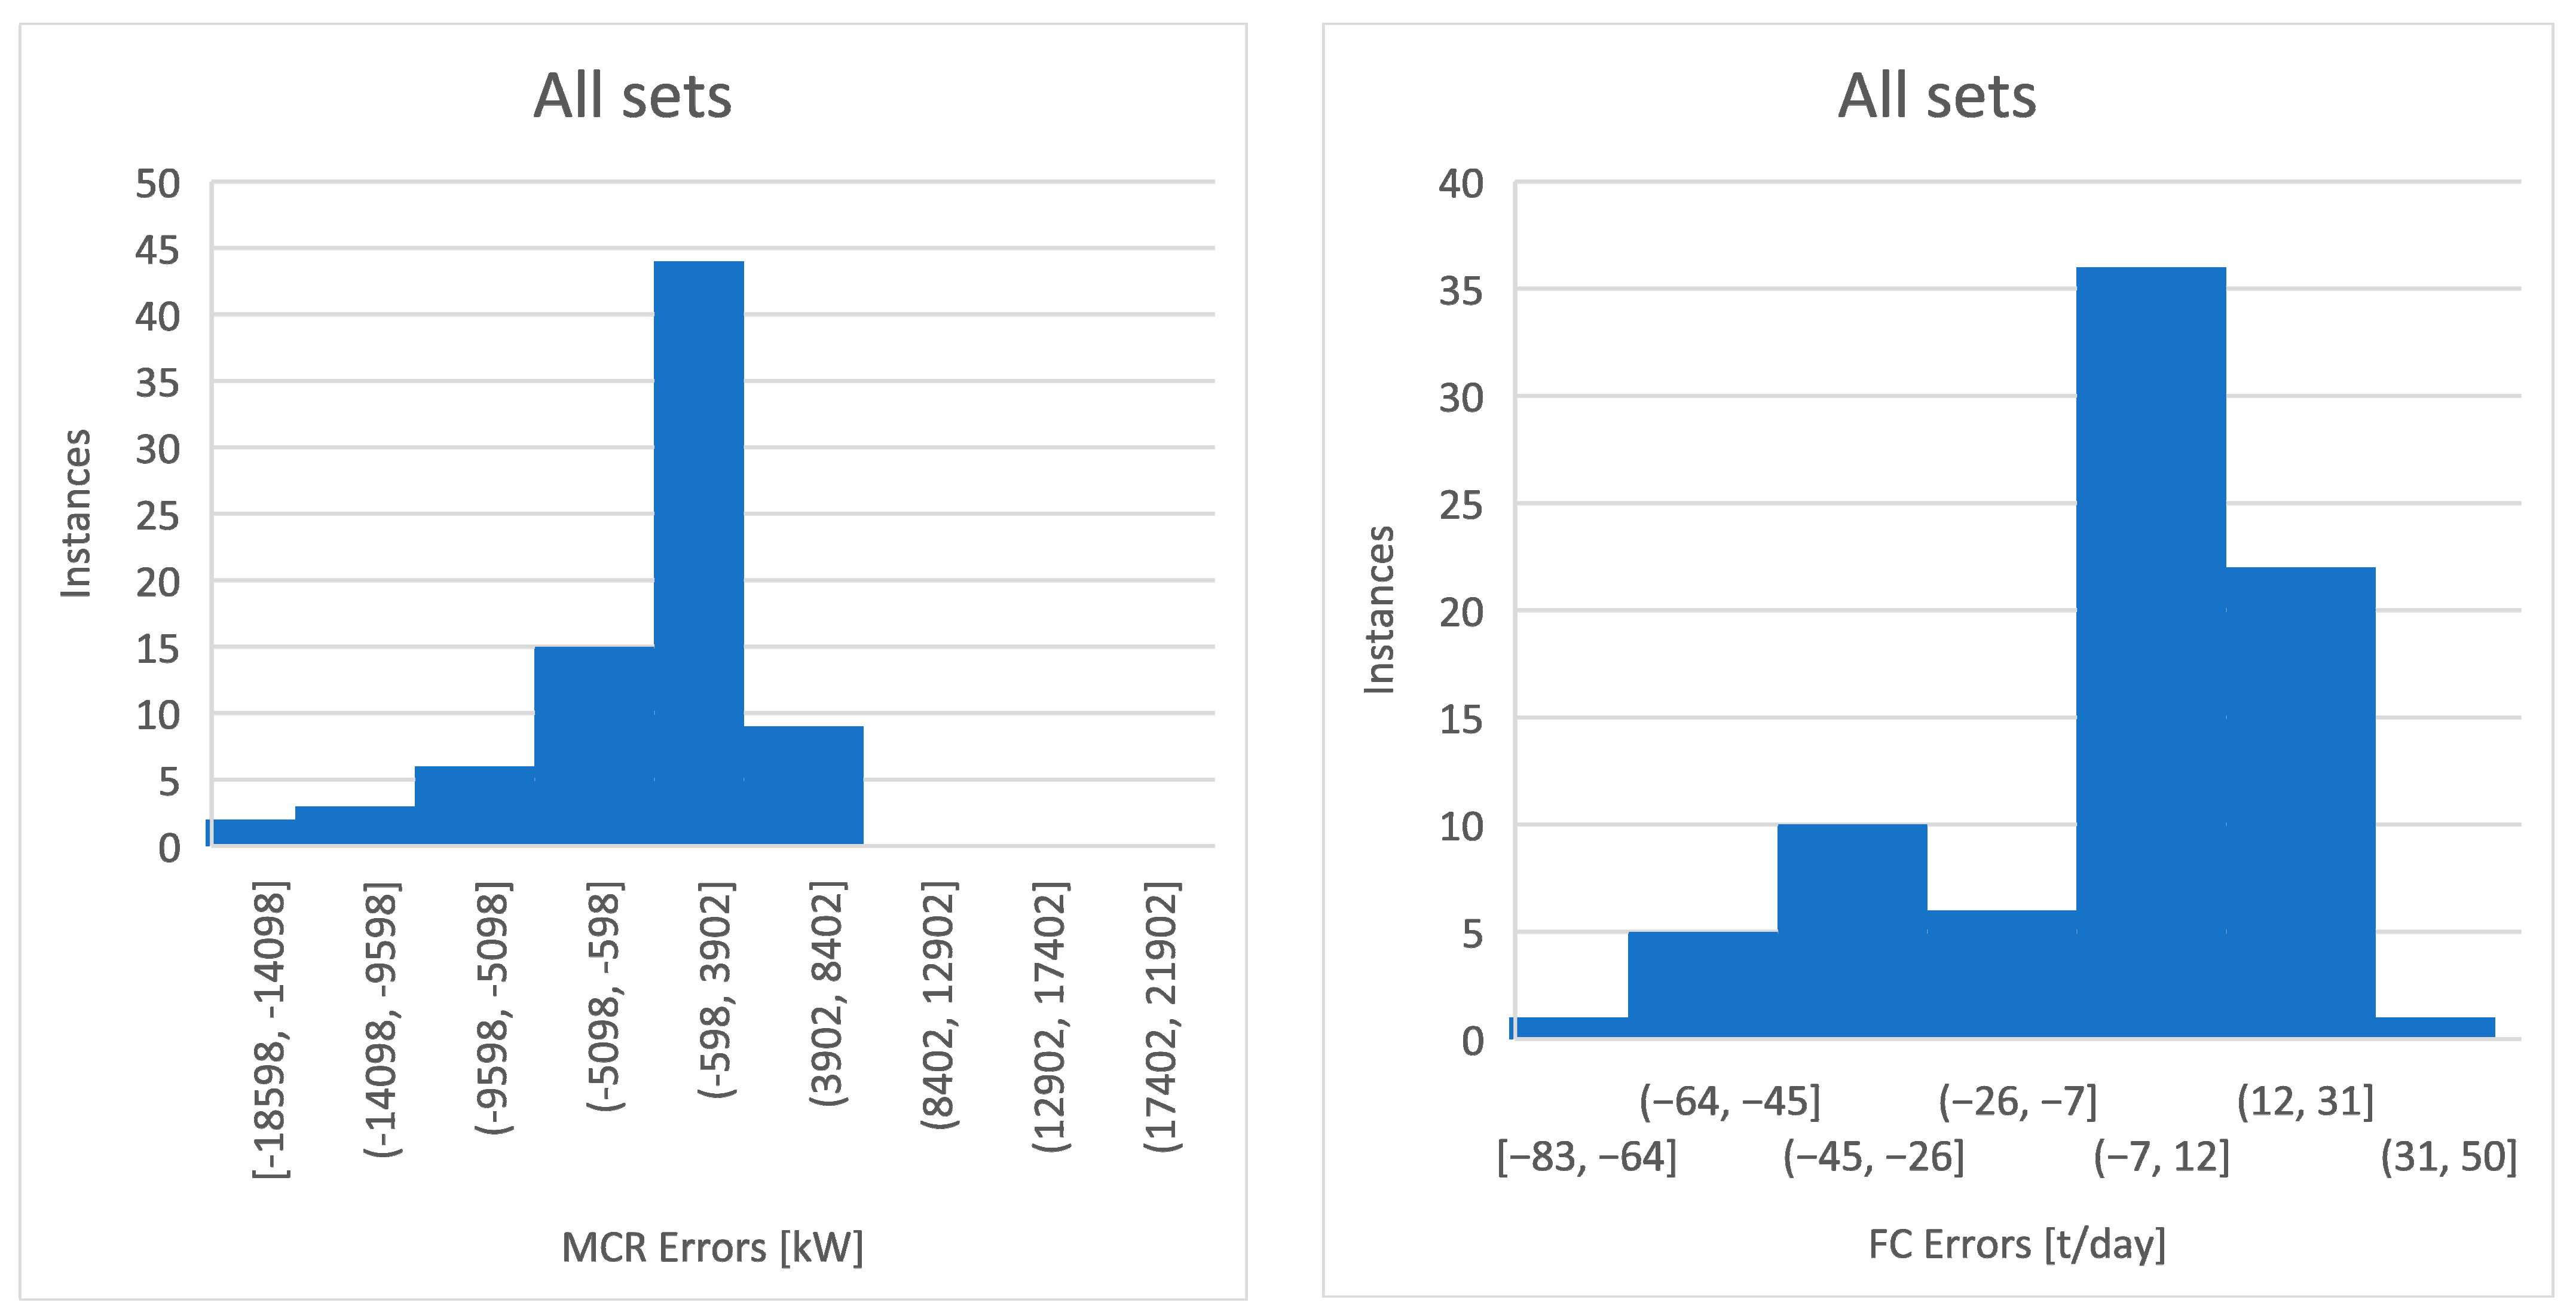
Figure 12, Figure 13 and Figure 14 show the error histograms of the artificial neural networks used to estimate the engine power (MCR) and fuel consumption (FC) for all sets and ship types. The errors were calculated as the difference between the estimated and observed values of MCR or FC. The error value indicates the difference between the observed and estimated value. These figures indicate that the largest portion of data coincided in the error ranges:
  • From −600 to 1500 kW and from −9 to 6 t/day for the ANN estimating the engine power and fuel consumption of bulk carriers, respectively;
  • From −1000 to 1600 kW and from −10 to 9 t/day for the ANN estimating the engine power and fuel consumption of tankers, respectively;
  • From −600 to 3900 kW and from −7 to 31 t/day for the ANN estimating the engine power and fuel consumption of container carriers, respectively.
It is clear from the above data that the neural network for estimating the propulsion power and fuel consumption of bulk carriers offers the smallest error range, and the ANN for estimating the propulsion power and fuel consumption of container carriers offers the largest range of errors. This is due to the data ranges for engine power and fuel consumption of container carriers used in this study, which were more than twice as wide as the ranges for bulk carriers and tankers.

4.2. An Example Application

This section presents an example application of the developed neural networks to estimate CO2 emissions from the ships as follows:
  • A bulk carrier with a 35,000 t DWT capacity and a speed V of 15 kts.;
  • A tanker with a 100,000 t DWT capacity and a speed V of 14 kts.;
  • A container carrier with a 10,000 TEU and a speed V of 23 kts.
CO2 emissions may be estimated on the basis of carbon content and various coefficients. A number of papers [53,54] present simple methods to estimate CO2 emissions on the basis of a CF conversion factor. As noted in [54], CF is a nondimensional conversion factor between fuel consumption measured in g, and CO2 emissions are also measured in g based on carbon content. CF values are presented in Table 7.
Table 7 shows that burning 1 ton of fuel results in emissions of at least 3 tons of gas. It follows that the CO2 emissions can be estimated using the following formula:
CO2 = CF ⋅ FC
where:
  • CO2—CO2 emission;
  • CF—conversion factor (Table 7).
The FC value required to compute CO2 emission using Equation (13) may be estimated in two ways:
  • Directly using Equations (8), (10) and (12);
  • Indirectly using the MCR estimated by Equations (7), (9) and (11) and then using the following equation:
    FC = 24 ⋅ MCR ⋅ sfc ⋅ 10−6
    where:
    • FC—daily fuel consumption of the main engine [t/day];
    • MCR—maximum continues rate [kW];
    • sfc—specific fuel consumption of the main engine [g/kWh].
Fuel consumption calculated through the use of the direct method for:
  • A bulk carrier by using Equation (8) equals:
    FC = 87.108 · [ ( 35,000 · 2.58 · 10 6 0.04178 ) · 0.90469 + ( 15 · 0.294118 3.52941 ) · 0.130693 + 0.14126 ] = 26.17   t / day
  • A tanker by using Equation (10) equals:
    FC = 103.4019 · [ ( 100,000 · 3.14 · 10 6 0.002959 ) · 0.6973259 + ( 14 · 0.1265823 1.139241 ) · 0.2062511 + 0.02419 ] = 38.35   t / day  
  • A container carrier by using Equation (12) equals:
    FC = 190.01 · [ ( 10,000 · 4.332 · 10 5 0.03812 ) · 0.8162732 + ( 23 · 0.08696 1.130435 ) · 0.6714974 0.09751 ] = 153.71   t / day
CO2 emission calculated by using this method and Equation (13) for:
  • A bulk carrier equals:
    CO2 = 3.114 ⋅ 26.17 = 81.48 t CO2/day,
  • A tanker equals:
    CO2 = 3.114 ⋅ 38.35 = 119.44 t CO2/day,
  • A bulk carrier equals:
    CO2 = 3.114 ⋅ 153.71 = 478.65 t CO2/day.
Maximum continues rate calculated for:
  • A bulk carrier by using Equation (7) equals:
    MCR = 25,062.66 · [ ( 35,000 · 2.58 · 10 6 0.04178 ) · 0.956618 + ( 15 · 0.294118 3.52941 ) · 0.08579 + 0.15713 ] = 6996.41   kW
  • A tanker by using Equation (9) equals:
    MCR = 28,121.485 · [ ( 100,000 · 3.14 · 10 6 0.002959 ) · 0.760155 + ( 14 · 0.1265823 1.139241 ) · 0.2054171 + 0.03265 ] = 11,201.91   kW
  • A container carrier by using Equation (11) equals:
    MCR = 71,684.588 · [ ( 10,000 · 4.332 · 10 5 0.03812 ) · 0.7543861 + ( 23 · 0.08696 1.130435 ) · 0.3726194 0.02784 ] = 42,598.53   kW
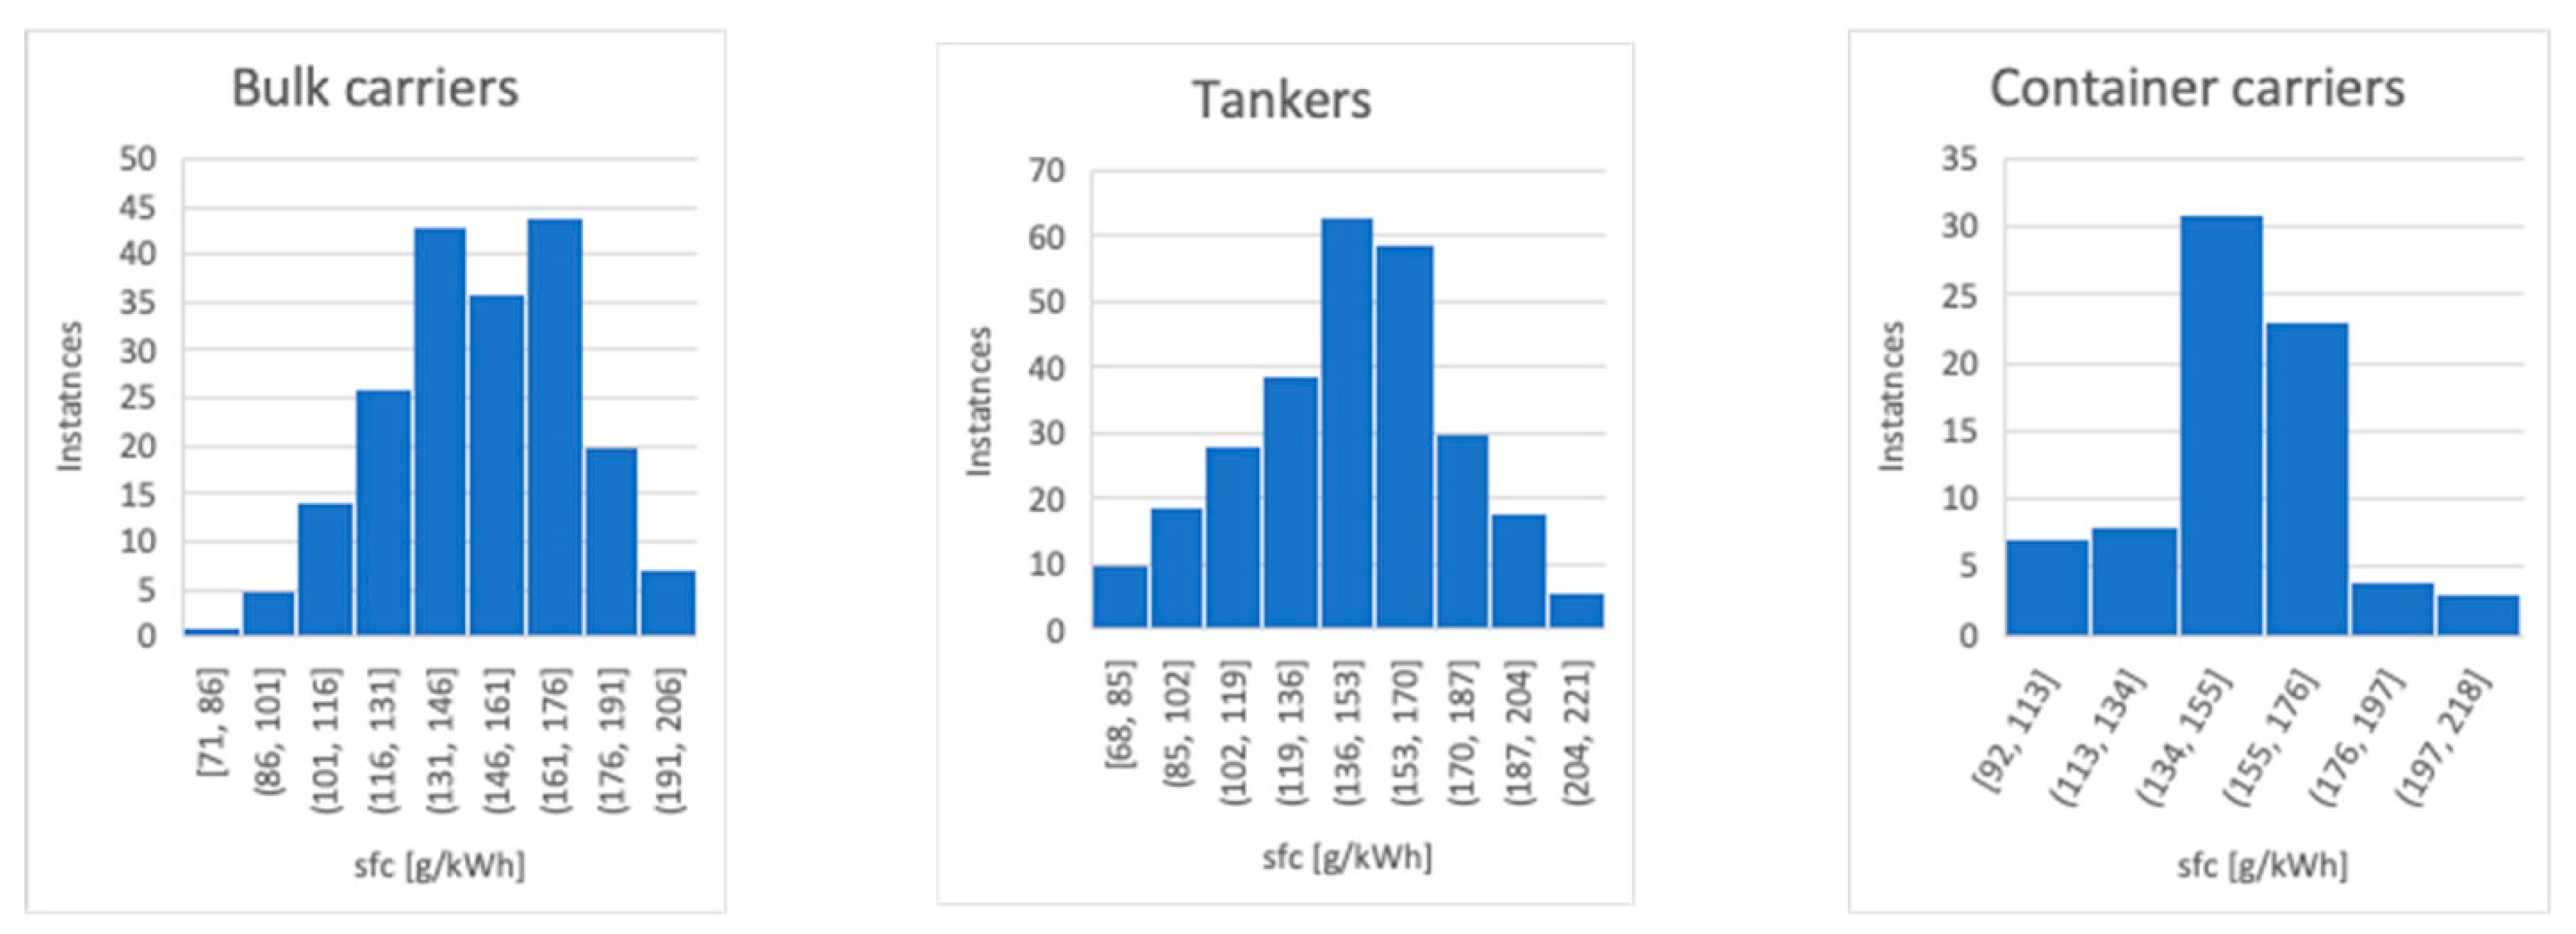
The specific fuel consumption values (sfc) of modern ships used in the study are shown in Figure 15. This figure shows that the most common sfc values are within the following ranges:
  • 131–176 g/kWh for bulk carriers;
  • 136–170 g/kWh for tankers;
  • 134–176 g/kWh for container carriers.
If we assume sfc = 150 g/kWh for all ships then the CO2 emission calculated through the use of the indirect method and by using Equations (13), (14) and (21)–(23) for:
  • A bulk carrier equals:
    CO2 = 3.114 ⋅ 24 ⋅ 6996.41 ⋅ 150 ⋅ 10−6 = 78.43 t CO2/day,
  • A tanker equals:
    CO2 = 3.114 ⋅ 24 ⋅ 11,201.91 ⋅ 150 ⋅ 10−6 = 125.58 t CO2/day,
  • A bulk carrier equals:
    CO2 = 3.114 ⋅ 24 ⋅ 42,598.53 ⋅ 150 ⋅ 10−6 = 477.55 t CO2/day.

5. Discussion

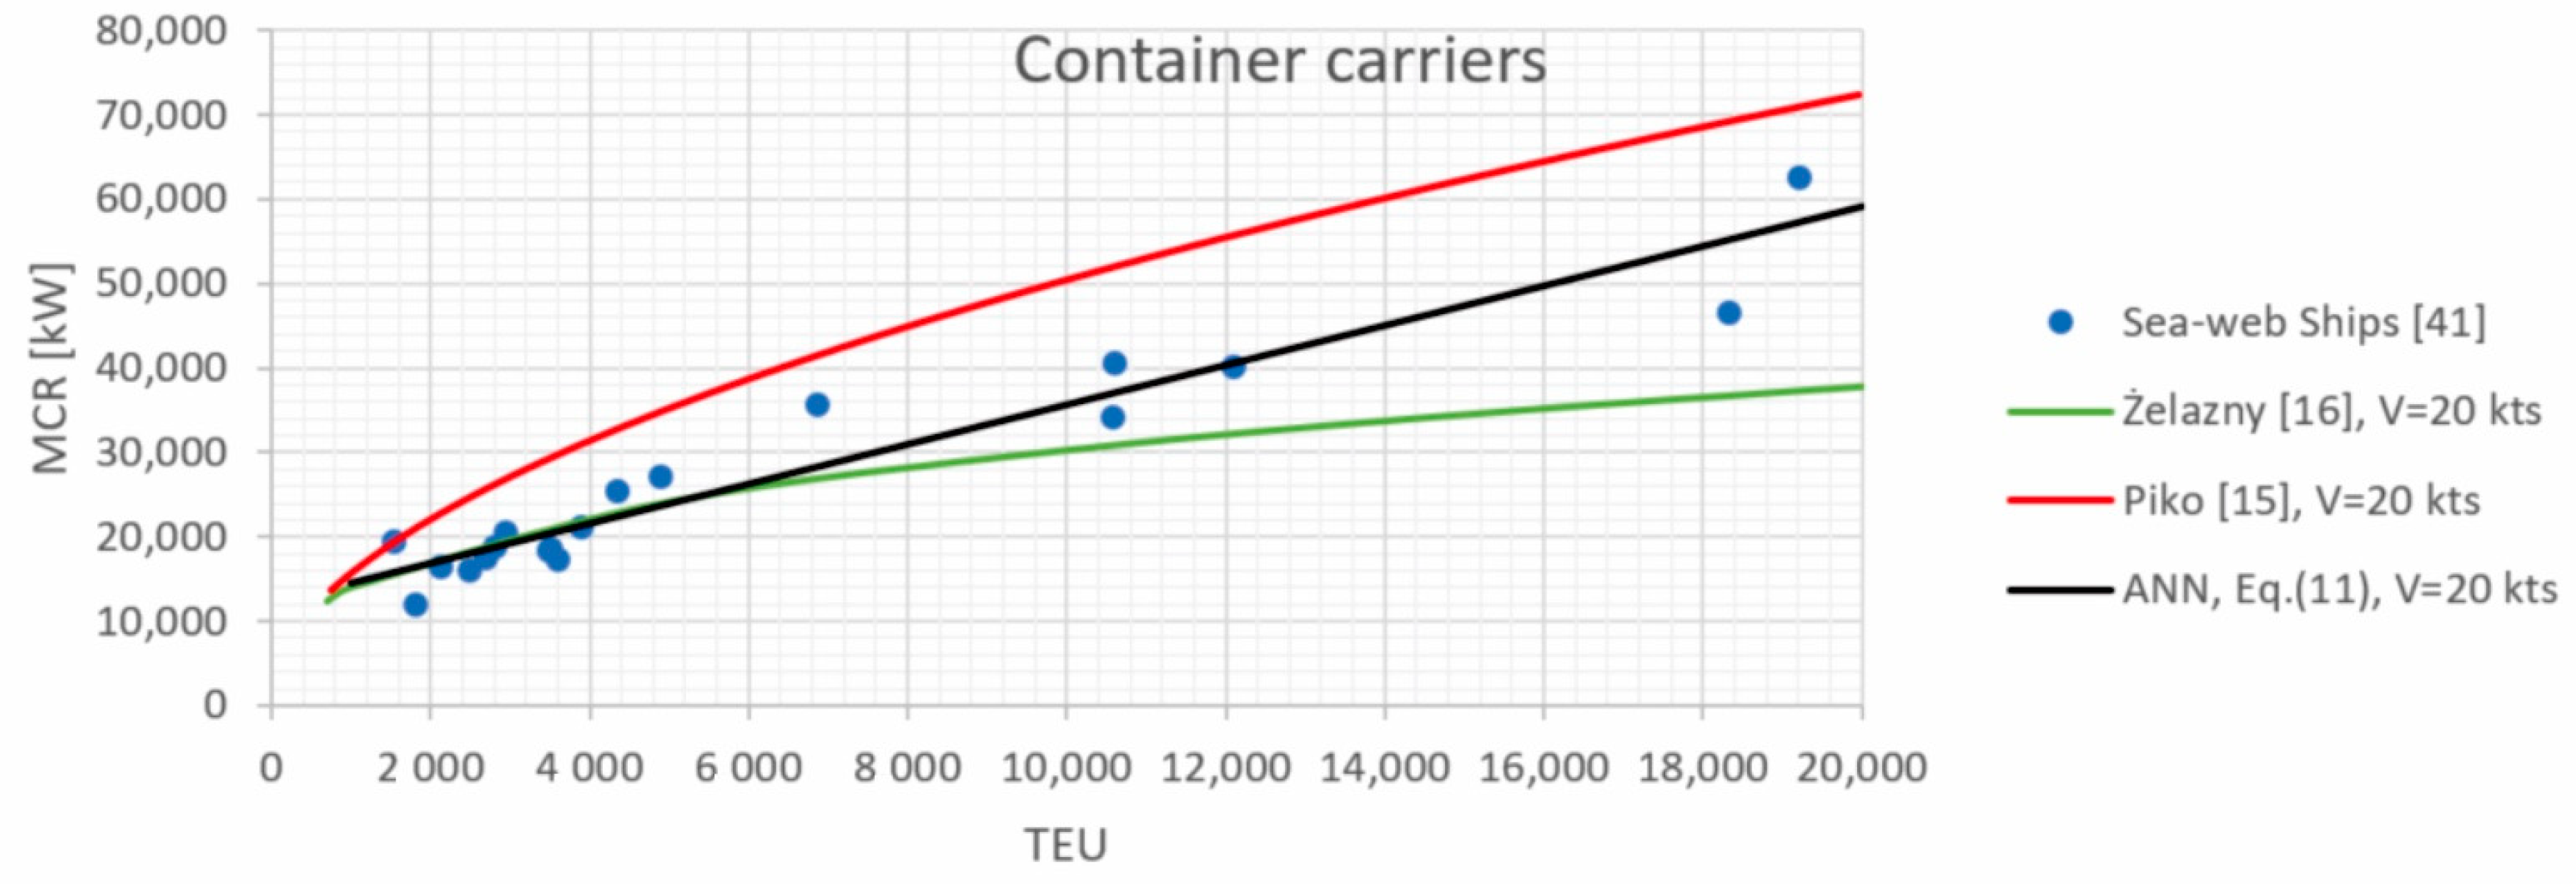
This paper presents design equations for the estimation of engine power and fuel consumption based on databases of newly built bulk carriers, tankers, and container ships. The statistical analyses presented in the article indicate that the proposed artificial neural networks have good estimation accuracy in relation to the reference data. In addition, Figure 16 shows the relationship between deadweight, number of containers, and engine power at constant average speed for the given ship type, computed using ANNs and the methods of Piko and Żelazny [15,16]. The figure indicates that the calculated ANNs generally match SeaWeb data well [41]. However, Piko and Żelazny’s regressions are less well matched to the reference data [41]. The highest engine power values exist in the whole range of cargo capacity for all types of ships when the Piko method is used. The low accuracy of the Piko equations might be attributed to the ship database that was used at the time the regressions were developed, which is now out of date. Although the Żelazny regressions are more accurate than Piko’s, they are still incorrect when compared to data relating to modern cargo ships. This might be because the regressions are based on ship data built before 2015. There were less strict restrictions on ship fuel consumption and exhaust emissions at the time, and these ships could reach higher propulsion power and design speeds than ships today. This might imply that the artificial neural networks proposed in the article to estimate propulsion system parameters are a reasonable alternative to those currently utilized in ship design theory. This also means that, as a result of pollution regulations and rising fuel prices, methods to estimate other vessel characteristics, such as size and hull shape, which have an impact on resistance, may need to be double-checked or revised by others.
The ANNs presented in this article have been developed for practical use by ship designers. ANNs can be applied particularly at the preliminary design stage for the initial estimation of ship propulsion systems and their characteristics when the only known variables are cargo capacity and speed. These equations could also be used as a “first approximation” to compare with results generated by other design approaches in order to avoid serious design mistakes or miscalculations. One important example could be the possibility of using these formulas for manual calculations for a user with a basic knowledge of computer techniques; in this case, model simplicity would be an important criterion. The linear neural networks described in mathematical form by Equations (7)–(12) are relatively simple, although the relationships between DWT and TEU capacity, ship speed and propulsion parameters are unclear. The practical application of neural network equations is more complicated and time-consuming than in the case of regression equations. This means that in the near future, ANNs are unlikely to be used as widely in engineering as standard regression methods. As a consequence, scientists should play an important role in this area, providing simple and effective design tools through the use of complex techniques, such as ANNs.
The linear and nonlinear regression methods used in ship design and presented in [3,15,16] are relatively easy to use, but are restricted in terms of the number of dependent and independent variables. As a result, the use of these methods to estimate various ship characteristics is limited. The application of artificial neural networks enables the development of estimations based on a large number of independent and dependent variables and be more applicable in ship design in the future for modeling other ship properties, rather than more commonly used regression methods. This research, as well as the studies presented [9,35,36,37,38,39], all confirm this.

6. Conclusions

A set of ANNs for the estimation of total power and fuel consumption of the main engine of tankers, bulk carriers and container ships was developed. Deadweight or TEU capacity and speed were used as inputs in the ANN training. This study has shown that an alternative approach enables the simultaneous development of reliable relationships between several input and output parameters. It was found that even a basic linear neural network with two neurons in the input and output layers with purelin activation functions offers accurate estimates for ship engine power and fuel consumption. The proposed linear neural networks have simple mathematical structures and it is straightforward to apply them. The example of estimating CO2 emissions for selected ships presented in the article proves this.
This study showed that results provided good correlation with measured data.
This paper also reveals that the results are in positive alignment with real data and are characterized by appropriate trends. A statistical analysis confirmed that the neural networks developed had good generalization ability. The results presented in this paper indicate that there is the possibility of developing a neural network to predict propulsion parameters of other types of ships.

Limitation of the Study

The equations presented in the article are novel and were developed based on the data of the most recent ships built from 2015. As a result, to an extent, these equations could include the latest trends in cargo ship development. Equations (7)–(12) presented in this paper could have practical application at the preliminary design stage or in transport studies for modern commercial cargo ships. All proposed formulas may also be used in a fuel-based or energy consumption approach to estimate tanker, bulk carrier, and container ship air pollution emissions.
However, these equations might have two limitations. Firstly, Equations (7)–(12) may be inaccurate in the design of an innovatively designed ship. This results from the data used to train the networks which were observed for standard ship hulls. Secondly, the neural networks were developed using data with limited parameter ranges. Therefore, the developed artificial neural networks might only be used to estimate engine power and fuel consumption for ships with ranges of design characteristics presented in Table 1, Table 2 and Table 3.
Since the ANNs were only trained based on two input variables, i.e., DWT/TEU capacity and speed, these estimates are less accurate than for more input variables. Taking this into account, the estimation errors between the measured and estimated values were relatively low and the largest portion of data coincided in the following ranges:
  • From −600 to 1500 kW and from −9 to 6 t/day for the ANN estimating the engine power and fuel consumption of bulk carriers, respectively;
  • From −1000 to 1600 kW and from −10 to 9 t/day for the ANN estimating the engine power and fuel consumption of tankers, respectively;
  • From −600 to 3900 kW and from −7 to 31 t/day for the ANN estimating the engine power and fuel consumption of container carriers, respectively.
However, only these two parameters, cargo capacity and speed, are used at the preliminary design stage. When only these parameters are known, the proposed ANNs may be utilized to predict ship propulsion systems and their characteristics at this stage. Various approaches and methods are used and tried during the preliminary design, and the results are continuously compared. The equations proposed in the article could potentially be used as a “first approximation” to compare results developed by using alternative design approaches in order to avoid serious errors or miscalculations.

Author Contributions

Conceptualization, T.C. and P.C.; data curation, T.C.; formal analysis, T.C.; funding acquisition, T.C.; investigation, T.C.; methodology, T.C.; project administration, T.C.; resources, T.C.; software, T.C.; supervision, T.C.; validation, T.C.; visualization, T.C.; writing—Original draft, T.C.; writing—Review and editing, P.C. All authors have read and agreed to the published version of the manuscript.

Funding

This research received no external funding.

Institutional Review Board Statement

Not applicable.

Informed Consent Statement

Not applicable.

Data Availability Statement

Not applicable.

Conflicts of Interest

The authors declare no conflict of interest.

Abbreviations

ANNartificial neural network
BP error back propagation algorithm
CF conversion factor
CG conjugate gradient algorithm
CO2carbon dioxide
DWTdeadweight capacity
FC daily heavy fuel consumption of main engines
FnFroude number
IMOInternational Maritime Organization
LBPlength between perpendiculars
LNlinear neural network
MCRmaximum continuous rating, total engine power
MLPmultilayer perceptron
PCCPearson correlation coefficient
PI pseudo-inverse algorithm
RMSEroot mean square error
sfc specific fuel consumption
TEU twenty-foot equivalent unit
Vship velocity

References

  1. Rawson, K.J.; Tupper, E.C. Basic Ship Theory. Ship Dynamics and Design, 5th ed.; Butterworth-Heinemann: Oxford, UK, 2001; Volume 2. [Google Scholar]
  2. Watson, D.G.M. Practical Ship Design; Elsevier Science: Oxford, UK, 1998; Volume 1. [Google Scholar]
  3. Papanikolaou, A. Ship Design: Methodologies of Preliminary Design; Springer: Dordrecht, The Netherlands, 2014. [Google Scholar]
  4. Song, S.K.; Shon, Z.H. Current and future emission estimates of exhaust gases and particles from shipping at the largest port in Korea. Environ. Sci. Pollut. Res. 2014, 21, 6612–6622. [Google Scholar] [CrossRef]
  5. Eyring, V.; Isaksen, I.; Berntsen, T.; Collins, W.; Corbett, J.; Endresen, O.; Grainger, R.; Moldanova, J.; Schlager, H.; Stevenson, D. Transport impacts on atmosphere and climate: Shipping. Atmos. Environ. 2009, 44, 4735–4771. [Google Scholar] [CrossRef]
  6. Coello, J.; Williams, I.; Hudson, D.A.; Kemp, S. An AIS-based approach to calculate atmospheric emissions from the UK fishing fleet. Atmos. Environ. 2015, 114, 1–7. [Google Scholar] [CrossRef]
  7. Nunes, R.A.O.; Alvim-Ferraz, M.C.M.; Martins, F.G.; Sousa, S.I.V. The activity-based methodology to assess ship emissions—A review. Environ. Pollut. 2017, 231, 87–103. [Google Scholar] [CrossRef] [PubMed]
  8. Czermański, E.; Cirella, G.T.; Oniszczuk-Jastrząbek, A.; Pawłowska, B.; Notteboom, T. An Energy Consumption Approach to Estimate Air Emission Reductions in Container Shipping. Energies 2021, 14, 278. [Google Scholar] [CrossRef]
  9. Ekincia, S.; Celebia, U.B.; Bala, M.; Amasyalia, M.F.; Boyacia, K. Predictions of oil/chemical tanker main design parameters using computational intelligence techniques. Appl. Soft Comput. 2011, 11, 2356–2366. [Google Scholar] [CrossRef]
  10. Lin, C.; Shaw, H. Feature-based estimation of preliminary costs in shipbuilding. Ocean. Eng. 2017, 144, 305–319. [Google Scholar] [CrossRef]
  11. MAN Diesel & Turbo. Propulsion Trends in Tankers; MAN Diesel & Turbo: Copenhagen, Denmark, 2007. [Google Scholar]
  12. Petersen, J.P.; Jacobsen, D.J.; Winther, O. Statistical modelling for ship propulsion efficiency. J. Mar. Sci. Technol. 2012, 17, 30–39. [Google Scholar] [CrossRef]
  13. Celik, F.; Erturk, I.; Turan, E. Investigation of main particulars subject to minimum building cost for chemical tankers. Ocean. Eng. 2013, 73, 32–37. [Google Scholar] [CrossRef]
  14. Schneekluth, H.; Bertram, V. Ship Design for Efficiency and Economy, 2nd ed.; Butterworth-Heinemann: Oxford, UK, 1998. [Google Scholar]
  15. Piko, G.P. Regression Analysis of Ship Characteristics; Thompson Commonwealth Government Printer: Canberra, Australia, 1980. [Google Scholar]
  16. Żelazny, K. Method for Determination of Service Speed Useful in the Initial Design of Cargo Vessels under Statistical Weather Conditions Occurring on Shipping Route; West Pomeranian University of Technology, Publishing House: Szczecin, Poland, 2015. (In Polish) [Google Scholar]
  17. Kim, K.-S.; Roh, M.-I. ISO 15016:2015-Based Method for Estimating the Fuel Oil Consumption of a Ship. J. Mar. Sci. Eng. 2020, 8, 791. [Google Scholar] [CrossRef]
  18. ISO. ISO 15016:2015-Ship and Marine Technology—Guidelines for the Assessment of Speed and Power Performance by Analysis of Speed Trial Data; ISO: Geneva, Switzerland, 2015. [Google Scholar]
  19. ITTC. Recommended Procedures and Guidelines—Preparation, Conduct and Analysis of Speed/Power Trials; ITTC: Zürich, Switzerland, 2017. [Google Scholar]
  20. Bialystocki, N.; Konovessis, D. On the estimation of ship’s fuel consumption and speed curve: A statistical approach. J. Ocean. Eng. Sci. 2016, 1, 157–166. [Google Scholar] [CrossRef] [Green Version]
  21. Bal Beşikçi, E.; Arslan, O.; Turan, O.; Ölçer, A.I. An artificial neural network based decision support system for energy efficient ship operations. Comput. Oper. Res. 2016, 66, 393–401. [Google Scholar] [CrossRef] [Green Version]
  22. Simonsen, M.; Walnum, H.J.; Gössling, S. Model for Estimation of Fuel Consumption of Cruise Ships. Energies 2018, 11, 1059. [Google Scholar] [CrossRef] [Green Version]
  23. Townsin, R.L.; Kwon, Y.J. Estimating the Influence of Weather on Ship Performance; Wind Press: Milano, Italy, 1993; Volume 135, pp. 191–209. [Google Scholar]
  24. Lin, Y.-H.; Fang, M.-C.; Yeung, R.W. The optimization of ship weather-routing algorithm based on the composite influence of multi-dynamic elements. Appl. Ocean Res. 2013, 43, 184–194. [Google Scholar] [CrossRef]
  25. Vettor, R.; Soares, C.G. Development of a ship weather routing system. Ocean Eng. 2016, 123, 1–14. [Google Scholar] [CrossRef]
  26. Park, J.; Kim, N. Two-Phase Approach to OptimalWeather Routing Using Real-Time Adaptive A* Algorithm and Geometric Programming. J. Ocean Eng. Technol. 2015, 29, 263–269. [Google Scholar] [CrossRef] [Green Version]
  27. Roh, M.-I. Determination of an economical shipping route considering the e_ects of sea state for lower fuel consumption. Int. J. Nav. Arch. Ocean Eng. 2013, 5, 246–262. [Google Scholar] [CrossRef] [Green Version]
  28. Wei, S.; Zhou, P. Development of a 3D Dynamic Programming Method for Weather Routing. In Methods and Algorithms in Navigation: Marine Navigation and Safety of Sea Transportation; CRC Press: Boca Raton, FL, USA, 2011; Volume 6, pp. 181–187. [Google Scholar]
  29. Chen, H. Voyage Optimization Supersedes Weather Routing; Jeppesen Marine Inc.: Denver, CO, USA, 2011; pp. 1–11. [Google Scholar]
  30. ISO. ISO 15016:2002-Ship and Marine Technology—Guidelines for the Assessment of Speed and Power Performance by Analysis of Speed Trial Data; ISO: Geneva, Switzerland, 2002. [Google Scholar]
  31. Eniram. Fuel Saving; Eniram: Helsinki, Finland, 2008. [Google Scholar]
  32. Samsung. Samsung Heavy Industries Energy Efficiency Management System; Samsung: Seoul, Korea, 2017. [Google Scholar]
  33. Soultanias, I. Parametric Ship Design and Holistic Design Optimization of a 9000 TEU Container Carrier; National Technical University of Athens: Athens, Greece, 2014. [Google Scholar]
  34. Nikolopoulosa, L.; Boulougourisb, E. A novel method for the holistic, simulation driven ship design optimization under uncertainty in the big data era. Ocean. Eng. 2020, 218, 107634. [Google Scholar] [CrossRef]
  35. Alkan, A.D.; Gulez, K.; Yilmaz, H. Design of a robust neural network structure for determining initial stability particulars of fishing vessels. Ocean. Eng. 2004, 31, 761–777. [Google Scholar] [CrossRef]
  36. Gurgen, S.; Altin, I.; Murat, O. Prediction of main particulars of a chemical tanker at preliminary ship design using artificial neural network. Ships Offshore Struct. 2018, 13, 459–465. [Google Scholar] [CrossRef]
  37. Abramowski, T. Application of Artificial Intelligence Methods to Preliminary Design of Ships and Ship Performance Optimization. Nav. Eng. J. 2013, 125, 101–112. [Google Scholar]
  38. Sahin, V.; Vardar, N. Determination of Wastewater Behavior of Large Passenger Ships Based on Their Main Parameters in the Pre-Design Stage. J. Mar. Sci. Eng. 2020, 8, 546. [Google Scholar] [CrossRef]
  39. Le, L.T.; Lee, G.; Park, K.; Kim, H. Neural network-based fuel consumption estimation for container ships in Korea. Marit. Policy Manag. 2020, 47, 615–632. [Google Scholar] [CrossRef]
  40. Cheng, X.; Chen, S.; Diao, C. Simplifying Neural Network Based Model for Ship Motion Prediction: A Comparative Study of Sensitivity Analysis. In Proceedings of the ASME 2017 36th International Conference on Ocean, Offshore and Arctic Engineering, Trondheim, Norway, 25–30 June 2017; Volume 1, p. V001T01A016. [Google Scholar]
  41. Sea-Web Ships. 2018. Available online: https://maritime.ihs.com (accessed on 10 February 2018).
  42. Haykin, S. Neural Networks: A Comprehensive Foundation; Macmillan Publishing: New York, NY, USA, 1994. [Google Scholar]
  43. Fausett, L. Fundamentals of Neural Networks; Prentice Hall: New York, NY, USA, 1994. [Google Scholar]
  44. Patterson, D. Artificial Neural Networks; Prentice Hall: Singapore, 1996. [Google Scholar]
  45. Bishop, C. Neural Networks for Pattern Recognition; University Press: Oxford, UK, 1995. [Google Scholar]
  46. Shepherd, J. Second-Order Methods for Neural Networks; Springer: New York, NY, USA, 1997. [Google Scholar]
  47. Broyden, C.G. The convergence of a class of double-rank minimization algorithms 1. General considerations. IMA J. Appl. Math. 1970, 6, 76–90. [Google Scholar] [CrossRef]
  48. Fletcher, R. A new approach to variable metric algorithms. Comput. J. 1970, 13, 317–322. [Google Scholar] [CrossRef] [Green Version]
  49. Shanno, D.F. Conditioning of quasi-newton methods for function minimization. Math. Comput. 1970, 24, 647–656. [Google Scholar] [CrossRef]
  50. Goldfarb, D. A family of variable-metric methods derived by variational means. Math. Comput. 1970, 24, 23–26. [Google Scholar] [CrossRef]
  51. TIBCO Software Inc. Statistica (Data Analysis Software System), version 13; TIBCO Software Inc.: Palo Alto, CA, USA, 2017. [Google Scholar]
  52. Hunter, D.; Yu, H.; Pukish, M.S.; Kolbusz, J.; Wilamowski, B.M. Selection of proper neural network sizes and architectures—A comparative study. IEEE Trans. Ind. Inf. 2012, 8, 228–240. [Google Scholar] [CrossRef]
  53. International Maritime Organization: MEPC.245(66). 2014 Guidelines on the Method of Calculation of the Attained Energy Efficiency Design Index (EEDI) for New Ships; IMO: London, UK, 2014. [Google Scholar]
  54. Polski Rejestr Statków. Guidlines of Energy Efficiency of Ships; Publication No. 103/P; Polski Rejestr Statków: Gdansk, Poland, 2017. [Google Scholar]
Figure 1. The relationship between velocity V and TEU/DWT capacity of the vessels used in this study.
Energies 14 04827 g001
Figure 2. A general research framework.
Energies 14 04827 g002
Figure 3. Signal processing in an artificial neuron, where: xi—input signal, b—bias, y—neuron output signal, wi—weights, φ—activation function, S—sum.
Energies 14 04827 g003
Figure 4. The structure of the artificial neural networks to estimate the engine power (MCR) and fuel consumption (FC) of bulk carriers and tankers, where DWT—deadweight and V—speed.
Energies 14 04827 g004
Figure 5. The structure of the artificial neural network to estimate the engine power (MCR) and fuel consumption (FC) of container carriers, where TEU—the number of containers, V—speed.
Energies 14 04827 g005
Figure 6. Regression graphs presenting the artificial neural network for estimating the engine power (MCR) and fuel consumption (FC) of bulk carriers.
Energies 14 04827 g006aEnergies 14 04827 g006b
Figure 7. Regression graphs presenting the artificial neural network for estimating the engine power (MCR) and fuel consumption (FC) of tankers.
Energies 14 04827 g007aEnergies 14 04827 g007b
Figure 8. Regression graphs presenting the artificial neural network to estimate the engine power (MCR) and fuel consumption (FC) of container carriers.
Energies 14 04827 g008aEnergies 14 04827 g008b
Figure 9. Estimated MCR and FC values in the full range of DWT and V calculated for bulk carriers by the use of Equations (7) and (8).
Energies 14 04827 g009
Figure 10. Estimated MCR and FC values in the full range of DWT and V calculated for tankers by the use of Equations (9) and (10).
Energies 14 04827 g010
Figure 11. Estimated MCR and FC values in the full range of TEU and V calculated for container carriers by the use of Equations (11) and (12).
Energies 14 04827 g011
Figure 12. Error histograms of the artificial neural network to estimate the engine power (MCR) and fuel consumption (FC) of bulk carriers.
Energies 14 04827 g012
Figure 13. Error histograms of the artificial neural network to estimate the engine power (MCR) and fuel consumption (FC) of tankers.
Energies 14 04827 g013
Figure 14. Error histograms of the artificial neural network to estimate the engine power (MCR) and fuel consumption (FC) of container carriers.
Energies 14 04827 g014
Figure 15. Specific fuel consumption (sfc) of the ship’s main engine used in the study.
Energies 14 04827 g015
Figure 16. Total engine power MCR in the function of DWT or TEU capacity at constant average speed for a given ship type.
Energies 14 04827 g016aEnergies 14 04827 g016b
Table 1. Mean, minimum and maximum bulk carrier parameter values, where: MCR—total engine power, FC—daily fuel consumption, DWT—deadweight, V—speed, LBP—length between perpendiculars and Fn—Froude number.
DWT [t]V [kts]LBP [m]Fn [−]MCR [kW]FC [t/Day]
Min16,10212130.00.13390011
Max403,50815.5353.50.2029,40098.1
Mean101,891.614.3224.60.1610,627.837.4
Table 2. Mean, minimum and maximum tanker parameter values, where: MCR—total engine power, FC—daily fuel consumption, DWT—deadweight, V—speed, LBP—length between perpendiculars and Fn—Froude number.
DWT [t]V [kts]LBP [m]Fn [−]MCR [kW]FC [t/Day]
Min877947.00.107352.7
Max320,89916.9334.90.2831,620107.7
Mean83,605.314.0190.90.1810,114.535.1
Table 3. Mean, minimum and maximum container ship parameter values, where: MCR—total engine power, FC—daily fuel consumption, TEU—number of TEU containers, V—speed, LBP—length between perpendiculars and Fn—Froude number.
TEU [−]V [kts]LBP [m]Fn [−]MCR [kW]FC [t/Day]
Min70713126.80.15292520
Max23,96424.5386.20.2675,570262
Mean642619.9233.70.2227,071.797.7
Table 4. An overview of the neural networks that were developed to estimate the engine power and fuel consumption of bulk carriers, where: BP—error back propagation algorithm, CG—conjugate gradient algorithm, PI—pseudo-inverse algorithm and RMSE—root mean square error.
NoNetwork TypeNumber of Neurons in Hidden Layers RMSETraining Method/Number of Training Epochs
Training SetValidation SetTest SetAll Sets
1LN-MCR [kW]1016106015591163PI
FC [t/day]6.05.16.65.9
2MLP15MCR [kW]1057109614811173BP/50
FC [t/day]6.25.36.36.0
3MLP23MCR [kW]1068114314811190BP/50,CG2
FC [t/day]6.35.56.36.1
4MLP19MCR [kW]1202134614291295BP/50,CG/53
FC [t/day]7.16.56.06.7
5MLP23MCR [kW]1389142918321510BP/38
FC [t/day]8.26.97.77.7
6MLP23MCR [kW]1669189420791828BP/50,CG/7
FC [t/day]9.89.18.89.4
Table 5. An overview of the neural networks that were developed to estimate the engine power and fuel consumption of tankers, where: BP—error back propagation algorithm, CG—conjugate gradient algorithm, PI—pseudo-inverse algorithm and RMSE—root mean square error.
NoNetwork TypeNumber of Neurons in Hidden Layers RMSE [−]Training Method/Number of Training Epochs
Training SetValidation SetTest SetAll Sets
1LN-MCR [kW]1761145616471656PI
FC [t/day]9.88.37.48.8
2MLP23MCR [kW]1751149816711667BP/50
FC [t/day]9.88.57.68.9
3MLP35MCR [kW]1857149818051754BP/12
FC [t/day]10.48.58.29.4
4MLP53MCR [kW]1857149817571742BP/47
FC [t/day]10.48.57.99.3
Table 6. An overview of the neural networks that were developed to estimate the engine power and fuel consumption of container ships, where: BP—error back propagation algorithm, CG—conjugate gradient algorithm, PI—pseudo-inverse algorithm and RMSE—root mean square error.
NoNetwork TypeNumber of Neurons in Hidden Layers RMSE [−]Training Method/Number of Training Epochs
Training SetValidation SetTest SetAll Sets
1LN-MCR [kW]5137423370125380PI
FC [t/day]24.324.119.523.1
2MLP13MCR [kW]5400427473405604BP/50,CG/1
FC [t/day]25.624.320.424.0
3MLP5MCR [kW]5817435774105850BP/50,CG/58
FC [t/day]27.524.820.625.1
4MLP20MCR [kW]5589436474545749BP/38
FC [t/day]26.524.820.724.6
Table 7. CF conversion factor values [54].
Type of Fuel OilCF
(t-CO2/t-Fuel)
Diesel3.206
Light Fuel3.151
Heavy Fuel3.114
Publisher’s Note: MDPI stays neutral with regard to jurisdictional claims in published maps and institutional affiliations.