Article

Estimating the State of Health of Lithium-Ion Batteries with a High Discharge Rate through Impedance

State Key Laboratory of Electrical Insulation and Power Equipment, Xi’an Jiaotong University, Xi’an 710049, China
*
Author to whom correspondence should be addressed.
Energies 2021, 14(16), 4833; https://doi.org/10.3390/en14164833
Submission received: 1 July 2021 / Revised: 1 August 2021 / Accepted: 5 August 2021 / Published: 8 August 2021
(This article belongs to the Section D: Energy Storage and Application)

Abstract

:
Lithium-ion batteries are an attractive power source in many scenarios. In some particular cases, including providing backup power for drones, frequency modulation, and powering electric tools, lithium-ion batteries are required to discharge at a high rate (2~20 C). In this work, we present a method to estimate the state of health (SOH) of lithium-ion batteries with a high discharge rate using the battery’s impedance at three characteristic frequencies. Firstly, a battery model is used to fit the impedance spectrum of twelve LiFePO4 batteries. Secondly, a basic estimation model is built to estimate the SOH of the batteries via the parameters of the battery model. The model is trained using the data of six batteries and is tested on another six. The RMS of relative error of the model is lower than 4.2% at 10 C and lower than 2.8% at 15 C, even when the low-frequency feature of the impedance spectrum is ignored. Thirdly, we adapt the basic model so that the SOH estimation can be performed only using the battery’s impedance at three characteristic frequencies without having to measure the entire impedance spectrum. The RMS of relative error of this adapted model at 10 C and 15 C is 3.11% and 4.25%, respectively.

1. Introduction

Lithium-ion batteries (LIBs) are widely used in portable terminals, electric vehicles (EVs), hybrid electric vehicles (HEVs), aerospace, and other fields [1,2]. In some particular circumstances, including backup power for drones, frequency modulation, and powering electric tools such as drills, lithium-ion batteries are required to discharge at a high rate (2~20 C). For instance, the US Navy is currently researching a number of applications that will require lithium-ion batteries to both source and sink high-power loads [3]. As another example, lithium-ion batteries serve as a backup energy source for drones powered by cables. In order to reduce the weight of the drone itself, drones carry only the minimum number of batteries, and batteries must be discharged at a very high rate so that the drone can land safely in the case of an emergency such as a cable fault or high wind. Moreover, lithium-ion batteries may also be charged/discharged at a high rate to provide frequency regulation for request signals from the grid [4]. As these applications become more common, it becomes increasingly important to estimate the capacity fade of lithium-ion batteries when they are discharged at a high rate.
The state of health (SOH) of a battery, defined as the ratio of actual cell capacity/resistance to the initial value, is commonly used as a metric to evaluate the level of battery aging. Studies have shown that the SOH is related to a variety of phenomena and their interactions, most of which cannot be studied independently and do not occur simultaneously [5,6,7,8,9]. In the research carried out to date, SOH estimation is carried out using two basic approaches: experimental and adaptive methods [10,11]. Adaptive methods, which include the Kalman filter method, the neural network method, and the fuzzy logic method, determine the residual capacity through the calculation of parameters that are sensitive to the degradation of the battery cell [10]. Adaptive methods usually have a high accuracy and are widely used in online SOH estimations [10,12,13,14,15]. In Ref. [13], for example, Fang et al. used the double-extended Kalman filter method to determine the parameters of the battery’s equivalent circuit model and perform the online estimation of the SOH with a maximum error of 1.54%. However, adaptive methods require high computational effort, and the parameters determined by these methods are not universal for different cells (even if they are of the same type) [12,16]. Experimental methods, on the other hand, can estimate the SOH with the help of history cycling data [10]. In spite of their relatively low accuracy, experimental methods, particularly those based on electrochemical impedance spectroscopy (EIS), can lead to certain universal formulas that are applicable to other batteries of the same type, which makes it possible for them to be implemented in electric vehicle battery management systems [17,18,19,20,21].
The EIS method is a typical experimental method for battery SOH estimation. It estimates the SOH by using the battery’s electrochemical impedance spectroscopy, the acquisition of which requires specialized equipment. Wang et al. in Ref. [22], built a battery equivalent model and determined the parameters by fitting the battery’s impedance spectrum. The result showed a significant correlation between these battery parameters and the SOH. Mingant et al. [23] followed a similar procedure to estimate the SOH and demonstrated that the EIS method can be implemented for both SOC (state of charge, defined as the ratio of the battery’s remaining capacity to its current maximum capacity) and SOH estimation. Generally, the EIS method estimates the SOH by using the parameters of the battery model, which are calculated by fitting the impedance spectrum. It is worth mentioning that the EIS method usually has a high accuracy that is greater than 95%, which is one of the highest among all experimental methods [10]. However, despite its high accuracy, the EIS method requires a long test time and a stable test environment, making it inconvenient for onboard applications [24]. Thus far, while several improved methods have been proposed to overcome these limitations [25,26,27], evidence of the effectiveness of these new methods generally still lacks sufficient supporting data. As a result, the question of how to improve the EIS method to estimate SOH quickly and effectively remains a challenge.
Many studies have shown that a higher discharge rate can accelerate battery aging [28,29,30]. Several hypotheses have been made to explain this phenomenon. Ning et al. attributed the capacity fade at a high discharge rate to the loss of secondary material, the loss of primary material, and the difference of rate capability [28]. Sun et al., on the other hand, gave another three causes to explain the accelerated capacity fade at high discharge rate—the degradation of active materials, the enhancement in the loss of active lithium, and the instability of the SEI film on the anode after the rapid extraction of lithium ions [29]. Among them, the first cause was also agreed by Liu et al., who also linked the rapid capacity fade with the loss of active material of the positive electrode [30]. Nonetheless, few of these studies considered a discharge rate higher than 5 C, and in the area of SOH estimation, even fewer studies considered such a high discharge rate. In the recent review made by Iurilli et al. [31], the authors summarized the current rate used in different works that took an EIS approach to study battery aging. According to Table 3 in their paper, very few studies considered a discharge rate higher than 3 C. Additionally, for those studies that did consider such a high discharge rate, they were mainly focused on how the impedance spectrum and battery parameters change as the battery ages, and none of them made a SOH estimation in their work [3,32,33,34]. Consequently, it remains challenging to estimate the SOH of batteries discharged at a high rate.
In this paper, based on the battery impedance at different frequencies, two methods are proposed to estimate the SOH of lithium-ion batteries under high-rate discharge. The first method is the traditional EIS method, which uses the battery’s impedance spectrum to determine the values of the parameters of the battery equivalent model and then uses these values to estimate the SOH. The second method is to select several characteristic frequencies and directly estimate the SOH through the impedance at these frequencies. This is less time-consuming and has a lower demand for extra devices compared with the former method. The two methods are strongly correlated—the frequency points that are selected in the later method contain information about the battery parameters that had been proven to be related to the SOH in the former method.
The outline of this paper is as follows. Section 2 describes the battery equivalent model in an EIS analysis. Section 3 introduces the experimental system. Section 4 presents the results of the experiment. In Section 4.1, the values of the parameters of the battery’s equivalent model at different SOHs are determined by fitting the impedance spectrum, and the relationship between these parameters and the SOH is carefully studied. In Section 4.2, a basic estimation model is built based on these parameters. In Section 4.3, several characteristic frequency points are selected, and another SOH estimation model is built based on the impedance at these points. The relationship between these points and the parameters in the battery model is then illustrated, which lends support to the accuracy of this second model and the fact that it is more accessible. A comparison between the two models is also presented in Section 4.3. Finally, in Section 5, the conclusions are summarized.

2. Modelling of the Battery Based on the Impedance Spectroscopy

In DC circuits, the internal resistance of a battery can be obtained directly by measuring the immediate voltage change ( Δ U ) of the battery when a pulse current ( Δ I ) is applied. To be specific, the internal resistance (R) can be measured by:
R = Δ U Δ I .
While much evidence has shown that the internal resistance of the battery will increase as the battery ages [35,36,37], this parameter alone is not sufficient to estimate the remaining capacity of the battery. In order to measure the battery’s impedance at different frequencies, a special piece of equipment was used to generate a small sinusoidal signal (which usually causes a voltage drop of no m ore than 10 mV across the battery) at a given angular frequency ω. If we use complex numbers to represent the sinusoidal current ( I ¯ ( j ω ) ) and voltage ( U ¯ ( j ω ) ), the complex impedance of the battery at the given angular frequency ω can be calculated by the following:
Z ¯ ( j ω ) = U ¯ ( j ω ) I ¯ ( j ω ) .
By applying sinusoidal currents of different frequencies (0.01–10 kHz) and recording the corresponding value of the battery’s impedance, we can draw a Bode curve (which shows the modulus of the battery impedance at different frequencies) and a Nyquist curve (which shows the relationship between the real part and the imaginary part of the battery’s impedance) of the battery. Typical Bode and Nyquist curves of a fully charged battery are shown in Figure 1 in the form of a scatter plot.
As can be seen in Figure 1b, we can clearly divide the Nyquist curve into three parts. The first part is an almost horizontal line, representing the inductive characteristics of batteries under a high frequency. The end of the first part corresponds to the imaginary part of the impedance being zero, meaning that the real part of the impedance at this point is also the pure ohmic resistance (R0) of the battery. As a result, the characteristics shown in the first part of the Nyquist curve can be equivalently represented with a resistor and an inductor.
The second part of the Nyquist curve resembles an arc, which is linked to the double-layer and charge-transfer effects at the interfaces of the battery [38]. If we only use a simple combination of a resistor, inductor, and capacitor to approximate this curve, the optimal approximation would be a capacitor and resistor in parallel, whose Nyquist curve (as can be seen in Figure 2) is a semicircular arc with a radius R1/2 (where R1 is the resistance of the resistor). However, according to Figure 1b, the actual Nyquist diagram of the battery more resembles a minor arc than a semicircular arc, which may result from the imperfections of the interfaces’ planarity and rugosity [20]. As a result, seeking to develop a more accurate battery model, we replace the capacitor with a CPE (constant phase element), which gets its name from its impedance having a constant phase regardless of the frequency. The impedance of CPE can be calculated as follows:
Z CPE ( j ω ) = 1 ( j ω ) n Q .
As we can see in (3), each CPE has two parameters, n and Q. Between them, n π 2 denotes the phase of the impedance and Q represents the size of the impedance. Clearly, when n = 1, 0, or −1, the CPE will degenerate into a capacitor, a resistor, and an inductor, respectively. When a CPE is in parallel with a resistor (whose resistance is R0), the Nyquist curve of their total impedance is as shown in Figure 2.
From Figure 2, we can clearly see that the equivalent circuit with CPE can better reproduce the second part of the Nyquist curve of an actual battery, since it contains the parameter n, which can adjust the angle of the arc in the Nyquist curve.
As shown in Figure 1, the third part of the battery’s Nyquist curve can be approximated as a straight line with a slope of one; this is associated with the mass transport (Li-ion diffusion) that occurs within the electrodes [38]. Since the Nyquist curve in this part has an almost constant phase of 45 degrees, we can use a special CPE whose n = 0.5 to reproduce the Nyquist curve in this part. In electrochemistry, such a special CPE can also be called an infinite Warburg resistance, whose impedance can be calculated as follows:
Z w ( j ω ) = σ ω ( 1 j ) .
In Formula (4), σ represents the Warburg coefficient, which characterizes the size of the impedance.
Thus far, we have built three battery equivalent circuits according to different parts of the battery’s Nyquist curve. The integral battery equivalent model would then constitute the series connection of the three circuits. The battery equivalent model adopted in this paper is shown in Figure 3.
To test the accuracy of our battery model, we fit the parameters in our model with actual data, drew the Bode curve according to our model, and compared it with the actual curve. The result is shown in Figure 1a, from which we can see that the battery model is a good approximation of the real battery.

3. Materials and Methods

In this work, twelve new, identical LiFePO4 battery cells made by GREPOW were studied. The model we chose can allow for a discharge rate as high as 40 C and is commonly used in drones. The specification of each battery cell is listed in Table 1.
We controlled all the elements of the experimental setup in the battery test system produced by Neware, which controls a supporting battery test system to realize the discharging and charging processes of the batteries. The recording of current and voltage across the battery was also carried out by the battery test system. The measurement of the battery’s impedance spectrum was performed using Reference 3000 made in Warminster, Pennsylvania, U.S. by Gamry. The plotting and fitting of the impedance spectrum is performed by using the supporting software Gamry Echem Analyst. The software allows the fitting of the battery impedance spectrum by using a customized battery equivalent circuit. The fitting algorithm is the Levenberg–Marquardt algorithm. In the subsequent data processing, the linear regression is performed by using SPSS.
Our experiment consisted of repeated charges and discharges of the cells until their capacity reached less than 70% of their original capacity. Before the first cycle and after every fifty cycles (for 15 C, every twenty cycles), we measured the fully charged battery’s frequency-dependent impedance using the electrochemical workstation Reference 3000, with applied frequencies ranging from 10 kHz to 0.01 Hz. In each cycle, the batteries were discharged at a high rate (10 C for half of the batteries and 15 C for the other half) until the voltage across the battery dropped to 3.2 V (for 15 C, 3.1 V). The battery cells were then charged to 4.2 V at a rate of 2 C, followed by a constant-voltage phase until the charge current was below 0.1 C. After charging, the battery would rest for 10 min before being discharged in the next cycle.

4. Results and Analysis

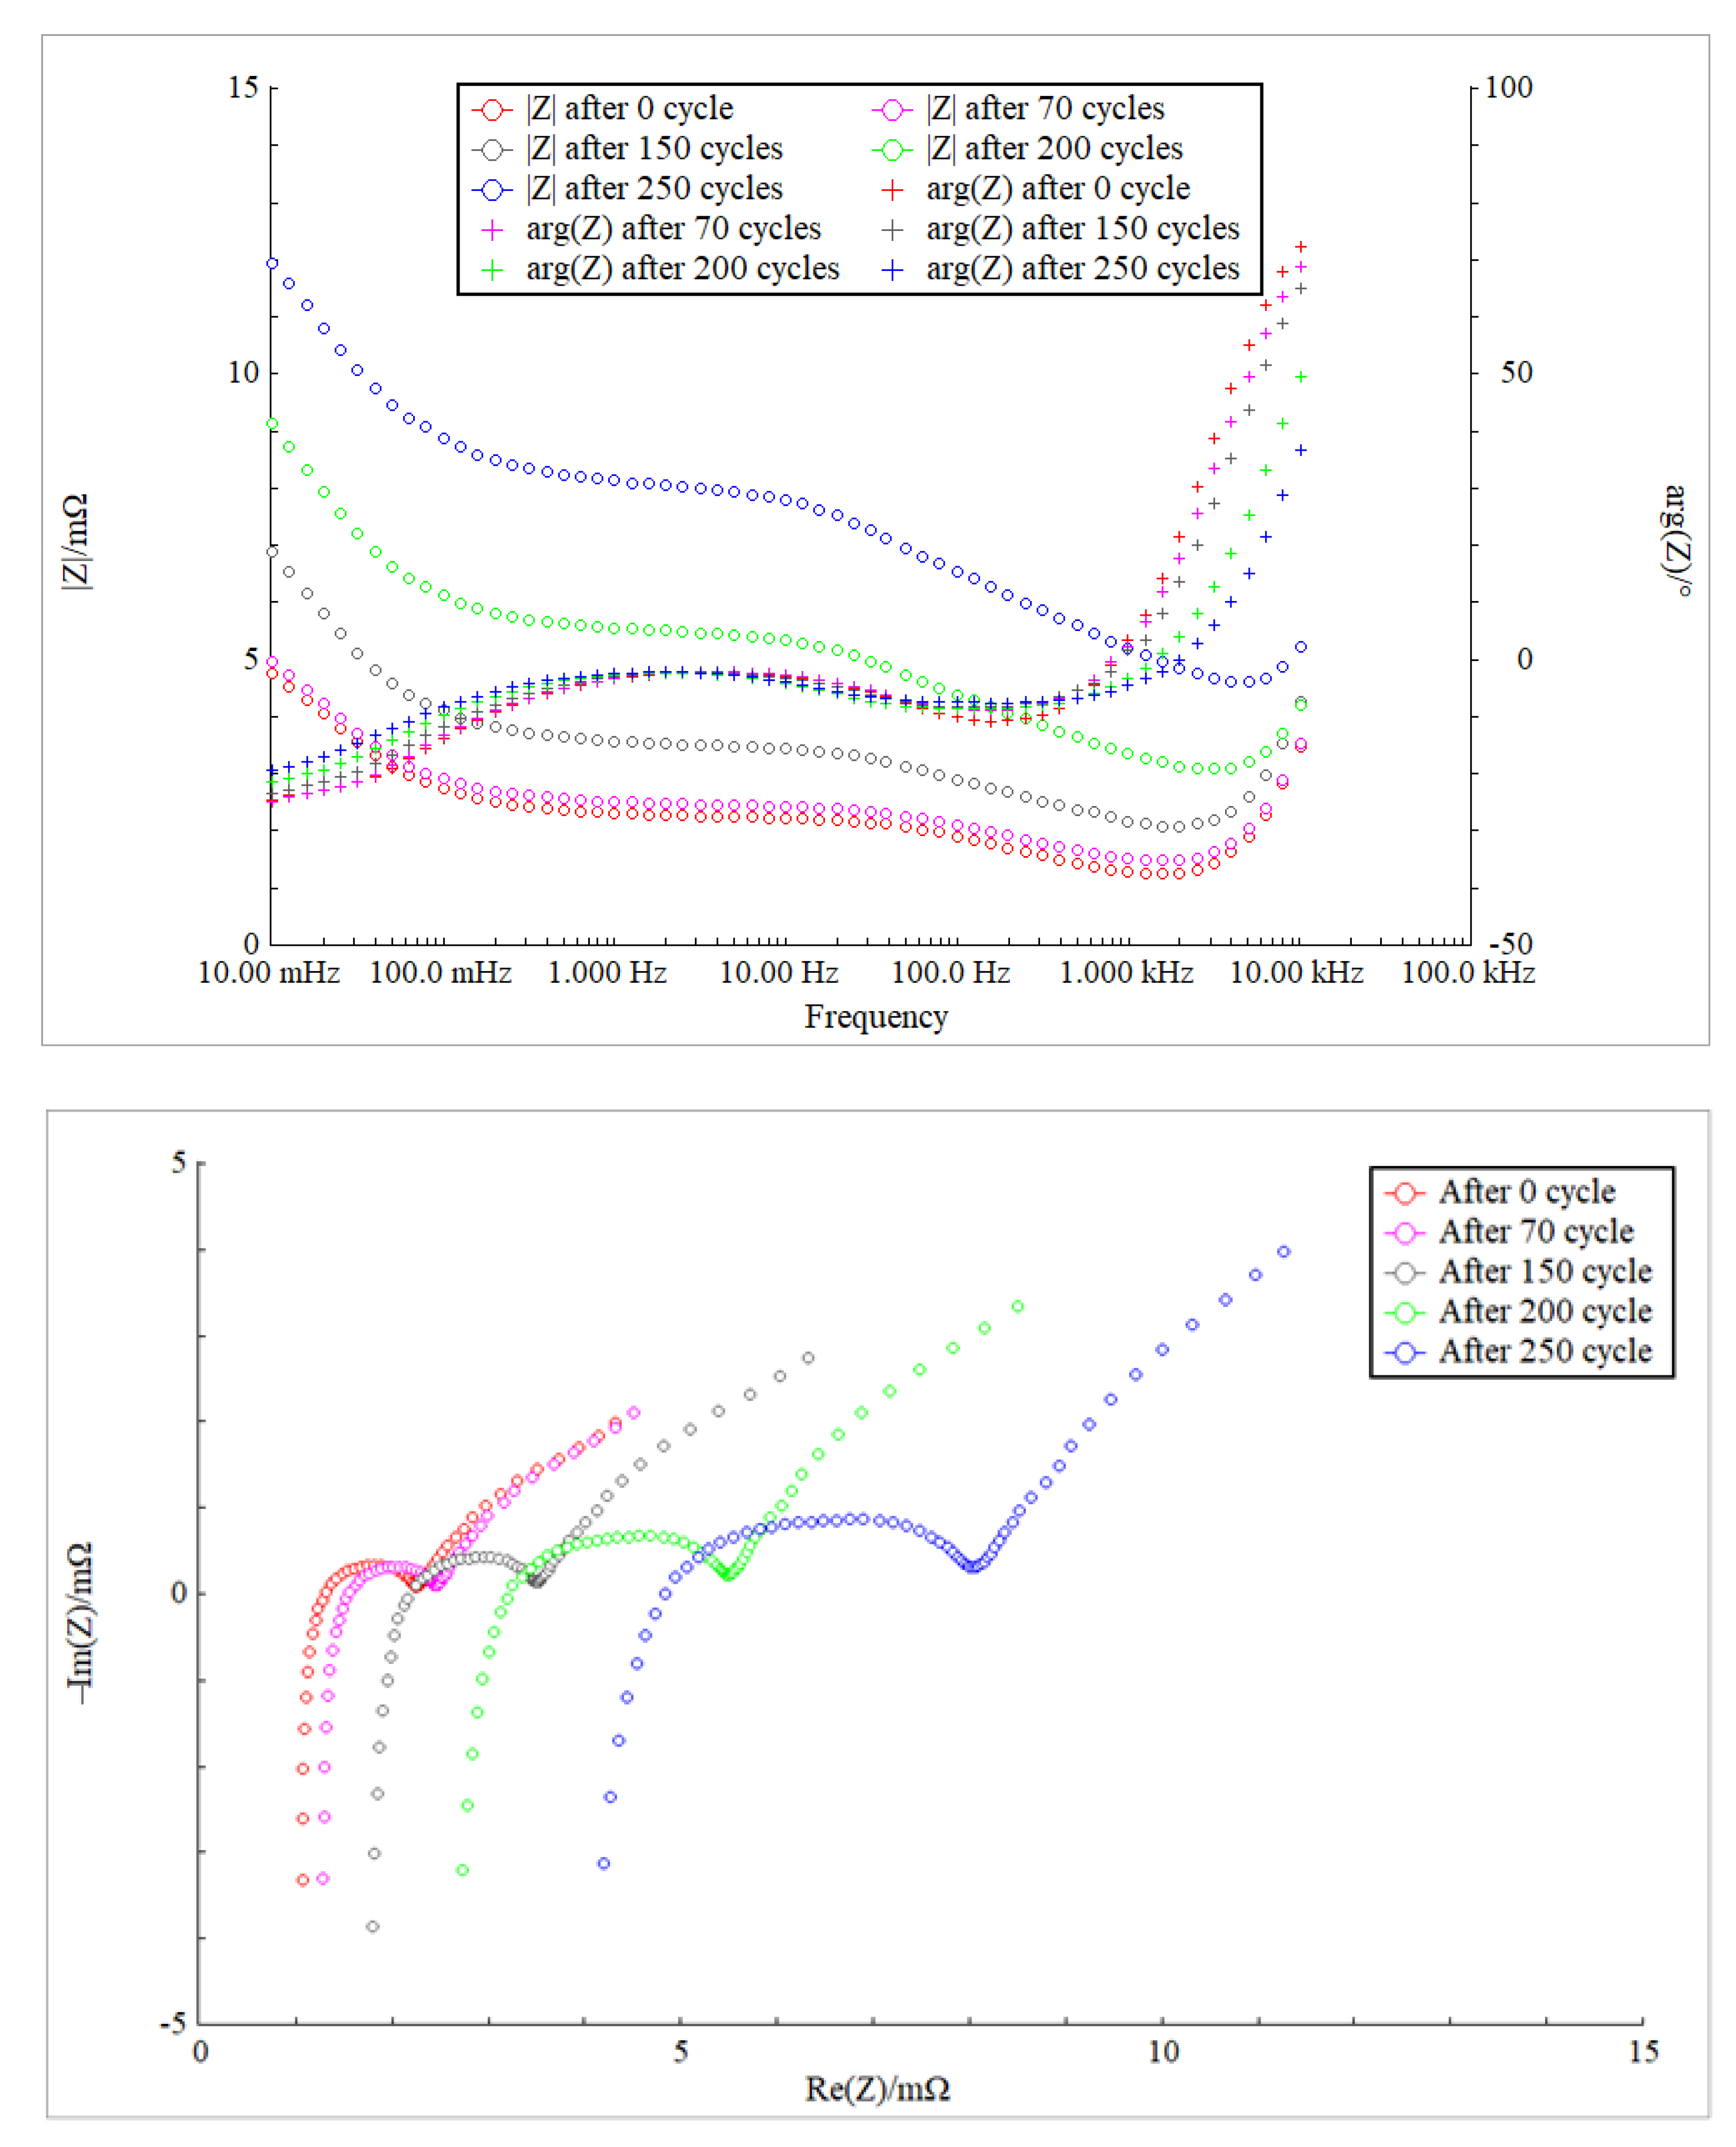
4.1. Impedance Analysis

The relationship between each battery’s SOH and cycle number is presented in Figure A1 in Appendix A. Taking battery 4 (discharged at 15 C) as an example, the relationship between the battery’s Bode curve, the Nyquist curve, and the number of cycles is shown in Figure 4.
As is clearly shown in Figure 4, the start and end point of the arc in the Nyquist curve significantly shift right as the number of cycles increases, which suggests an increase in the pure ohmic resistance (R0) of the battery. The radius of the arc also increases, while the angle of the arc decreases, suggesting an increase in R1 and a decrease in n. Seeking to link the parameters of the battery model and the battery’s SOH, we took battery 2 (discharged at 15 C) and battery 11 (discharged at 10 C) as an example, and drew Figure 5 to visualize the relationship between the SOH and the normalized battery parameters. The results of other batteries are presented in Figure A2 in Appendix A.
As we can see in Figure 5, among all the parameters R0, R1, n, and Zw have a strong correlation with the SOH at both 10 C and 15 C. Parameter L, on the other hand, has almost no effect on the SOH at both 10 C and 15 C. As for parameter G, it is related to the SOH at 10 C, yet appears to have no effect on the SOH at 15 C. This phenomenon can be explained from the perspective of the battery’s aging mechanism. As a lithium-ion battery ages, deposits will build up on both electrodes, increasing the internal resistance of the battery (R0). Changes in the crystal structure of the anode can also result in the same effect. Meanwhile, a solid electrolyte interphase (SEI) film will grow, decompose, and regrow on the electrode interface, causing not only a loss of active lithium ions but also an increase in anode/electrolyte surface diffusion resistance (R1) [39]. Other mechanisms, including particle cracking, pore clogging, and particle disconnection, are also accountable for the change in R1 and n [40]. The change in Zw, on the other hand, is usually caused by the loss of active material in the battery, which can occur through solvent co-intercalation, graphite exfoliation, transition metal dissolution, dendrite formation, and structural disordering [40]. Finally, parameter L is the parasitic inductance of the circuit and does not affect the battery aging.

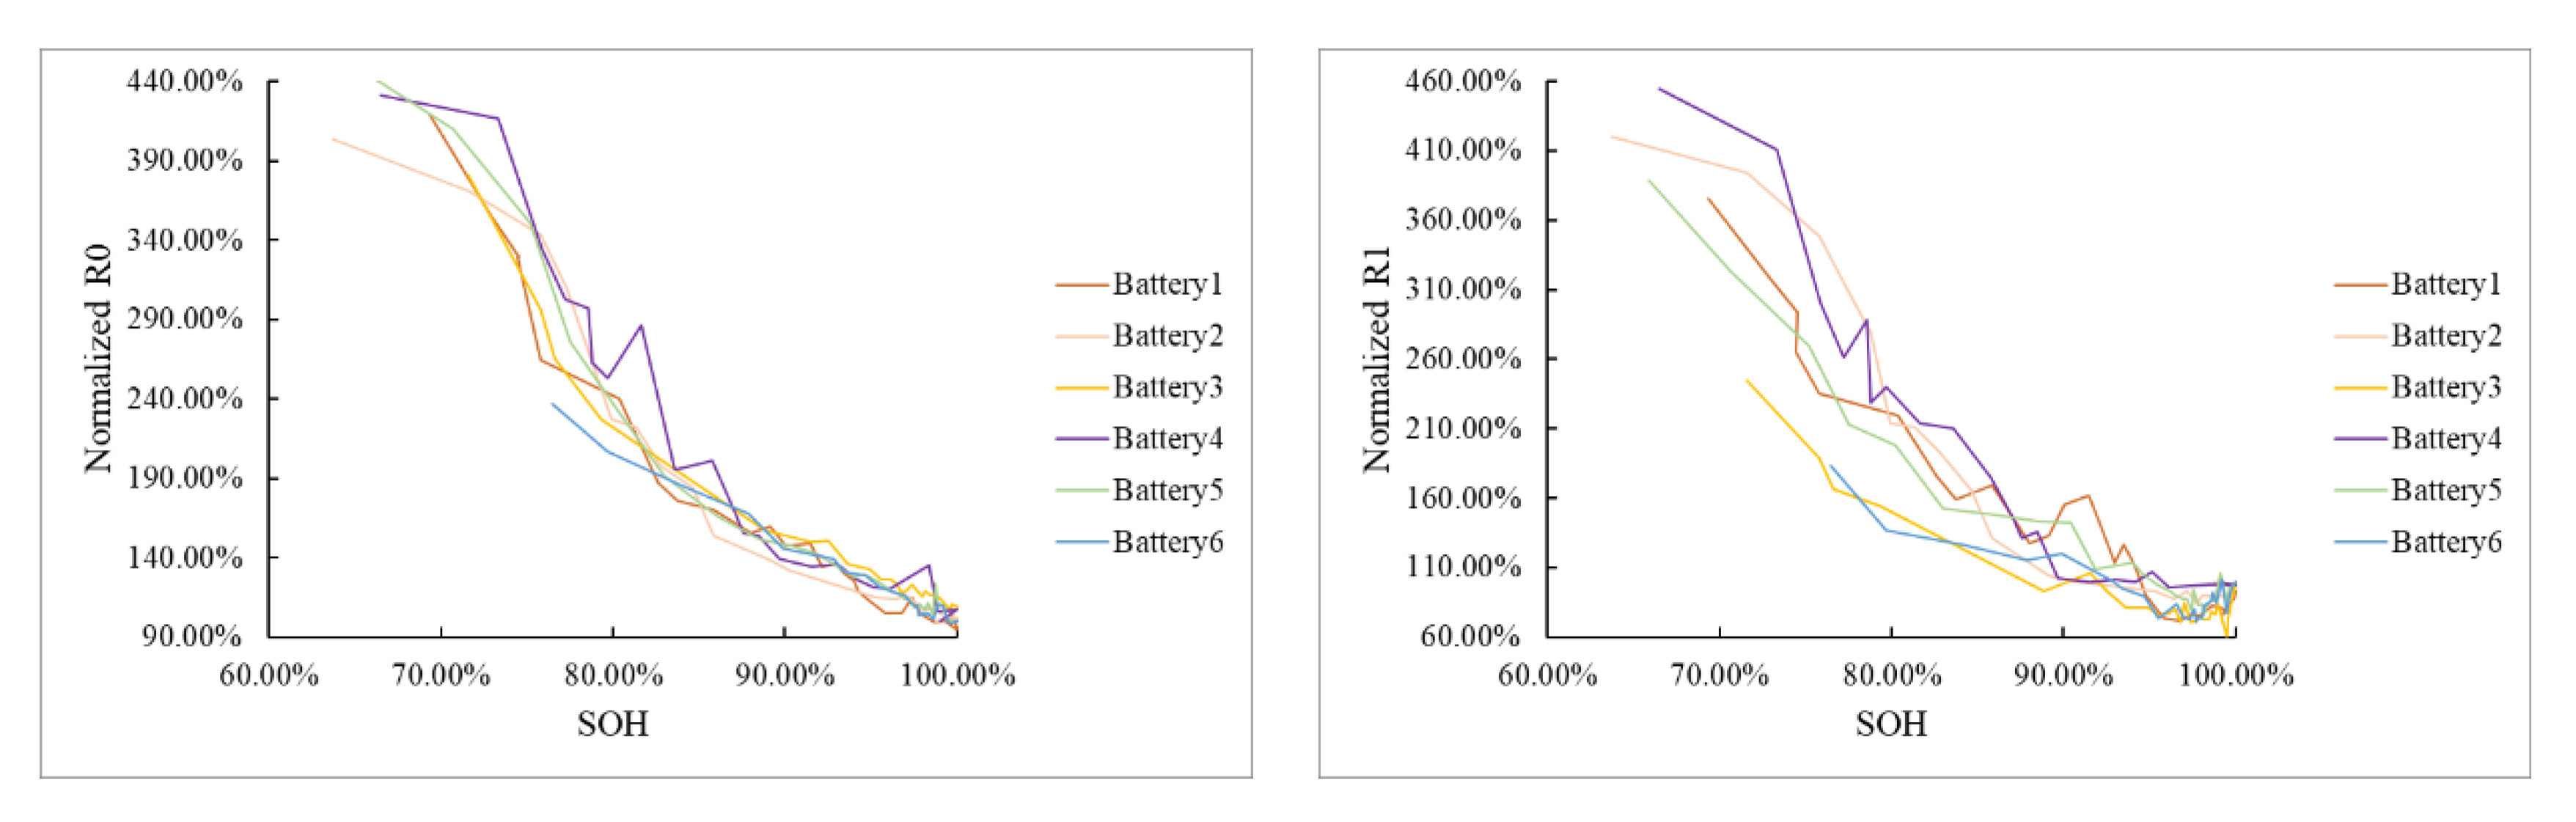
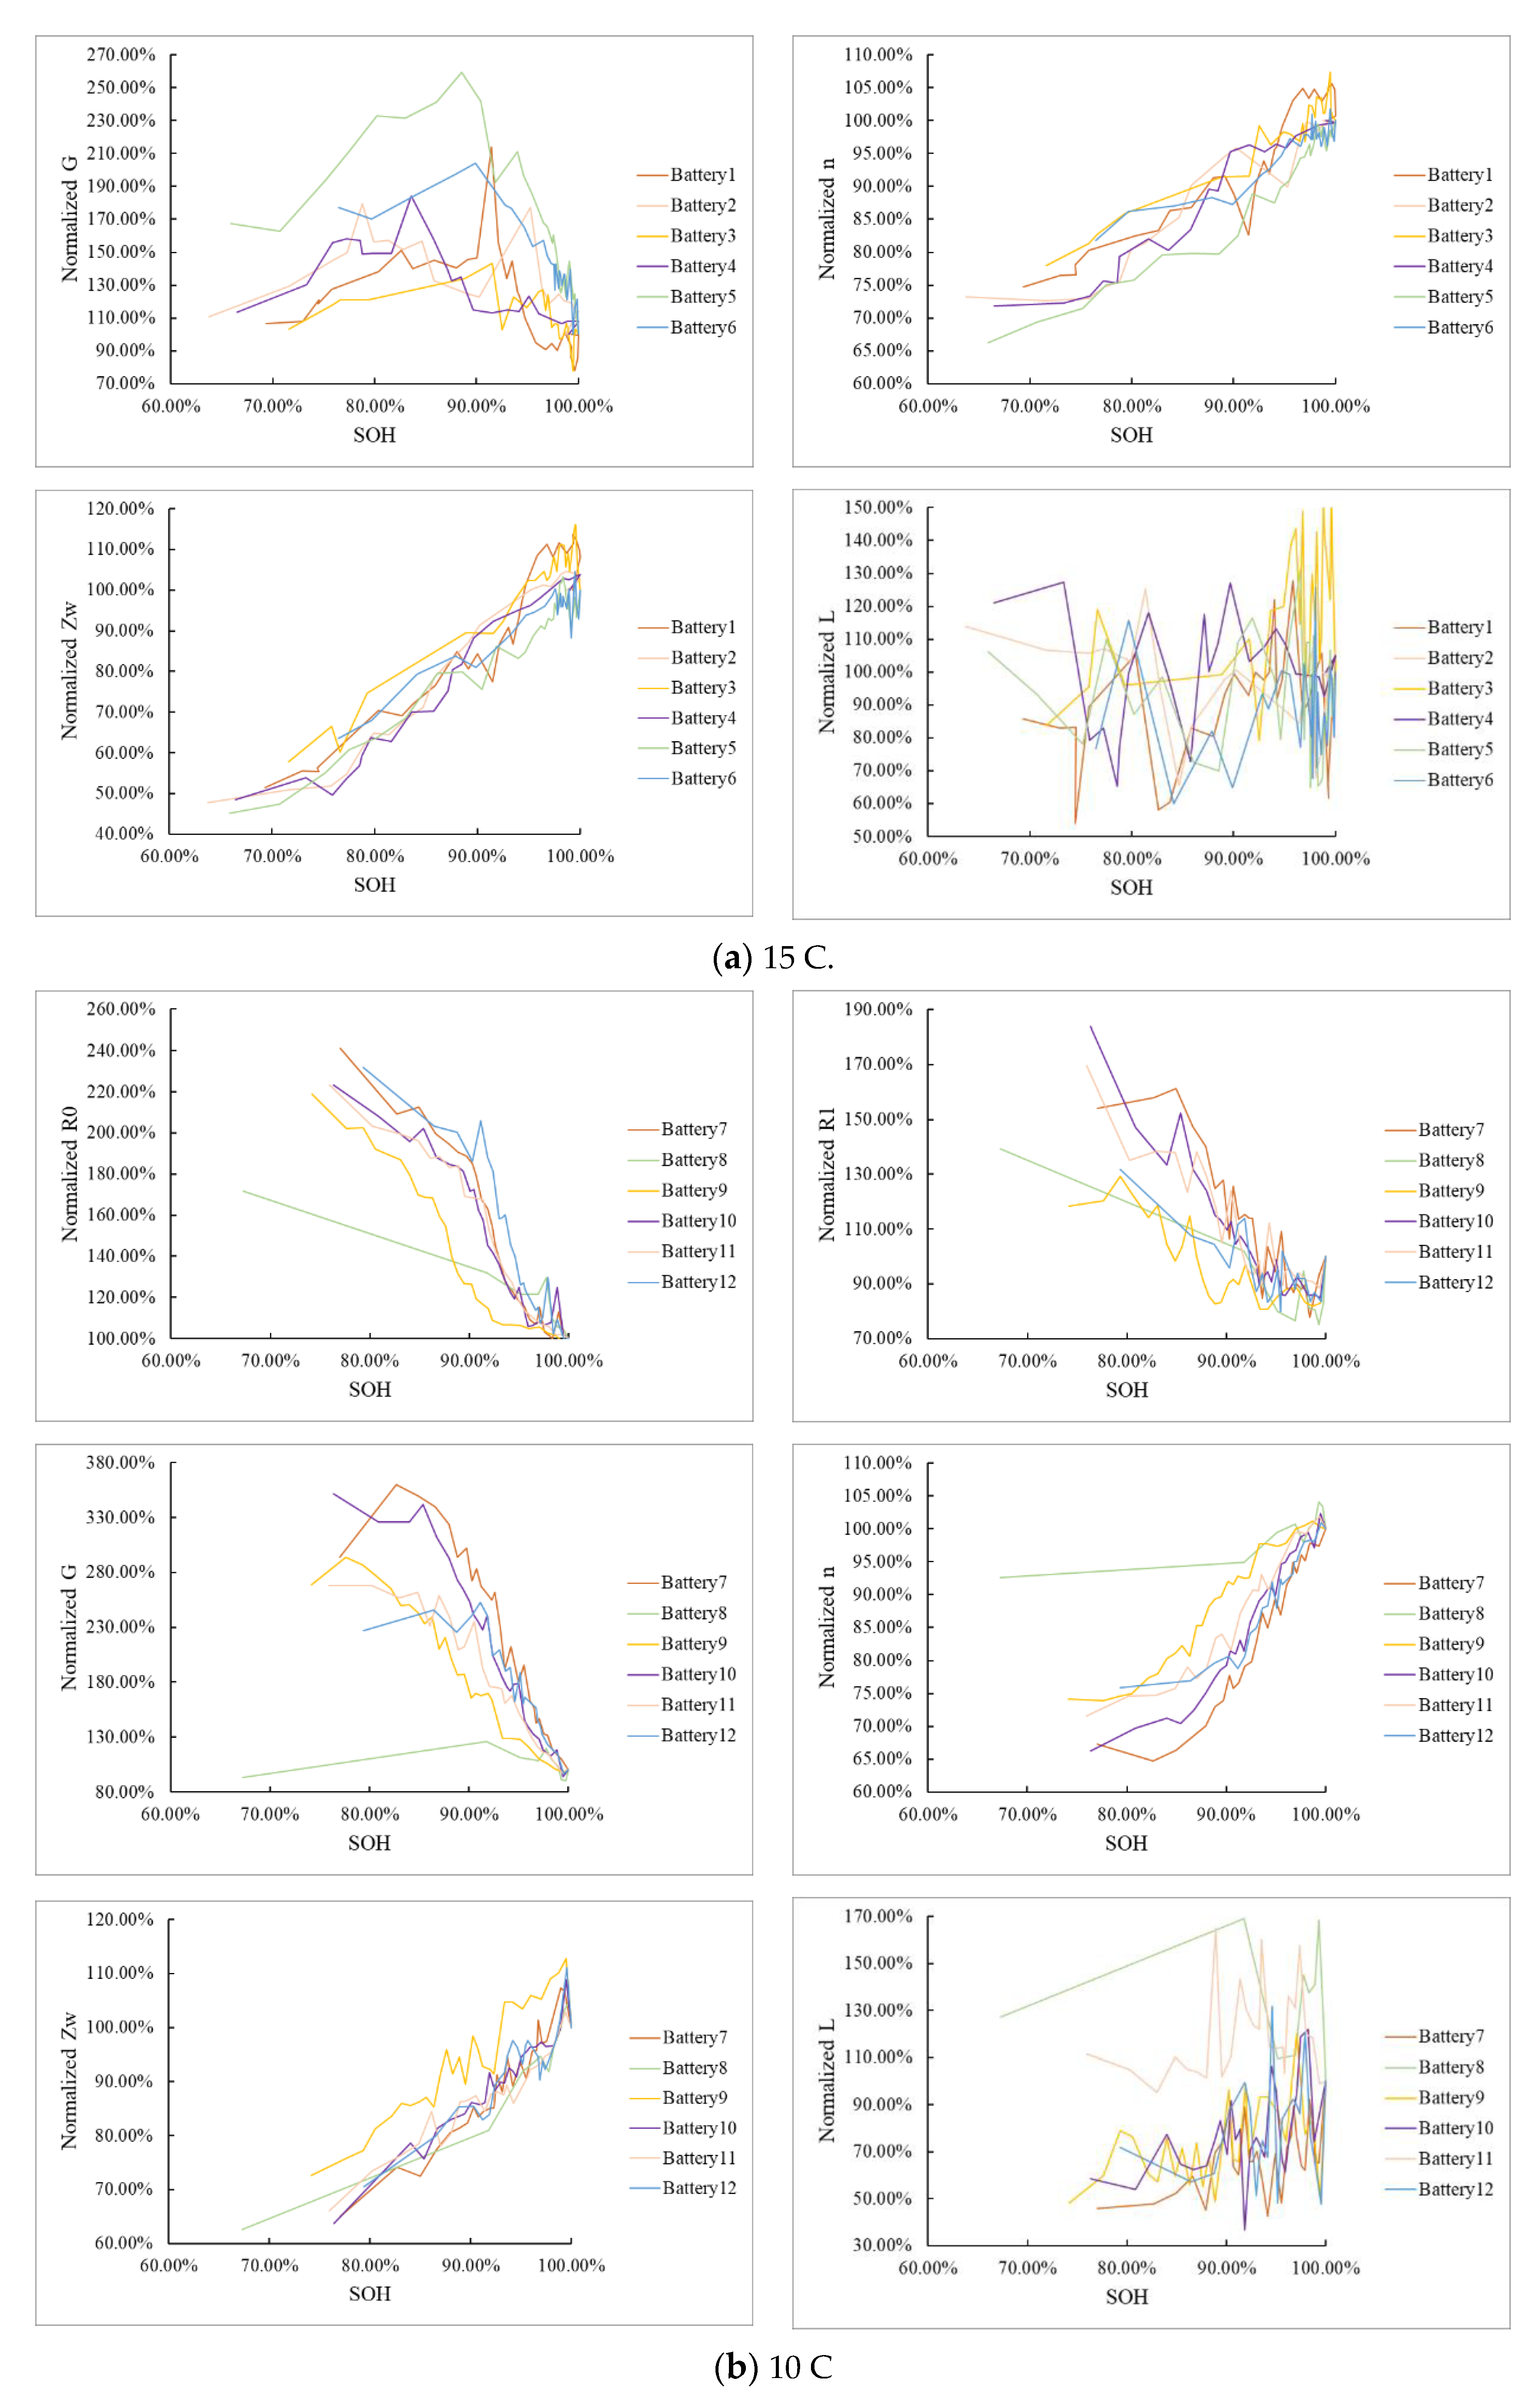
4.2. SOH Estimation Based on EIS

Given the strong linear correlation between the parameters of the battery model and the SOH, we could use a linear regression model to estimate the SOH of the battery based on its EIS. In other words, if we use y to represent the SOH of the battery, x 1 , x 2 , , x i to represent the parameters of the battery model, and β 0 , β 1 , , β i to represent the undetermined coefficients, we have the following:
y = β 0 + β 1 x 1 + + β i x i .
Clearly, the maximum number of i is six, since the battery model has six parameters in total. However, as discussed in the previous section, only four of the parameters had a strong correlation with the SOH; therefore, it was assumed that just four out of the six parameters could be used to reduce the complexity of calculation while maintaining the same prediction accuracy.
Furthermore, under the consideration of the method’s practicality, it is also very meaningful to study the performance of the three-parameter model, with parameter Zw being excluded from the four-parameter model. This is because parameter Zw is mainly related to the low-frequency part of the impedance spectrum and measuring this part can be very time consuming. Specifically, take the impedance spectrum shown in Figure 1 as an example. If the impedance between 0.1 Hz to 0.01 Hz is excluded in the parameter fitting, then the parameter Zw would change by 50%, while the other three SOH-related parameters all change no more than 10%. This means that measuring the battery’s impedance below 0.1 Hz is necessary to obtain the accurate value of Zw, which would take at least several minutes. In comparison, measuring the battery’s impedance spectrum between 1 kHz and 1 Hz only takes no more than a minute. As a result, if the result shows that the estimation model can still maintain a high accuracy after Zw is excluded, this would mean that we can narrow the frequency range in the EIS test and ignore the low-frequency characteristic of the battery, which will significantly reduce the measurement time.
For each discharge rate, we trained the model with data from three batteries and tested its accuracy by applying it to three other batteries. In consideration of the issue mentioned in the former paragraph, we also compare the accuracy of the model when the regression model contains six, four, and three parameters of the battery model. The regression result of each coefficient, and the accuracy of the model (measured by the RMS value of relative error) is presented in Table 2. A comparison of the actual and estimated values of SOH is shown in Figure 6. Besides the regression value, the t statistic (the coefficient divided by its standard error) and p value of each coefficient is presented in Table A1 in Appendix A.
From Table 2 and Figure 6, we can see that the four-parameter model has the highest accuracy, and the RMS of relative error of the three-parameter model is about 0.3% higher than the four-parameter model at both discharge rates, which is not very significant. Since all the parameters in the three-parameter model come from the midrange of the curve, this suggests that measuring the impedance spectrum in the moderate-frequency range (about 1 Hz to 1 kHz) is enough for accurate SOH estimation.

4.3. Determination of Characteristic Frequencies

In the previous section, we established a model to estimate the SOH based on the EIS. However, in practice the EIS can only be acquired with the help of an expensive device, and the acquisition of EIS is time-consuming [26]. In consideration of the time and money involved, it is of merit to find an alternative way to estimate the SOH that can still achieve a high accuracy without measuring the whole impedance spectrum of the battery.
While acquiring EIS takes a lot of effort, measuring the battery’s impedance at one frequency or several specific frequencies is far easier. Since we already discovered the correlation between the parameters of the battery model and the SOH, we naturally thought to find several frequency points at which the battery’s impedance could reflect the value of the parameters of the battery model. As was discussed in Section 2, the parameters R0, R1, and n can all be visualized in the Nyquist curve: R0 is approximately equal to the real part of impedance at the left endpoint of the arc; R0 + R1 is approximately equal to the real part of the impedance at the right end of the arc, where the imaginary part of the impedance reaches its local minimum; and n is related to the angle of the arc. Their mathematical relationship is shown in Figure 2. Since the correlation between these three parameters and the SOH was substantiated in the previous section, this supported the use the impedance of the battery at the left end, right end, and highest point of the arc in the Nyquist curve to estimate the SOH when the whole impedance spectrum was not available. This process is explained in detail in the following three subsections.

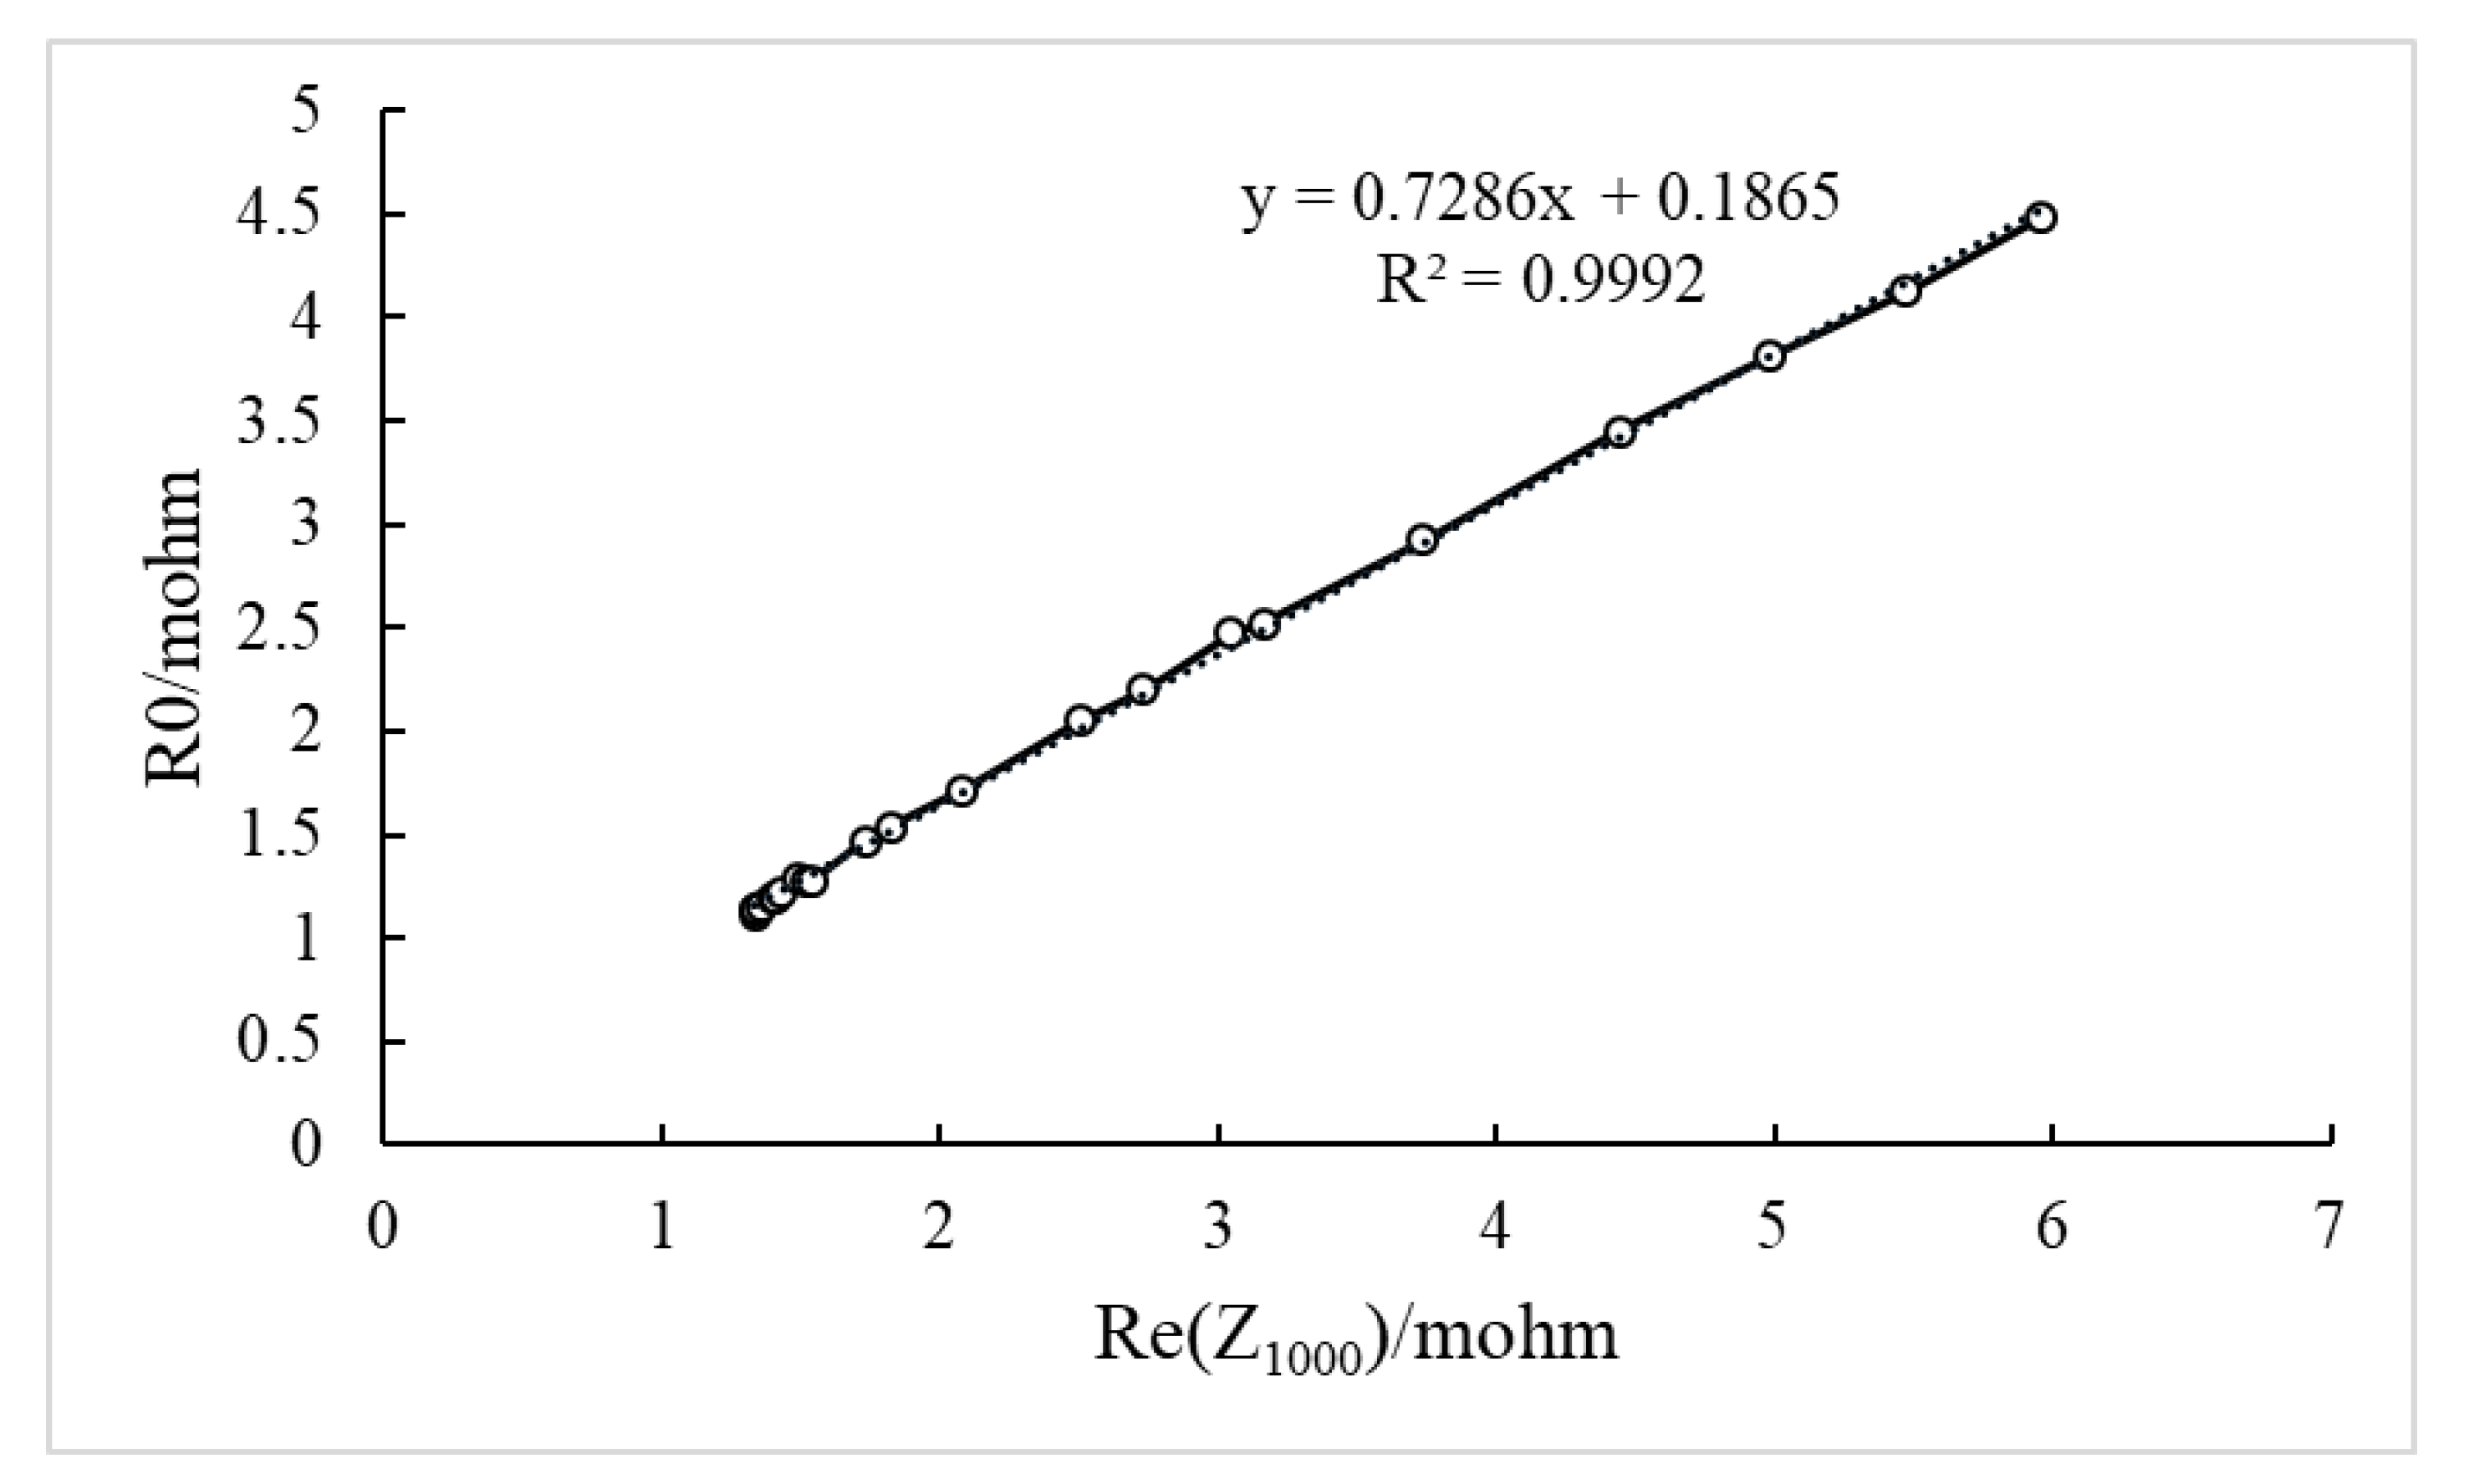
4.3.1. Determination of the Frequency Related to R0

In the Nyquist curve, R0 is approximately equal to the real part of the impedance at the left endpoint of the arc. The frequency corresponding to this point, which is also the resonance frequency of the battery, will gradually change from 800 to approximately 1800 Hz as the SOH of the battery decreases from 100% to approximately 65%. However, within this frequency range the impedance of the battery changes no more than 10%. As a result, theoretically the real part of the impedance at any frequency in this range can reflect the parameter R0 well. In this work, we chose a frequency of 1000 Hz. To validate our theoretical analysis, we drew a curve to show the relationship between the real part of the impedance at 1000 Hz (Re(Z1000)) and R0. We then performed a linear fit to the curve (the result of this is presented in Figure 7), from which a very strong linear correlation can be observed. Although this result shows that R0 and Re(Z1000) are not strictly proportional, their strong linear correlation indicates that in the linear regression model Re(Z1000) can be used to replace R0, and the error in the regression result will change very little.

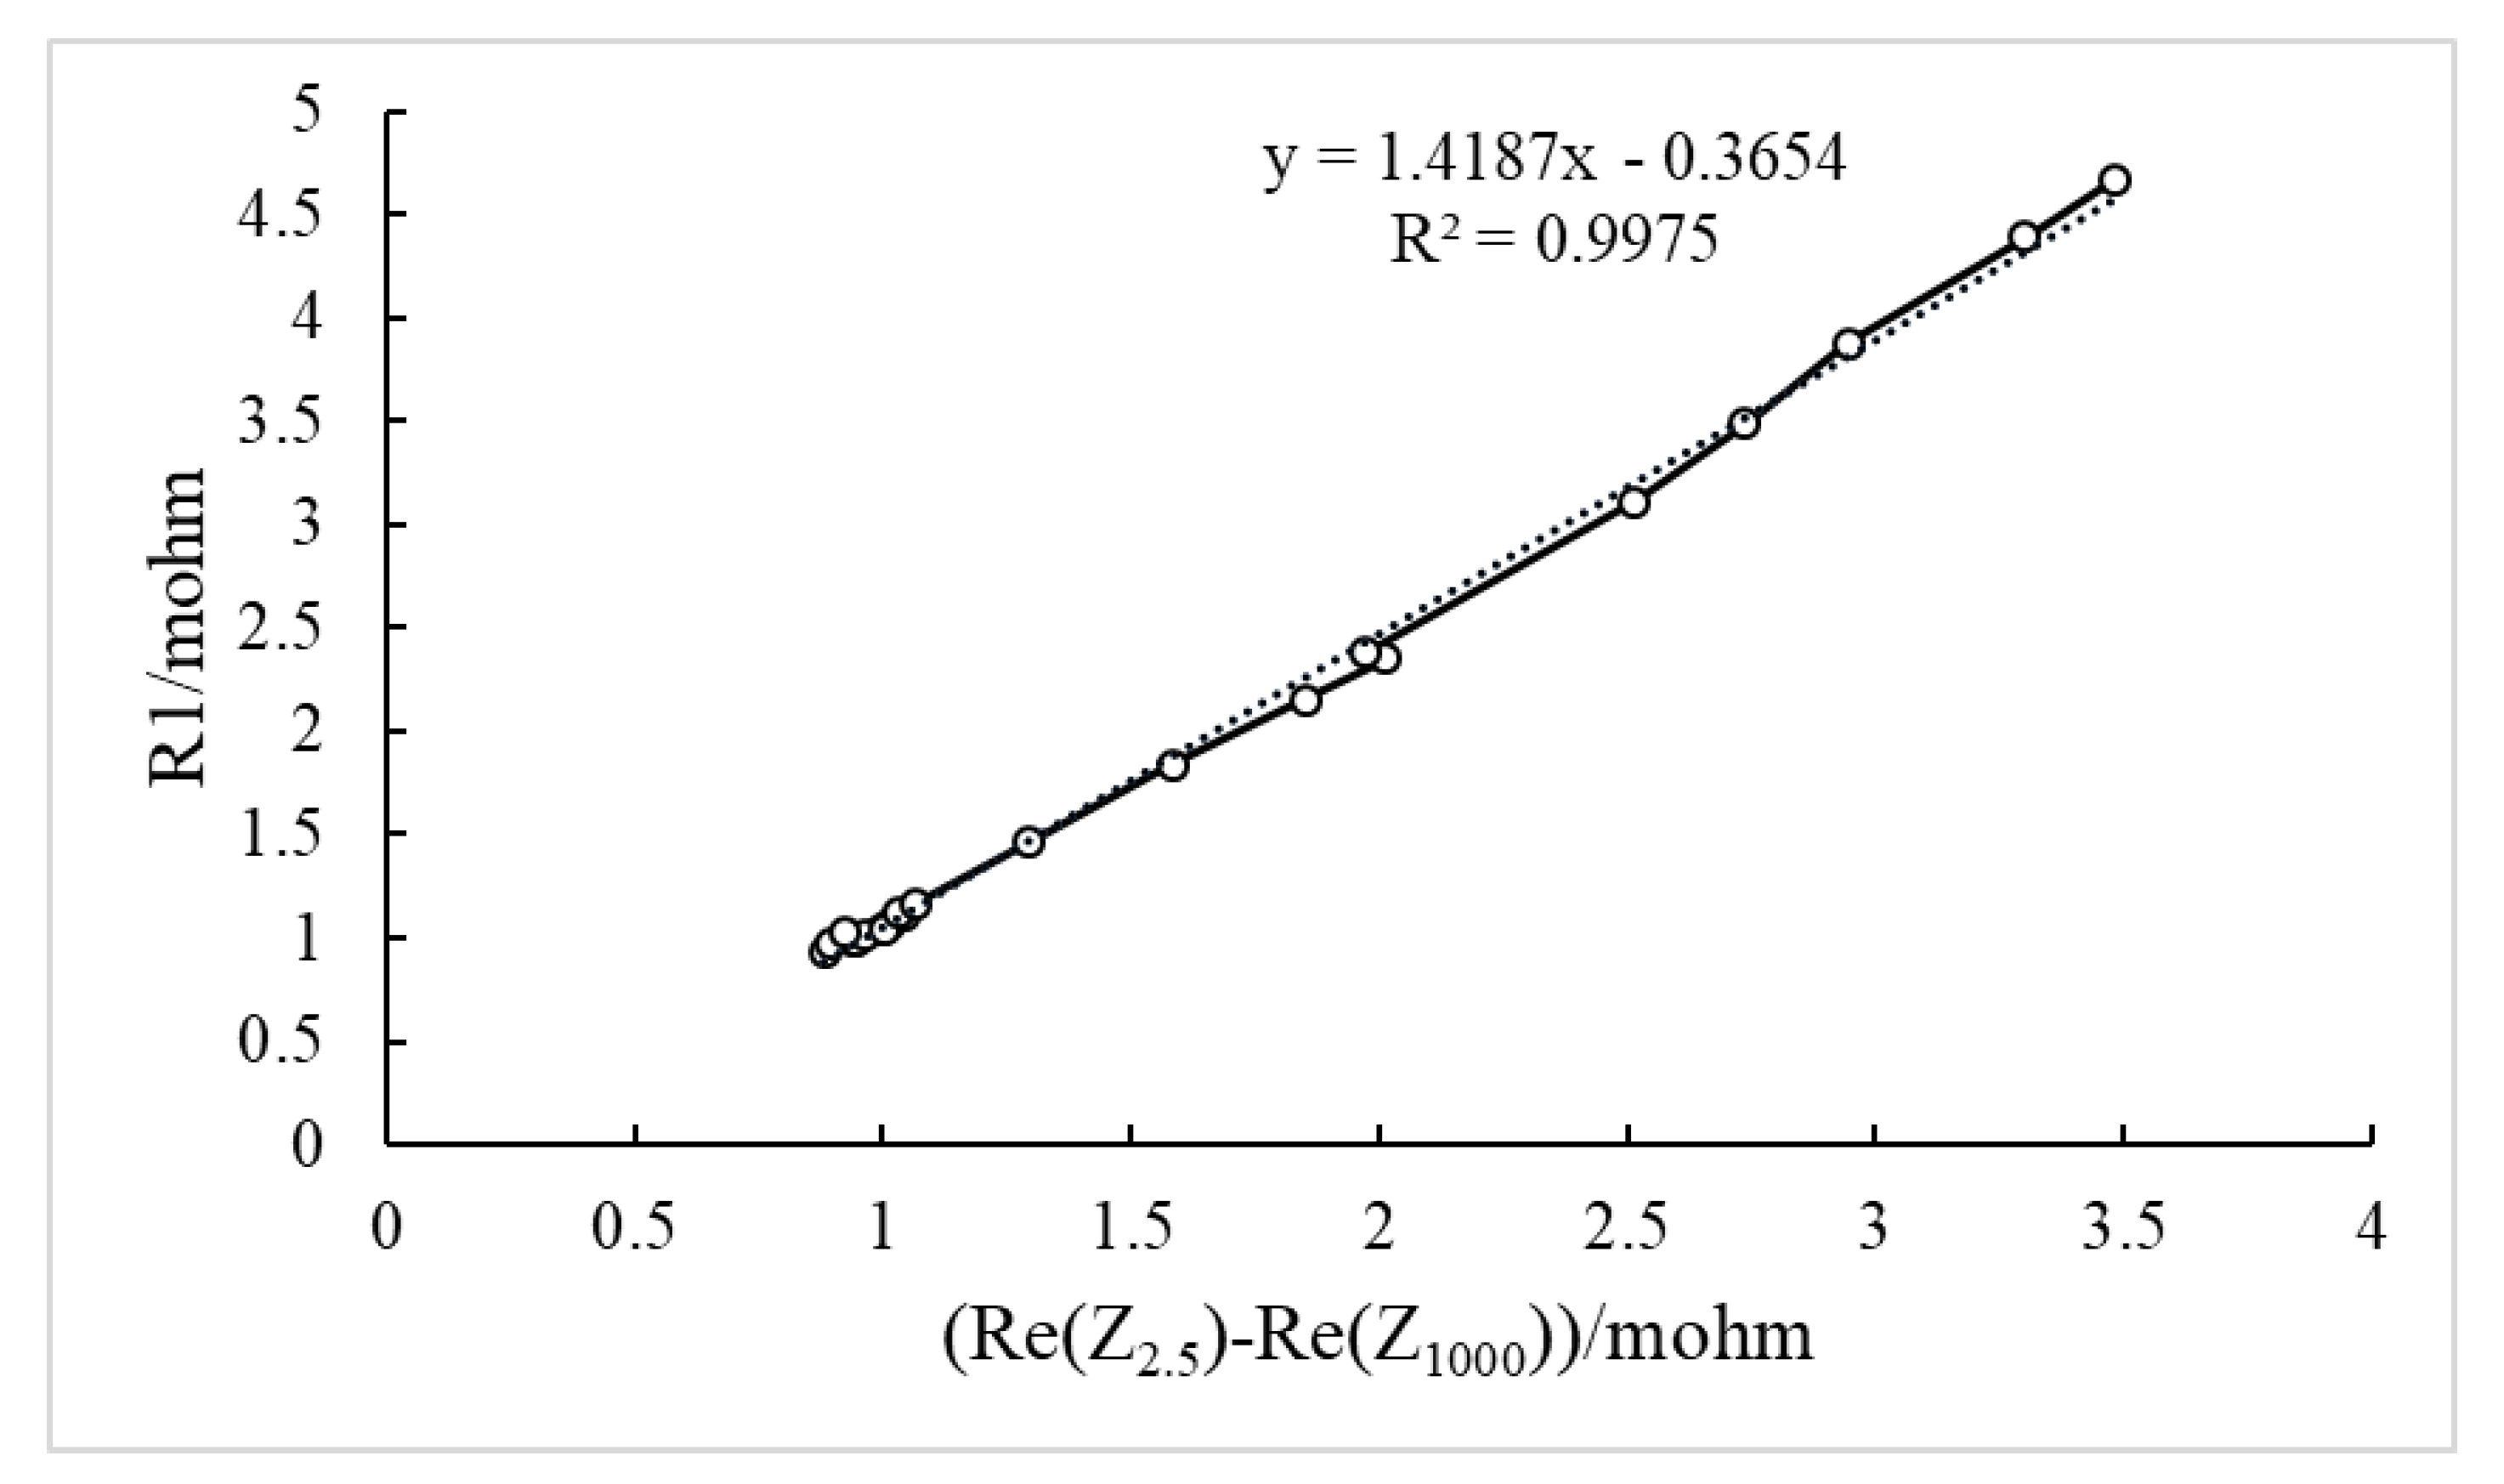
4.3.2. Determination of Frequency Related to R1

The relationship between R1 and the Nyquist curve, on the other hand, is that R0 + R1 is approximately equal to the real part of the impedance at the right endpoint of the arc in the Nyquist curve. The frequency corresponding to the right endpoint of the Nyquist curve will gradually change from 4 to 2 Hz as the SOH of the battery decreases from 100% to approximately 65%. However, as in the previous situation, within this frequency range the impedance of the battery changes no more than 5%; therefore, in the same way the real part of the impedance at any frequency in this range can reflect the parameter R1 well. Here, we chose a frequency of 2.5 Hz. Since Re(Z1000) can be used to approximate R0, we naturally assumed that the difference between the real part of the impedance at 2.5 Hz and that at 1000 Hz, or Re(Z2.5)–Re(Z1000) was strongly correlated with R1. To support this assumption, we drew another curve to show the relationship between Re(Z2.5)–Re(Z1000) and R1. Afterwards, we performed a linear fit to the curve—the results are presented in Figure 8—from which a very strong linear correlation can be observed. This meant that we could use Re(Z2.5)–Re(Z1000) to replace the parameter R1 without amplifying the error.

4.3.3. Determination of Frequency Related to n

As for parameter n, its value is related to the reactance (the imaginary part of the impedance) at the highest point in the middle of the Nyquist curve. According to the geometric relationship shown in Figure 2, at this point we have the following:
Im ( Z ) = R 1 2 ( 1 sin ( n π 2 ) cot ( n π 2 ) ) = R 1 2 tan ( n π 4 ) .
The frequency corresponding to this point will gradually change from 125 to 50 Hz as the SOH of the battery decreases from 100% to approximately 65%. Nevertheless, as in the previous situation, the reactance changes less than 5% in this range, so the reactance at any frequency in this range can reflect parameter n well. Here, we chose the frequency to be 100 Hz and defined Z100 as the impedance at 100 Hz. To prove that Z100 was related to n, we calculated the theoretical value of –Im(Z100) by substituting n into Formula (5) and drew a curve to show its relationship with the experimental value of –Im(Z100). Thereafter, we performed a linear fit to the curve, and the results are given in Figure 9, from which we can see that these two values are almost proportional, and the slope is close to one. However, this does not mean that we can use Z100 to restore the value of n according to the inverse function of the function shown in Formula (5), as parameter R1 is unknown. If we used Re(Z2.5)–Re(Z1000) to substitute R1, the result would be unsatisfactory. A possible explanation for this is that although Re(Z2.5)–Re(Z1000) and R1 had a strong linear correlation, they were not the same. Therefore, here, instead of restoring the value of n by using a function with parameter –Im(Z100) and using the restored value as a parameter in the regression model, we directly used –Im(Z100) as the third and final parameter in the regression model. This approach was based on the approximately linear correlation between –Im(Z100) and the SOH, which is presented in Figure 10.

4.4. SOH Estimation Based on Impedance at Characteristic Frequencies

Having described the correlation between Re(Z2.5); Re(Z1000); –Im(Z100); and R0, R1, and n and the rationality of replacing the last three with the first three parameters for regression analysis, we built a linear regression model to estimate the SOH based on the reactance at 100 Hz and the modulus of the impedance at 1000 and 2.5 Hz. As in the previous section, for each discharge rate we trained the model with data from three batteries and tested its accuracy by applying it to three other batteries. The regression result of each coefficient, and the accuracy of the model (measured by the RMS value of relative error) is presented in Table 3. A comparison of the actual and estimated values of SOH is shown in Figure 11. Besides the regression value, the t statistic (the coefficient divided by its standard error) and p value of each coefficient is presented in Table A2 in Appendix A.
By comparing Table 2 and Table 3, we can see that at 15 C, the characteristic frequency method is less accurate than the EIS method. This is mainly because while the first two parameters in the two methods are almost equivalent due to their strong linear correlation, the third parameter in the characteristic frequency method is less related to the SOH than that in the EIS method, which can be concluded by comparing Figure 6 and Figure 11. However, at 10 C, the accuracy of the characteristic frequency method is almost the same as that of the EIS method.

5. Conclusions

In this work, we measured the impedance spectrum of twelve lithium-ion batteries as their SOH decreased from 100% to below 70% and built a battery model to fit the spectrum. It was shown that some of the parameters from the battery model, including the internal resistance, the diffusion resistance, the phase angle of the CPE, and the modulus of Warburg impedance, were closely related to the SOH of the battery and could be used to build an SOH prediction model. Further investigation showed that ignoring the low-frequency (< 1 Hz) characteristics of the batteries had only a mild effect on the accuracy of the model, suggesting that when the impedance spectrum is measured, the frequency range can be narrowed to 1~1000 Hz. It was also shown that three out of the four SOH-related battery parameters had a very strong correlation with the impedance at three characteristic frequencies from both a theoretical perspective and a practical data perspective. Based on the impedance at these three frequencies, we built another SOH prediction model that is suitable for situations where it is not possible to measure the whole impedance spectrum. The accuracy of this second prediction model was slightly lower than the previous one at 15 C, yet its average relative error was still lower than 5%.
The battery SOH estimation method proposed in this paper can realize accurate SOH estimation by measuring the battery’s impedance at three different frequencies, which can be completed within seconds with low demand for extra devices. The method can be applied in the health monitoring of different kinds of batteries discharged at high rates. Specifically, the method can be applied to batteries that served as backup power for drones, batteries that power electric tools such as drills, or batteries for military use, etc.
Future work could focus on testing the method’s applicability for batteries discharged at lower rates (< 5 C), which is related to use of batteries in power stations for frequency modulation. Moreover, whether the impedance measurement could be carried out when the battery is charging or discharging in the meantime could also be studied in the future.

Author Contributions

Conceptualization, Z.S.; methodology, S.J. and Z.S.; software, S.J.; validation, S.J.; formal analysis, S.J.; investigation, S.J.; resources, Z.S.; data curation, S.J.; writing—original draft preparation, S.J.; writing—review and editing, S.J. and Z.S.; visualization, S.J.; supervision, Z.S.; project administration, Z.S.; funding acquisition, Z.S. All authors have read and agreed to the published version of the manuscript.

Funding

This work was supported by the National Key R&D Program of China, grant number 2018YFB0905605.

Institutional Review Board Statement

Not applicable.

Informed Consent Statement

Not applicable.

Data Availability Statement

Not applicable.

Conflicts of Interest

The authors declare no conflict of interest.

Appendix A

Figure A1. The relationship between the SOH and cycle number.
Energies 14 04833 g0a1
Figure A2. The relationship between the SOH and six normalized battery parameters (normalized according to the initial value).
Energies 14 04833 g0a2aEnergies 14 04833 g0a2b
Table A1. The regression value of different coefficients (EIS method).
Regression Function: y = a0 + a1x1 + a2x2 +…
Regression Coefficientsa0a1a2a3a4a5a6
6-PARM model (15 C)Value0.1553−0.04200.03200.71850.13830.02430.0720
t statistic0.9112−3.78022.61883.27653.84693.59030.3623
p value0.36530.00030.01080.00160.00030.00060.7182
4-PARM model (15 C)Value0.8177−0.05250.0139−0.23250.0003
t statistic10.3665−5.23031.21570.50015.1017
p value0.00000.00000.22800.61850.0000
3-PARM model (15 C)Value0.5532−0.07290.02340.6169
t statistic7.8030−6.19141.86037.4872
p value0.00000.00000.06680.0000
6-PARM model (10 C)Value−1.5530−0.05650.12772.45000.18170.06770.5931
t statistic−1.9177−1.15604.02183.10122.52572.17981.1241
p value0.05990.25230.00020.00290.01420.03320.2655
4-PARM model (10 C)Value0.7217−0.05600.01340.06500.1840
t statistic3.3933−3.63463.0468−1.30093.8290
p value0.00120.00060.00340.19810.0003
3-PARM model (10 C)Value1.1990−0.19220.0555−0.1140
t statistic5.2254−4.34841.6565−0.4884
p value0.00000.00010.10260.6270
Table A2. The regression value of different coefficients (characteristic frequency method).
Regression Function: y = a0 + a1x1 + a2x2 + a3x3
Regression Coefficientsa0a1a2a3
15 CValue1.0660−0.0895−0.09740.0210
Standard error89.6795−2.8865−0.86070.7507
p value0.00000.00510.39220.4552
10 CValue1.1120−0.3384−0.42100.1831
t statistic20.084−3.145−1.7782.226
p value0.0000.00250.08030.0296

References

  1. Li, Y.; Liu, K.; Foley, A.M.; Zülke, A.; Berecibar, M.; Nanini-Maury, E.; Van Mierlo, J.; Hoster, H.E. Data-Driven Health Estimation and Lifetime Prediction of Lithium-Ion Batteries: A Review. Renew. Sustain. Energy Rev. 2019, 113, 109254. [Google Scholar] [CrossRef]
  2. Ge, M.-F.; Liu, Y.; Jiang, X.; Liu, J. A Review on State of Health Estimations and Remaining Useful Life Prognostics of Lithium-Ion Batteries. Measurement 2021, 174, 109057. [Google Scholar] [CrossRef]
  3. Wong, D.N.; Wetz, D.A.; Heinzel, J.M.; Mansour, A.N. Characterizing Rapid Capacity Fade and Impedance Evolution in High Rate Pulsed Discharged Lithium Iron Phosphate Cells for Complex, High Power Loads. J. Power Sources 2016, 328, 81–90. [Google Scholar] [CrossRef] [Green Version]
  4. Islam, M.M.; Zhong, X.; Sun, Z.; Xiong, H.; Hu, W. Real-Time Frequency Regulation Using Aggregated Electric Vehicles in Smart Grid. Comput. Ind. Eng. 2019, 134, 11–26. [Google Scholar] [CrossRef]
  5. Spotnitz, R. Simulation of Capacity Fade in Lithium-Ion Batteries. J. Power Sources 2003, 113, 72–80. [Google Scholar] [CrossRef]
  6. Arora, P.; White, R.; Doyle, M. Capacity Fade Mechanisms and Side Reactions in Lithium-Ion Batteries. J. Electrochem. Soc. 1998, 145, 3647–3667. [Google Scholar] [CrossRef] [Green Version]
  7. van Schalkwijk, W.; Scrosati, B. Advances in Lithium-Ion Batteries, 1st ed.; Springer: New York, NY, USA, 2002; ISBN 9780306475085. [Google Scholar]
  8. Broussely, M.; Herreyre, S.; Biensan, P.; Kasztejna, P.; Nechev, K.; Staniewicz, R.J. Aging Mechanism in Li Ion Cells and Calendar Life Predictions. J. Power Sources 2001, 97–98, 13–21. [Google Scholar] [CrossRef]
  9. Markovsky, B.; Rodkin, A.; Cohen, Y.S.; Palchik, O.; Levi, E.; Aurbach, D.; Kim, H.-J.; Schmidt, M. The Study of Capacity Fading Processes of Li-Ion Batteries: Major Factors That Play a Role. J. Power Sources 2003, 119–121, 504–510. [Google Scholar] [CrossRef]
  10. Berecibar, M.; Gandiaga, I.; Villarreal, I.; Omar, N.; Van Mierlo, J.; Van den Bossche, P. Critical Review of State of Health Estimation Methods of Li-Ion Batteries for Real Applications. Renew. Sustain. Energy Rev. 2016, 56, 572–587. [Google Scholar] [CrossRef]
  11. Pastor-Fernández, C.; Yu, T.F.; Widanage, W.D.; Marco, J. Critical Review of Non-Invasive Diagnosis Techniques for Quantification of Degradation Modes in Lithium-Ion Batteries. Renew. Sustain. Energy Rev. 2019, 109, 138–159. [Google Scholar] [CrossRef]
  12. Hu, C.; Youn, B.D.; Chung, J. A Multiscale Framework with Extended Kalman Filter for Lithium-Ion Battery SOC and Capacity Estimation. Appl. Energy 2012, 92, 694–704. [Google Scholar] [CrossRef]
  13. Fang, L.; Li, J.; Peng, B. Online Estimation and Error Analysis of Both SOC and SOH of Lithium-Ion Battery Based on DEKF Method. Energy Procedia 2019, 158, 3008–3013. [Google Scholar] [CrossRef]
  14. Mawonou, K.S.R.; Eddahech, A.; Dumur, D.; Beauvois, D.; Godoy, E. Improved State of Charge Estimation for Li-Ion Batteries Using Fractional Order Extended Kalman Filter. J. Power Sources 2019, 435, 226710. [Google Scholar] [CrossRef]
  15. Li, Y.; Abdel-Monem, M.; Gopalakrishnan, R.; Berecibar, M.; Nanini-Maury, E.; Omar, N.; van den Bossche, P.; Van Mierlo, J. A Quick On-Line State of Health Estimation Method for Li-Ion Battery with Incremental Capacity Curves Processed by Gaussian Filter. J. Power Sources 2018, 373, 40–53. [Google Scholar] [CrossRef]
  16. Xing, Y.; Ma, E.W.M.; Tsui, K.-L.; Pecht, M. An Ensemble Model for Predicting the Remaining Useful Performance of Lithium-Ion Batteries. Microelectron. Reliab. 2013, 53, 811–820. [Google Scholar] [CrossRef]
  17. Waag, W.; Käbitz, S.; Sauer, D.U. Experimental Investigation of the Lithium-Ion Battery Impedance Characteristic at Various Conditions and Aging States and Its Influence on the Application. Appl. Energy 2013, 102, 885–897. [Google Scholar] [CrossRef]
  18. Wang, L.; Pan, C.; Liu, L.; Cheng, Y.; Zhao, X. On-Board State of Health Estimation of LiFePO4 Battery Pack through Differential Voltage Analysis. Appl. Energy 2016, 168, 465–472. [Google Scholar] [CrossRef]
  19. Galeotti, M.; Cinà, L.; Giammanco, C.; Cordiner, S.; Di Carlo, A. Performance Analysis and SOH (State of Health) Evaluation of Lithium Polymer Batteries through Electrochemical Impedance Spectroscopy. Energy 2015, 89, 678–686. [Google Scholar] [CrossRef]
  20. Murariu, T.; Morari, C. Time-Dependent Analysis of the State-of-Health for Lead-Acid Batteries: An EIS Study. J. Energy Storage 2019, 21, 87–93. [Google Scholar] [CrossRef]
  21. Stevanatto, L.C.; Brusamarello, V.J.; Tairov, S. Parameter Identification and Analysis of Uncertainties in Measurements of Lead–Acid Batteries. IEEE Trans. Instrum. Meas. 2014, 63, 761–768. [Google Scholar] [CrossRef]
  22. Haiying, W.; Long, H.; Jianhua, S.; Shuanquan, L.; Feng, W. Study on Correlation with SOH and EIS Model of Li-Ion Battery. In Proceedings of the 2011 6th International Forum on Strategic Technology, Harbin, China, 22–24 August 2011; Volume 1, pp. 261–264. [Google Scholar]
  23. Mingant, R.; Bernard, J.; Sauvant-Moynot, V.; Delaille, A.; Mailley, S.; Hognon, J.-L.; Huet, F. EIS Measurements for Determining the SoC and SoH of Li-ion Batteries. In Battery/Energy Technology (General)—218th Ecs Meeting; Dudney, N., Johnson, C., Yakovleva, M., Eds.; Electrochemical Society, Inc.: Pennington, NJ, USA, 2011; Volume 33, pp. 41–53. ISBN 9781607682493. [Google Scholar]
  24. Lin, Q.; Wang, J.; Xiong, R.; Shen, W.; He, H. Towards a Smarter Battery Management System: A Critical Review on Optimal Charging Methods of Lithium Ion Batteries. Energy 2019, 183, 220–234. [Google Scholar] [CrossRef]
  25. Meng, J.; Cai, L.; Luo, G.; Stroe, D.-I.; Teodorescu, R. Lithium-Ion Battery State of Health Estimation with Short-Term Current Pulse Test and Support Vector Machine. Microelectron. Reliab. 2018, 88–90, 1216–1220. [Google Scholar] [CrossRef]
  26. Mingant, R.; Bernard, J.; Sauvant-Moynot, V. Novel State-of-Health Diagnostic Method for Li-Ion Battery in Service. Appl. Energy 2016, 183, 390–398. [Google Scholar] [CrossRef] [Green Version]
  27. Mingant, R.; Bernard, J.; Sauvant-Moynot, V. Towards Onboard Li-Ion Battery State-of-Health Diagnosis by a Virtual Sensor. World Electr. Veh. J. 2012, 5, 405–411. [Google Scholar] [CrossRef] [Green Version]
  28. Ning, G.; Haran, B.; Popov, B.N. Capacity Fade Study of Lithium-Ion Batteries Cycled at High Discharge Rates. J. Power Sources 2003, 117, 160–169. [Google Scholar] [CrossRef]
  29. Sun, S.; Guan, T.; Cheng, X.; Zuo, P.; Gao, Y.; Du, C.; Yin, G. Accelerated Aging and Degradation Mechanism of LiFePO4/Graphite Batteries Cycled at High Discharge Rates. RSC Adv. 2018, 8, 25695–25703. [Google Scholar] [CrossRef] [Green Version]
  30. Liu, Z.; Wang, C.; Miao, C.; Gao, Y.; Sun, Y. Aging Characteristics of Lithium Titanate Batteries under Ultrahigh Discharge Rate. In Proceedings of the 2021 International Conference on Power Grid System and Green Energy (PGSGE 2021), Wuhan, China, 26–28 March 2021; Volume 252. [Google Scholar] [CrossRef]
  31. Iurilli, P.; Brivio, C.; Wood, V. On the Use of Electrochemical Impedance Spectroscopy to Characterize and Model the Aging Phenomena of Lithium-Ion Batteries: A Critical Review. J. Power Sources 2021, 505, 229860. [Google Scholar] [CrossRef]
  32. Zhang, Y.; Wang, C.-Y. Cycle-Life Characterization of Automotive Lithium-Ion Batteries with LiNiO2 Cathode. J. Electrochem. Soc. 2009, 156, A527–A535. [Google Scholar] [CrossRef]
  33. Eddahech, A.; Briat, O.; Henry, H.; Delétage, J.-Y.; Woirgard, E.; Vinassa, J.-M. Ageing Monitoring of Lithium-Ion Cell during Power Cycling Tests. Microelectron. Reliab. 2011, 51, 1968–1971. [Google Scholar] [CrossRef]
  34. Wong, D.; Shrestha, B.; Wetz, D.A.; Heinzel, J.M. Impact of High Rate Discharge on the Aging of Lithium Nickel Cobalt Aluminum Oxide Batteries. J. Power Sources 2015, 280, 363–372. [Google Scholar] [CrossRef]
  35. Chen, L.; Lü, Z.; Lin, W.; Li, J.; Pan, H. A New State-of-Health Estimation Method for Lithium-Ion Batteries through the Intrinsic Relationship between Ohmic Internal Resistance and Capacity. Measurement 2018, 116, 586–595. [Google Scholar] [CrossRef]
  36. Zhang, Q.; Li, X.; Du, Z.; Liao, Q. Aging Performance Characterization and State-of-Health Assessment of Retired Lithium-Ion Battery Modules. J. Energy Storage 2021, 40, 102743. [Google Scholar] [CrossRef]
  37. Remmlinger, J.; Buchholz, M.; Meiler, M.; Bernreuter, P.; Dietmayer, K. State-of-Health Monitoring of Lithium-Ion Batteries in Electric Vehicles by on-Board Internal Resistance Estimation. J. Power Sources 2011, 196, 5357–5363. [Google Scholar] [CrossRef]
  38. Oldenburger, M.; Bedürftig, B.; Gruhle, A.; Grimsmann, F.; Richter, E.; Findeisen, R.; Hintennach, A. Investigation of the Low Frequency Warburg Impedance of Li-Ion Cells by Frequency Domain Measurements. J. Energy Storage 2019, 21, 272–280. [Google Scholar] [CrossRef]
  39. Xiong, R.; Pan, Y.; Shen, W.; Li, H.; Sun, F. Lithium-Ion Battery Aging Mechanisms and Diagnosis Method for Automotive Applications: Recent Advances and Perspectives. Renew. Sustain. Energy Rev. 2020, 131, 110048. [Google Scholar] [CrossRef]
  40. Pastor-Fernández, C.; Dhammika Widanage, W.; Marco, J.; Gama-Valdez, M.-Á.; Chouchelamane, G.H. Identification and Quantification of Ageing Mechanisms in Lithium-Ion Batteries Using the EIS Technique. In Proceedings of the 2016 IEEE Transportation Electrification Conference and Expo (ITEC), Dearborn, MI, USA, 27–29 June 2016; pp. 1–6. [Google Scholar]
Figure 1. An example of Bode and Nyquist curves of a fully charged lithium-ion battery.
Energies 14 04833 g001
Figure 2. The Nyquist curve of two different equivalent circuits.
Energies 14 04833 g002
Figure 3. The equivalent circuit of the whole battery.
Energies 14 04833 g003
Figure 4. Bode curve and Nyquist curve of the battery after different numbers of cycles (15 C).
Energies 14 04833 g004
Figure 5. The relationship between the SOH and normalized battery parameters at two different discharge rates.
Energies 14 04833 g005
Figure 6. A comparison of the actual and predicted values of SOH (EIS method).
Energies 14 04833 g006
Figure 7. The correlation between Re(Z1000) and R0.
Energies 14 04833 g007
Figure 8. The correlation between Re(Z2.5)–Re(Z1000) and R1.
Energies 14 04833 g008
Figure 9. The correlation between the reactance at 100 Hz and n.
Energies 14 04833 g009
Figure 10. The correlation between the reactance at 100 Hz and the SOH.
Energies 14 04833 g010
Figure 11. A comparison of the actual and predicted values of SOH (characteristic frequency method).
Energies 14 04833 g011
Table 1. Specifications of the parameters of battery cells.
ItemManufacturerCharacteristics
High Discharge Li-PO BatteryGREPOWCapacity: 5000 mAh
Voltage: 3.7 V
Continuous discharge current: 200 A
Recommended charge current: 10 A
Table 2. Results of the regression model (EIS method).
Symbolsyx1x2x3x4x5x6
MeaningsSOH/1R0/mohmR1/mohmn/1Zw/(103 × S × s0.5)G/(S × sn)L/μH
ResultsModel with Six ParametersModel with Four ParametersModel with Three Parameters
Regression Function (15 C) y = 0.1553 0.042 x 1 + 0.032 x 2 + 0.7185 x 3 + 0.1383 x 4 + 0.0243 x 5 + 0.072 x 6 y = 0.8177 0.0525 x 1 + 0.01388 x 2 0.2325 x 3 + 0.000288 x 4 y = 0.5532 0.0729 x 1 + 0.0234 x 2 + 0.6191 x 3
RMS of relative error2.76%2.51%2.78%
Regression Function (10 C) y = 1.553 0.0565 x 1 + 0.1277 x 2 + 2.45 x 3 + 0.1817 x 4 + 0.0677 x 5 + 0.5931 x 6 y = 0.7217 0.056 x 1 + 0.0134 x 2 + 0.065 x 3 + 0.184 x 4 y = 1.199 0.1922 x 1 + 0.0555 x 2 0.114 x 3
RMS of relative error4.19%3.1%3.41%
Table 3. Results of the regression model (characteristic frequency method).
Symbolsyx1x2x3
MeaningsSOH/1Re(Z1000)/mohm–Im(Z100)/mohmRe(Z2.5)/mohm
Regression Function (at 15 C) y = 1.066 0.0895 x 1 0.0974 x 2 + 0.021 x 3
RMS of relative error4.25%
Regression Function (at 10 C) y = 1.112 0.3384 x 1 0.421 x 2 + 0.1831 x 3
RMS of relative error3.11%
Publisher’s Note: MDPI stays neutral with regard to jurisdictional claims in published maps and institutional affiliations.

