Article

Demand-Side Management for Improvement of the Power Quality in Smart Homes Using Non-Intrusive Identification of Appliance Usage Patterns with the True Power Factor

by
Hari Prasad Devarapalli
1,2,*,
Venkata Samba Sesha Siva Sarma Dhanikonda
2 and
Sitarama Brahmam Gunturi
3
1
Corporate Industry Forums and Standards Cell, A Unit of Corporate RnI, Tata Consultancy Services, Hyderabad T.S 500019, India
2
Department of Electrical Engineering, National Institute of Technology Warangal, Warangal T.S 506004, India
3
Component Engineering Group, Tata Consultancy Services, Hyderabad T.S 500019, India
*
Author to whom correspondence should be addressed.
Energies 2021, 14(16), 4837; https://doi.org/10.3390/en14164837
Submission received: 13 July 2021 / Revised: 31 July 2021 / Accepted: 6 August 2021 / Published: 8 August 2021

Abstract

:
The proliferation of low-power consumer electronic appliances (LPCEAs) is on the rise in smart homes in order to save energy. On the flip side, the current harmonics induced due to these LPCEAs pollute low-voltage distribution systems’ (LVDSs’) supplies, leading to a poor power factor (PF). Further, the energy meters in an LVDS do not measure both the total harmonic distortion (THD) of the current and the PF, resulting in inaccurate billing for energy consumption. In addition, this impacts the useful lifetime of LPCEAs. A PF that takes the harmonic distortion into account is called the true power factor (TPF). It is imperative to measure it accurately. This article measures the TPF using a four-term minimal sidelobe cosine-windowed enhanced dual-spectrum line interpolated Fast Fourier Transform (FFT). The proposed method was used to measure the TPF with a National Instruments cRIO-9082 real-time (RT) system, and four different LPCEAs in a smart home were considered. The RT results exhibited that the TPF uniquely identified each usage pattern of the LPCEAs and could use them to improve the TPF by suggesting an alternative usage pattern to the consumer. A positive response behavior on the part of the consumer that is in their interest can improve the power quality in a demand-side management application.

Graphical Abstract

1. Introduction

Clean and affordable energy—Goal no. 7 of United Nations’ Sustainable Development Goals (SDGs)—is targeted for achievement by 2030. Demand-side management (DSM) plays a vital role in accomplishing this goal [1]. Clean energy is normally interpreted as green energy that is generated with renewable non-fossil fuels to reduce climate pollution. Interestingly, in its policies, the Government of India has articulated very well that both green energy and electrical power quality (PQ) are essential and need to be in balance without any ambiguity [2,3]. In this article, the authors consider the latter part of the interpretation of clean electrical energy.

1.1. Perspectives on Demand-Side Management

Consumers must be cognizant of unnecessary consumption and conscious of not polluting the power supply. To achieve the latter part of SDG 7—affordable energy—a wide range of technologies, such as compact fluorescent lamps (CFLs) and light-emitting diode (LED) lamps, have been deployed on a large scale by all nations across the globe, including India. This has led to indiscriminatory usage of consumer electronic appliances (smart TVs, smart phones, smart fridges, etc.) and computers with SMPS. This pervasive usage of low-power consumer electronic appliances (LPCEAs) is defeating the very purpose of SDG 7—clean energy with quality electric power. The traditional approach to DSM is primarily focused on energy conservation, and improvements in the true power factor (TPF) could effectively be achieved by way of a human-in-the-loop DSM [4]. The purpose of this paper is to ensure affordable power and to ensure that LPCEAs do not cause issues of poor PQ in low-voltage distribution system (LVDSs).
The PQ in an LVDS is multi-dimensional and includes both the current harmonics and the power factor (PF). The ill effects of current harmonics have been discussed in detail [5,6,7]. While current harmonics themselves are not healthy, they also result in a poor PF due to the bidirectional exchange of reactive power between the source and the load. The current harmonics and the poor PF negatively affect the accuracy of electricity meters and the PQ of the distribution system’s supply [8,9,10]. The existing smart energy meters in our distribution systems are not designed to measure the TPF and reactive power; hence, they are not billed to the consumers. So, the need to bill consumers for poor PQ caused by their behavior is not recognized, and hence, the requirement of compensation of reactive power has gone unnoticed [11,12,13]. Therefore, the authors feel strongly that the DSM for the PQ is the need of the hour, and serious attention is required in order to measure and address issues of poor PQ in LVDSs and to meet SDG 7—affordable, clean, and quality energy for all.

1.2. Non-Intrusive Monitoring of the Usage of Appliances

While homes use several electric and electronic appliances, the energy consumption is measured at a single point of common coupling (PCC) of the supply mains from the distribution system. Several techniques have been explored by various researchers since G.W. Hart explored the idea of the disaggregation of electric loads and identified the usage of individual appliances in order to prompt responsible energy consumption and healthy consumer behavior [14]. A cooperative response from consumers to the insights from this critical objective analysis will help in achieving the energy conservation targets set by the United Nations. Hart’s work was performed at a time when energy availability was not in abundance. With the advent of energy-efficient smart appliances, the average energy consumption has come down significantly. Yang H. et al. articulated in detail that the DSM in smart homes is focused on the PQ issues introduced by smart appliances, including power savers, in addition to energy conservation [15]. Due to harmonics, the displacement PF is not equal to the TPF. Because household appliances are considered to have low-power consumer electronic loads, their effect on the PQ will be significant when too many of them are in use [10]. The effects of harmonics on the displacement PF and %THD are not additive, so it is not right to ignore the effects of harmonic distortion when metering energy for both consumers and utilities [13].
A typical home uses multiple appliances at different times and for different durations, thus forming different load patterns; their usage is uniform neither over a day nor over a season. As a household might have numerous load points, there are unknown loads that could be connected in open sockets, and several load patterns could possibly reach an unwieldy number (factorial N; N is the number of loads, and some of the loads are unknown), but in practice, they would usually follow a very small number of appliance usage patterns. It is not common for a modern household to use single loads at any point in time [5]. Therefore, it is clear that the focus of DSM should be on appliance usage patterns (a combination of loads), and the usage of individual loads becomes irrelevant. The recommendation to the consumer should be to switch from an appliance usage pattern with a low PQ to an appliance usage pattern with a better PQ, thereby ensuring clean power in the LVDS.

1.3. Feature Selection for NILM

The harmonic interactions among several nonlinear appliances change the PQ indexes significantly. For instance, the PF, distortion factor (DF), and current THD are directly impacted; these indexes influence the billing of the electrical energy depending on the appliance usage patterns. Therefore, from the perspective of PQ, a combination of appliances that improve the PQ can determine the amount to be billed. Two different experiences were cited: One suggested the use of fundamental signals (displacement factor) to calculate the surplus of reactive power in electrical grids. Another suggested the use of the TPF. This fact shows that this work is important for the industry in the discussion of the problems caused by nonlinear appliances on electrical energy billing systems in order to rectify PQ issues [12].
R. Gopinath et al. researched the development of robust NILM techniques for the effective management of the energy of appliances in order to support reliable and sustainable DSM [16]. A significant improvement in the system efficiency can be realized if the improvement of the PF and the elimination of harmonics can be applied in the whole network [17].
Therefore, the authors proposed the use of aggregated measures of the PQ, such as the percentage of the total harmonic distortion (THD) and the TPF, in order to understand the appliance usage patterns and for consumers to adapt to PQ-sensitive behaviors. Devarapalli et al. discussed how the percentage THD can be applied in order to disaggregate load patterns and to suggest appropriate load patterns, thus reducing the harmonic pollution produced in the system [5].
This article presents the use of the TPF as a unique feature for identifying appliance usage patterns and for helping consumers by providing them with insights in order to switch from low-PF appliance usage patterns to high-PF appliance usage patterns and to become responsible consumers. The schematic of the non-intrusive identification of appliance usage patterns in smart homes with the TPF is depicted in Figure 1.

1.4. The Major Contributions and Organization of the Article

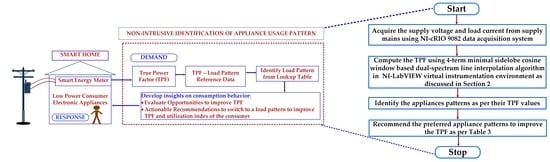
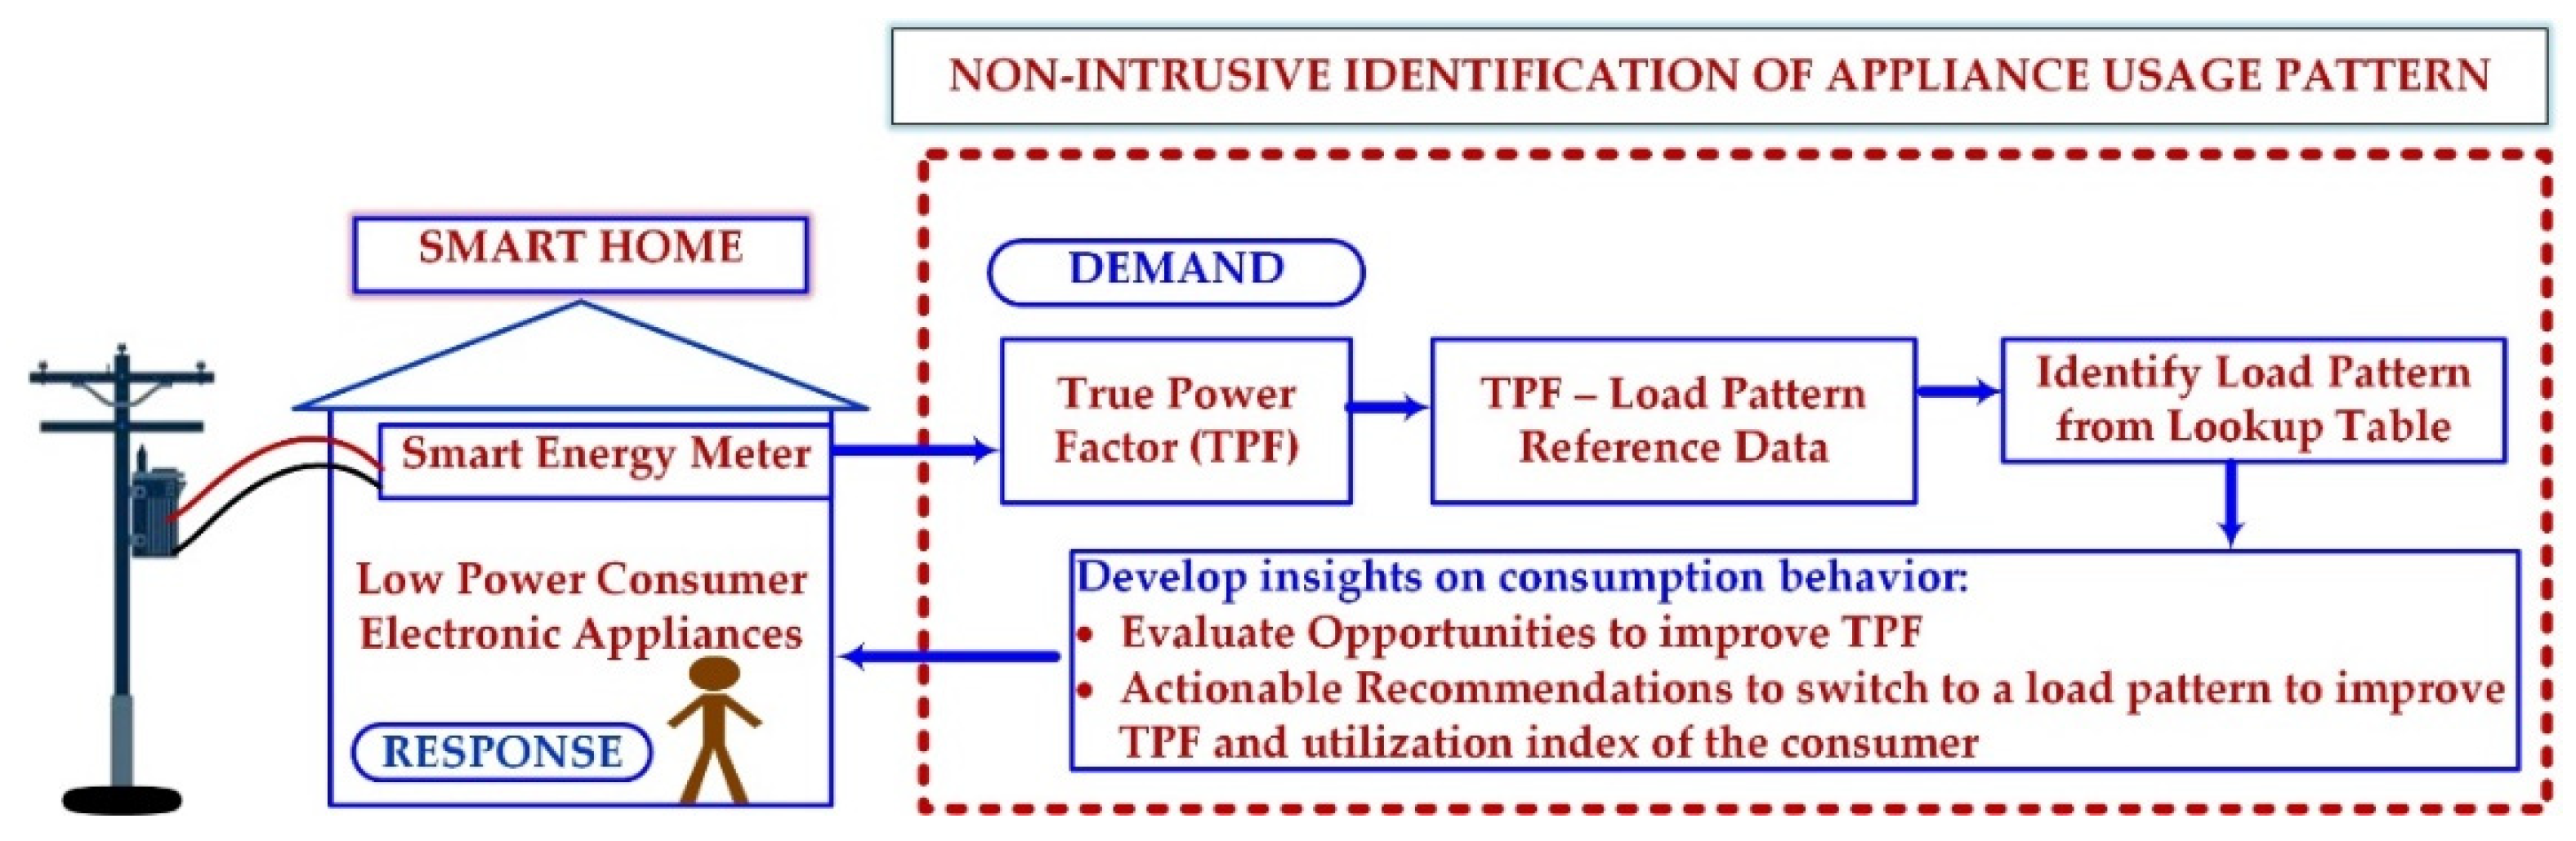
  • TPF measurement of real-world LPCEAs as per the IEEE 1459-2010 standard [18] by using the four-term minimal sidelobe cosine window (4MSCW)-based enhanced dual-spectrum line interpolated FFT (EDSLIFFT).
  • Development of a virtual instrumentation-based measurement system for TPF measurements.
  • Recommendation of appliance patterns for improvement of the TPF and DSM by using a lookup table in order to improve the utilization indexes of consumers.
This paper is organized into five sections; Section 2 describes the TPF measurement method. Section 3 elaborates on the real-time measurement of the TPF with the 4MCSW-based EDSLIFFT in the NI-cRIO (compact reconfigurable input–output)-based virtual instrumentation environment for various combinations of LPCEAs. Section 4 deliberates on the results and demonstrates that the TPF is a reliable single feature for identifying appliances’ consumption patterns. Section 5 discusses the insights of the results, and Section 6 concludes with a summary of the proposed research work.

2. Measurement of the TPF Using the Four-Term MSCW-Based EDSLIFFT

In this section, the measurement of the TPF by using the 4-term MSCW-based EDSLIFFT. The 4-term MSCW-based EDSLIFFT was proposed in [19] for the accurate estimation of the harmonics of LPCEAs. In this article, it is further extended for the computation of the TPF as per the IEEE 1459-2010 standard [18].

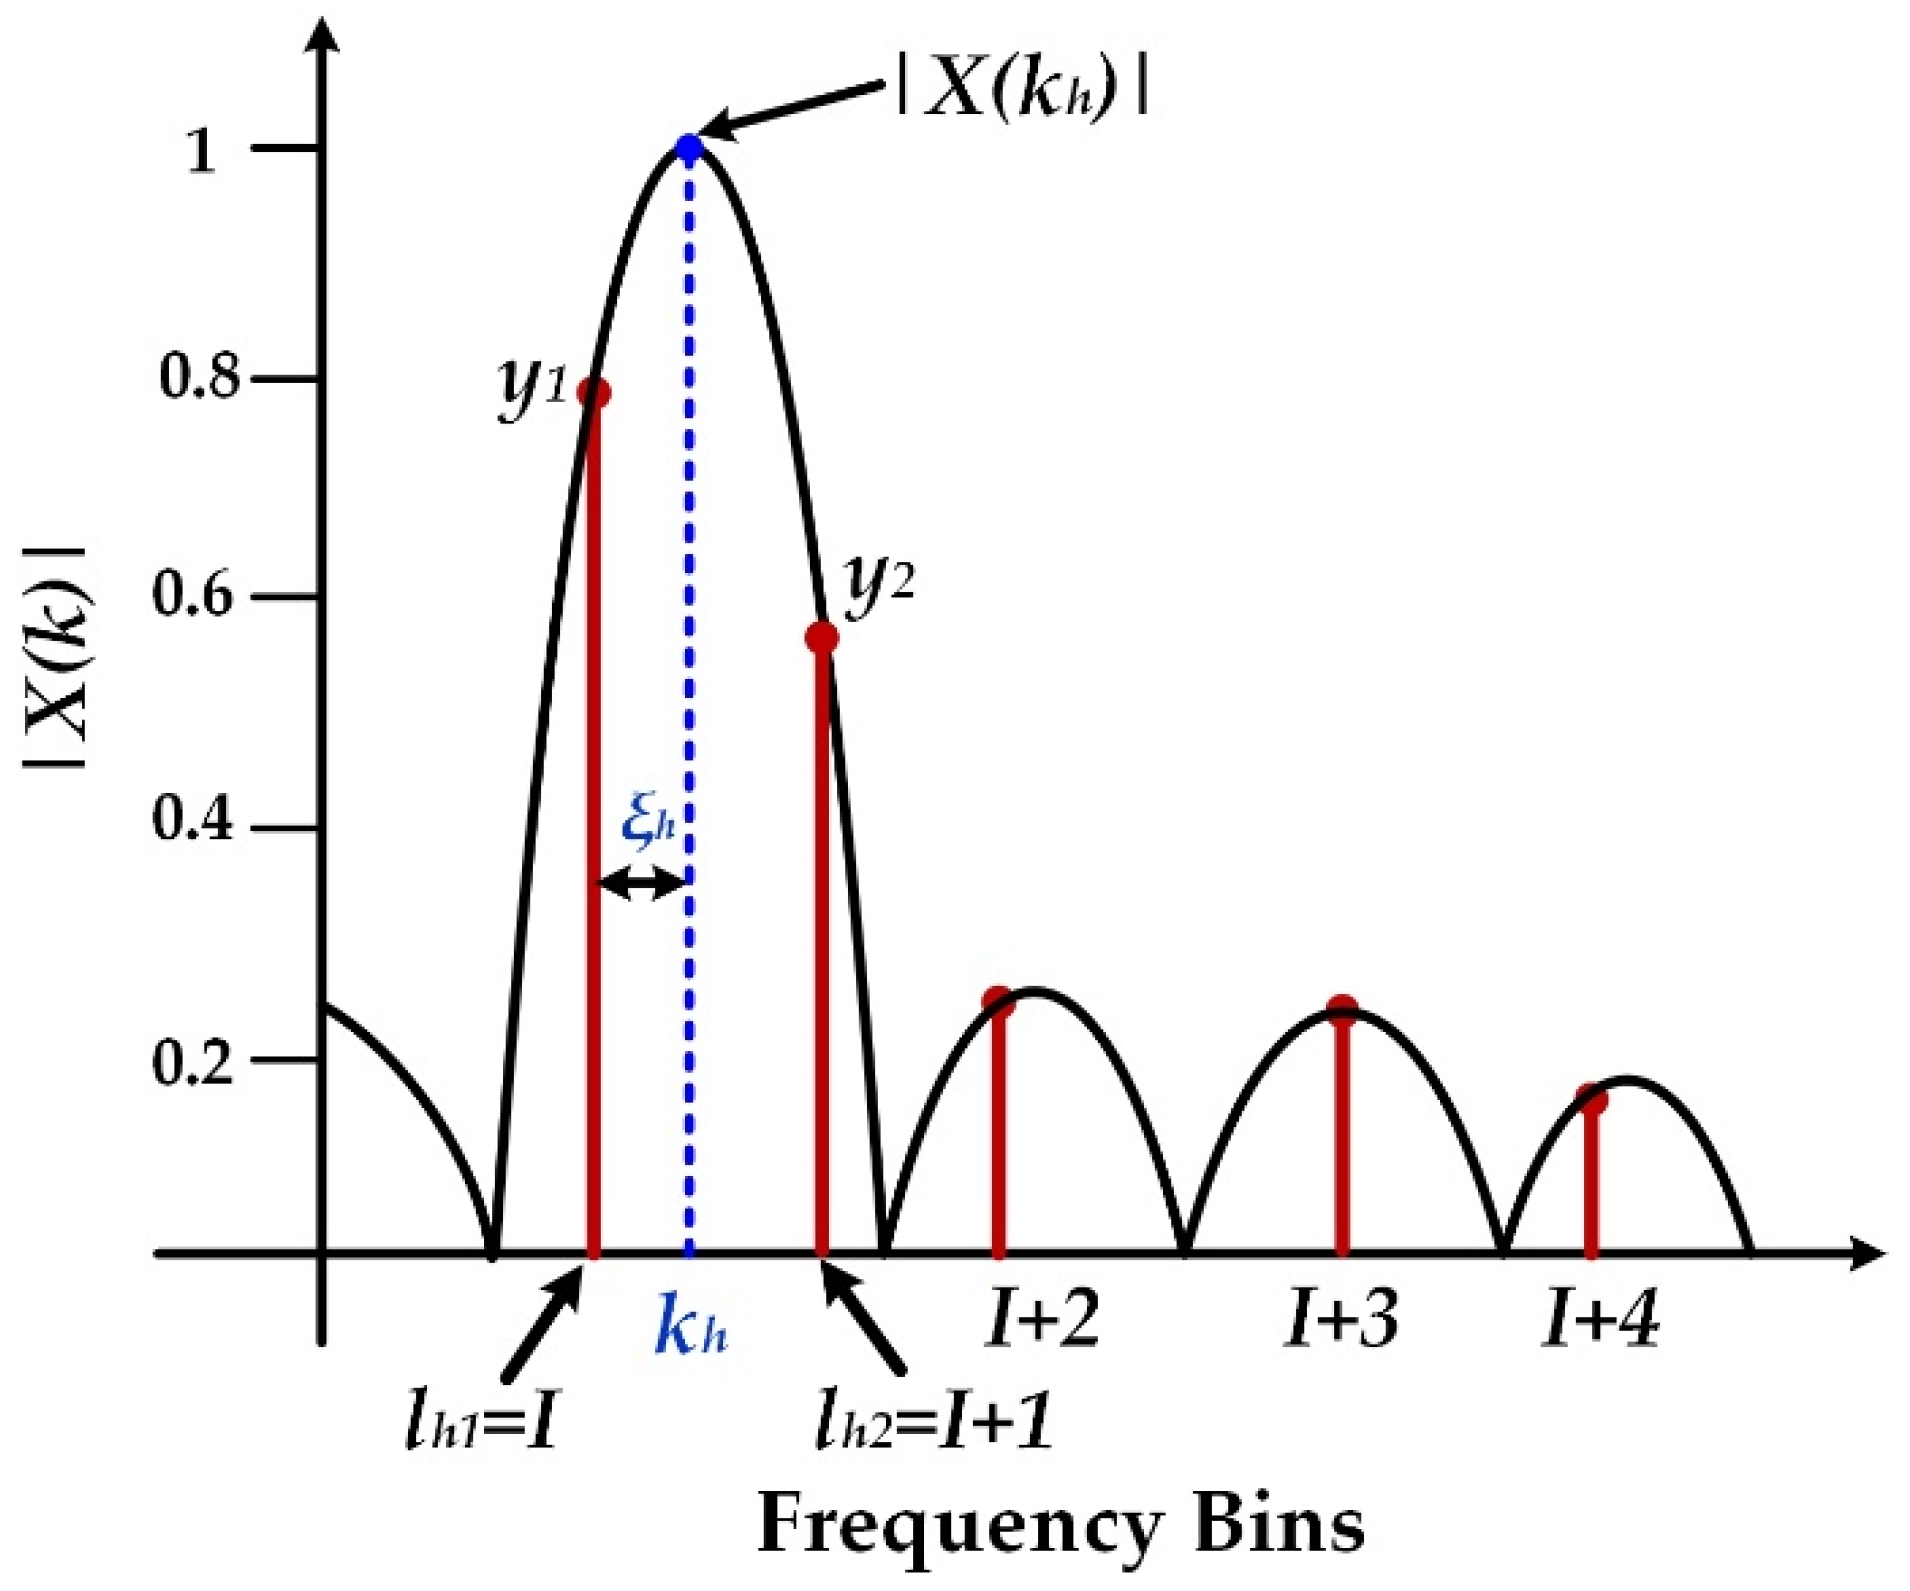
2.1. Overview of the Four-Term MSCW

Given the better main lobe, sidelobe, and sidelobe roll-off rate of the 4MSCW and the accuracy of the EDSLIFFT algorithm with the RT current harmonic signal analysis [19], they are further extended to measure the TPF in real time. Initially, the 4-term MSCW-based EDSLIFFT was used to measure the spectral amplitude and phase of an LPCEA’s harmonic current signal. A brief overview of the 4MSCW is given in the following.
The discrete-time 4-term MSCW is expressed as:
w ( n ) = m = 0 M 1 ( 1 ) h a h c o s ( 2 π m n N )   f o r   n = 0 ,   1 ,   ,   N 1
where n denotes the sample index, N denotes the total number of samples, m represents the window item index, M is the maximum window item number, and ah denotes the window coefficients.
The spectral window corresponding to the 4MSCW is written as:
W ( n ) = m = 0 M 1 a h 2 [ e j π ( n m ) ( N 1 ) N sin ( n m ) π sin ( ( n m ) π N ) + e j π ( n + m ) ( N 1 ) N sin ( n + m ) π sin ( ( n + m ) π N ) ]                 f o r   n = 0 ,   1 ,   ,   N 1

2.2. Processing with the 4MSCW-Based EDSLIFFT Algorithm

Generally, in digital signal processing, the harmonic signal is represented as [20]:
x ( n T s ) = x ( t ) = h = 1 h m a x A h sin ( 2 π f h n T s + φ h )   where   n = 0 ,   1 ,   ,   N     1
where the signal amplitude is denoted as Ah, and the signal frequency and phase are represented by fh and φh. The harmonic signal sampling time is denoted as Ts. The harmonic order is denoted as h, which starts from 1 and reaches the maximum harmonic order of hmax. The traditional FFT has the issue of spectral leakage due to non-synchronous sampling because of the unstable fundamental frequency. To mitigate the spectral leakage effect, the signal is weighted by window functions.
The mathematical representation of the windowed sample signal under non-synchronous sampling is given as:
X ( k ) = h = 1 h m a x A h 2 j [ e j φ h W ( k k h ) e j φ h W ( k + k h ) ]
where k = 0, 1, …, (N − 1), W indicates the 4-term MSCW function, and kh denotes the division factor of the signal frequency and the frequency resolution, which is expressed as:
k h = f h N f s = l h + ξ h
where fs is the sampling frequency of the harmonic signal, lh is an integer value, and ξh (0 ≤ ξh ≤ 1) is the fractional part caused by the non-synchronous sampling. The spectral line corresponding to the hth harmonic lies between the two highest spectral lines—explicitly, either the length and the (lh + 1)th or the lhth and the (lh – 1)th. The value of lh is determined by the peak location index search algorithm, and the fractional part ξ h is determined by using the EDSLIFFT algorithm, as shown in [19]. The computation process of the EDSLIFFT algorithm using 4MSCW is illustrated in Figure 2.
The frequency spectrum expression used in the EDSLIFFT algorithm is given as follows:
X ( ξ h ) = A h 2 j [ e j φ h W ( ξ h k h ) ]   for   ξ h = 0 ,   1 ,   ,   N 1
The two spectral lines represent the hth harmonic amplitude, and they are represented by lh1 and lh2 (where lh1 = I, lh2 = I + 1, lh1 < kh < lh2). The peak locations of the harmonic amplitudes are obtained by using the peak location index search method described in [19].
Consider y1 = |X(I)| and y2 = |X(I + 1)|; then, y1 and y2 are given as follows:
y 1 = | X ( I ) | = | A h | · | W ( 2 π ( I k h ) / N |
y 2 = | X ( I + 1 ) | = | A h | · | W ( 2 π ( ( I + 1 ) k h ) / N |
The spectral amplitudes are determined with the least-square curve-fitting technique. The symmetrical coefficient α is considered in terms of lh and kh as follows:
α = k h l h 1 0.5   f o r 0.5 α 0.5
The even spectral lines in EDSLIFFT, y1 and y2, are represented as:
y 1 = | X ( I ) | = | A h | · | W ( 2 π ( α + 0.5 ) / N |
y 2 = | X ( I + 1 ) | = | A h | · | W ( 2 π ( α 0.5 ) / N |
A symmetrical coefficient β in terms of α is considered in order to calculate the harmonic parameters; the expression of β is as follows:
β = g ( α ) = ( y 2 y 1 ) ( y 2 + y 1 )
From Equations (10) and (11), β can be represented as:
β = g ( α ) = | W ( 2 π ( α 0.5 ) / N ) | | W ( 2 π ( α + 0.5 ) / N ) | | W ( 2 π ( α + 0.5 ) / N ) | + | W ( 2 π ( α 0.5 ) / N ) |
The value of α is determined with two maximum spectral lines and the fitting polynomial g 1 ( α ) . Thereby, the amplitude, frequency, and phase values of the given signal are obtained based upon the following interpolated formulas:
k h = α + I + 0.5
A h = 2 y 1 | W ( 2 π ( I k h ) ) / N |
f h = k h f s N
φ h = arg ( X ( I ) ) arg [ W ( 2 π ( I k h   ) N ) ] + π 2
An LPCEA’s input voltage, appliance current fundamental, and harmonic amplitudes are computed by using Equations (15)–(17). Under nonlinear loading conditions, it is necessary to measure the fundamental and harmonic content accurately; the conventional FFT has issues of spectral leakage and experiences the picket fence effect, and hence, the 4-term MSCW-based EDSLIFFT is adopted in this article. The measurement of the TPF by using the fundamental and harmonic amplitudes is discussed in Section 2.3.

2.3. TPF Measurement as per the IEEE 1459-2010 Standard

After measuring the fundamental and harmonic amplitudes of the voltage and current by using Equation (15) from the 4-term MSCW-based EDSLIFFT, the root mean square (RMS) values of the voltage and current are determined as follows:
V R M S = V 1 R M S 2 + V 2 R M S 2 + V 3 R M S 2 + V h m a x R M S 2
I R M S = I 1 R M S 2 + I 2 R M S 2 + I 3 R M S 2 + I h m a x R M S 2
The fundamental to higher-order harmonic voltages are represented by V1RMS, V2RMS, V3RMS, …, VhmaxRMS in Equation (18), and the fundamental and harmonic currents are denoted as I1RMS, I2RMS, I3RMS, …, IhmaxRMS in Equation (19). As per the IEEE 1459-2010 standard [18], the RMS of the voltage and current can be decomposed into fundamental and harmonic components as follows:
  V R M S 2 = V 1 R M S 2 + h > 1 h m a x V h R M S 2 = V 1 R M S 2 + V H R M S 2
I R M S 2 = I 1 R M S 2 + h > 1 h m a x I h R M S 2 = I 1 R M S 2 + I H R M S 2
One of the most significant parameters for efficient power consumption with a good PQ is the PF. If the PF at the supply mains is at unity or close to unity, then it is designated as having a high PQ. On the contrary, a low PF means that the system is operating with a low efficiency and poor PQ. Under nonlinear appliance conditions, the PF is represented by the TPF, which is computed from the distortion factor and displacement PF. The distortion factor is determined from the current THD (THDI).
The voltage and current THDs are determined with the following equations:
T H D V =   h > 1 h m a x V h R M S 2 V 1 R M S
T H D I =   h > 1 h m a x I h R M S 2 I 1 R M S
The voltage THDV is negligible compared to the current THDI; hence, the current THD is considered in the distortion factor computation, as given below:
D F =   1 1 + T H D I 2 = I 1 R M S I R M S
The displacement factor is determined as follows:
D P F = P S
where P represents the active power consumed by the LPCEAs and S denotes the total apparent power. The computation of the active, reactive, and apparent powers is discussed below.
The active power consumption of the LPCEAs given as:
P = V 1 R M S I 1 R M S cos ( θ 1 δ 1 ) + h > 1 h m a x V h R M S I h R M S cos ( θ h δ h )
The reactive power consumption of the LPCEAs is represented as:
Q = V 1 R M S I 1 R M S sin ( θ 1 δ 1 ) + h > 1 h m a x V h R M S I h R M S sin ( θ h δ h )
Based on the definitions of the voltage and current RMS values as functions of their fundamental and harmonic components, the total apparent power is expressed as:
S 2 = ( V R M S I R M S ) 2 = ( V 1 R M S 2 + V H R M S 2 ) ( I 1 R M S 2 + I H R M S 2 )
Using Equation (8), the fundamental and non-fundamental components of the apparent power are written as follows:
S 2 = ( V 1 R M S 2 I 1 R M S 2 ) + ( V 1 R M S 2 I H R M S 2 ) + ( V H R M S 2 I 1 R M S 2 ) + ( V H R M S 2 I H R M S 2 )
S 2 = ( V 1 R M S I 1 R M S ) 2 + ( V 1 R M S I H R M S ) 2 + ( V H R M S I 1 R M S ) 2 + ( V H R M S I H R M S ) 2
S 2 = S 1 2 + S N 2
S = S 1 2 + S N 2
In Equation (31), SN is the non-fundamental apparent power because of the occurrence of harmonic frequencies in the voltage or current waveforms. The fundamental apparent power S1 is represented by:
S 1 = V 1 R M S I 1 R M S
The non-fundamental apparent power has three distinct terms, as shown in Equation (34).
S N 2 = D 1 2 + D V 2 + S H 2
The term D1 denotes the current distortion power and comprises the fundamental voltage (V1RMS) and the harmonic current (IHRMS). It is determined as a function of the fundamental apparent power (S1) and the current total harmonic distortion (THDI):
D I = V 1 R M S I H R M S = S 1 ( T H D I )
Similarly, the voltage distortion power, DV, encompasses the harmonic voltage (VHRMS) and the fundamental current (I1RMS):
D V = V H R M S I 1 R M S = S 1 ( T H D V )
Eventually, the harmonic apparent power, SH, is determined from both the voltage and the current terms, and it contains the total harmonic distortion of the voltage and current, as given below:
S H = V H R M S I H R M S = S 1 ( T H D V )   ( T H D I )
By substituting the active power given in Equation (26) and the total apparent power represented in (33), the displacement power factor is computed by using Equation (26). Then, the TPF is computed using the following equation:
            T P F   = D F × D P F
Thus, the TPF is measured by using the 4-term MSCW-based EDLIFFT. The real-time (RT) validation of the proposed method of TPF measurement for identifying appliance usage patterns for DSM is presented in the next section.

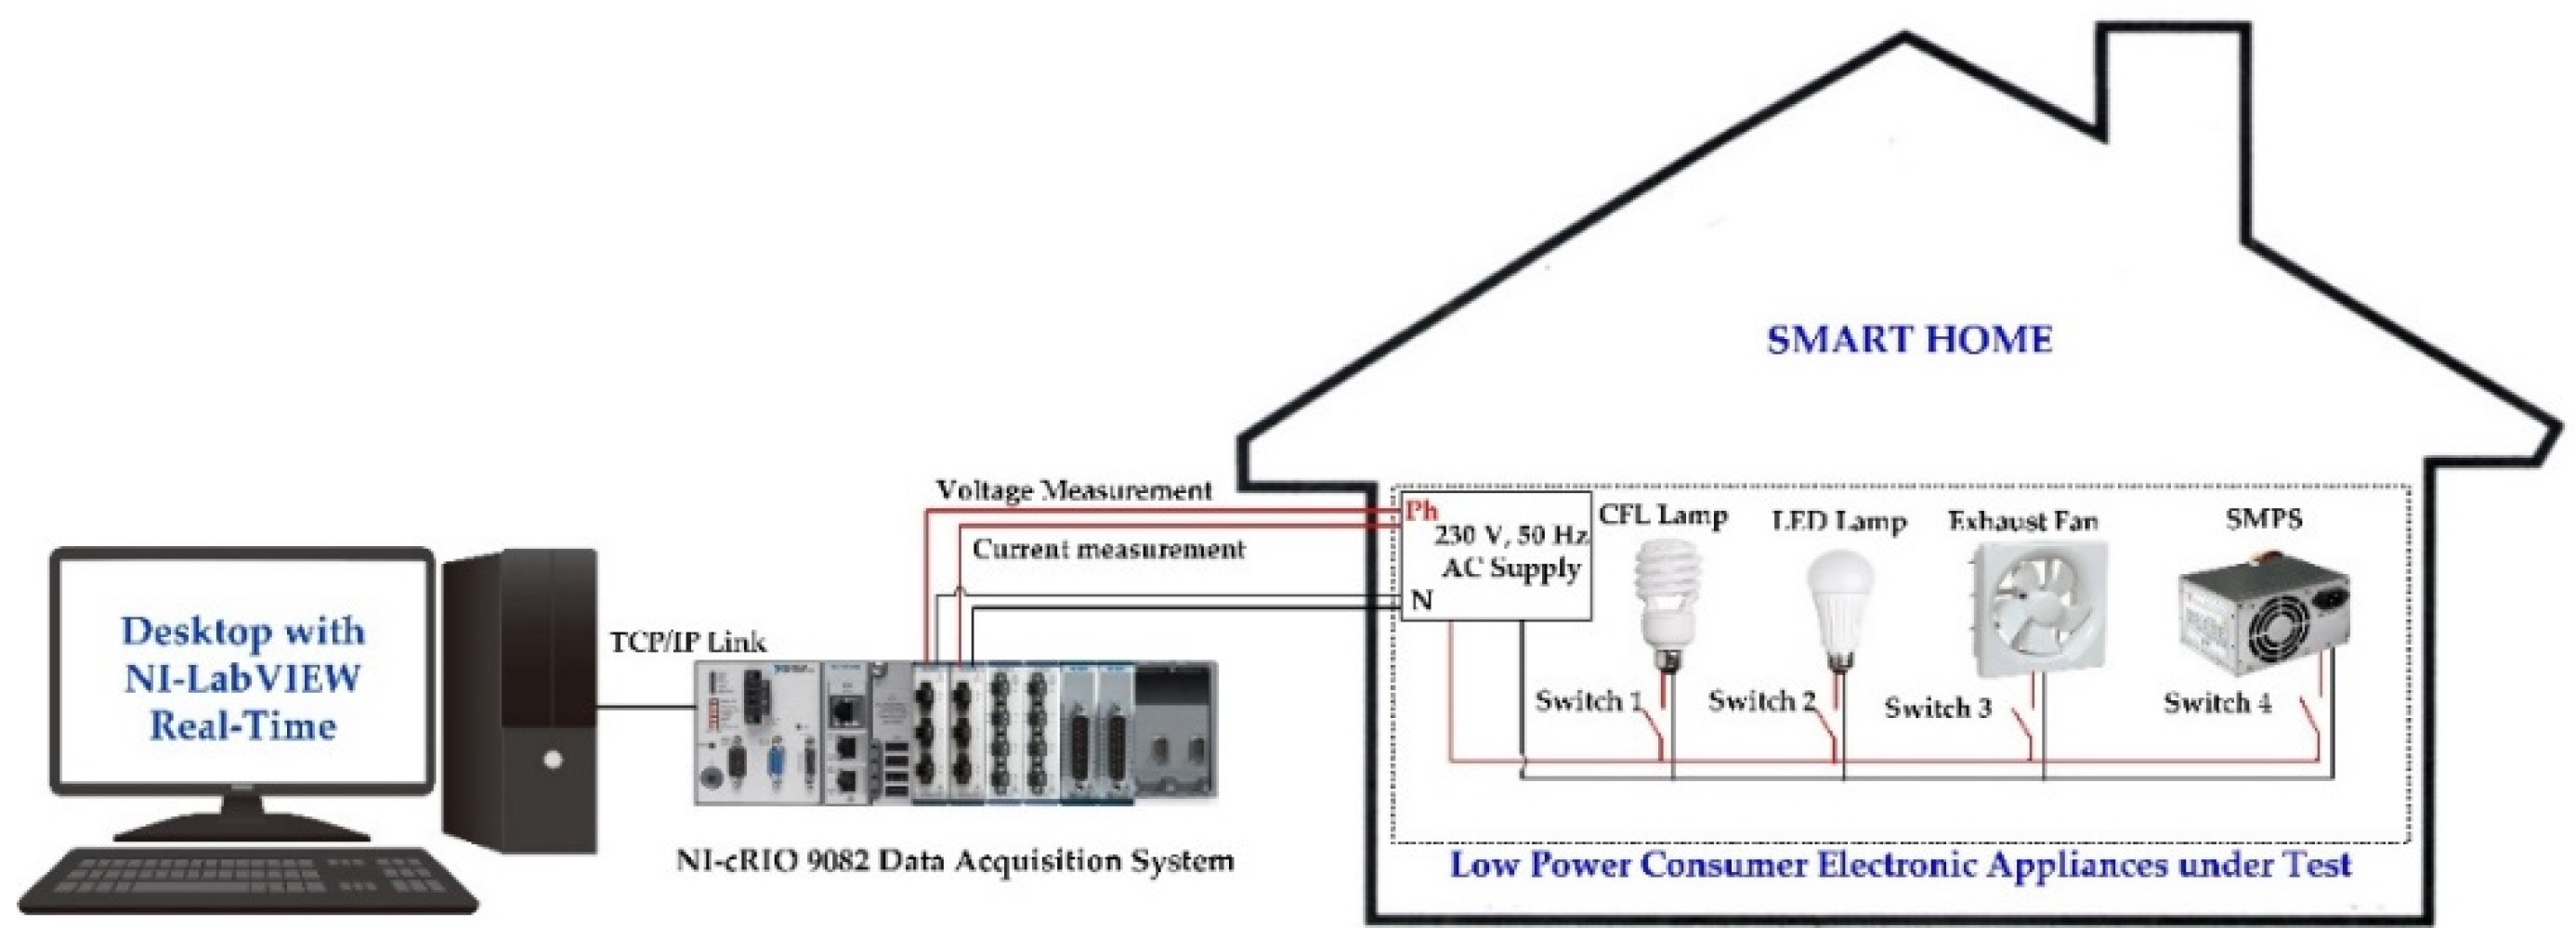
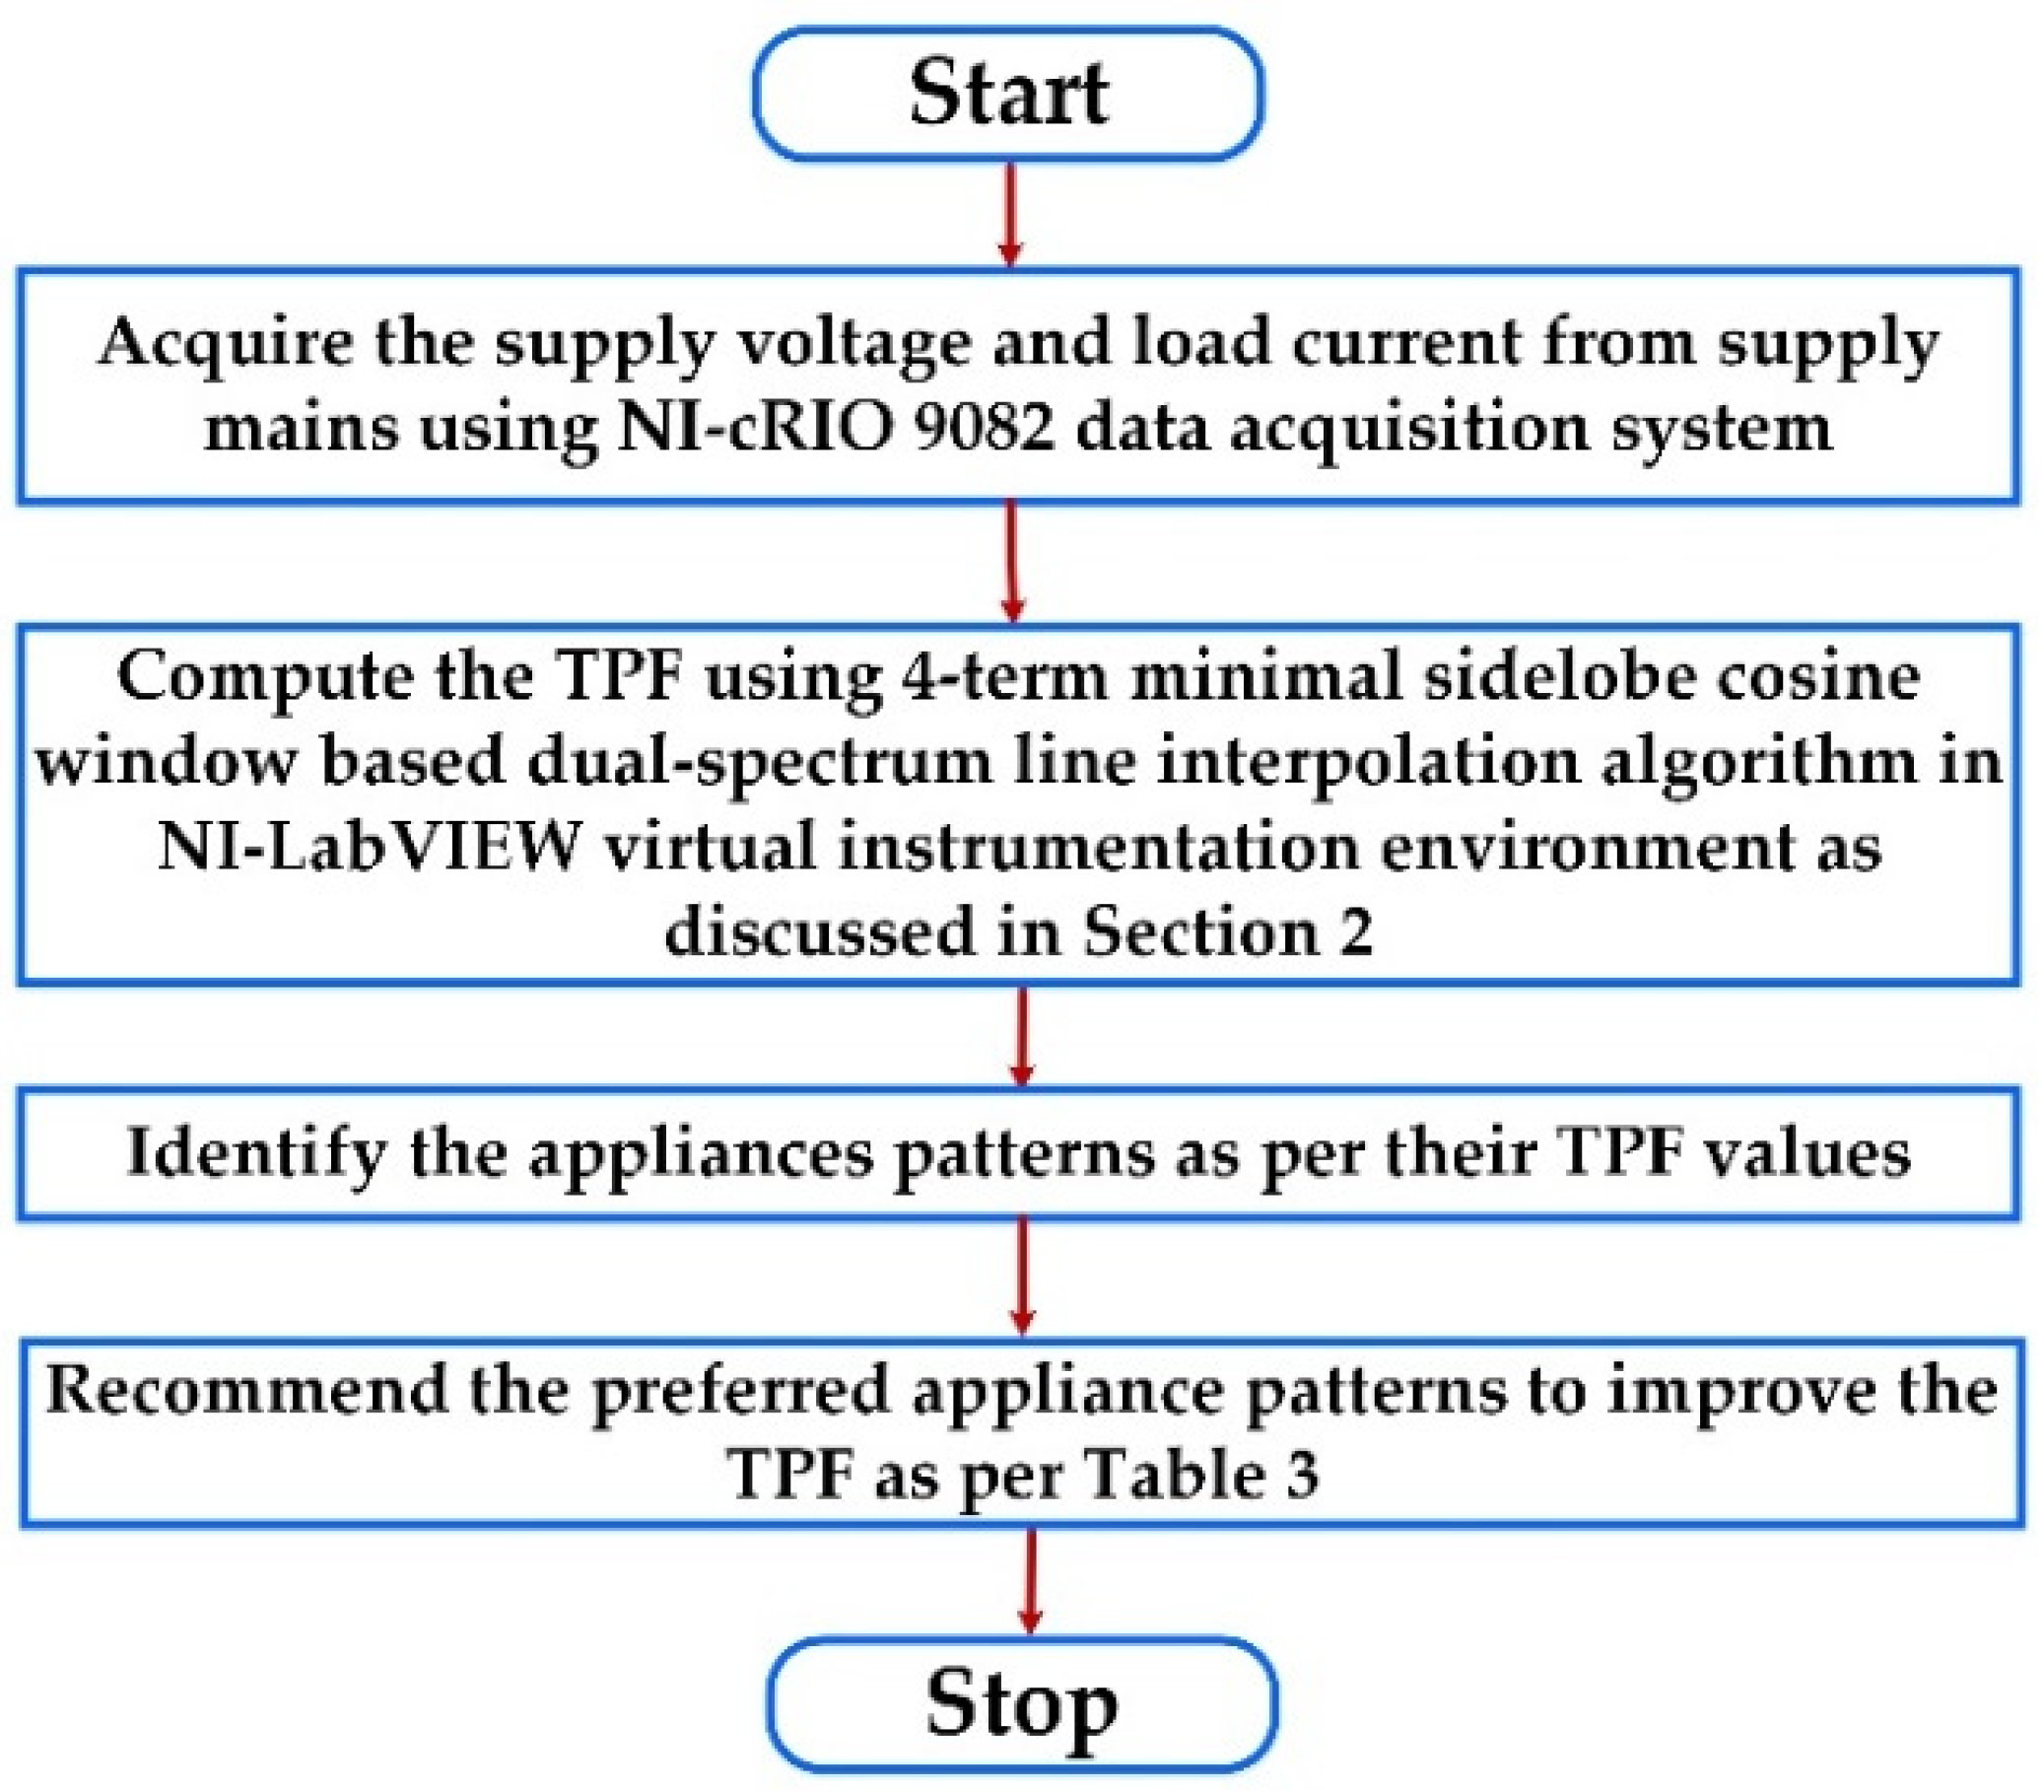
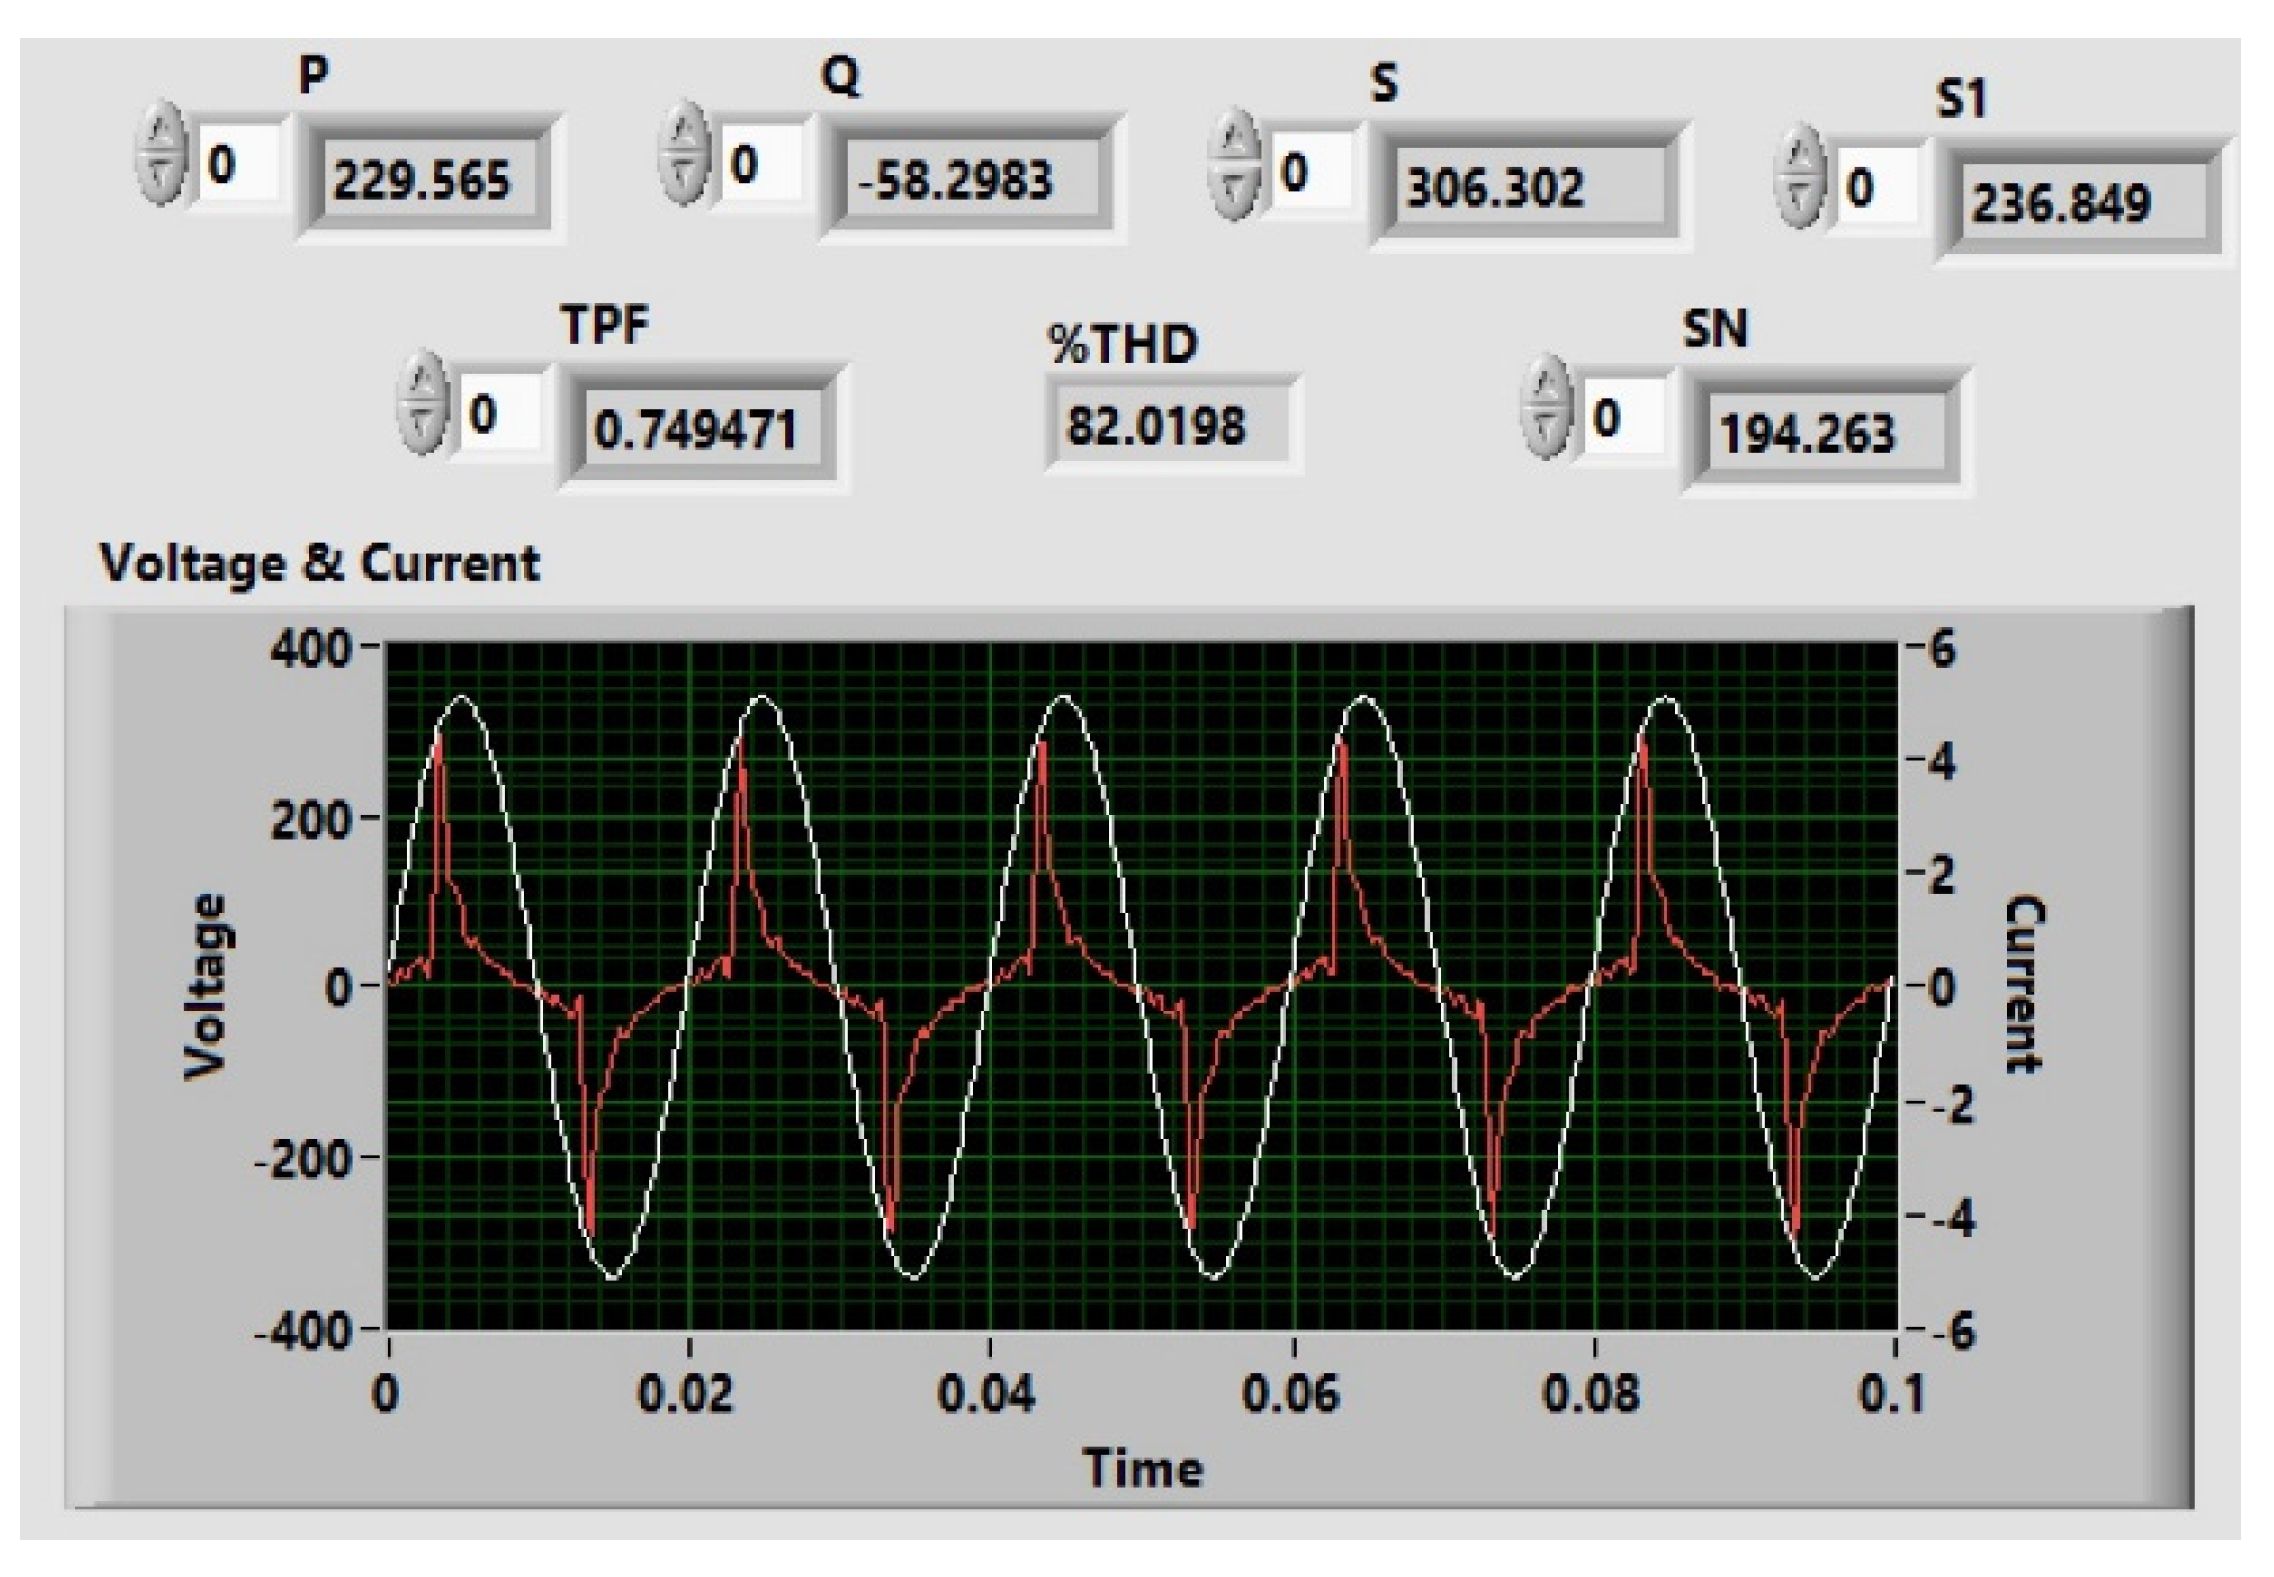
3. Real-Time (RT) Measurement of the TPF
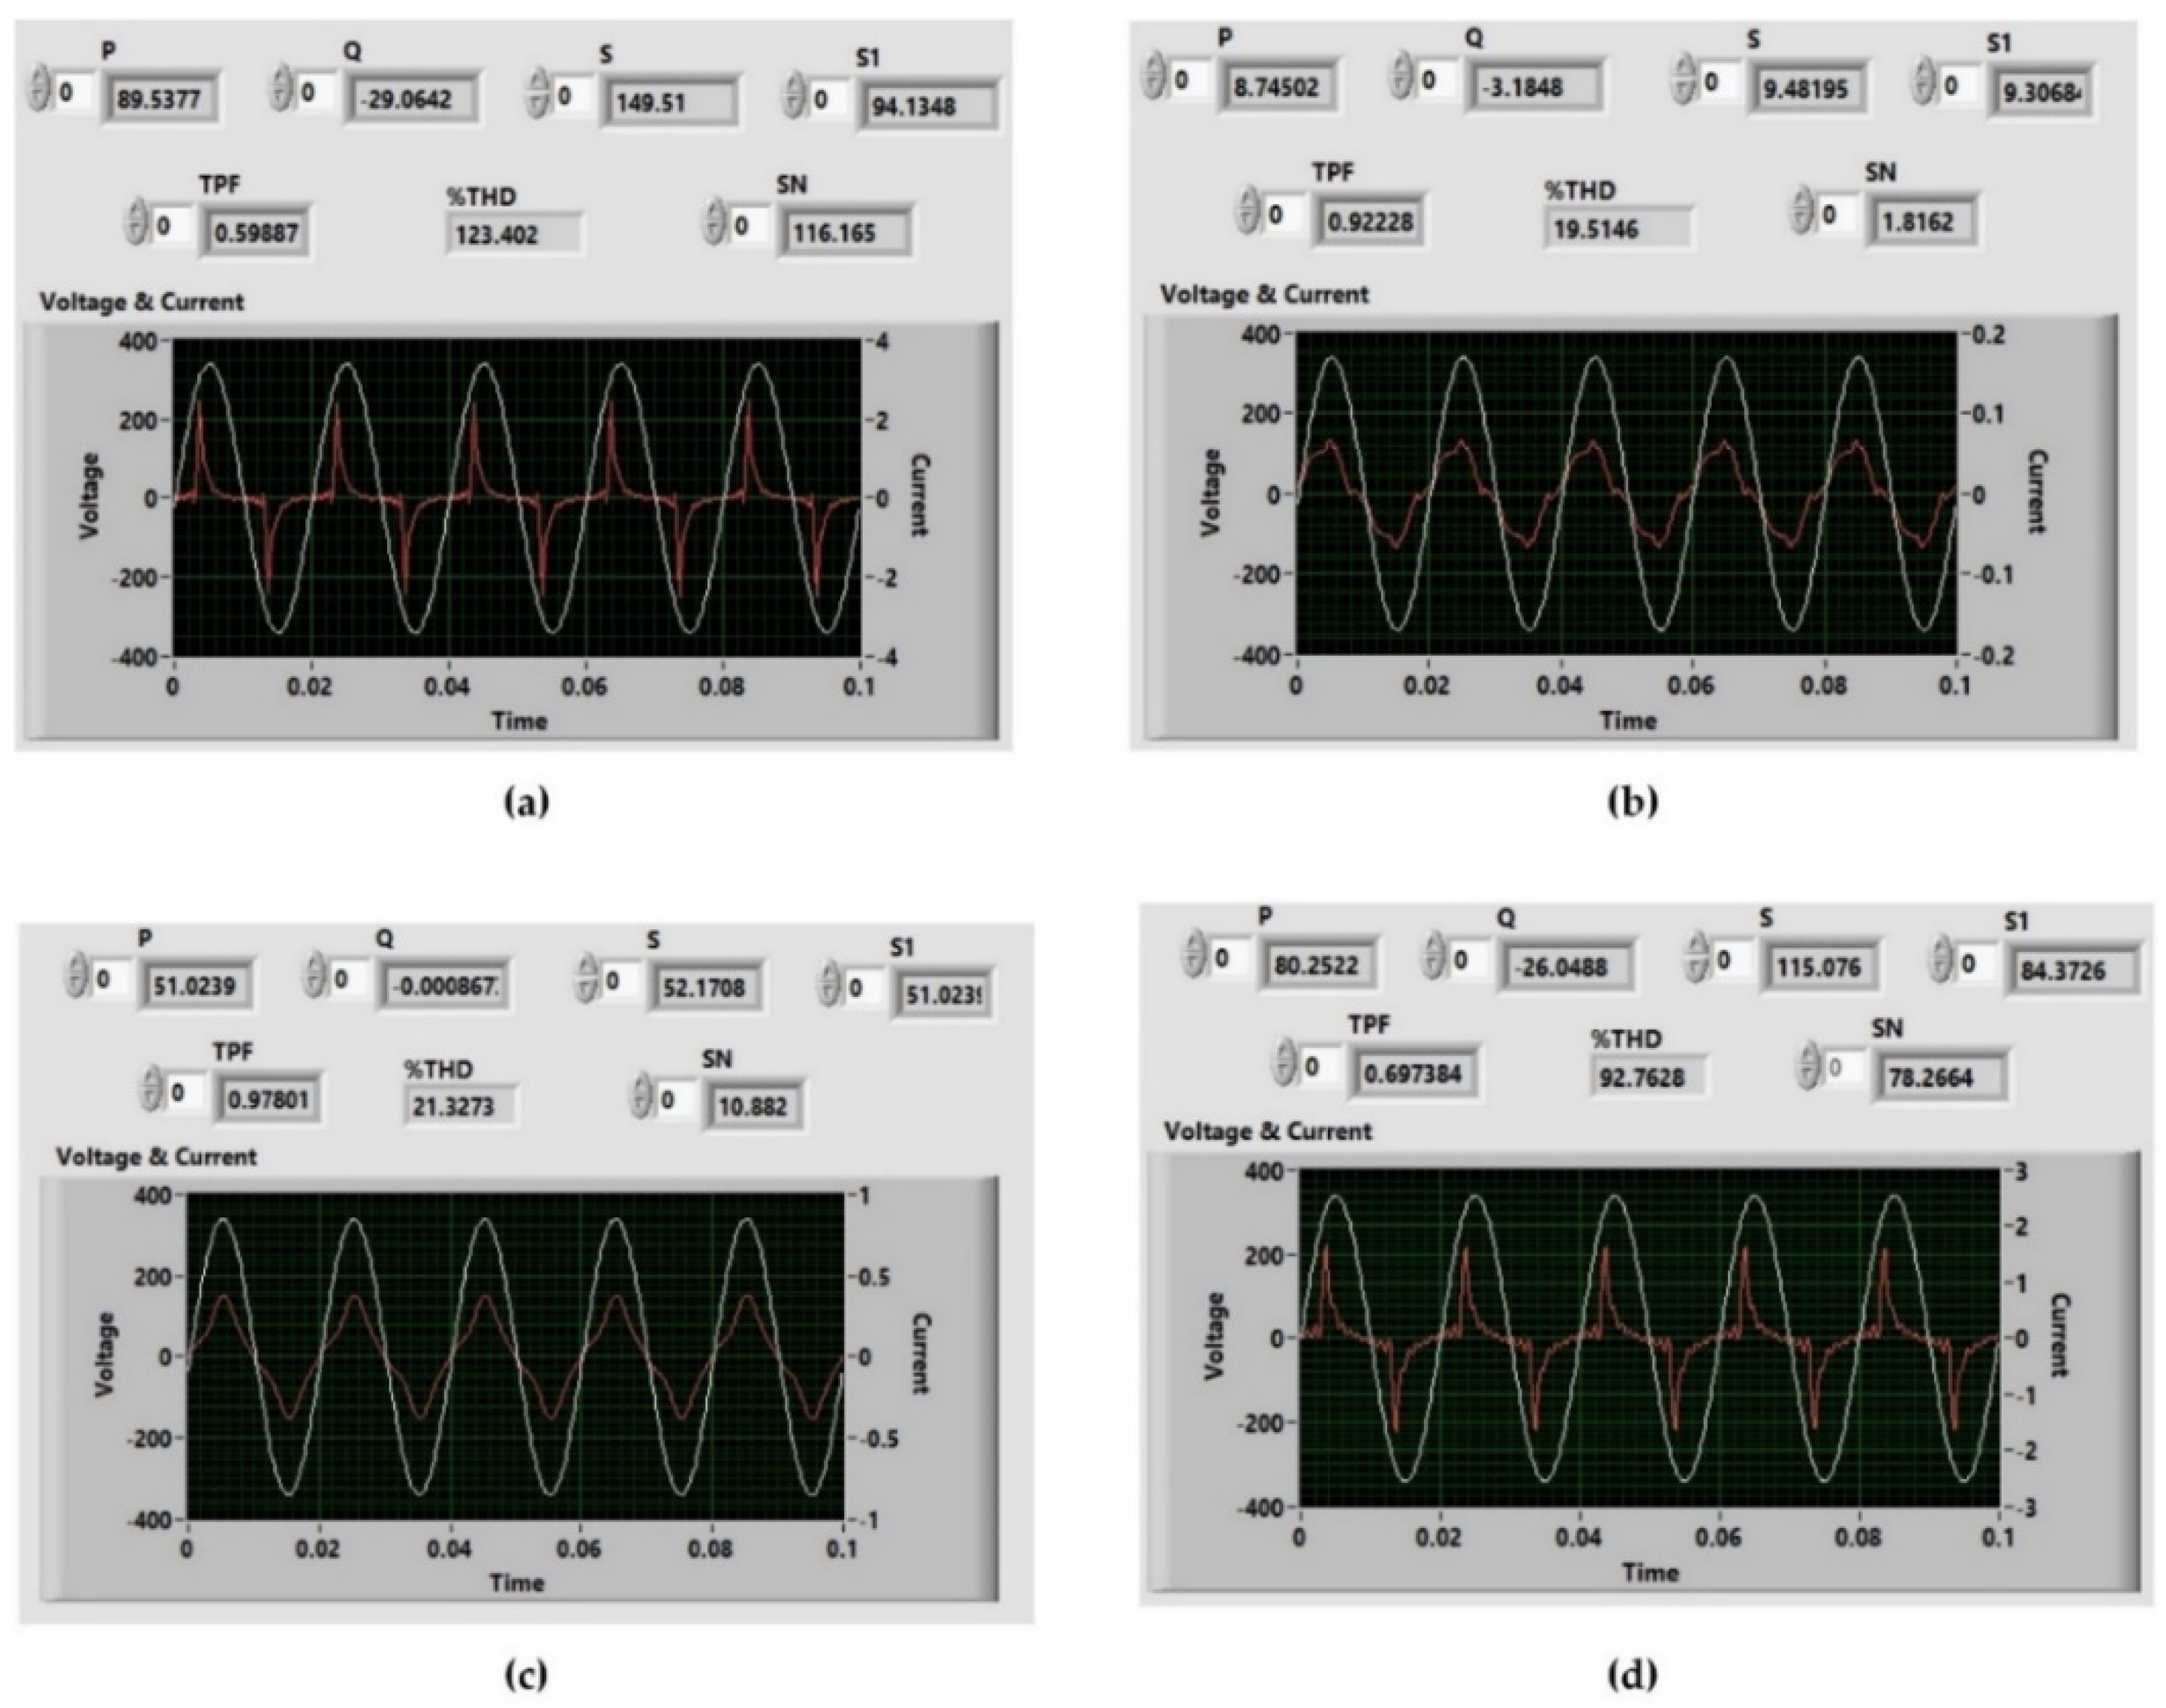
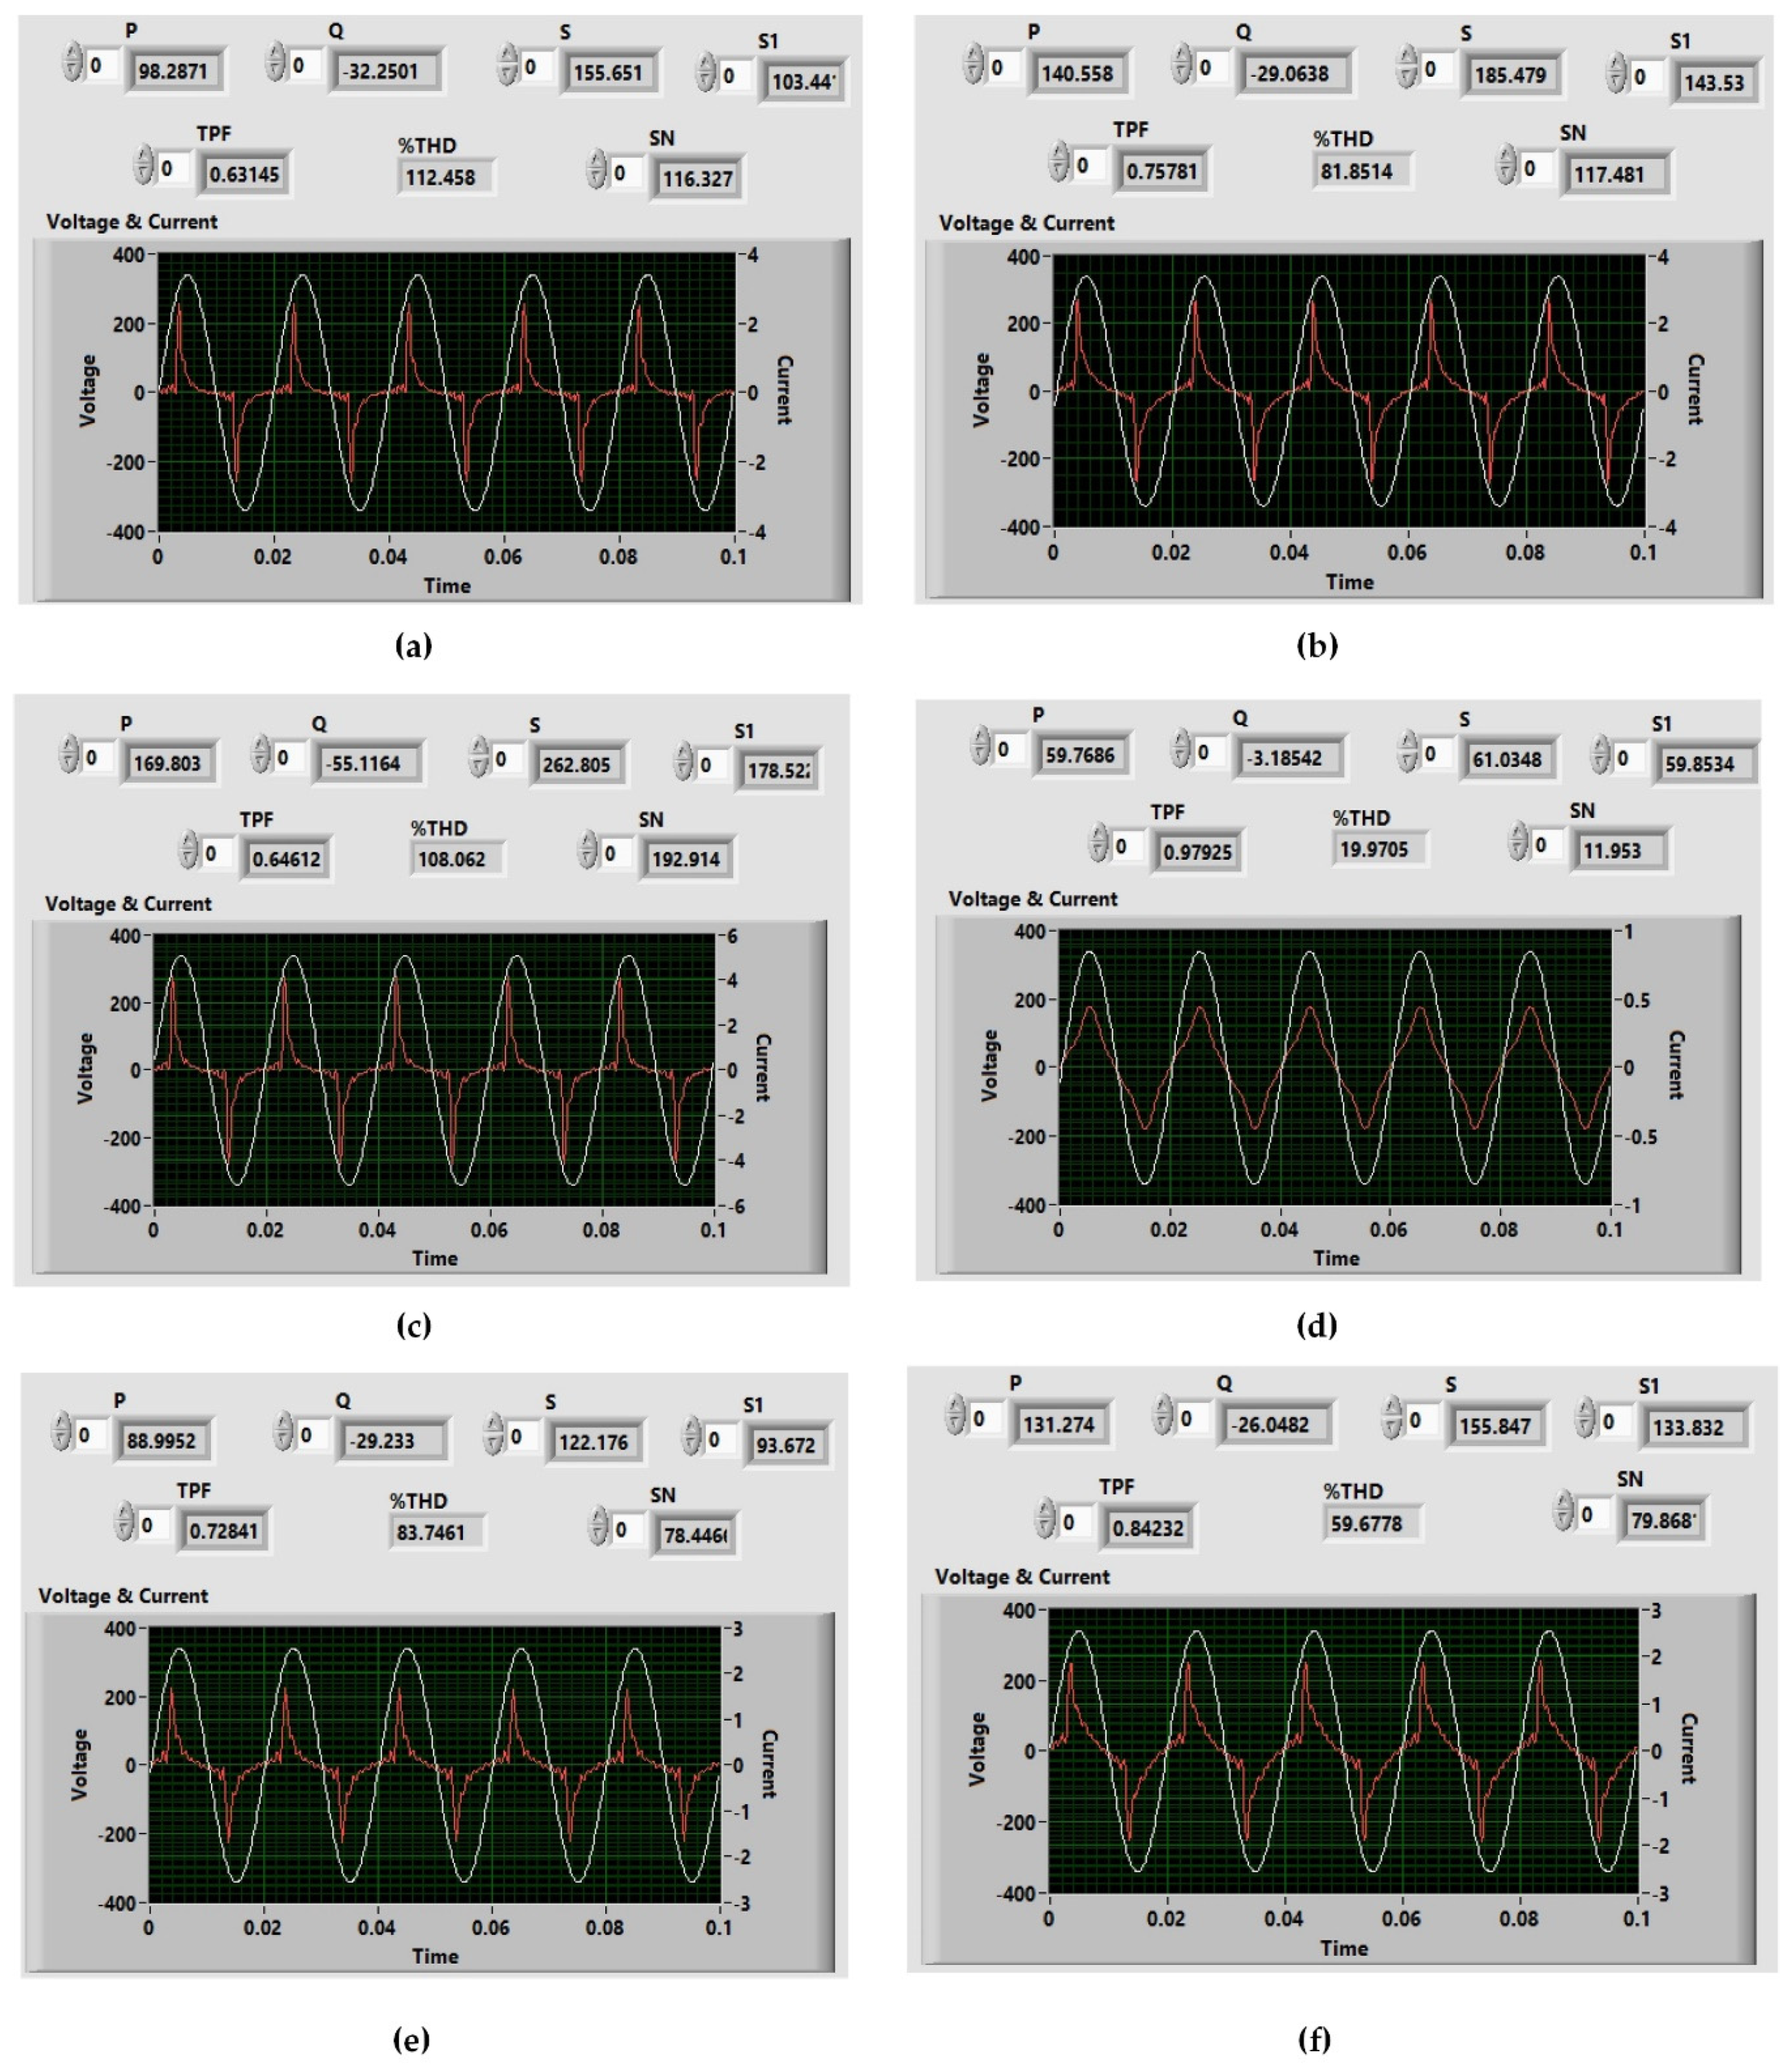
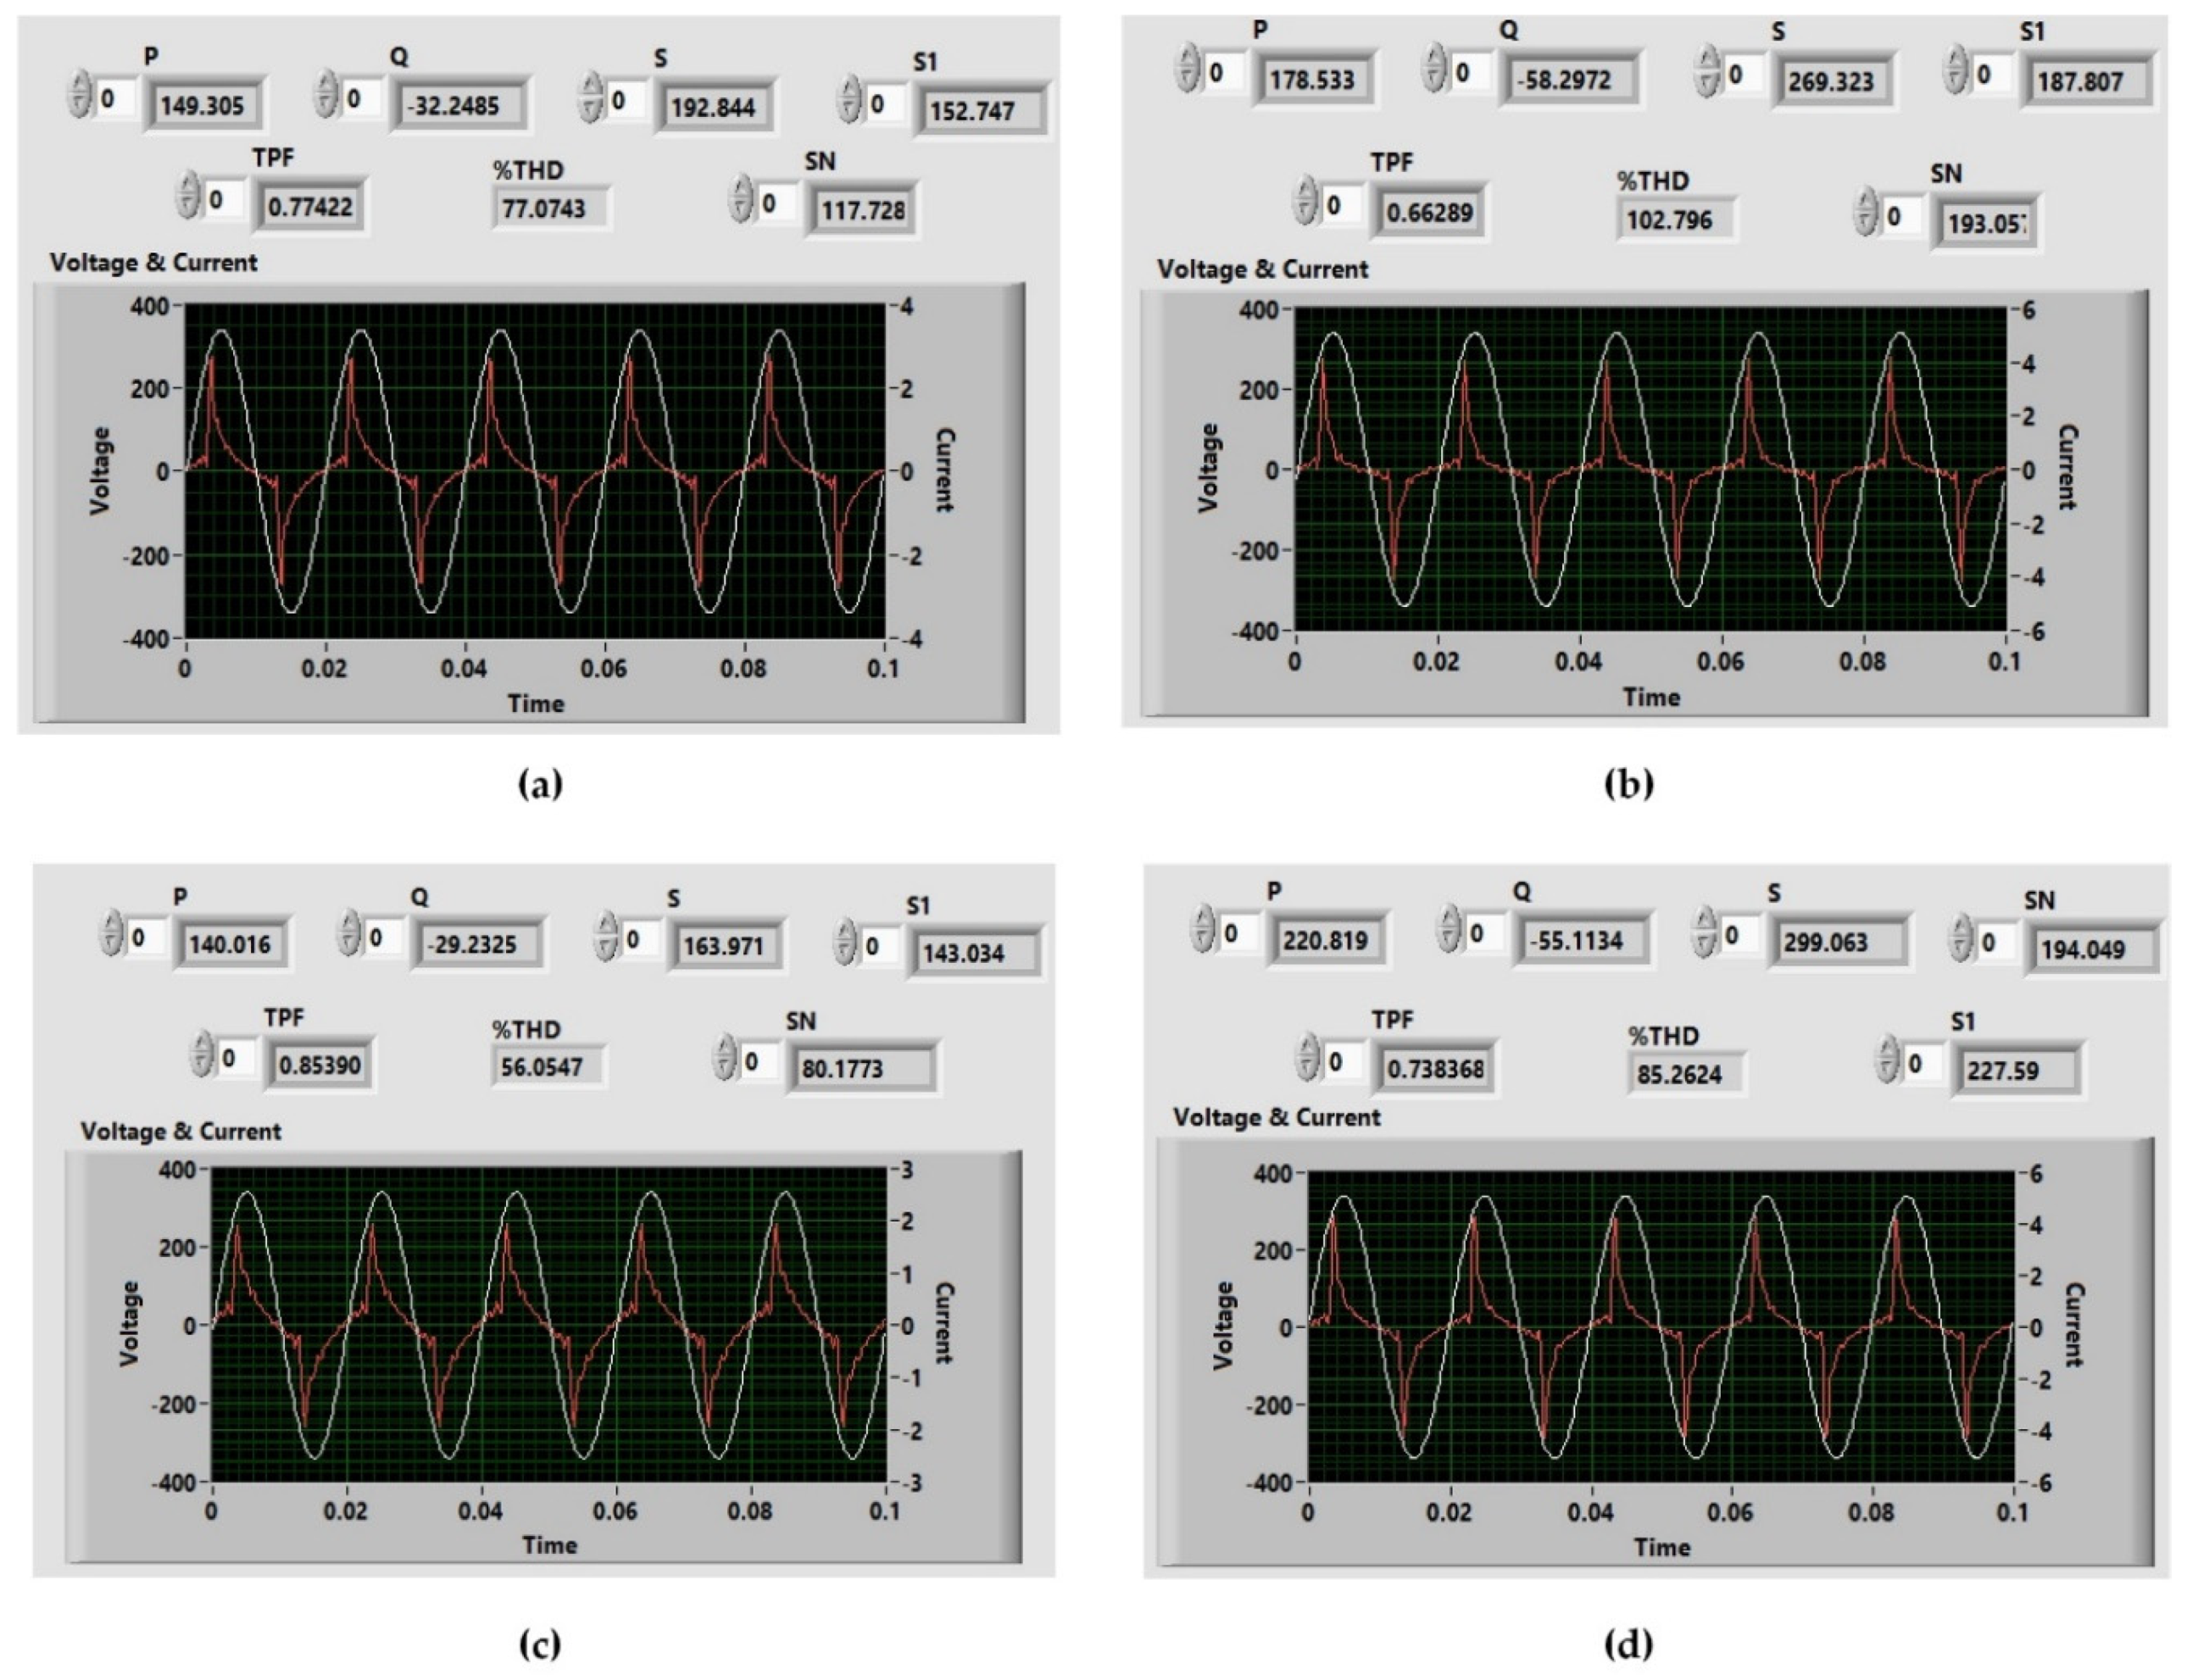
The real-time measurement of the TPF by using the 4-term MSCW-based EDSLIFFT for non-intrusive appliance usage pattern identification for DSM is described in this section. A compact reconfigurable input–output system (cRIO 9082)-based virtual instrumentation testbed from National Instruments (NI) was developed in order to deploy the proposed non-intrusive identification of appliance usage patterns. As per the authors’ observation, it is prospective hardware for RT measurement of the TPF as per the requirements of international standards, such as IEEE 1459 [18], 1159 [21], and IEC 61000-4-60 [22]. Table 1. Summarizes the standards compliance of the proposed RT-based measurement method.
The NI-cRIO 9082 was equipped with a field-programmable gate array (FPGA) architecture, which was detailed in [23]. The voltage and current signals were acquired by the NI-cRIO 9082 with the NI-9225 (voltage) [24] and NI-9227 (current) modules [25]. Then, they were processed with the 4-term MSCW-based EDSLIFFT, which was deployed in a LabVIEW-configured desktop computer system. The desktop computer was interfaced with the NI-cRIO 9082 through a TCP/IP link, as depicted in Figure 3.
CFLs, LEDs, exhaust fans, and SMPSs of personal computers are the LPCEAs that are most commonly used by consumers in developing countries; they were used here to showcase the severity of the problem for the readers, as every home that uses these appliances knowingly or unknowingly causes harmonic pollution.
The measurement hardware was coupled at the single-phase 230 V, 50 Hz utility supply mains for the TPF measurements. These TPF values were used for non-intrusive identification of appliance usage patterns. This non-intrusive appliance usage pattern identification approach took advantage of signal processing to reduce the hardware effort associated with systems intended for the identification of intrusive appliances with multiple dedicated sensors.
The TPFs of the different appliance usage patterns were measured by turning the connected appliances on or off, as shown in Figure 2. The detailed flowchart of the non-intrusive identification of appliance usage patterns with the TPF is shown in Figure 4.

4. RT Results

The supply voltage and appliance current waveforms acquired with the NI-cRIO 9082 for various real-world appliance combinations are illustrated in Figure 5, Figure 6, Figure 7 and Figure 8. The RT values of the average TPF, active, reactive, and apparent power, and percentage THD over 24 h that were obtained from NI-cRIO at 50 kS/s are tabulated in Table 2 and Table 3. The figures depict the phase differences between the input voltage and the harmonic current. The RT data values for P, Q, S, S1, SN, TPF, and %THD were observed and are tabulated in Table 4.
The combinations of two real-world appliances were observed by turning on the combinations of the different two appliances. The voltage and current waveforms of the combinations of the two real-world appliances acquired with the NI-cRIO 9082 are depicted in Figure 6.
The combinations of three real-world appliances were examined by turning on the combinations of three appliances; the corresponding voltage and current waveforms of the CFL, LED, exhaust fan, and SMPS of a PC are illustrated in Figure 7.
The voltage and current waveforms when all of the appliances were turned on are depicted in Figure 8.
Pertaining to the TPF values obtained from the operation of a single appliance to the operation of all four appliances, all were unique. Therefore, the TPF can be effectively used to identify appliance usage patterns. The TPFs measured with the four-term MSCW-based EDSLIFFT in the RT NI-cRIO 9082 system environment are depicted in Figure 4 and are tabulated in Table 2.
The performance of the experimentation demonstrated that the TPF could be uniquely identified for all combinations of the appliances. The standard deviation of the TPFs indicated that they were all unique and different. Hence, is the TPF can be used as a key feature of a lookup table in order to discern the appliances being operated.
The TPF variations of the appliance usage patterns according to demand are depicted in Figure 9a. The load patterns 1, 4, 5, 6, 7, 9, 12, 14, and 15 are in the region of poor TPF values. The TPFs of the appliance usage patterns after executing the recommendations given by the actionable insights in Table 3 are illustrated in Figure 9b, which demonstrates the improvement of the TPF. Further, it is necessary to adopt mitigation devices in order to improve the TPF as per the requirements of the IEEE 519-2014 standard [26].
The actionable insights for DR management are tabulated in Table 3, which establishes the opportunity to improve the TPFs in smart homes. Utilities can benefit from the reduced malfunctioning of the equipment in their distribution systems, and consumers can benefit from the enhanced lifetimes of their LPCEAs.

5. Discussion

This section discusses the analysis of the results and the scope of future research.

5.1. Analysis of the Results

  • The harmonics are non-additive, and the cumulative TPF takes both the inductive and capacitive factors of various appliance combinations into consideration.
  • Individual PFs are of no consequence, and the TPF is the value to consider in order to compare the impacts of appliance usage patterns with the impacts of individual appliances, as in our article. Therefore, the TPFs of appliance combinations are nonlinear, making the appliance patterns in use uniquely identifiable.
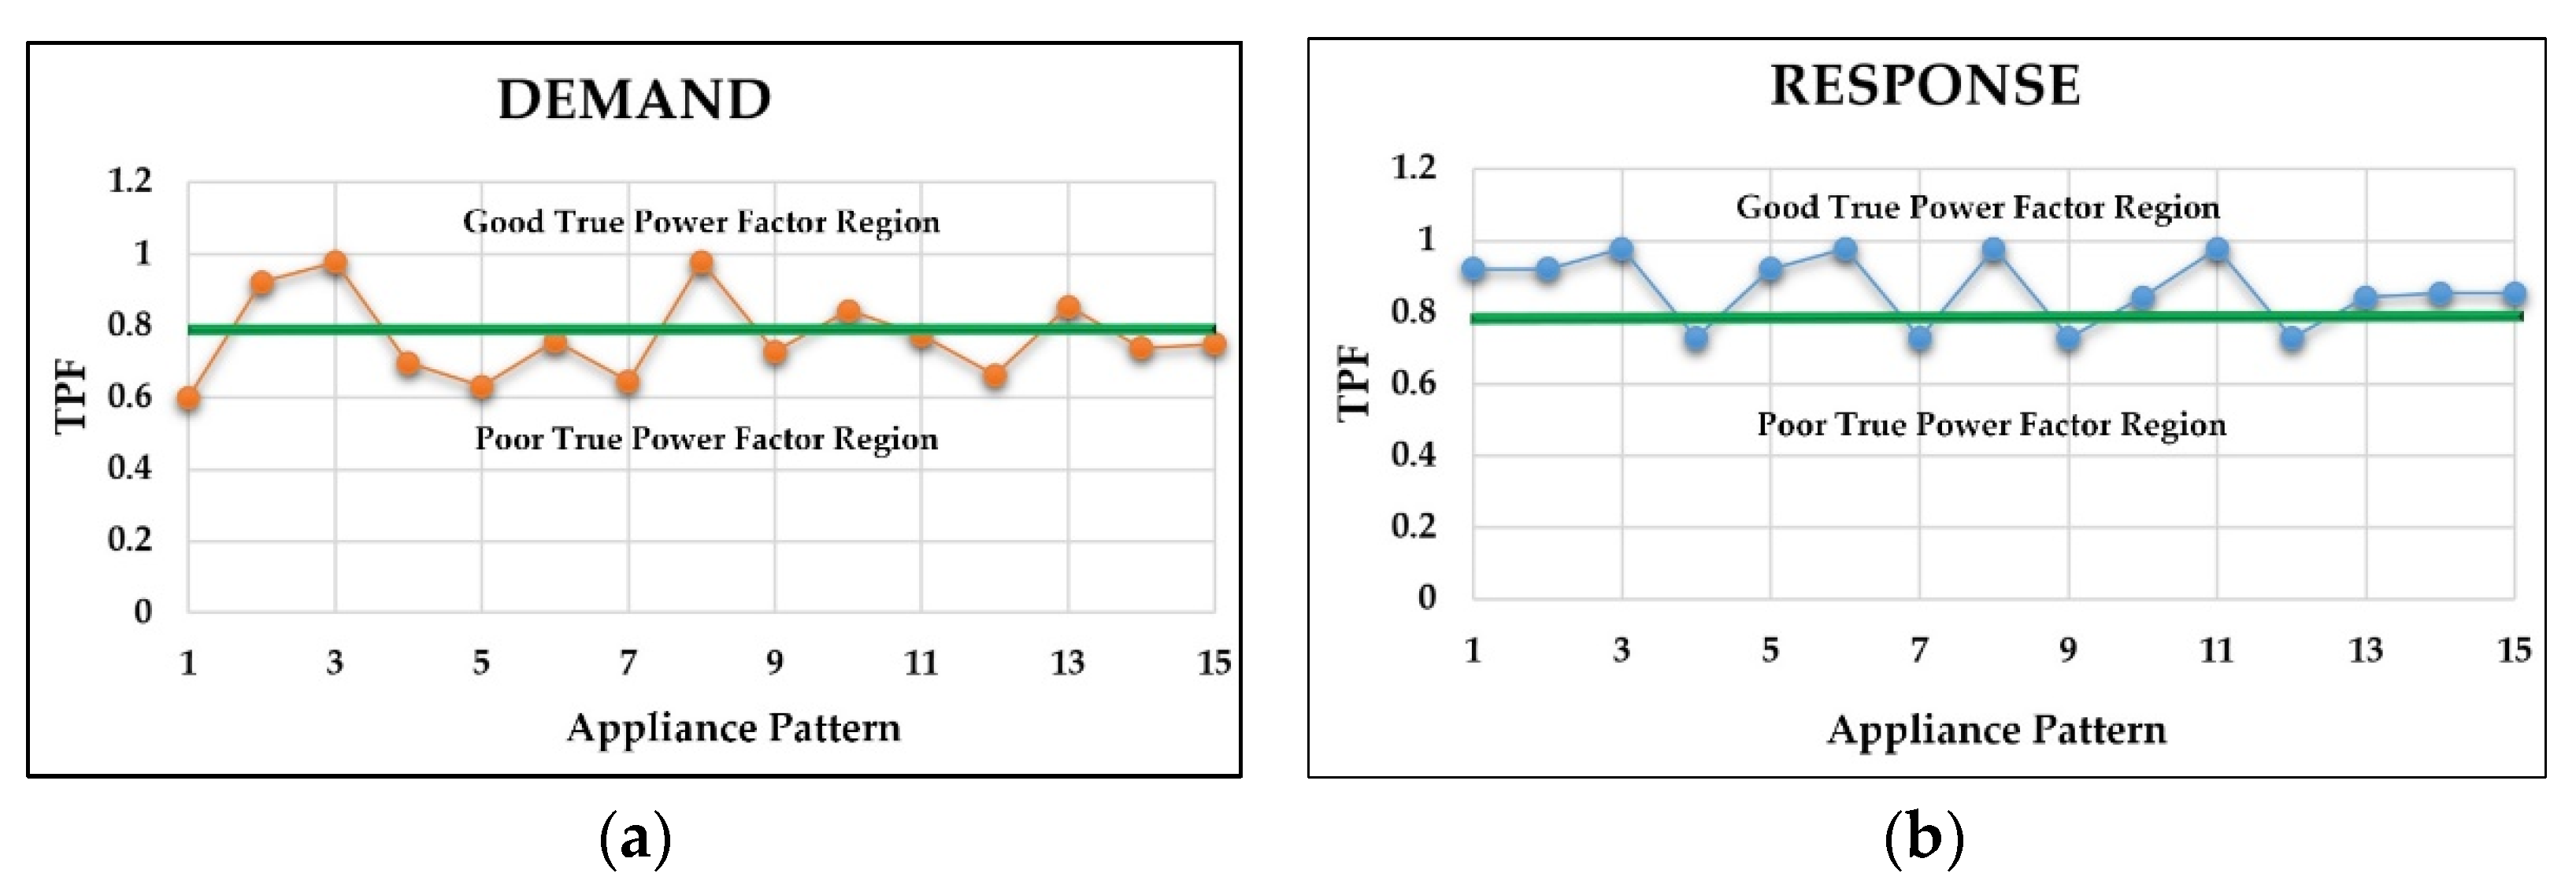
  • The TPF can be improved by selecting alternative appliance patterns, as suggested in Table 4.
  • Highly nonlinear appliances, such as CFLs, SMPSs, and their combinations, consume more reactive power, which results in a poor TPF.
  • The standard deviation of the TPF from the experimental results was 0.1271 for the demand, and it was reduced to 0.099 according to the recommended consumer responses. Thus, the consumer utilization index improved, as illustrated in Table 4, and the quality of the power was enhanced.
  • According to the results, it is necessary to adopt current harmonic mitigation devices, such as active power filters and PF correction devices in LVDSs, in order to minimize the malfunctioning of the utility equipment, such as failures of the transformers, false tripping of the circuit breakers, etc., as well as to safeguard LPCEAs from overheating.
  • It is necessary to develop smart energy meters in order to measure the THD and TPF and to recommend PQ-sensitive measures, with a provision in the power tariffs for better consumer behavior.
The quantitative metrics tabulated in Table 5 demonstrate the efficacy of the proposed deterministic method over non-deterministic methods.

5.2. Future Research

This paper offers a simple way of identifying appliance usage patterns, but there are a few challenges before taking this concept to market. The authors propose the following as the scope for future research.
  • A smart home may have very sophisticated appliances that could be programmed and operated remotely or controlled through a mobile application. How demand-response systems can take advantage of appropriate communication is of practical interest to explore.
  • The physical/thermal characteristics of electronic appliances may change over time and may, in turn, change the THD and TPF values. The accommodation of these adaptabilities in the demand-side management systems must be considered.
  • The compensation of the reactive power must be studied so that a power factor at unity can be achieved at all times and all nodes in a distribution system.

6. Conclusions

The goal of this research was to save energy with good PQ in order to meet SDG 7. Due to the huge penetration of LPCEAs and their resultant current THD, the TPFs in LVDSs are poor, and consequently, the energy efficiency and PQ are heavily deteriorated. In LVDSs, poor PFs and LPCEAs are not penalized, which results in losses to the DISCOMs. This article illustrated a deterministic approach that uses the TPF in order to identify the consumption patterns of LPCEAs by using the 4-term MSCW-based EDSLIFFT in a virtual instrumentation environment for various combinations of LPCEAs in real time. It was depicted that the TPF values could be used to effectively identify various LPCEA combinations. This method of the non-intrusive identification of appliance usage patterns is essential for responsible electricity consumption with TPF that are close to unity. It is necessary to streamline the tariff structure based on the PQ. It is also necessary to mandate the correction of the PF to maintain PF that is at unity in an LVDS as per CEA regulations (2010) and to holistically comply with SDG 7. The standard deviation of the TPF is impressive, but is not sufficient to comply with the IEEE 519-2014 standard, which requires the installation of compensation devices in LVDSs when appropriate. The actionable insights recommended in this article highlight the reduction in the active power consumption and kVA requirement; they also demonstrate the improvements in the consumer utilization index. The Republic of India does not specify requirements for domestic requirements at the 230 V level, and hence, no PF penalties are imposed. Hence, the TPF is not even a concern of consumers at this moment. This work intends to highlight the deficiencies in the distribution system that must be fixed.

Author Contributions

Conceptualization, H.P.D.; Formal analysis, H.P.D. and S.B.G.; Investigation, H.P.D., and S.B.G.; Methodology, H.P.D.; Project administration, H.P.D.; Resources, V.S.S.S.S.D.; Supervision, V.S.S.S.S.D. and S.B.G.; Validation, H.P.D. and V.S.S.S.S.D.; Writing—original draft, H.P.D.; Writing—review and editing, V.S.S.S.S.D. and S.B.G. All authors have read and agreed to the published version of the manuscript.

Funding

This research received no external funding.

Acknowledgments

The authors gratefully acknowledge the Department of Electrical Engineering of the National Institute of Technology Warangal for their support.

Conflicts of Interest

The authors declare no conflict of interest.

Nomenclature

nSample index
mWindow item index
MMaximum window item number
hHarmonic order
hmaxMaximum harmonic order
ahMinimal sidelobe cosine window (MSCW) coefficients
WFour-term MSCW function
NTotal number of samples
TsSampling time
tTime period
AhAmplitude of the hth harmonic component
fhFrequency of the hth harmonic component
φ h Phase of the hth harmonic component
kFour-term MSCW sample points (k = 0, 1, …, N − 1)
khDivision factor of signal frequency
fsSampling frequency
lhInteger value of greatest spectral line
ξ h Fraction part of greatest spectral line
lh1Spectral line 1 representing the hth harmonic amplitude
lh1Spectral line 2 representing the hth harmonic amplitude
ISpectral line peak index location value
y1Amplitude of the spectral line 1
y2Amplitude of the spectral line 2
α Symmetrical coefficient 1
βSymmetrical coefficient 2
VRMSTotal input voltage RMS value
IRMSTotal load current RMS value
V1RMSInput fundamental Voltage RMS value
VhRMShth order harmonic voltage RMS value
I1RMSLoad fundamental current RMS value
IhRMShth order harmonic load current RMS value
PActive power consumed by the LPCEAs
QReactive power consumed by the LPCEAs
θ 1 Fundamental voltage phase angle
δ 1 Fundamental load current phase angle
θ h hth order harmonic voltage phase angle
δ h hth order harmonic load current phase angle
VHRMSSummation of all of the harmonic voltages
IHRMSSummation of all of the harmonic currents
SApparent power
S1Fundamental apparent power component
SNNon-fundamental apparent power component
D1Current distortion power
DVVoltage distortion power
SHHarmonic apparent power
THDVVoltage total harmonic distortion
THDICurrent total harmonic distortion

Abbreviations

CEACentral Electricity Authority
CFLCompact fluorescent lamp
c-RIOCompact reconfigurable input–output
DFDistortion factor
DPFDisplacement power factor
DRDemand response
DSMDemand-side management
DSICOMsDistribution companies
EDSLIFFTEnhanced dual-spectrum line interpolated FFT
FFTFast Fourier transform
FPGAField-programmable gate array
IEEEInstitute of Electrical and Electronics Engineers
LEDLight-emitting diode
LPCEALow-power consumer electronic appliance
LVDSLow-voltage distribution system
MSCWMinimal sidelobe cosine window
NI National Instruments
NILMNon-intrusive load monitoring
PCPersonal computer
PCCPoint of common coupling
PFPower factor
PQPower quality
RMSRoot mean square
RTReal time
SDG 7Sustainable Development Goal 7
SMPSSwitch-mode power supply
THDTotal harmonic distortion
TPFTrue power factor

References

  1. Rahman, M.A.; Islam, R.; Sharif, K.F.; Aziz, T. Developing demand side management program for commercial customers: A case study. In Proceedings of the 2016 3rd International Conference on Electrical Engineering and Information Communication Technology (ICEEICT), Dhaka, Bangladesh, 22–24 September 2016; IEEE: Piscataway, NJ, USA, 2016; pp. 1–6. [Google Scholar]
  2. Srikanth, R. India’s sustainable development goals–glide path for India’s power sector. Energy Policy 2018, 123, 325–336. [Google Scholar] [CrossRef]
  3. Hazra, S.; Bhukta, A. Sustainable Development Goals. An Indian Perspective, 1st ed.; Springer Nature: Cham, Switzerland, 2020; pp. 107–127. [Google Scholar]
  4. Verma, P.; Patel, N.; Nair, N.-K.C. Demand side management perspective on the interaction between a non-ideal grid and residential LED lamps. Sustain. Energy Technol. Assess. 2017, 23, 93–103. [Google Scholar] [CrossRef]
  5. Devarapalli, H.P.; Dhanikonda, V.S.S.S.S.; Gunturi, S.B. Non-Intrusive Identification of Load Patterns in Smart Homes Using Percentage Total Harmonic Distortion. Energies 2020, 13, 4628. [Google Scholar] [CrossRef]
  6. Oruganti, V.S.R.V.; Bubshait, A.S.; Dhanikonda, V.S.S.S.S.; Simões, M.G. Real-time control of hybrid active power filter using conservative power theory in industrial power system. IET Power Electron. 2017, 10, 196–207. [Google Scholar] [CrossRef]
  7. Jimenez, Y.; Cortes, J.; Duarte, C.; Petit, J.; Carrillo, G. Non-intrusive discriminant analysis of loads based on power quality data. In Proceedings of the 2019 IEEE Workshop on Power Electronics and Power Quality Applications (PEPQA), Manizales, Colombia, 30–31 May 2019; IEEE: Piscataway, NJ, USA, 2019; pp. 1–5. [Google Scholar]
  8. Francisco, C. Harmonics, Power Systems, and Smart Grids, 2nd ed.; CRC Press: Boca Raton, FL, USA, 2015; pp. 1–278. [Google Scholar]
  9. Oruganti, V.S.R.V.; Dhanikonda, V.S.S.S.S.; Simões, M.G. Scalable single-phase multi-functional inverter for integration of rooftop solar-PV to low-voltage ideal and weak utility grid. Electronics 2019, 8, 302. [Google Scholar] [CrossRef] [Green Version]
  10. Mageed, H.; Nada, A.S.; Abu-Zaid, S.; Eldeen, R.S.S. Effects of waveforms distortion for household appliances on power quality. MAPAN 2019, 34, 559–572. [Google Scholar] [CrossRef]
  11. da Silva, R.P.B.; Quadros, R.; Shaker, H.R.; da Silva, L.C.P. Effects of mixed electronic loads on the electrical energy systems considering different loading conditions with focus on power quality and billing issues. Appl. Energy 2020, 277, 115558. [Google Scholar] [CrossRef]
  12. da Silva, R.P.B.; Quadros, R.; Shaker, H.R.; da Silva, L.C.P. A Mixed of Nonlinear Loads and their Effects on the Electrical Energy Billing. In Proceedings of the 2020 IEEE 8th International Conference on Smart Energy Grid Engineering (SEGE), Oshawa, ON, Canada, 12–14 August 2020; IEEE: Piscataway, NJ, USA, 2020; pp. 116–120. [Google Scholar]
  13. da Silva, R.P.B.; Quadros, R.; Shaker, H.R.; da Silva, L.C.P. Harmonic Interaction among Electronic Loads and Its Effects on the Electrical Quantities and Billing: Case Study with Lighting Devices. In Proceedings of the 2020 7th International Conference on Electrical and Electronics Engineering (ICEEE), Antalya, Turkey, 14–16 April 2020; IEEE: Piscataway, NJ, USA, 2020; pp. 53–60. [Google Scholar]
  14. Ruano, A.; Hernandez, A.; Ureña, J.; Ruano, M.; Garcia, J. NILM techniques for intelligent home energy management and ambient assisted living: A review. Energies 2019, 12, 2203. [Google Scholar] [CrossRef] [Green Version]
  15. Yang, H.; Xue, Y.; Liu, S.; Gao, B.; Shu, Y.; Xu, Y.; Wang, J. A Judging Method of Electric Larceny in the Guise of Saving Electrical Energy. Application of Intelligent Systems in Multi-modal Information Analytics. MMIA 2019. In Advances in Intelligent Systems and Computing; Sugumaran, V., Xu, Z., Shankar, P., Zhou, H., Eds.; Springer: Cham, Switzerland, 2020; Volume 929, pp. 1029–1037. [Google Scholar]
  16. Gopinath, R.; Kumar, M.; Joshua, C.P.C.; Srinivas, K. Energy management using non-intrusive load monitoring techniques-State-of-the-art and future research directions. Sustain. Cities Soc. 2020, 62, 102411. [Google Scholar] [CrossRef]
  17. Dlamini, F.M.; Nicolae, D.V. An approach to quantify the technical impact of power quality in medium voltage distribution systems. In Proceedings of the 2016 IEEE International Power Electronics and Motion Control Conference (PEMC), Varna, Bulgaria, 25–28 September 2016; IEEE: Piscataway, NJ, USA, 2016; pp. 315–321. [Google Scholar]
  18. IEEE. Standard Definitions for the Measurement of Electric Power Quantities under Sinusoidal, Nonsinusoidal, Balanced, or Unbalanced Conditions. In IEEE Std. 1459–2010 (Revision of IEEE Std. 1459–2000); IEEE: New York, NY, USA, 2010. [Google Scholar]
  19. Oruganti, V.S.R.V.; Dhanikonda, V.S.S.S.S.; Paredes, H.K.M.; Simões, M.G. Enhanced Dual-Spectrum Line Interpolated FFT with Four-Term Minimal Sidelobe Cosine Window for Real-Time Harmonic Estimation in Synchrophasor Smart-Grid Technology. Electronics 2019, 8, 191. [Google Scholar] [CrossRef] [Green Version]
  20. Varaprasad, O.V.S.R.; Sarma, D.S.; Panda, R.K. Advanced windowed interpolated FFT algorithms for harmonic analysis of electrical power system. In Proceedings of the 2014 Eighteenth National Power Systems Conference (NPSC), Guwahati, India, 18–20 December 2014; IEEE: Piscataway, NJ, USA, 2014; pp. 1–6. [Google Scholar]
  21. IEEE. Recommended Practice for Monitoring Electric Power Quality. In IEEE Std. 1159–2019 (Revision of IEEE Std. 1159–2009); IEEE: New York, NY, USA, 2014. [Google Scholar]
  22. IEC 61000 4–30 Electromagnetic Compatibility (EMC)—Part 4–30: Testing and Measurement Techniques—Power Quality Measurement Methods; International Electrotechnical Commission: Geneva, Switzerland, 2015.
  23. User Manual, NI cRIO-9082. Available online: http://www.ni.com/pdf/manuals/376904a_03.pdf (accessed on 16 June 2021).
  24. Operating Instructions and Specifications, NI 9225. Available online: https://www.ni.com/pdf/manuals/374707e.pdf (accessed on 16 June 2021).
  25. Operating Instructions and Specifications, NI 9227. Available online: https://www.ni.com/pdf/manuals/375101e.pdf (accessed on 16 June 2021).
  26. IEEE. Recommended practices and requirements for harmonic control in electric power systems. In IEEE Std. 519–2014 (Revision of IEEE Std. 519–1992); IEEE: New York, NY, USA, 2014. [Google Scholar]
Figure 1. Schematic of demand-side management with the non-intrusive identification of appliance usage patterns in smart homes with the TPF.
Energies 14 04837 g001
Figure 2. Computation process of the EDSLIFFT algorithm using 4MSCW.
Energies 14 04837 g002
Figure 3. Hardware/lab setup for the measurement of the TPF.
Energies 14 04837 g003
Figure 4. Flowchart for the non-intrusive identification of appliance usage patterns with the TPF.
Energies 14 04837 g004
Figure 5. The voltage and current waveforms of a single real-world appliance: (a) CFL, (b) LED, (c) exhaust fan, and (d) SMPS of a PC.
Energies 14 04837 g005
Figure 6. The voltage and current waveforms of combinations of two real-world appliances: (a) CFL and LED; (b) CFL and exhaust fan; (c) CFL and SMPS of a PC; (d) LED and exhaust fan; (e) LED and SMPS of a PC; (f) exhaust fan and SMPS of a PC.
Energies 14 04837 g006
Figure 7. The voltage and current waveforms of combinations of three real-world appliances: (a) CFL + LED + exhaust fan; (b) CFL + LED + SMPS of a PC; (c) LED + exhaust fan + SMPS of a PC; (d) CFL + exhaust fan + SMPS of a PC.
Energies 14 04837 g007
Figure 8. The voltage and current waveforms of the combination of the four real-world appliances: CFL + LED + exhaust fan + SMPS of a PC.
Energies 14 04837 g008
Figure 9. The TPFs of appliance usage patterns according to: (a) demand; (b) responses to the insights.
Energies 14 04837 g009
Table 1. Summary of the standards compliance of the proposed RT-based measurement method.
StandardElectrical ParametersCompliance
IEEE 1459-2010: Standard Definitions for the Measurement of Electric Power Quantities Under Sinusoidal,
Non-Sinusoidal, Balanced, or
Unbalanced Conditions
Instantaneous Power, Active Power, Reactive Power, Apparent power, Non-Active Power,
Voltage THD, Current THD, PF
Yes
IEEE 1159-2019: IEEE Recommended Practice for Monitoring Electric Power QualityRMS voltage, RMS Current,
Frequency
Yes
IEC 61000-4-60: Testing and
measurement techniques—power
quality measurement methods
Power Frequency, Flicker, Voltage Magnitude, Unbalance,
Harmonics, Interharmonics
Yes
Table 2. TPFs for all 15 appliance patterns in real time.
S.NoCombinations of Different AppliancesCODETPF
1CFL1 0 0 00.59887
2LED0 1 0 00.92228
3Exhaust Fan0 0 1 00.97801
4SMPS of PC0 0 0 10.69738
5CFL + LED1 1 0 00.63145
6CFL + Exhaust Fan1 0 1 00.75781
7CFL + SMPS of a PC1 0 0 10.64612
8LED + Exhaust Fan0 1 1 00.97925
9LED + SMPS of a PC0 1 0 10.72841
10Exhaust FAN + SMPS of a PC0 0 1 10.84232
11CFL + LED + Exhaust Fan1 1 1 00.77422
12CFL + LED + SMPS of a PC1 1 0 10.66289
13LED + Exhaust Fan + SMPS of a PC0 1 1 10.85390
14CFL + Exhaust Fan + SMPS of a PC1 0 1 10.73836
15CFL + LED + Exhaust Fan + SMPS of a PC1 1 1 10.74947
Table 3. Actionable insights for DR management using the TPF.
Actionable Insights and Benefits
DemandResponseBenefits
S.NoCODETPFActionable InsightsS.NoCODETPFChange in TPF%
11 0 0 00.59887Turn off CFL20 1 0 00.92228−54.0033
20 1 0 00.92228NR 1NR0 1 0 00.922280
30 0 1 00.97801NRNR0 0 1 00.978010
40 0 0 10.69738Turn off LED for daytime90 0 0 10.72841−4.4495
51 1 0 00.63145Turn off CFL20 1 0 00.92228−46.0574
61 0 1 00.75781Turn off CFL80 1 1 00.97925−29.2210
71 0 0 10.64612Turn off CFL for daytime90 0 0 10.72841−12.7360
80 1 1 00.97925Turn off LED for daytime30 0 1 00.978010.1266
90 1 0 10.72841NRNR0 1 0 10.728410
100 0 1 10.84232NRNR0 0 1 10.842320
111 1 1 00.77422Turn off CFL80 1 1 00.97925−26.4821
121 1 0 10.66289Turn off CFL90 1 0 10.72841−9.8839
130 1 1 10.85390Turn off LED for daytime100 0 1 00.842321.3561
141 1 0 10.73836Turn off CFL130 1 1 10.85390−15.6481
151 1 1 10.74947Turn off CFL130 1 1 10.85390−13.9338
Standard Deviation0.1214 Standard Deviation0.099
1 NR = No recommendation.
Table 4. Actionable insights for the improvement of the utilization index.
Actionable Insights and Benefits
DemandResponseBenefits
S.NoCODEP (Watts)Q (VARs)S (VAs)S1 (VAs)SN (VAs)Utilization
Index = S1/S
S.NoCODEP (Watts)Q (VARs)S (VAs)S1/S% Change in
Utilization Index
11 0 0 089.5377−29.0642149.5194.1348116.1650.629620 1 0 08.74502−3.18489.481950.981535.8531
20 1 0 08.74502−3.18489.481959.306841.81620.9815NR0 1 0 08.74502−3.18489.481950.98150
30 0 1 051.0239−0.000852.170851.023910.8820.9780NR0 0 1 051.0239−0.000852.17080.97800
40 0 0 180.2522−26.0488115.07684.372678.26640.733190 0 0 188.9952−29.233122.1760.76664.3703
51 1 0 098.2871−32.2501155.651103.447116.32700.664620 1 0 08.74502−3.18489.481950.981532.2887
61 0 1 0140.558−29.0638185.479143.53117.4810.773880 1 1 059.7686−3.1854261.03480.980621.0892
71 0 0 1169.803−55.1164262.805178.522192.9140.679290 0 0 188.9952−29.233122.1760.766611.3999
80 1 1 059.7686−3.1854261.034859.853411.9530.980630 0 1 051.0239−0.000852.17080.9780−0.2686
90 1 0 188.9952−29.233122.17693.67278.4460.7666NR0 1 0 188.9952−29.233122.1760.76660
100 0 1 1131.274−26.0482155.847133.83279.8680.8587NR0 0 1 1131.274−26.0482155.8470.85870
111 1 1 0149.305−32.2485192.844152.747117.7280.792080 1 1 059.7686−3.1854261.03480.980619.2290
121 1 0 1178.533−58.2972269.323187.807193.0520.697390 1 0 188.9952−29.233122.1760.76669.0475
130 1 1 1140.016−29.2325163.971143.03480.17730.8723100 0 1 0131.274−26.0482155.8470.8587−1.5806
141 1 0 1220.819−55.1134299.063227.59194.0490.7610130 1 1 1140.016−29.2325163.9710.872312.7595
151 1 1 1229.565−58.2983306.302236.849194.2630.7732130 1 1 1140.016−29.2325163.9710.872311.3560
NR = No recommendation.
Table 5. Quantitative metrics for the non-intrusive identification of appliance usage patterns in comparison with those of statistical methods.
Quantitative Metric CategoryQuantitative MetricsTPFStatistical Methods
FeatureSampling rateMediumHigh
MethodProcess of ExecutionExperimentalEmpirical
AccuracyDisaggregation percentage (D)100<100
Disaggregation Error (DE)0>0
Precision(P)—TP 1/(TP + FP 2)1<1
Recall (R)—TP/TP + FN1<1
Accuracy = (TP + TN 3)/(TP + TN + FP + FN 4)1<1
F-measure (f1) 2 × P × R/(P + R)1<1
TrainingUser interfaceSimpleComplex
Real-Time ImplementationDeployment capabilityHighLow
ScalabilityPace of deploymentHighLow
Identification FactorThe standard deviation of the TPF0.1271NA
GeneralizationGeneralization over unseen homesHighMedium
1 TP = true positive; 2 FP = false positive; 3 TN = true; 4 FN = false negative.
Publisher’s Note: MDPI stays neutral with regard to jurisdictional claims in published maps and institutional affiliations.

