Article

Enhancement of Continuous-Feed Low-Cost Solar Distiller: Effects of Various Fin Designs

1
Department of Mechanical Engineering, Faculty of Engineering, Mataram University, Jl. Majapahit 62, Mataram 83125, Indonesia
2
Research Group of Sustainable Thermofluids, Sebelas Maret University, Jl. Ir. Sutami 36A Kentingan, Surakarta 57126, Indonesia
3
Department of Mechanical Engineering, Faculty of Engineering, Sebelas Maret University, Jl. Ir. Sutami 36A Kentingan, Surakarta 57126, Indonesia
4
Department of Mining and Materials Engineering, McGill University, 3450 University, Frank Dawson Adams Bldg., Montreal, QC H3A2A7, Canada
5
Institute of Industrial Science, The University of Tokyo, 4-6-1 Komaba, Meguro-ku, Tokyo 153-8505, Japan
*
Author to whom correspondence should be addressed.
Energies 2021, 14(16), 4844; https://doi.org/10.3390/en14164844
Submission received: 29 June 2021 / Revised: 28 July 2021 / Accepted: 3 August 2021 / Published: 9 August 2021
(This article belongs to the Special Issue Solar Energy and Desalination)

Abstract

:
This study aimed to enhance distilled water production by employing conventional single-slope solar distillers with continuous seawater input. Three solar absorbers—i.e., a flat absorber, an absorber with 10 fins, and an absorber with 15 fins—were designed and examined experimentally. The seawater entered the distillers continuously due to gravity. Moreover, the seawater level inside the distillers was kept constant by using a floating ball valve. The overall size of each distiller was fixed at 1136 mm × 936 mm × 574 mm. The performance of the distillers was analyzed and discussed. The average yields of the flat absorber, the absorber with 10 fins, and the absorber with 15 fins were 1.185 L/d, 1.264 L/d, and 1.404 L/d, respectively. The results of the absorber with 15 fins were about 18.5% higher than those of the flat absorber. The experimental results were compared with the established correlations. This new design with increased water yield provides an effective approach for harvesting sunlight in remote tropical regions for small-scale solar desalination.

1. Introduction

In Indonesia, there are still many places that have water shortages, especially during the dry season. As mentioned in our previous work [1], West Java, Gunung Kidul, East Java, Nusa Tenggara Barat, and Nusa Tenggara Timur lack access to clean water during the dry season. People who live in these areas have to walk long distances to obtain clean water, and some of them still consume dirty water. Indonesia is an archipelagic country with plenty of access to the ocean, which could be used as a source of freshwater to avoid clean water shortages. Many devices can be used for converting saltwater into freshwater, including electrical water distillers, fuel/gas water distillers, solar distillers, and reverse osmosis (RO). However, the conversion of seawater to freshwater using these technologies requires a large amount of energy and is also high-cost.
The electrical distiller is a simple device that turns saltwater into freshwater by evaporating seawater and condensing the steam into freshwater. This device, which is advertised in online marketplaces for example, is considered to be very expensive for people who live on remote beaches/coasts and in remote areas with low incomes. A fuel/gas water distiller, while a little cheaper, still requires high capital and operating costs and, hence, is not suitable for such people. The cheapest device that can be used for this purpose is a solar water distiller. This type of device has been investigated by several researchers [1,2,3]. Meanwhile, a powerful device to turn seawater into freshwater is RO. This kind of device has been also investigated by previous researchers [4,5,6,7].
Although RO is a powerful device, the energy used for running this device is very high. It is only affordable and economically feasible for use on a large scale, such as in industry or for a community. When people use this device individually, the operating costs cannot be justified by the amount of freshwater produced. Hence, this device is also not suitable to help people living on remote coasts due to its high operational cost. Moreover, this device can only be used by people who live near the sea and have easy access to seawater. Thus, a solar distiller is considered as the best option. However, there are some uncontrollable conditions, such as clouds, solar intensity, relative humidity, and ambient temperature. These environmental conditions influence the productivity of a solar distiller.
Solar water distilling devices are classified into several models—e.g., prism models, pyramid models, and centralized collector models [8]. Nevertheless, these devices cannot produce large amounts of distilled water, as reported by Badran [2], Heck et al. [6], Cappelletti [9], and Aburideh et al. [10]. Cappelletti [9] performed an experimental study on a plastic solar still and obtained 1.7–1.8 L/d of distilled water. Badran [2] reported that their device could only produce 0.908 L/d of distilled water. Moreover, Aburideh et al. [10] obtained about 0.017 L/d of distilled water from a device. Zeroual et al. [11] performed experiments using a double-slope solar distiller, obtaining approximately 2.33–6.26 L/d distilled water. Sifat and Uddin [12] experimentally studied solar water desalination and obtained about 1.970 L/d of freshwater. Here, Sifat and Uddin [12] also produced much-distilled water; however, they added a Fresnel glass to their device. This means that their device is more expensive; again, people may not be interested in buying it due to the cost. For people who live near remote coasts and are in a lower economic class, a device that is cheap, easy to make, easy to operate and maintain, and durable is needed. More recently, Panchal et al. [13] studied single-slope distillers equipped with fins. Their distillers could produce 2.375 L/d fresh water using vertical fins. However, the fins were made of wind chime pipes installed on an incline and vertically. The wind chime pipe is expensive and is not available in remote areas. Moreover, the feeding water was inputted manually by opening and closing the valve. This method makes operating the distiller difficult because the operator must stand near the distiller in order to operate the valve. Kaviti et al. [14] performed an energy and exergy analysis of a double-slope solar still with aluminum truncated conic fins. Although they used fins and double slopes for their distiller, they obtained only 0.83 L/d of accumulated water. This means that the water production needs to be improved.
More advanced studies on desalination have been performed by several researchers—e.g., Ambarita [15], Kateshia and Lakhera [16], Mohaisen et al. [17], and Adelgaied et al. [18]. Ambarita [15] applied a vacuum desalination system with a low heat source. Ambarita [15] could produce fresh water in amounts of 6.63 L/d. The results were excellent; however, Ambarita [15] used common electrical power, not solar. Furthermore, the desalination system used by Ambarita [15] was not simple, and was expensive because the water was evaporated by being heated in a vacuum chamber. Kateshia and Lakhera [16] performed experiments on solar stills using pin fins and phase change material (PCM). They obtained extremely large amounts of fresh water compared to other studies. However, making pin fins is not easy or cheap. Moreover, they used PCM, which is a type of material that is difficult and expensive to obtain. Hence, this kind of device is not suitable for communities in remote villages with low incomes. Mohaisen et al. [17] investigated solar stills using a finned-wall/built-in condenser. They found excellent results; however, as they added the condenser, their device was not simple. Adelgaied et al. [18] conducted experiments on tubular solar stills using square and circular hollow fins with PCM. They obtained a large amount of fresh water. Nevertheless, their device was very complicated and difficult to make, as well as being much more expensive. Hence, the device is not suitable for use by the ordinary community.
Therefore, in this study a conventional solar distiller is modified using various fins to produce a higher distilled water yield. The novelty of this work is its proposed configuration, which is unique to distillers equipped with fins. This proposed configuration features a wide rectangular fin made of a hollow rectangular light steel array with transverse openings in the two ends to increase the water vapor generation and enhance the heat transfer. Moreover, the proposed distiller uses continuous water feeding, which was not considered in previous studies. The continuous water feeding makes it easy for the operator to use and allows for a constant water level inside the distiller. Previous studies have used fins; however, these fins were made of expensive materials and their systems were more complex. In this study, both expensive material and a complex system were avoided. One thing that should be noted is the simplicity of the proposed distiller, as this device will later be offered to remote coastal communities. Moreover, this proposed design with an increased water yield offers an effective approach to harvesting sunlight for small-size solar desalination in remote tropical regions.

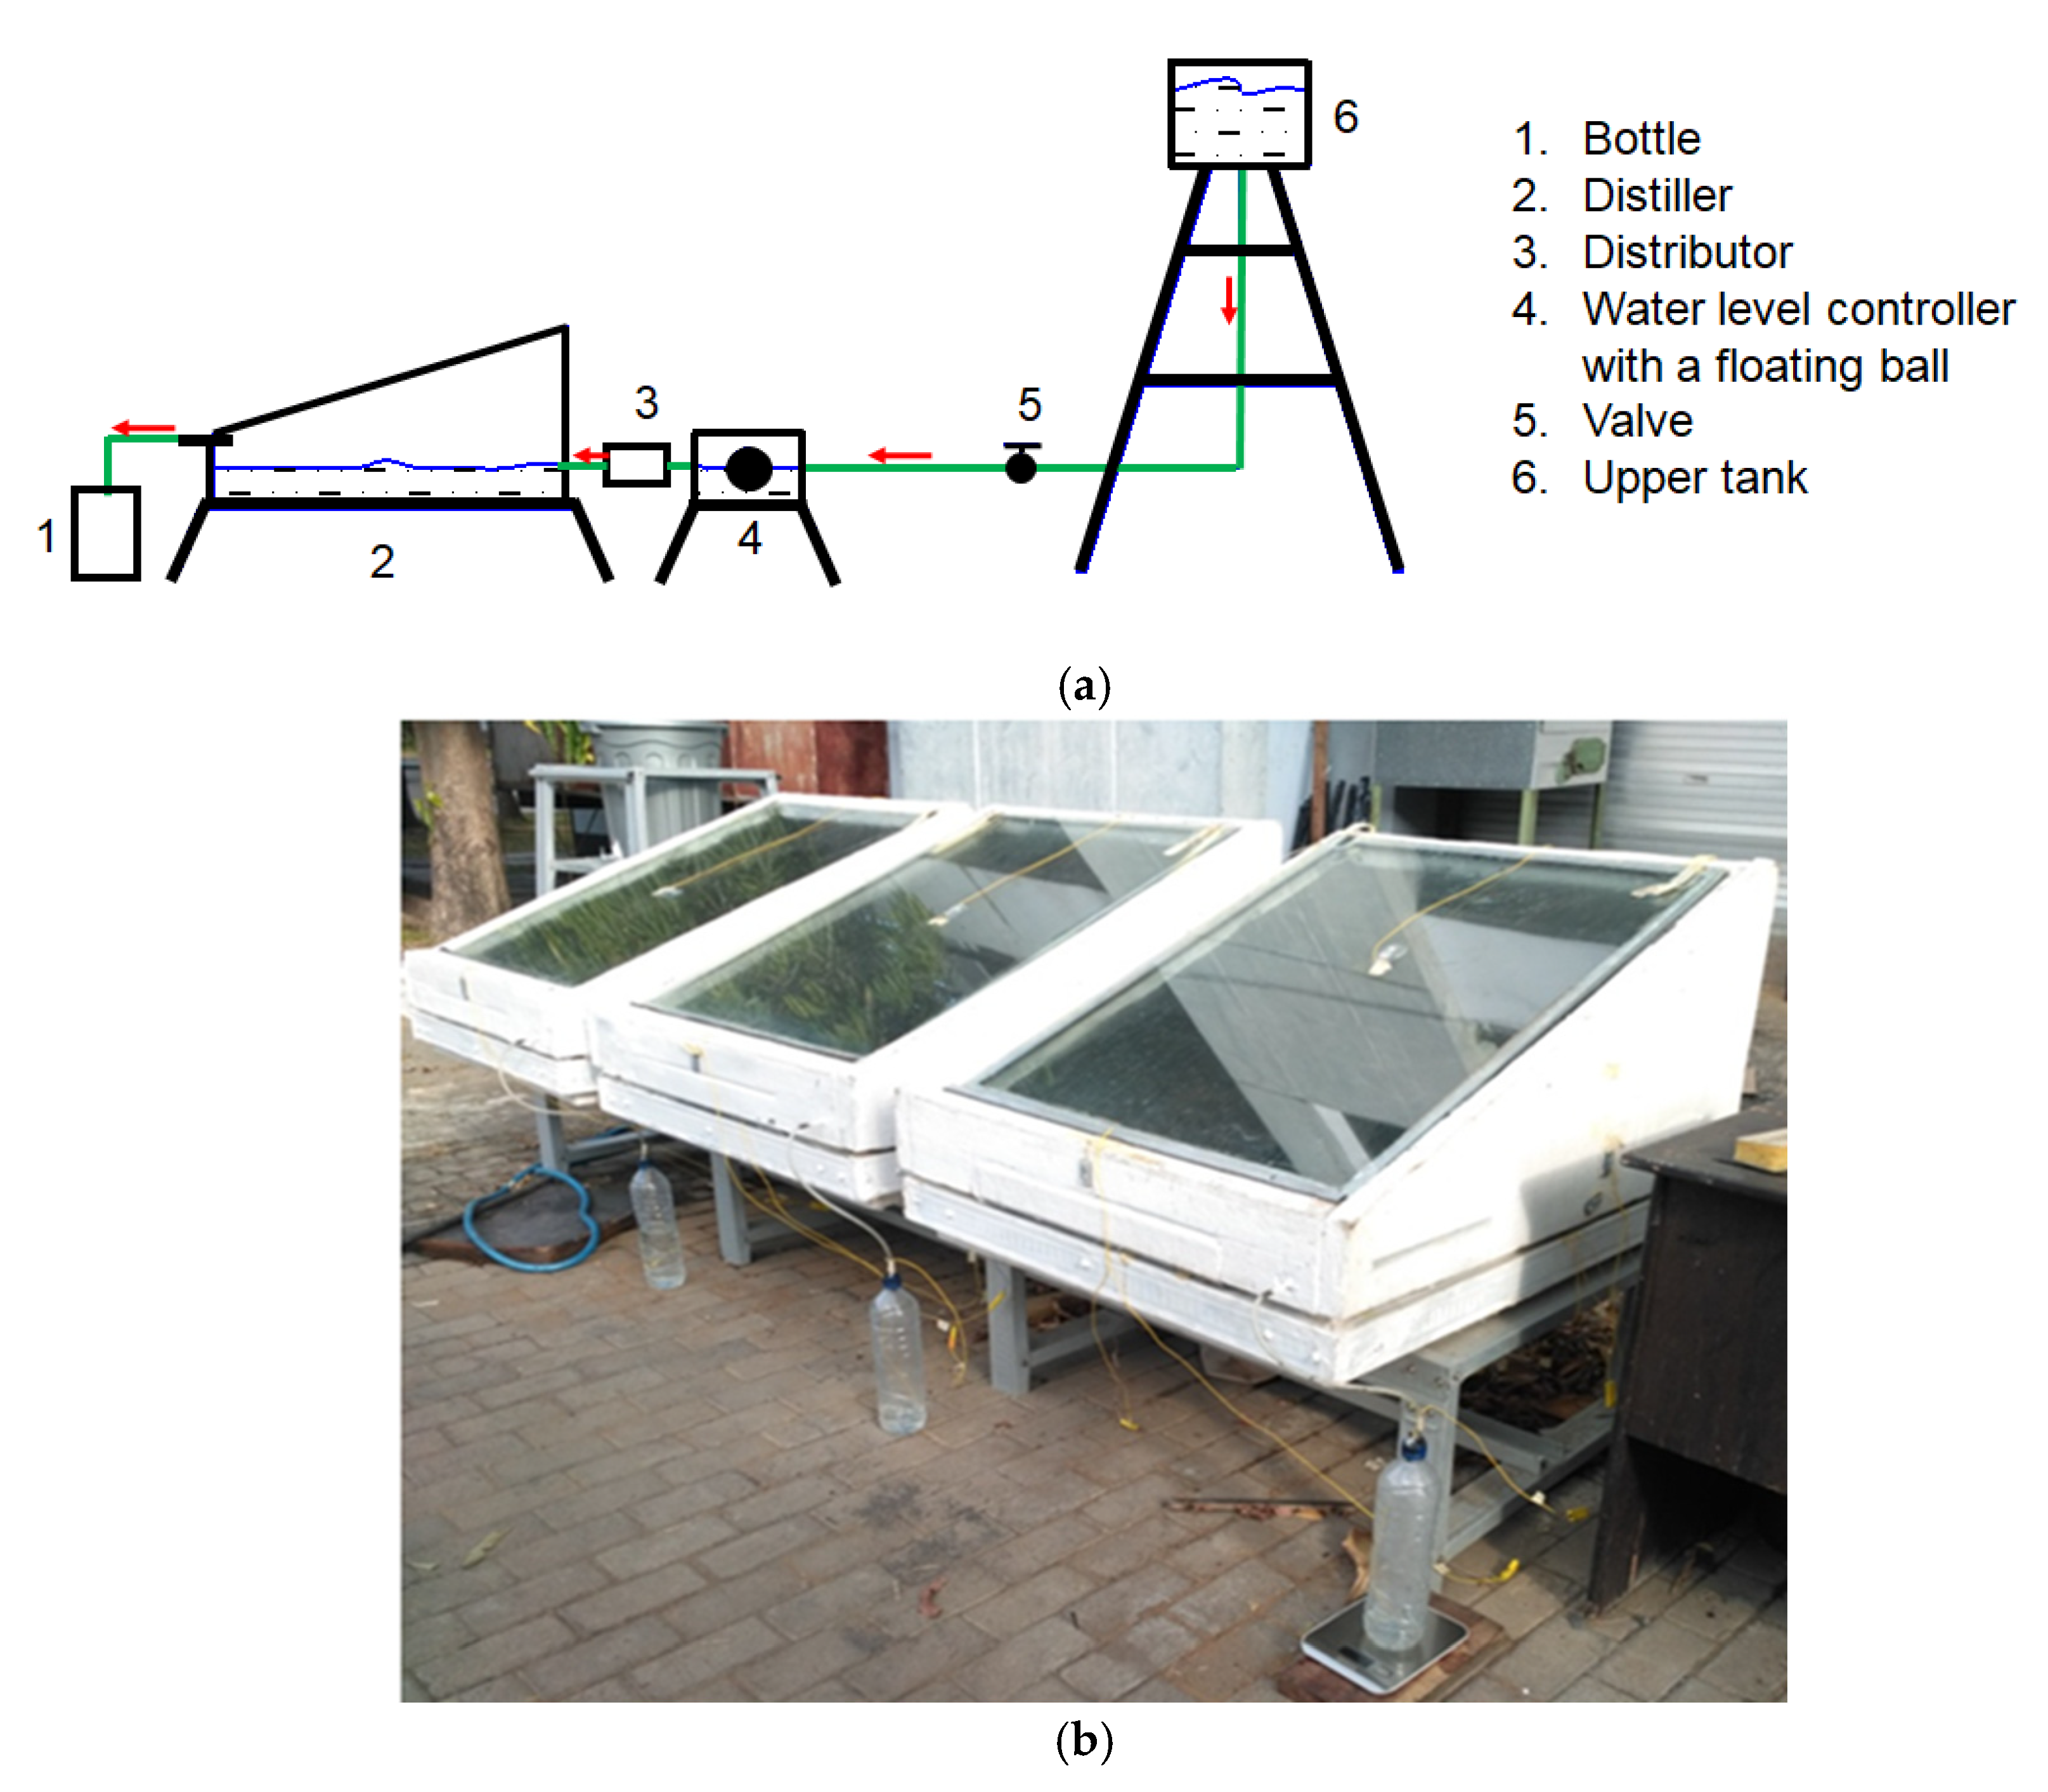
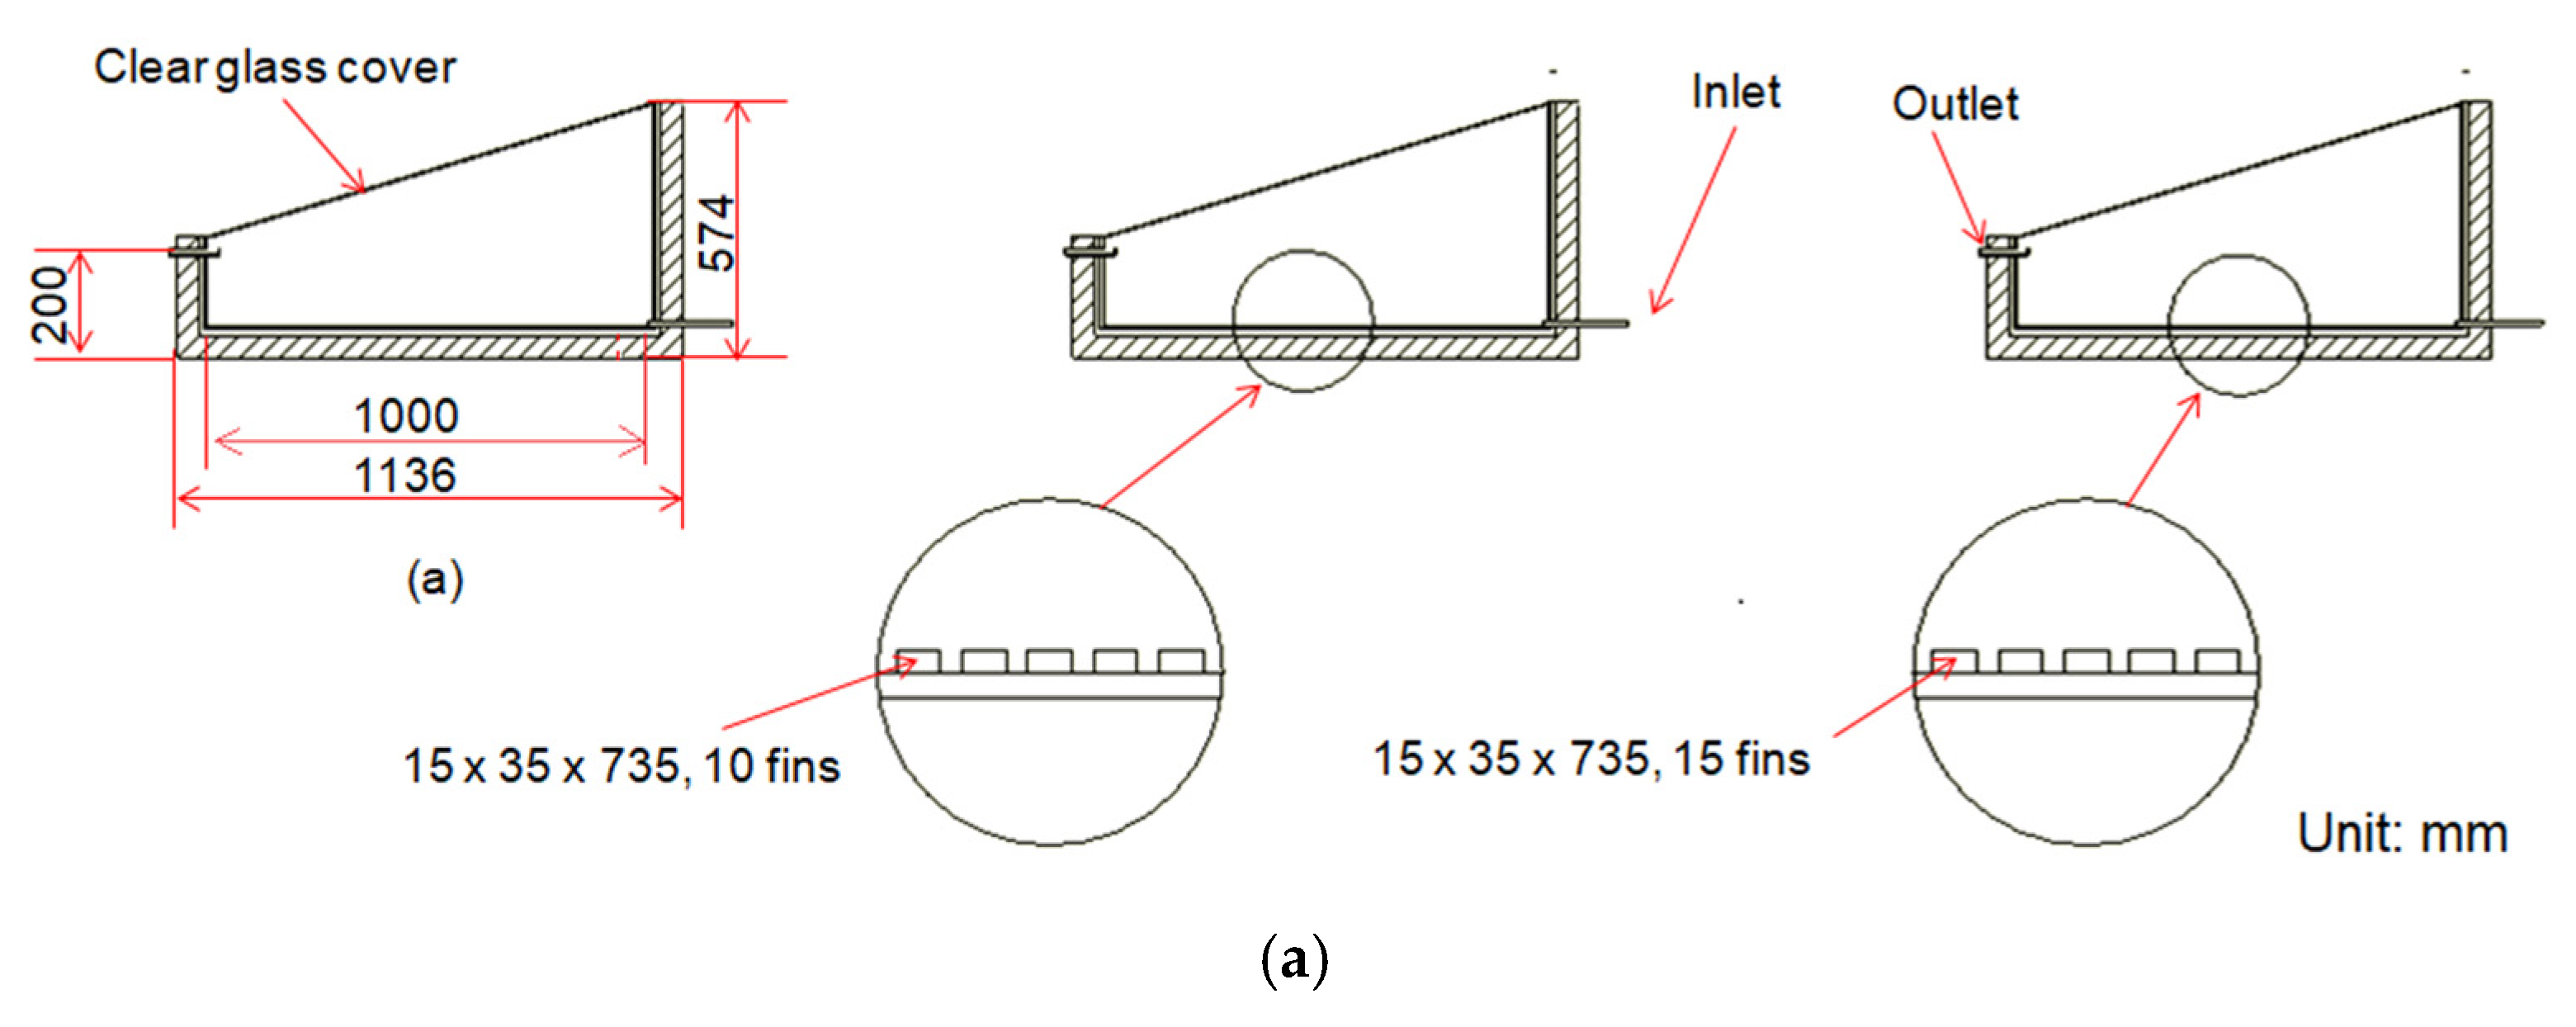
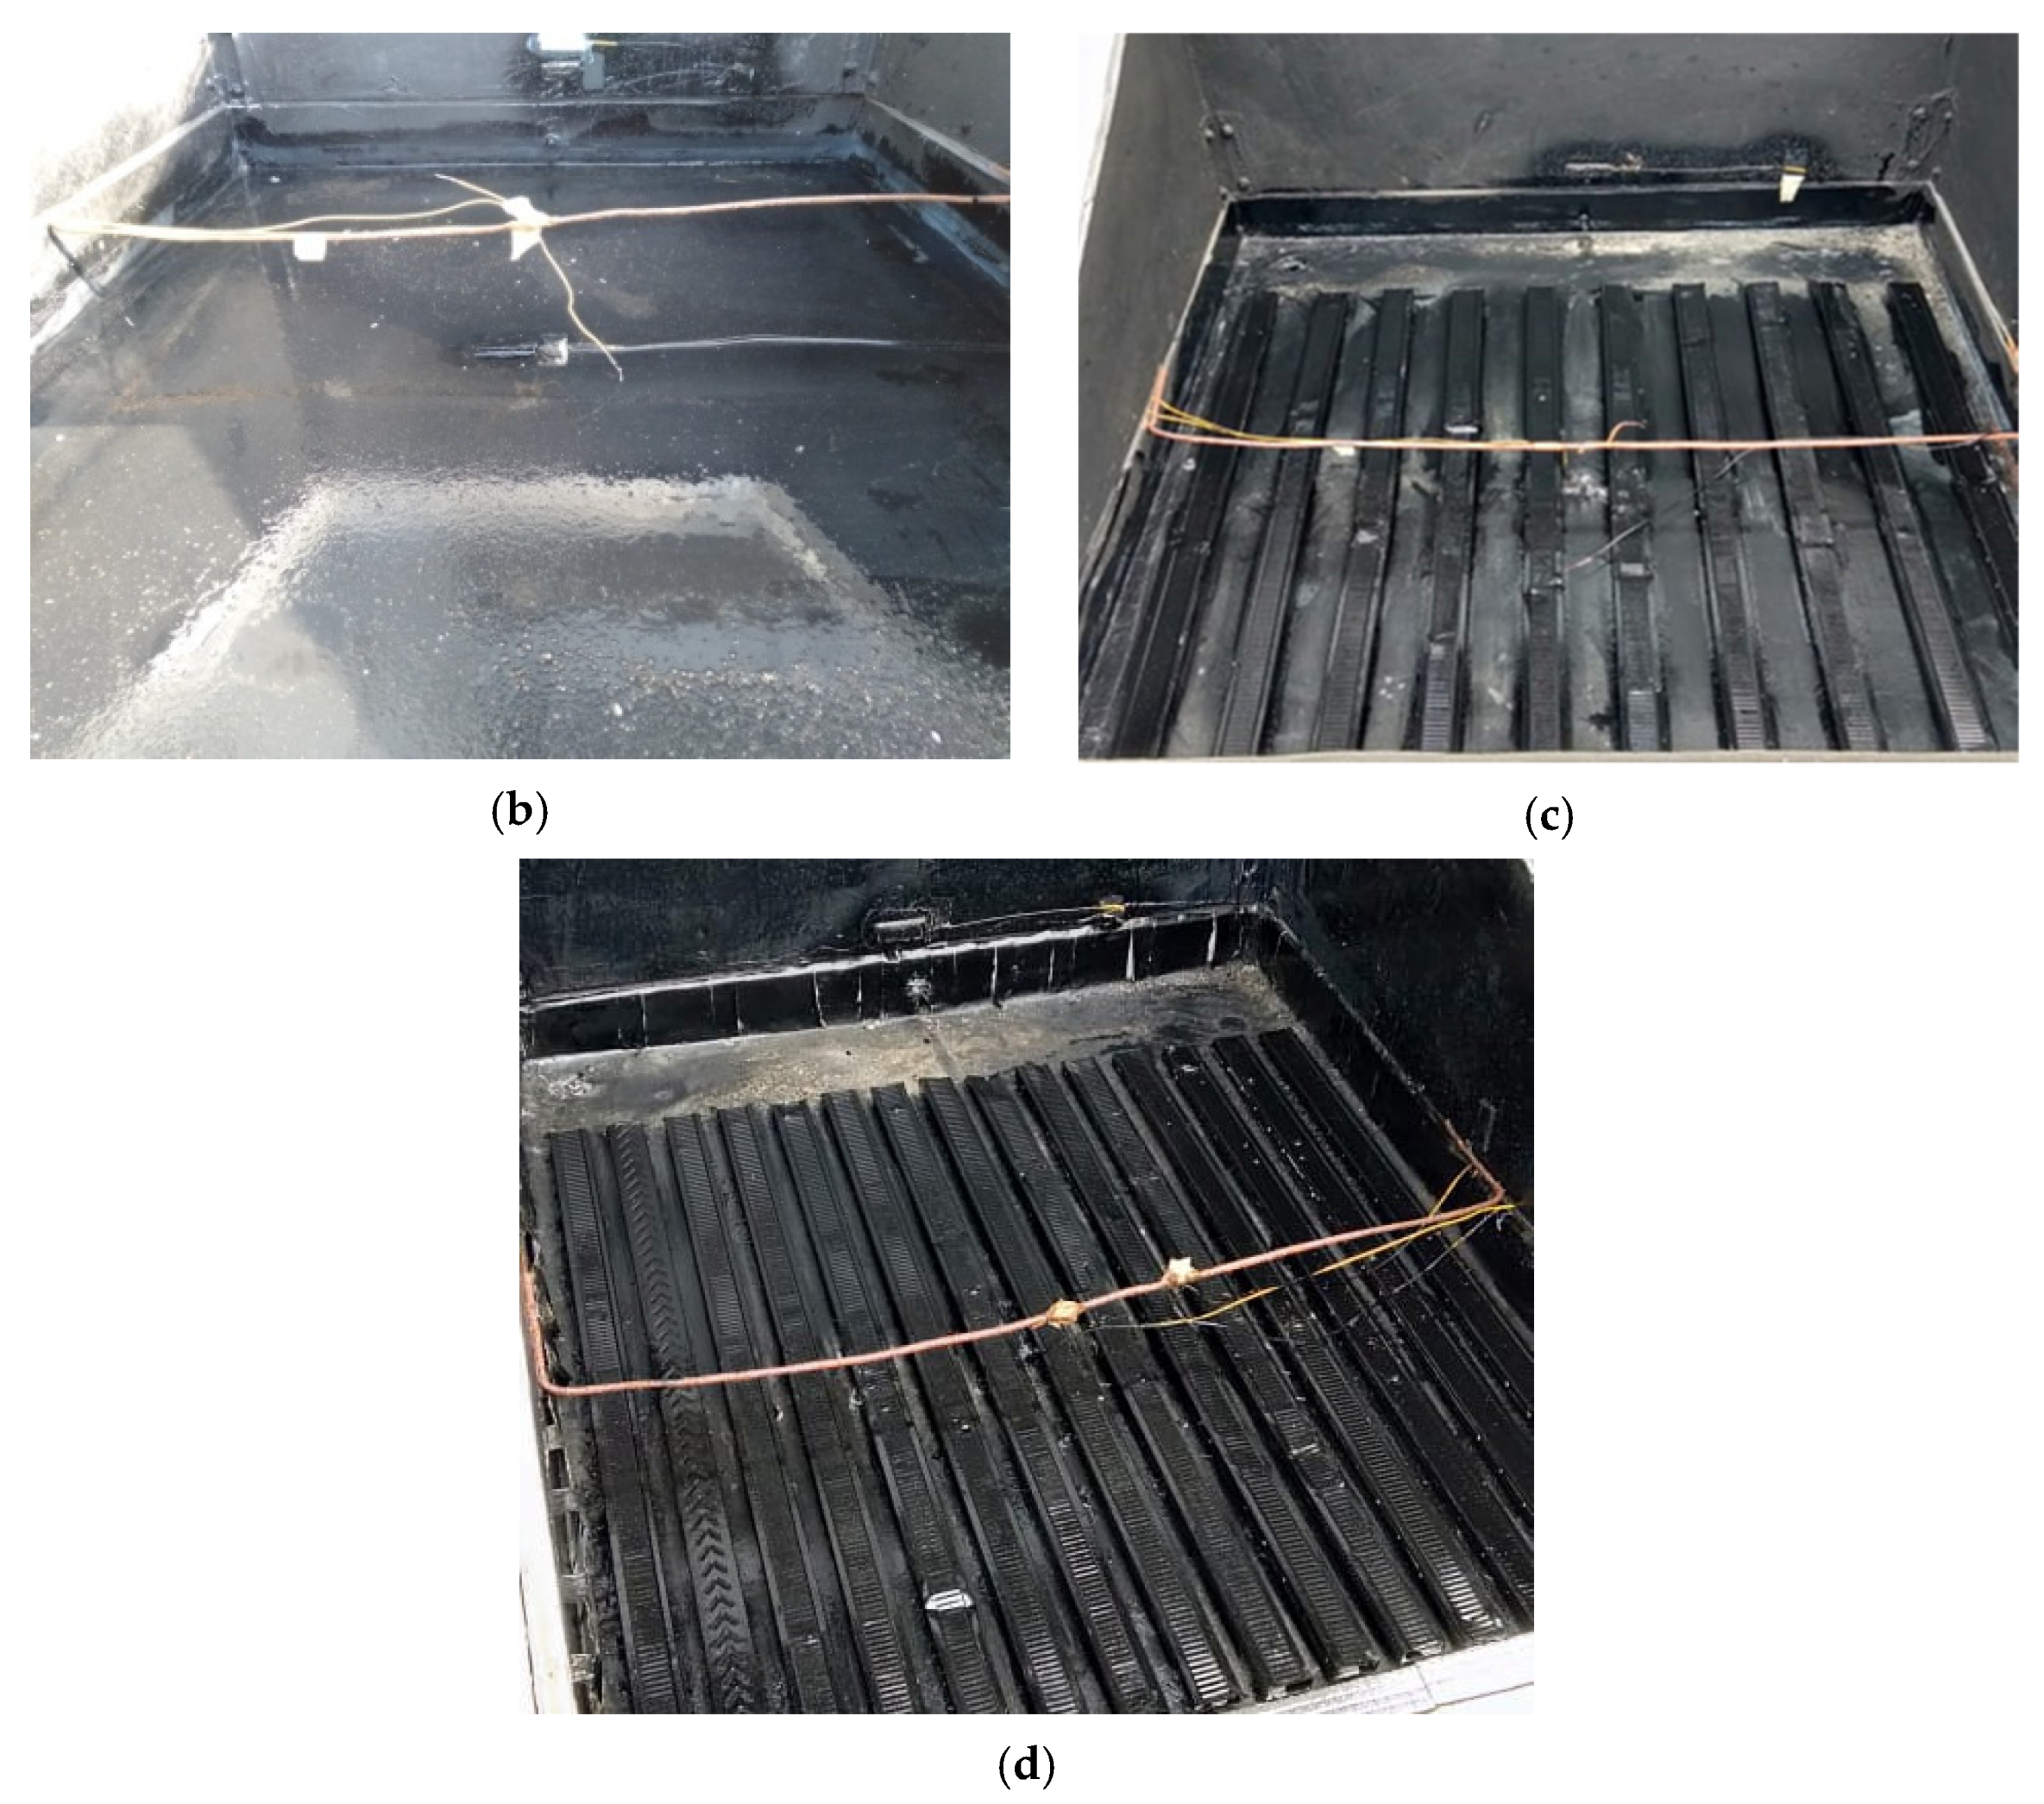
2. Experimental Setup

Figure 1 shows the schematic diagram and a photograph of the test facility, while Figure 2 indicates the geometry of the flat absorber, and those equipped with 10 and 15 fins. The experiments were performed in the remote tropical region of Mataram, Indonesia (S 8°25′14.367″, E 116°5′26.114″) in September 2019. There were three different cases evaluated in this study. Case A indicates a flat absorber, Case B is an absorber with 10 fins, and Case C is an absorber with 15 fins. The schematic diagram includes three identical conventional solar single-slope single-basin distillers, a level control box, a distributor, an upper tank, and bottles. The seawater flowed gravitationally and continuously from the upper tank through a valve, a level control, and a distributor. Finally, seawater arrived in the basin of the distillers. The water level controller was used to maintain the seawater level in the basin of the distillers. When the seawater evaporated, the surface level of the seawater decreased, and then the valve with a floating ball opened automatically and the seawater flowed to the basin again. The schematic processing of experimental apparatus has also been used in our previous work [1] for examining the effect of distiller absorbers on distilled water production. The distiller with an absorber constructed from fins managed to achieve the largest amount of distilled water. After publishing our article [1], we were motivated to extend our work to improving distilled water production using the proposed geometrical design of absorbers.
The distillers discussed in this current study were constructed from KalsiBoard® board, plywood multiplex board, and Styrofoam with thicknesses of 6, 12, and 50 mm, respectively. The overall dimensions of the distillers were 1136 mm × 936 mm × 574 mm, while the inner space was 1000 mm × 800 mm × 571 mm. On the inner bottom of the distillers was placed a Galvalume plate with a thickness of 0.4 mm. Each basin was covered in commercial transparent glass with a thickness of 3 mm, installed at an angle of 19.7°. The inner surfaces of the distillers were painted black to enhance the absorption of solar radiation. Condensed water flowed down and along the glass cover and finally reached the bottle. The bottle with the water was then balanced every hour to measure the increment in the distilled water. All temperatures were measured using K-type thermocouples calibrated against a stainless steel RTD probe in a temperature-constant bath. The accuracy of the thermocouple was ±0.2 °C, as obtained in the calibration. Meanwhile, the solar power was measured directly using LUTRON power meter SPM-1116SD with a 5% reading accuracy and a resolution of 0.1 W/m2. The experimental conditions and accuracy are presented in Table 1.
The data were then analyzed using heat and mass transfer theory. To determine the heat or energy, Equation (1) [19], expressed as follows, was employed.
q i n = τ A I T ,
where qin is the heat coming into the absorber (W) and τ represents the transmissivity, which is equal to 0.88, as suggested by Idi and De [20]. A denotes the aperture area (m2), and IT represents the solar power (W/m2). Other dependent variables investigated were the heat used for heating the seawater and the heat used for evaporating the seawater.
The heat used for heating the seawater is known as sensible heat. The heat increases the temperature of seawater from the initial temperature to the final temperature, excluding the enthalpy of evaporation. Hence, in this process the heat depends on the final and initial temperatures and the fluid property cp (specific heat). The heat can be estimated using an equation expressed as follows [21,22]:
q s = m c p ( T f T i ) / t ,
where qs is the sensible heat (W); m is the mass of the seawater (kg); Tf and Ti are the final and initial temperatures (°C), respectively; and t is the running time of the experiment (s).
The heat used for evaporating the water is known as latent heat. The heat can be predicted using an equation expressed as follows [21,22]:
q l = m l h f g / t ,
where ql is the latent heat (W), hfg is the evaporation energy (J/kg) that can be obtained in a water property table [23], and ml is the mass of the distilled water (kg) and is measured directly in this study. From Equation (1) through (3), the efficiency of the distiller can be determined and is expressed as follows [21,22]:
q u = q s + q l ,
η = q u q i n = q i n q l o s s q i n = 1 q l o s s q i n ,
where qu is the useful heat (W), η is the distiller efficiency, and qloss is the heat loss from the distiller to the ambient (W). However, an equation was proposed by Rajaseenivasan and Murugavel [24] to predict the distilled water mass. The equation was also used by Kalaivani [25] and Gnanarajand and Velmurugan [26]. In this study, the following equations [24] were used for comparison only.
P w   =   exp [ 25.317     5144 ( T w   +   273 ) ] ,
P g   =   exp [ 25.317     5144 ( T g   +   273 ) ] ,
h c   =   0.884 [ ( T w     T g )   +   ( P w     P g ) ( T w   +   273 ) 268.9 × 10 3     P w ] 1 / 3 ,
h e   =   16.273   ×   10 3   ×   h c [ P w     P g T w     T g ] ,
Q e   =   h e ( T w     T g ) ,
V e   =   Q e   ×   3600 h f g ,
where Pw is the saturated pressure for water (Pa), Pg is the saturated pressure for the vapor inside the distiller (Pa), Tw is the seawater temperature (°C), and Tg is the vapor temperature (°C). hc represents the convective heat transfer coefficient (J/kg·K) and he indicates the evaporative heat transfer coefficient (J/kg·K). Qe is the evaporative heat transfer (W) and Ve is the volume of the hourly distilled water per square meter (mL/m2).
To compare the results with the existing correlation, a formula proposed by Coleman and Steele [27] was used. The formula is MAE (mean absolute error), which can be expressed as:
MAE   =   1 N j = 1 N | V e exp , j V e pred , j | ,
where N is the number of data and Veexp and Vepred are the experimental and prediction of the volume of the hourly distilled water per square meter, respectively.

3. Results and Discussion

Solar power and heat input are presented first to elucidate the experimental results and for comparison with the prediction of distilled water production.

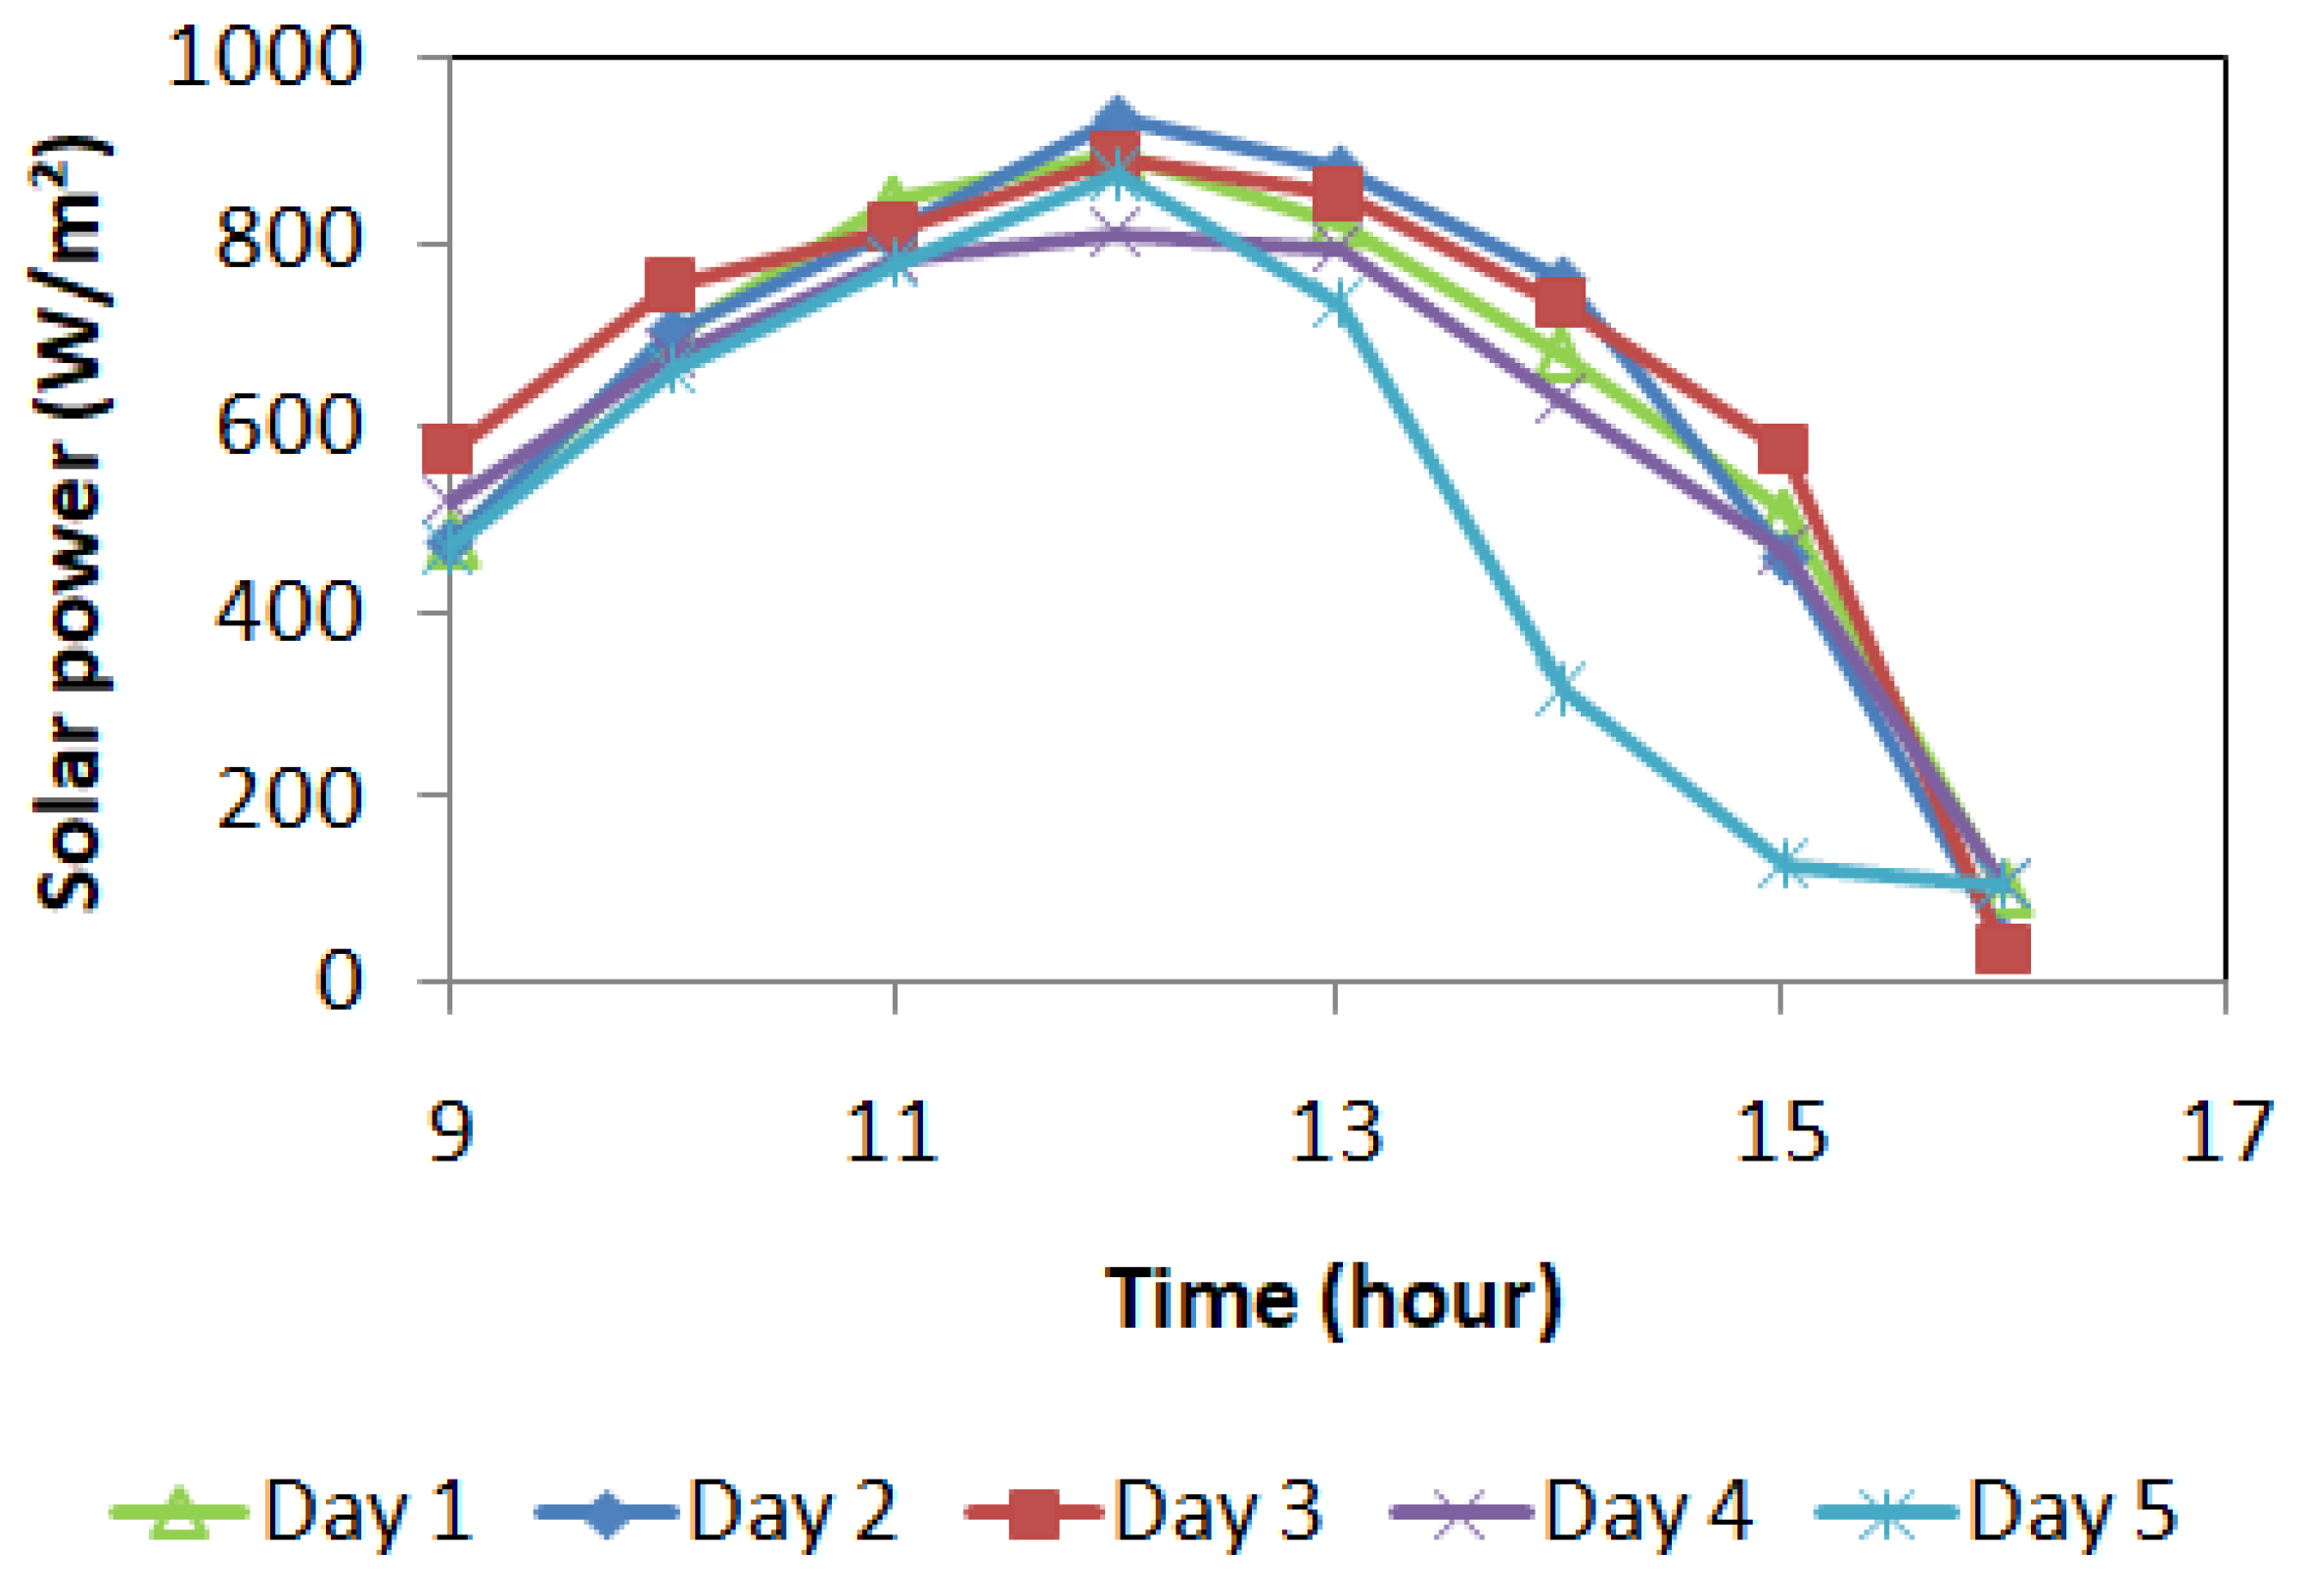
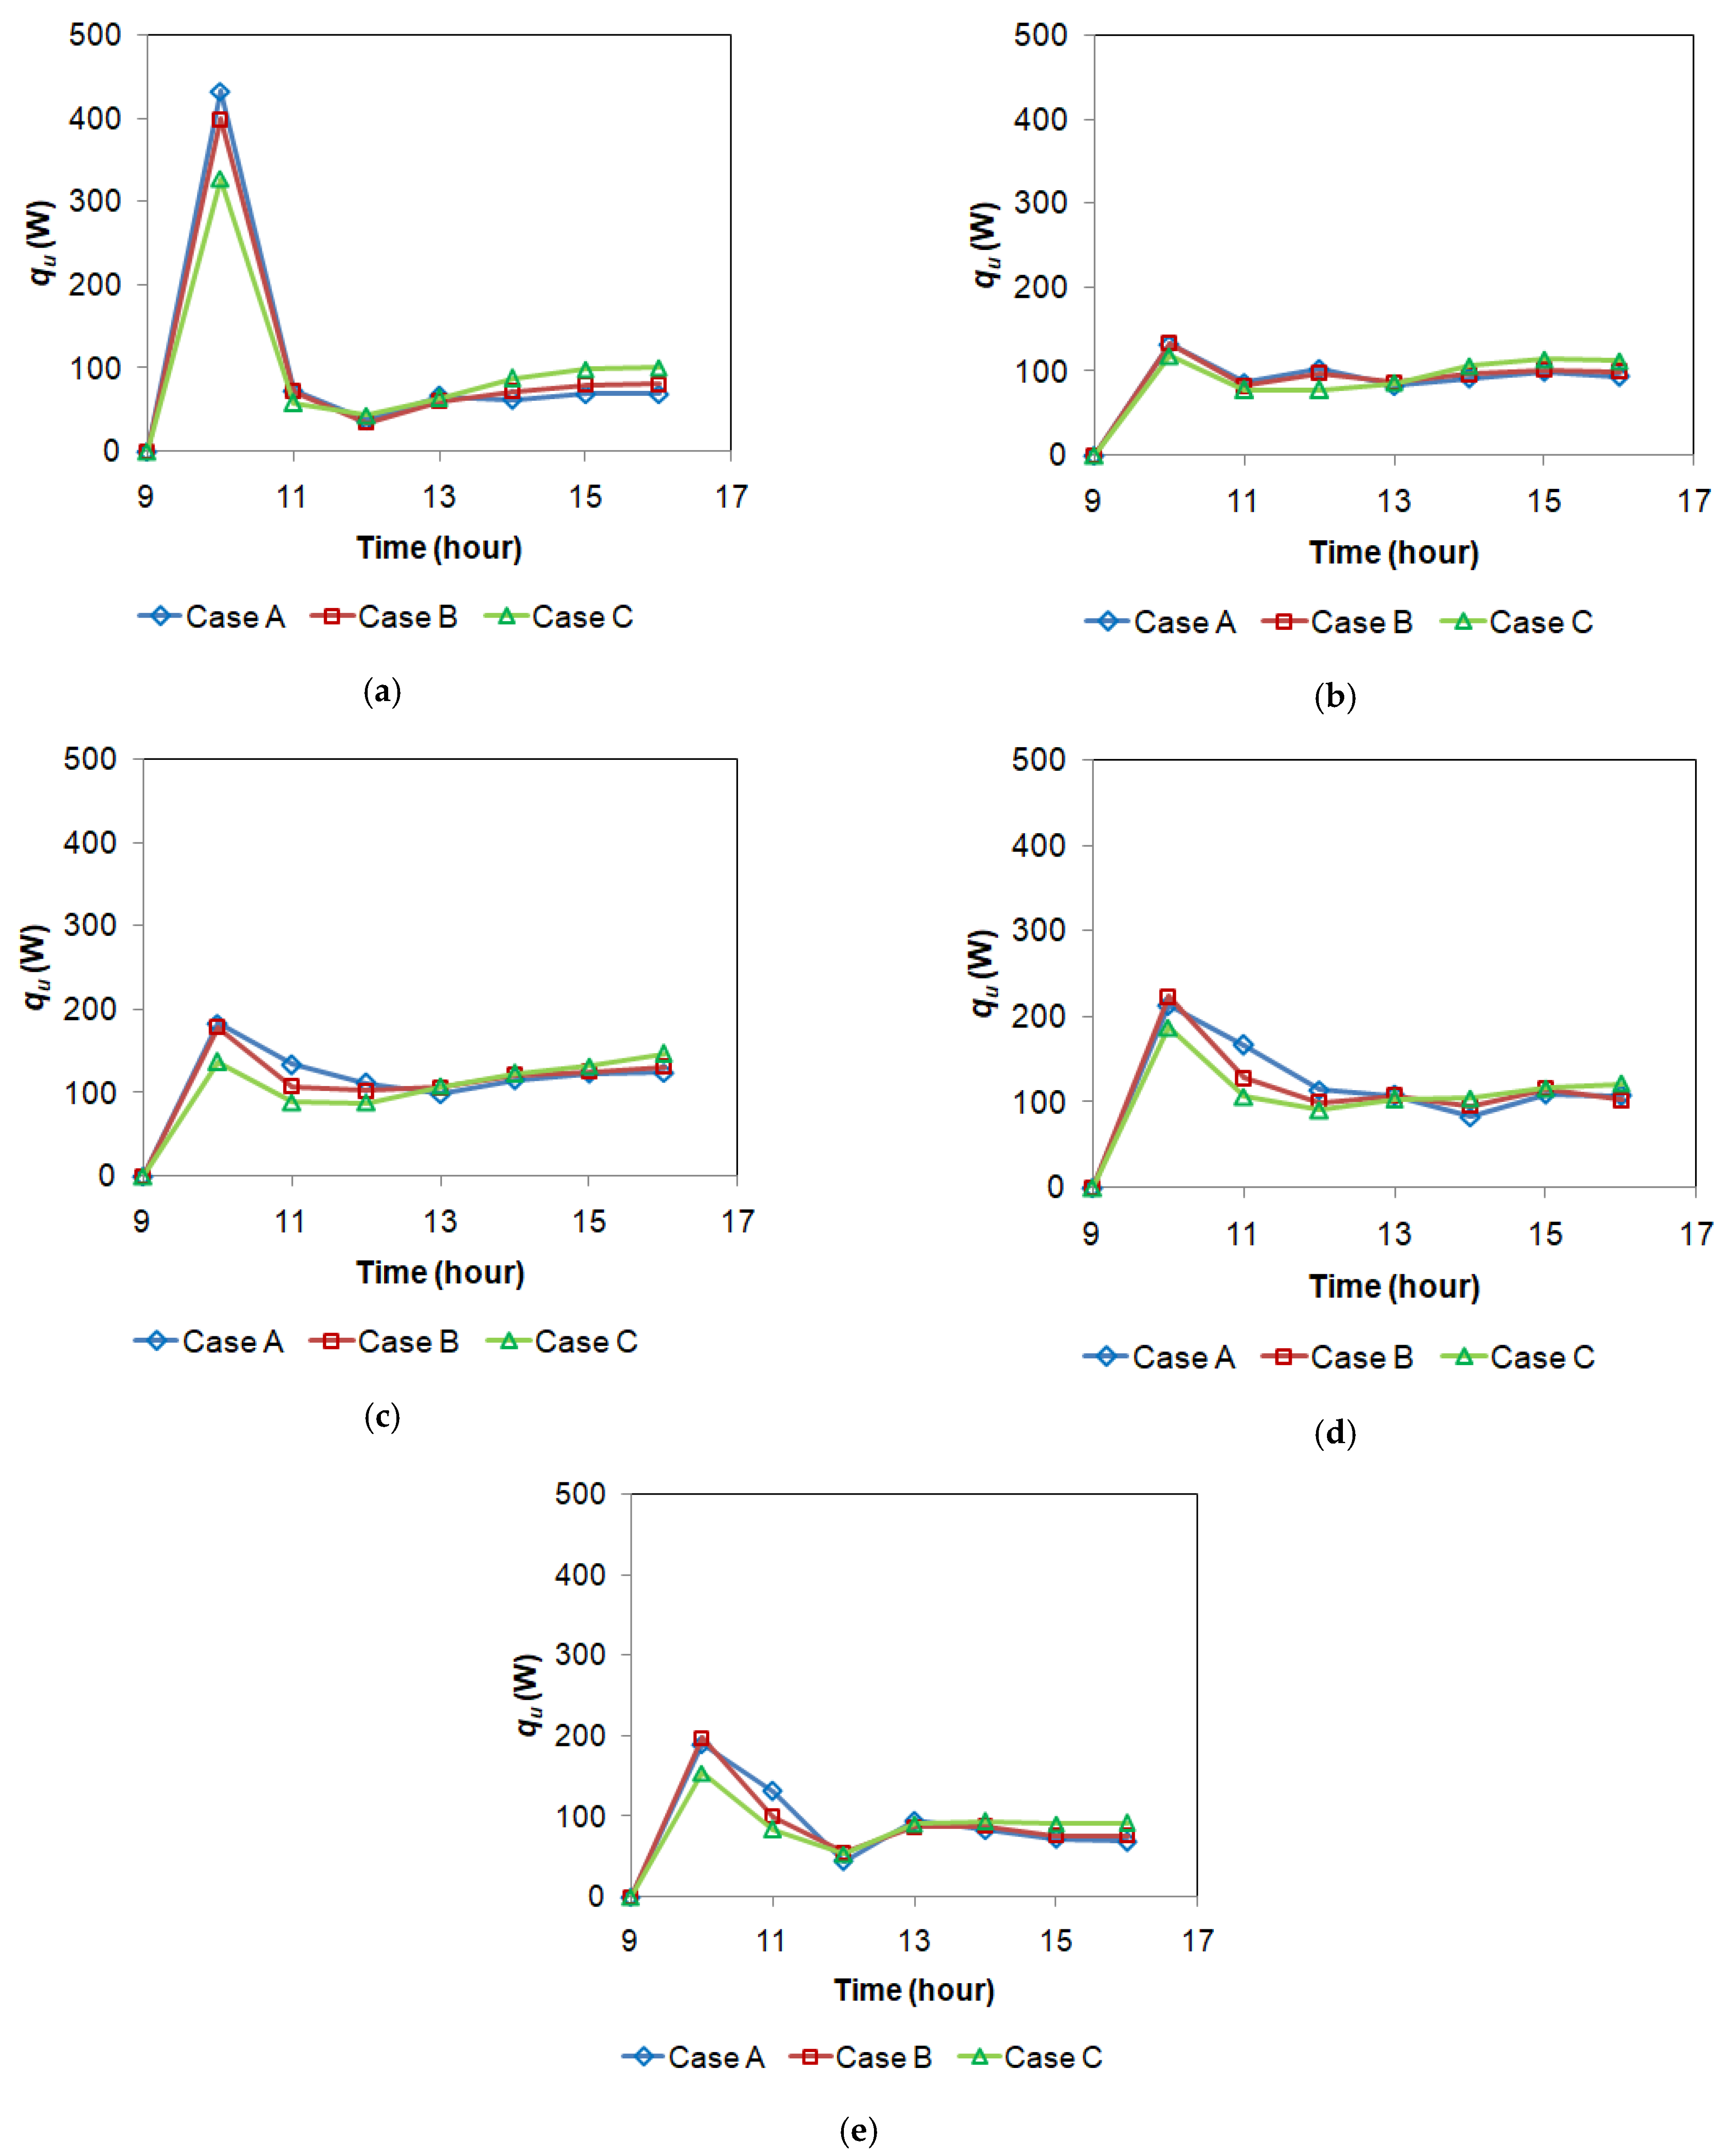
3.1. Experimental Solar Power
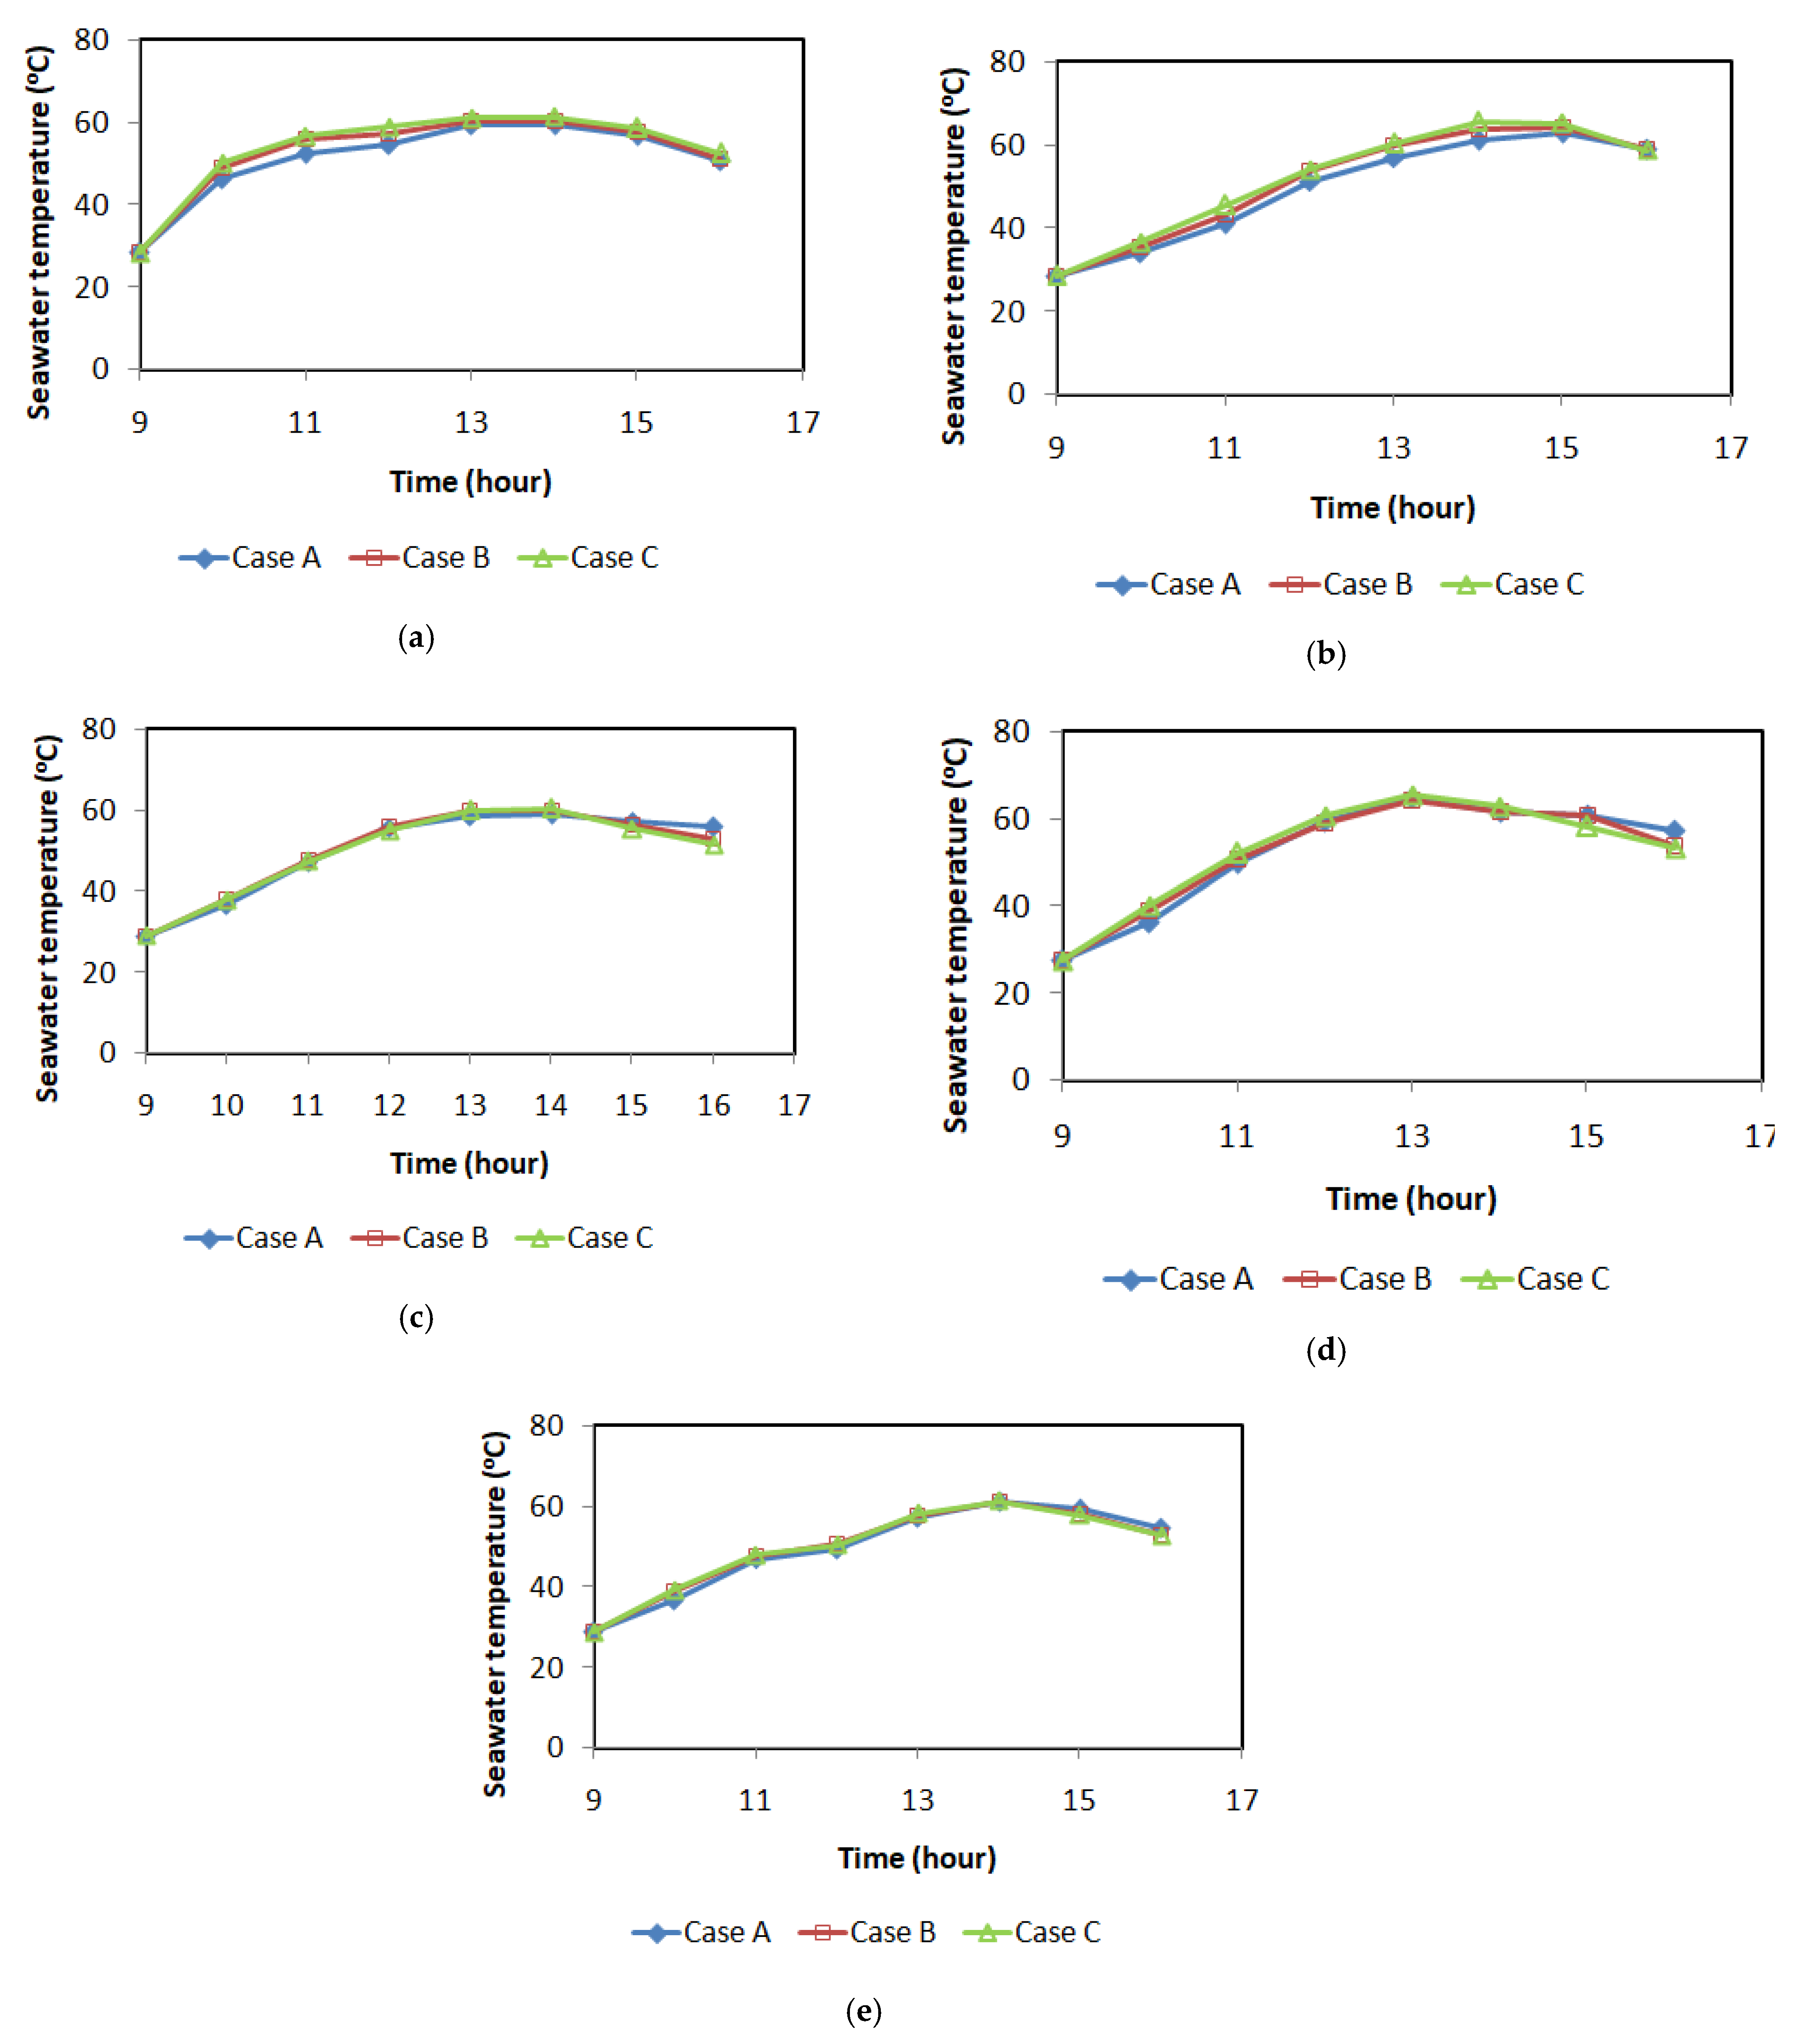
Figure 3 indicates the solar power, while Figure 4 shows the heat input to the solar distillers. As shown in Figure 3, in general the solar power recorded increased with the observation time until it reached a maximum value at around midnoon, then decreased. This was due to its dependency on the sun; in the afternoon, the sun went down continuously, meaning that the solar power also decreased. The trends of heat input (qin), as indicated in Figure 4, were similar to the solar power trends because the heat input was calculated using Equation (1). This was also found by Badran [2], Aburideh et al. [10], and our previous study [1]. The solar power and the heat input on the same day were the same for the three different distillers as they were tested at the same location and time, and the aperture areas of the three distillers were also the same. On day five, the trend was different because on that day at 14.00 and 15.00 o’clock the sun was covered by clouds; therefore, the pyranometer could not record the solar power.

3.2. Temperature

Due to the qin, the absorber and seawater temperatures changed during the observation period. They increased with the observation time, reached a maximum value, and then declined continuously. The temperature trend was similar to the solar power trend, although it was not sensitive to the change in solar power. Figure 4 and Figure 5 report the absorber and seawater temperatures, respectively.
In general, the trends of the temperatures increased from 9.00 o’clock to 14.00 o’clock, then decreased continually. From 09.00 o’clock to 14.00 o’clock, the temperature of Case A was always lower than the other cases; however, after 14.00 o’clock, Case A’s temperature was higher. The differences were more prominent at 16.00 o’clock. This phenomenon was due to the amount of seawater inside the distillers. Owing to the number of fins, the seawater volume for Case A was less than that of Cases B and C. At larger amounts of seawater, the absorber temperature needed time to increase and decrease; therefore, before 14.00 o’clock the absorber temperature of Case A was lower but after 14.00 o’clock it was higher than in the other cases. This trend was also consistent with our previous results [1].
The trend of seawater temperatures was similar to that of absorber temperatures. The seawater temperatures increased and reached the maximum value at around 14.00 o’clock, before declining fairly. The trend phenomena were due to the solar power behavior, as shown in Figure 3. It increased in the morning and then decreased in the afternoon. Again, at 16.00 o’clock the seawater temperature for Case A was higher than the other temperatures. The reason for this has been described in the above paragraph.

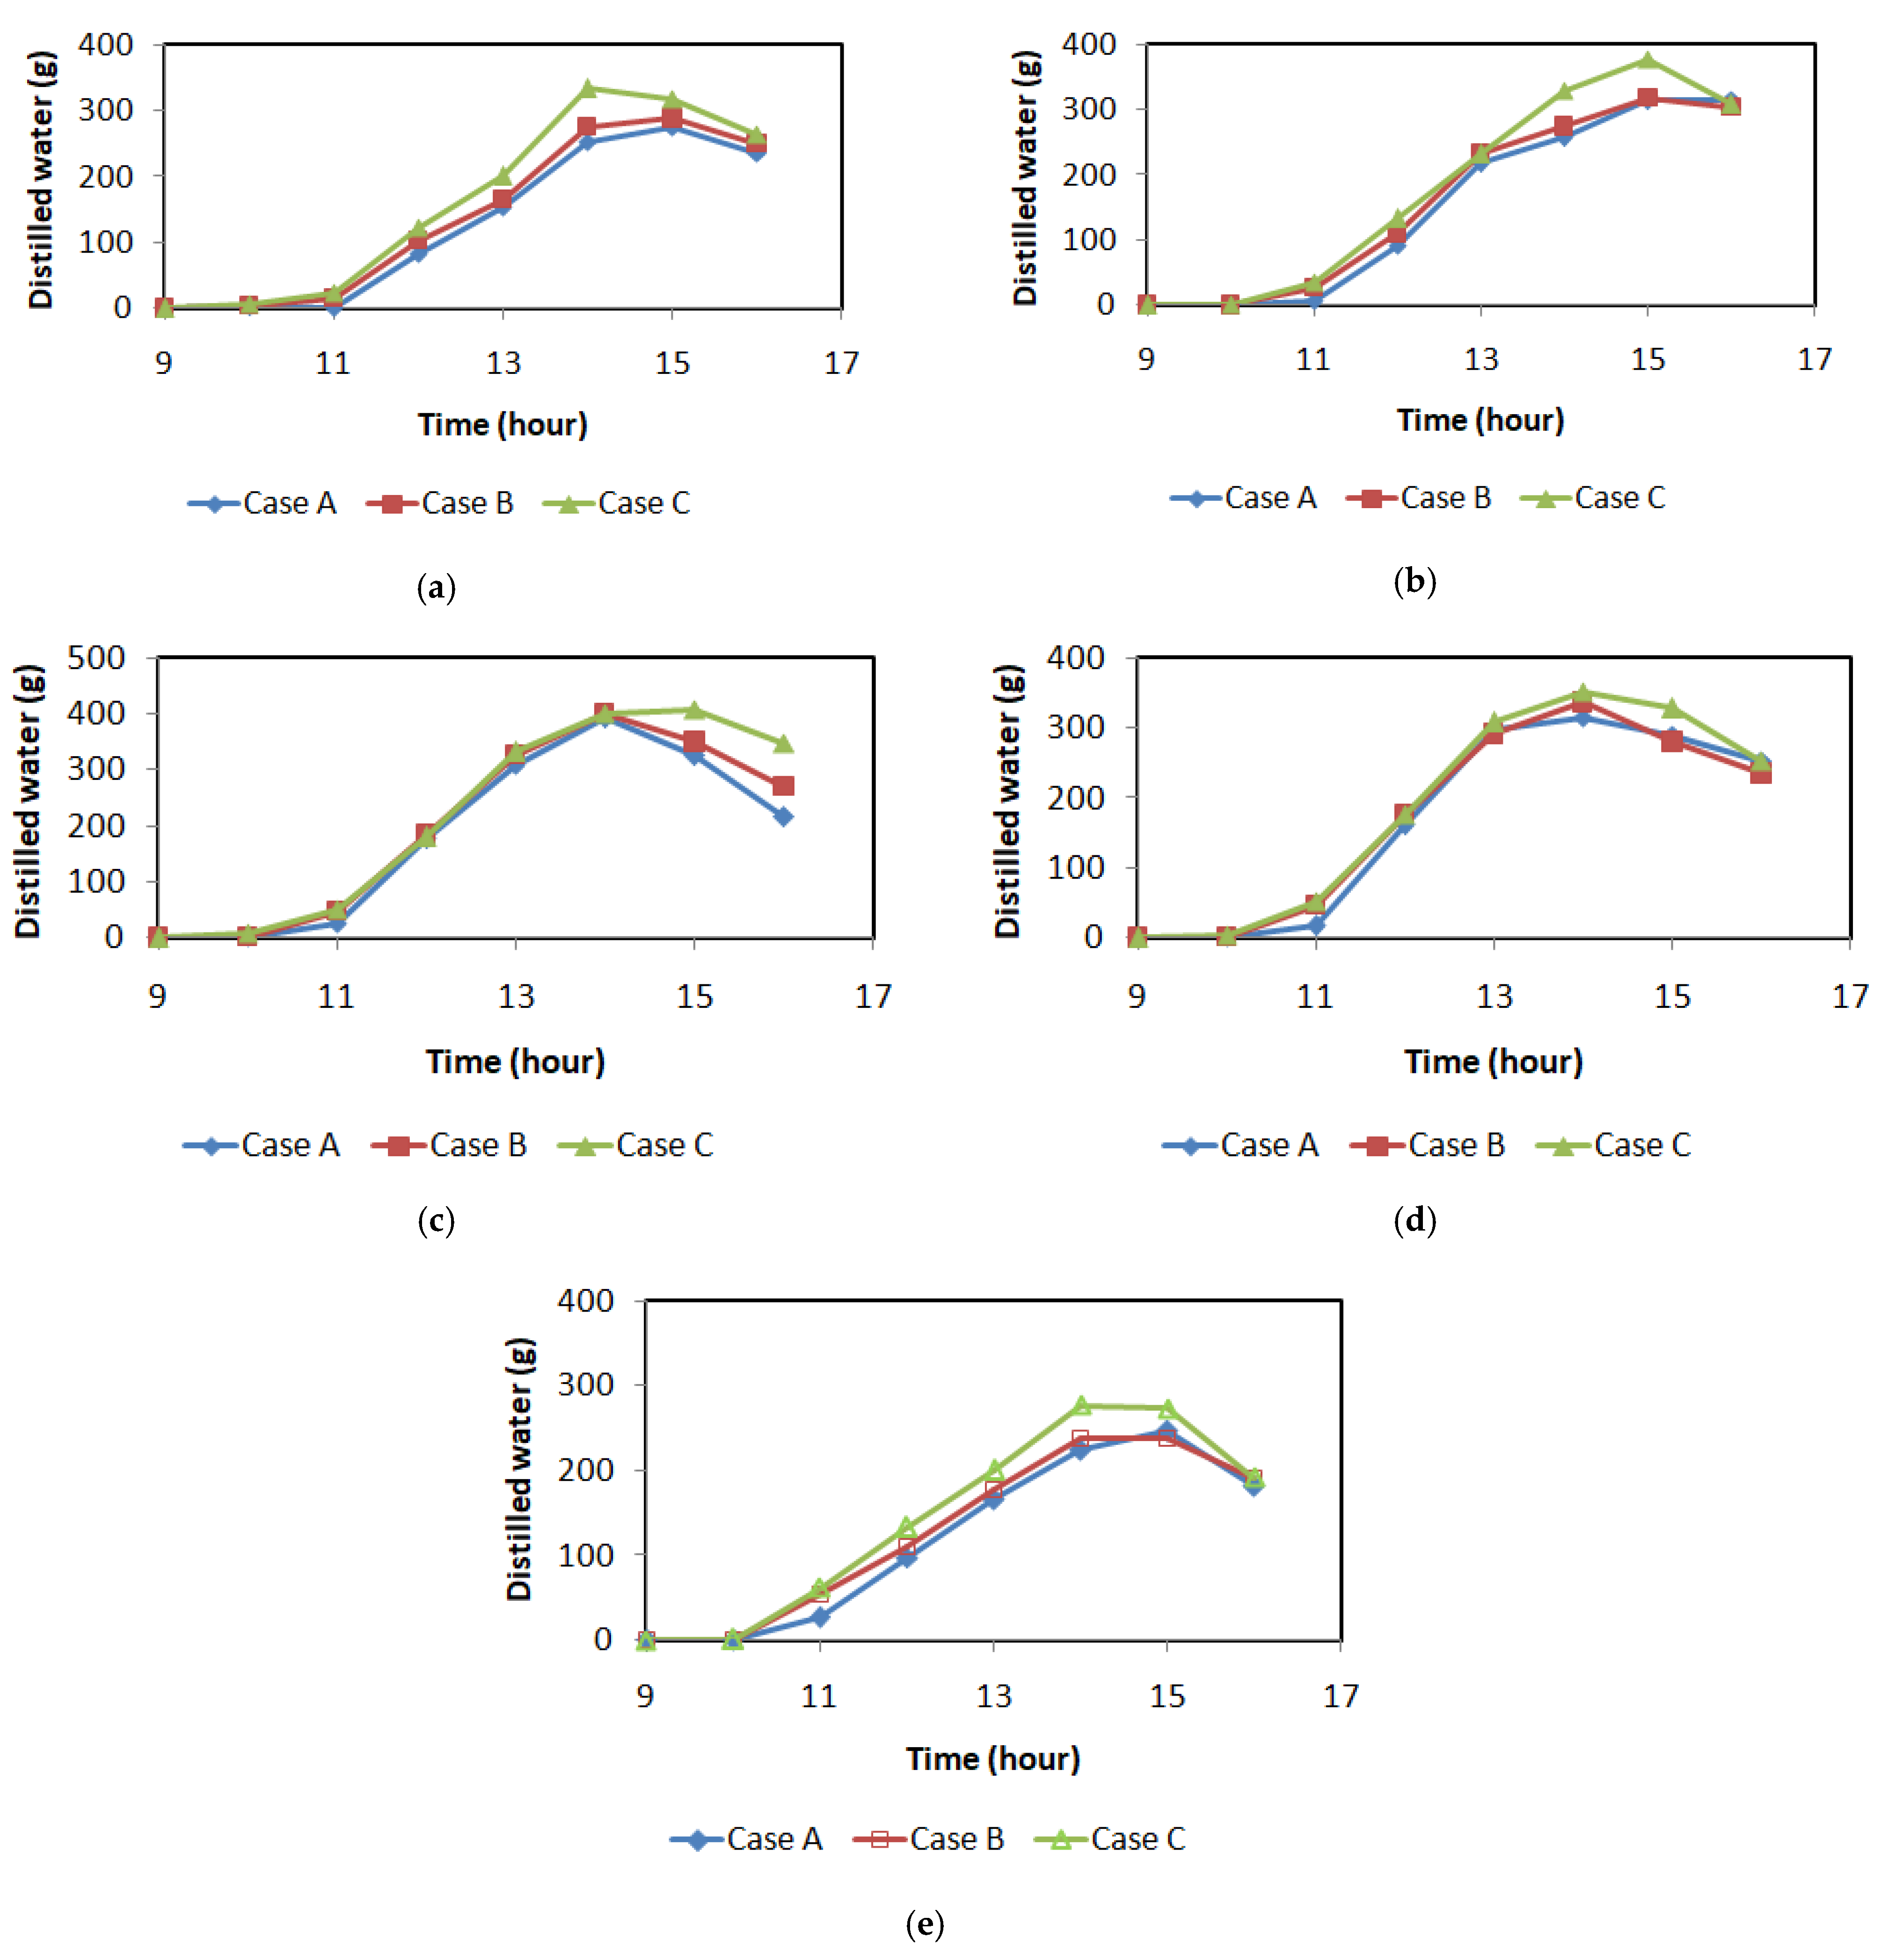
3.3. Distilled Water Production

Another very important parameter is the amount of water distilled. The amount of distilled water produced was measured directly and the measurement results are presented in Figure 6. Figure 6 shows the distilled water production, which increased with time; however, the amount of distilled water produced at every hour was not the same. This was affected by environmental conditions, such as solar power. However, the amount of distilled water produced was larger compared to that found by Cappelletti [9], Aburideh et al. [10], and Kaviti et al. [14]. This trend showed that, for the three distillers, Case C could produce the largest amount of distilled water. The average yield of Case A is 1.185 L/d, the average yield of Case B is 1.264 L/d, and the average yield of Case C is 1.404 L/d. The results of Case C are about 18.5% higher than that of Case A. Hence, in terms of production, Figure 6 indicates that Case C has the highest performance in these experimental conditions and improves the average production compared to our previous work [1]. Nevertheless, the water was not able to be consumed directly. Additional processes should be implemented for the water in order to make it to be safe to drink.

3.4. Sensible and Latent Heat
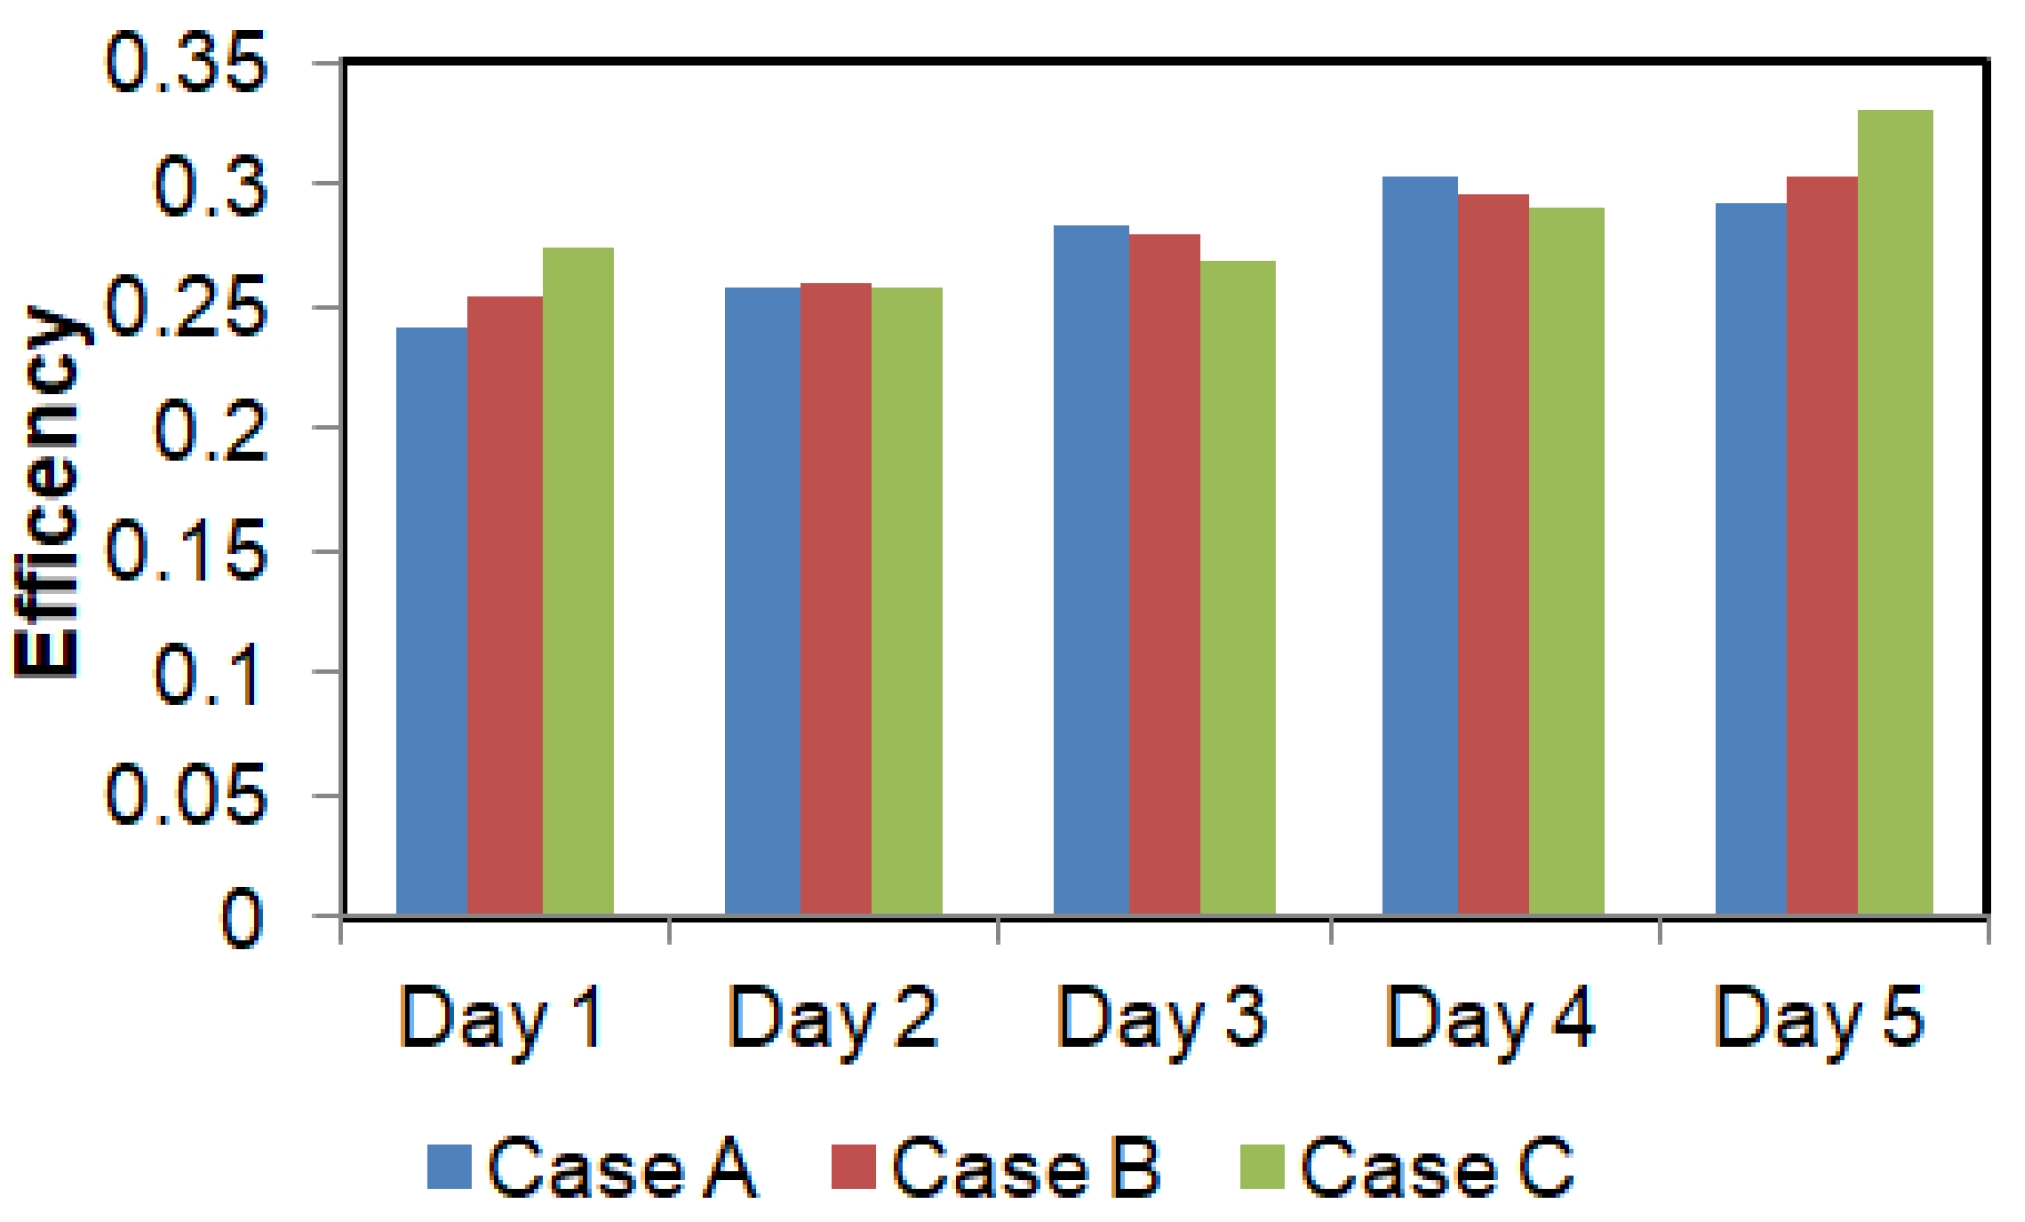
Parameters of sensible and latent heat have been described in the above paragraphs (Section 2, experimental setup, Equations (2)–(4)); the total useful heat that comprises sensible and latent heat, and is noted by qu, is presented in Figure 7.
Figure 7 shows the useful heat which increased drastically from zero at 09.00 o’clock to hundreds at 10.00 o’clock. After that, the useful heat was constant. However, the interesting phenomenon was the change in useful heat. Before 13.00 o’clock, the useful heat for Cases B and C were lower than that of Case A, but after 13.00 o’clock, the useful heat of Case A was lower than that of the two other cases. This happened because there was a change in sensible and latent heat. Before 13.00 o’clock, the heat was dominated by the sensible heat to increase the seawater temperature. However, the volume of seawater for Case A was larger due to the absence of fins. Therefore, the useful heat for Case A was higher. On the other hand, the latent heat was dominant after 13.00 o’clock. Due to the fins, the seawater in Cases B and C was at a higher temperature than that in Case A, and then a high rate of evaporation occurred in Cases B and C. Increasing the fin number raised the latent heat; consequently, the useful heat for Case C was higher. Nevertheless, this phenomenon was not revealed in Badran [2], Aburideh et al. [10], or Gnanarajand and Velmurugan [26].

3.5. Efficiency

Figure 8 presents the efficiency calculated based on the experimental data. The efficiency was calculated using Equation (5). For five days, the efficiencies were almost the same—they were between 24% and 33%. The efficiencies were still low, but this phenomenon was also found by previous published reports [1,2,10,26]. However, this study used cheap material and the distillers were also simple. Hence, the distillers still need further improvements, although they provided slightly better results. To increase the efficiency, the number of fins should be raised—for example, to 25 or 50 fins.
The efficiency trend shown in Figure 8 for Case C shows that the efficiency is high on days one and five, while the efficiency is even on day two, but the efficiency is low on days three and four. This is because when the weather is not constantly sunny the dominant heat is sensible heat, which is only for heating the water in the distiller. Meanwhile, the water mass in the distiller in Case A is larger; hence, the efficiency is higher on days three and four. However, when the sun is consistently bright, then after 13 o’clock the phenomenon is dominated by latent heat, leading to a larger amount of generated steam. The efficiency is affected by the latent heat. It is clear that the water production becomes higher which incidentally has a greater latent heat, so the efficiency will be greater on day five.
As shown in Figure 7, qu consists of both sensible heat and latent heat. In the morning, the sensible heat becomes dominant; therefore, qu in Case C is small. Furthermore, latent heat becomes dominant after 13 o’clock, increasing qu in Case C. Efficiency is influenced by qu; hence, after 13 o’clock, the efficiency of Case C reached the highest on day five (Figure 7e). However, on days three and four, the total qu for Case C is lower, resulting in a lower efficiency (Figure 7c,d). The total qu is very close for all cases, so the efficiency appears almost equal for all cases (Figure 7b). Generally, the situation is dominated by sensible heat even though there is more steam for Case C. The latent heat is still inferior to sensible heat, leading to higher qu and efficiency. Sensible heat depends on the mass of seawater in the distiller, of which Case A has the most due to the lack of fins, resulting in a higher sensible heat.

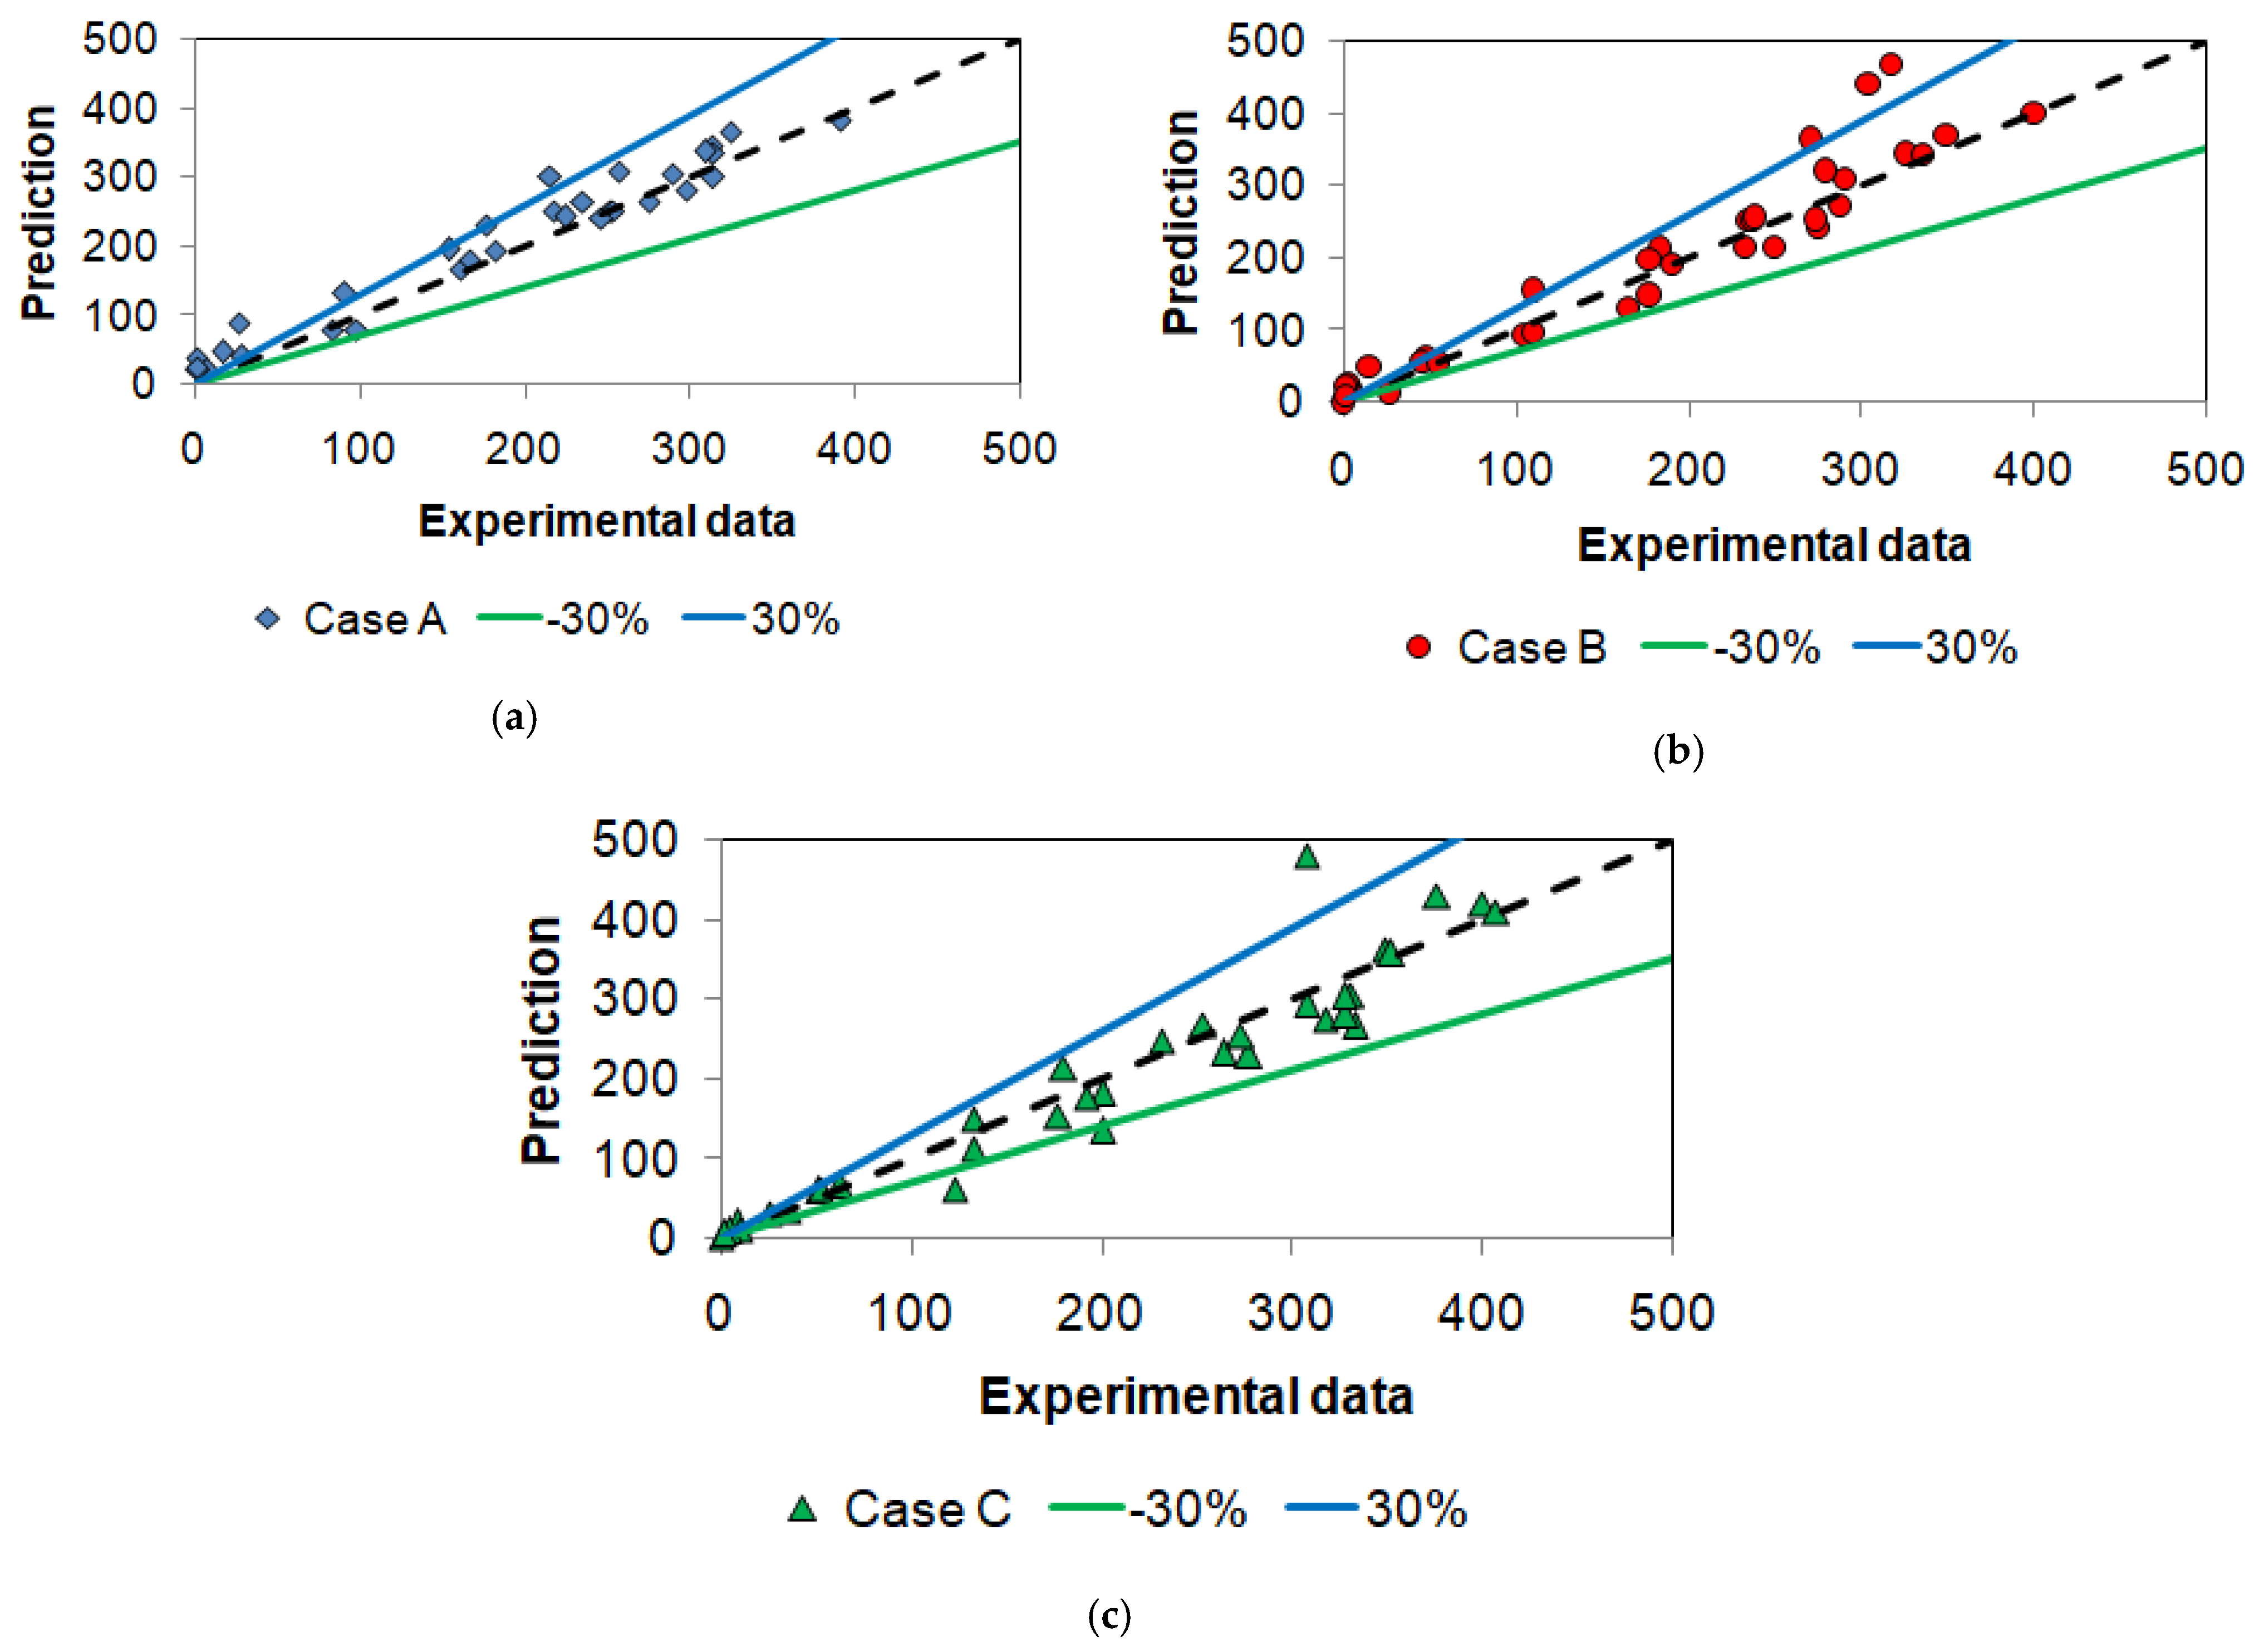
3.6. Comparison with Prediction

The calculation prediction used in this study was based on the equations proposed by Rajaseenivasan and Murugavel [24] (Equations (6)–(11)). The equations can accurately predict the hourly distilled water production with an MAE of 25 for Case A, 28 for Case B, and 26 for Case C. MAE is estimated using Equation (12) in the experimental setup section.
When the experimental results are plotted with the predictions, almost all data are in the range of −30% and +30% (Figure 9). The horizontal axis is the experimental data, while the vertical axis is the prediction data obtained using Equation (11). The data were in reasonable agreement with the established correlations.

4. Conclusions

Experiments to investigate the different performances of the proposed three low-cost distillers were carried out. Comparative analyses of distillers with and without fins were carried out in climate conditions in a remote tropical region. The comparison of experimental distilled water productions to the existing correlation was also conducted. From the experiment results and analyses, some findings can be noted: Indonesia as a tropical country has the opportunity to use solar power to produce fresh water from seawater. Yields from the distiller with the fin configuration were to be found higher compared to those obtained using a flat distiller. The average yields obtained were 1.185 L/d, 1.264 L/d, and 1.404 L/d from the distiller without fins, distiller with 10 fins, and distiller with 15 fins, respectively. Yield increases of 18.5% and 7% were obtained by distillers with 15 fins and 10 fins, respectively, compared to the flat distiller. These findings can be implemented to solve water shortage problems in the dry season, especially for people who live near beaches or on remote small islands.

Author Contributions

Conceptualization, M. and A.T.W.; methodology, M. and I.M.A.S.; validation, M. and A.T.W.; formal analysis, M. and I.M.A.S.; investigation, M. and I.M.A.S.; resources, M. and A.T.W.; data curation, M. and I.M.A.S.; writing—original draft preparation, M. and A.T.W.; writing—review and editing, M., A.T.W., A.P.S., and M.A.; visualization, M. and I.M.A.S.; supervision, A.P.S., and M.A.; project administration, M. and A.T.W.; funding acquisition, A.T.W. and M.A. All authors have read and agreed to the published version of the manuscript.

Funding

This research was supported by Sebelas Maret University under the KI-UNS scheme with Grant Number 260/UN27.22/HK.07.00/2021 and JSPS KAKENHI Grant Number JP19K04211.

Data Availability Statement

Not applicable. The study did not report any data.

Acknowledgments

Facilities provided by Mataram University and the Institute of Research and Community Service of Sebelas Maret University are acknowledged.

Conflicts of Interest

The authors declare no conflict of interest.

References

  1. Mirmanto, M.; Wirawan, M.; Sayoga, I.M.A.; Syahrul, S.; Faisal, M.; Abdullah, A. Effect of absorber types of conventional distillers on the amount of distilled water production. Front. Heat Mass Transf. 2019, 13, 1–7. [Google Scholar] [CrossRef]
  2. Badran, O.O. Experimental study of the enhancement parameters on a single slope solar still productivity. Desalination 2007, 209, 136–143. [Google Scholar] [CrossRef]
  3. Mahallawy, N.E.; Aref, F.A.; Abd-Elhady, M.S. Effect of metallic reflectors and surface characteristics on the productivity rate of water desalination systems. Therm. Sci. Eng. Prog. 2020, 17, 100489. [Google Scholar] [CrossRef]
  4. Alnaimat, F.; Klausner, J.F. Enhanced performance of solar diffusion driven desalination. ASME J. Therm. Sci. Eng. Appl. 2013, 5, 041001. [Google Scholar] [CrossRef]
  5. Leijon, J.; Forslund, J.; Thomas, K.; Boström, C. Marine current energy converters to power a reverse osmosis desalination plant. Energies 2018, 11, 2880. [Google Scholar] [CrossRef] [Green Version]
  6. Lacroix, C.; Muzet, M.P.; Stitou, D. Dynamic modeling and preliminary performance analysis of a new solar thermal reverse osmosis desalination process. Energies 2019, 12, 4015. [Google Scholar] [CrossRef] [Green Version]
  7. Takeshita, S.; Farzaneh, H.; Dashti, M. Life-cycle assessment of the waste water treatment technologies in Indonesia’s fish-processing industry. Energies 2020, 13, 6591. [Google Scholar] [CrossRef]
  8. Manchanda, H.; Kumar, M. Study of water desalination techniques and a review on active solar distillation methods. Environ. Prog. Sustain. Energy 2017, 37, 444–464. [Google Scholar] [CrossRef]
  9. Cappelletti, G.M. An experiment with a plastic solar still. Desalination 2002, 142, 221–227. [Google Scholar] [CrossRef]
  10. Aburideh, H.; Deliou, A.; Abbad, B.; Alaoui, F.; Tassalit, D.; Tigrine, Z. An experimental study of a solar still: Application on the sea water desalination of Fouka. Procedia Eng. 2012, 33, 475–484. [Google Scholar] [CrossRef] [Green Version]
  11. Zeroual, M.; Bouguettai, H.; Bechki, D.; Boughali, S.; Bouchekima, B.; Mahcene, H. Experimental investigation on a double-slope solar still with partially cooled condenser in the region of Ouargla (Algeria). Energy Procedia 2011, 6, 736–742. [Google Scholar] [CrossRef] [Green Version]
  12. Sifat, A.I.; Uddin, M.M. Water distillation method using solar power. In Proceedings of the International Conference on Mechanical Engineering and Renewable Energy 2015 (ICMERE2015), Chittagong, Bangladesh, 26–29 November 2015. [Google Scholar]
  13. Panchal, H.; Mevada, D.; Sadasivuni, K.K.; Essa, F.A.; Shanmugan, S.; Khalid, M. Experimental and water quality analysis of solar stills with vertical and inclined fins. Groundw. Sustain. Dev. 2020, 11, 100410. [Google Scholar] [CrossRef]
  14. Kaviti, A.K.; Naike, V.R.; Ram, A.S.; Kumari, A.A. Energy and exergy analysis of double slope solar still with aluminium truncated conic fins. Mater. Today Proc. 2021, 45, 5387–5394. [Google Scholar] [CrossRef]
  15. Ambarita, H. Study on the performance of natural vacuum desalination system using low grade heat source. Case Stud. Therm. Eng. 2016, 8, 346–358. [Google Scholar] [CrossRef] [Green Version]
  16. Kateshia, J.; Lakhera, V.J. Analysis of solar still integrated with phase change material and pin fins as absorbing material. J. Energy Storage 2021, 35, 102292. [Google Scholar] [CrossRef]
  17. Mohaisen, H.S.; Esfahani, J.A.; Ayani, M.B. Improvement in the performance and cost of passive solar stills using a finned wall/build in condenser: An experimental study. Renew. Energy 2021, 168, 170–180. [Google Scholar] [CrossRef]
  18. Abdelgaied, M.; Zakaria, Y.; Kabeel, A.E.; Essa, F.A. Improving the tubular still performance using square and circular hollow fins with phase change materials. J. Energy Storage 2021, 38, 102564. [Google Scholar] [CrossRef]
  19. Duffie, J.A.; Beckman, W.A. Solar Engineering of Thermal Processes, 4th ed.; John Wiley & Sons, Inc.: Hoboken, NJ, USA, 2013; ISBN 978-0-470-87366-3. [Google Scholar]
  20. Idi, B.Y.; De, D.K. Transmissivity of the glazing surface of a solar flat plate collector based on the metrological parameters of Yola, Nigeria. J. Am. Sci. 2011, 7, 639–643. [Google Scholar]
  21. Holman, J.P. Heat Transfer, 9th ed.; McGraw-Hill: Boston, MA, USA, 2002; ISBN 9780071226219. [Google Scholar]
  22. Incropera, F.; DeWitt, D.P.; Bergman, T.L.; Lavine, A.S. Fundamentals of Heat and Mass Transfer, 6th ed.; John Wiley & Sons, Inc.: Hoboken, NJ, USA, 2006; ISBN 978-0470-50196-2. [Google Scholar]
  23. Cengel, Y.A.; Boles, M.A. Thermodynamics: An Engineering Approach, 8th ed.; McGraw Hill Education: New York, NY, USA, 2014; ISBN 978-0073398174. [Google Scholar]
  24. Rajaseenivasan, T.; Murugavel, K.K. Theoretical and experimental investigation on double basin double slope solar still. Desalination 2013, 319, 25–32. [Google Scholar] [CrossRef]
  25. Kalaivani, S. Construction and Performance Analysis of a Single Slope and a Pyramid Cover Solar Still with Storage Media and Electrical Backup. Ph.D. Thesis, Avinashilingam Institute for Home Science and Higher Education for Women, Coimbatore, India, 2014. [Google Scholar]
  26. Gnanaraj, S.J.P.; Velmurugan, V. An experimental study on the efficacy of modifications in enhancing the performance of single basin double slope solar still. Desalination 2019, 467, 12–28. [Google Scholar] [CrossRef]
  27. Coleman, H.W.; Steele, W.G. Experimentation, Validation, and Uncertainty Analysis for Engineers, 3rd ed.; John Wiley & Sons, Inc.: Hoboken, NJ, USA, 2009. [Google Scholar]
Figure 1. Experimental facility: (a) schematic diagram [1] and (b) photograph of the distillers.
Energies 14 04844 g001
Figure 2. Absorbers used in this study: (a) geometry and schematic drawing of flat absorber and absorbers with 10 and 15 fins [1], (b) photograph of flat absorber for Case A, (c) photograph of absorber with 10 fins for Case B, and (d) photograph of absorber with 15 fins for Case B.
Energies 14 04844 g002aEnergies 14 04844 g002b
Figure 3. Solar power recorded for five days in June 2019.
Energies 14 04844 g003
Figure 4. Relationship of absorber temperatures and observation time for five days: (a) Day 1, (b) Day 2, (c) Day 3, (d) Day 4, and (e) Day 5.
Energies 14 04844 g004
Figure 5. Relationship of seawater temperatures and observation time for five days: (a) Day 1, (b) Day 2, (c) Day 3, (d) Day 4, and (e) Day 5.
Energies 14 04844 g005
Figure 6. Amount of distilled water obtained from experiment for five days: (a) Day 1, (b) Day 2, (c) Day 3, (d) Day 4, and (e) Day 5.
Energies 14 04844 g006
Figure 7. Relationship between useful heat and observation time for five days: (a) Day 1, (b) Day 2, (c) Day 3, (d) Day 4, and (e) Day 5.
Energies 14 04844 g007
Figure 8. Relationship between efficiency and observation time for five days.
Energies 14 04844 g008
Figure 9. Relationship comparison with existing correlations proposed by Rajaseenivasan and Murugavel [24] for: (a) Case A, (b) Case B, and (c) Case C.
Energies 14 04844 g009
Table 1. Experimental conditions and accuracy.
ParameterRange of MeasurementAccuracy
Temperature, T27.23–68.33 °C±0.2 °C
Solar power, IT34.24–888.8 W/m2±5%
Heat into absorber, qin34.4–919.7 W±43.4 W
Distilled water mass, ml0–1.727 kg±0.005 kg
Publisher’s Note: MDPI stays neutral with regard to jurisdictional claims in published maps and institutional affiliations.

