Abstract
We studied Phase Change Materials (PCMs), which can be used as thermal energy storage for temperatures lower than 120 °C: They can store both sensible heat from a changing temperature and latent heat from changing the state of a substance. The advantage of storing energy in a PCM is that it can be reused continuously, without the degradation of efficiency. Here, the PCM mixture consists of fructose and xylitol and thus, this PCM can be used to store energy below 120 °C. The calculated Excess Gibbs Energy and activity coefficient of xylitol and fructose decreased as the fraction of xylitol increased. We tested a system, which included an evacuated tubular collector and—fructose mixtures. The system with the PCM maintained a water temperature ~14 °C higher than water without the PCM. This PCM system could store 248 kJ/kg. The xylitol—fructose mixture had a market price ~$US 4.62 $/kg (2018 price), so compared to other PCMs, xylitol-fructose was cheap and store energy efficiently.
1. Introduction
Nowadays, energy storage becomes necessary to human society. Much electric energy is stored in batteries, but there are also many other kinds of energy storage. One of them is thermal energy storage systems, which can be constructed at a lower cost and last longer than a normal battery [1]. Therefore, many researchers have been working on the thermal energy storage. The design of thermal energy storage depends on many factors including the capacity of the system and its storage time. An example is a heat storage system which collects energy in the day and uses it to heat water at night. It helps the balance energy demand during day and nighttime.
There are many types of heat storage, including sensible heat, latent heat, and chemical heat (see Figure 1). In comparison between chemical heat and latent heat, chemical energy materials can store more heat than latent heat materials as shown in Figure 2. However, as chemical heat storage is more complex in practice, it is less common than latent heat storage.
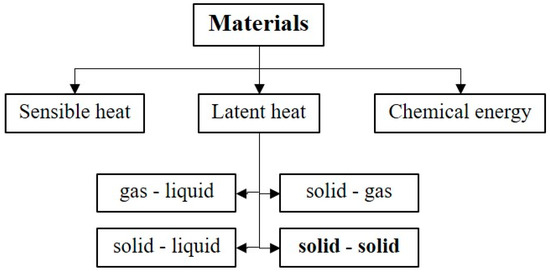
Figure 1.
Classification of energy storage materials.
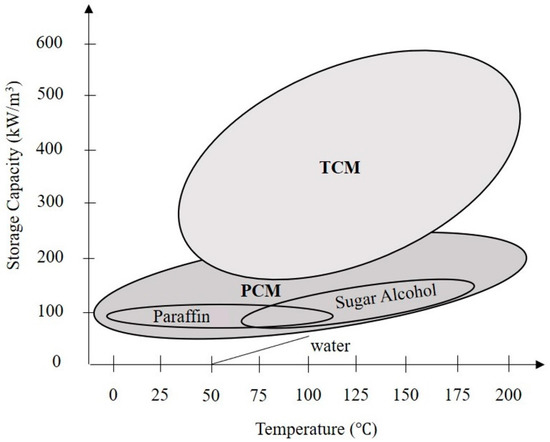
Figure 2.
Stored heat energy vs. temperature range used to change the phases.
Latent heat systems used many different types of materials for example paraffin, non-paraffin, and eutectic compounds, which use phase changes material to store heat. The phase changes material (PCMs) is used in many industries for example photovoltaic electricity systems, waste heat recovery systems, and the space industry. There are five important properties for effective PCMs: Melting point: The PCMs melting point must be near the temperature range of interest, Density: High density materials can potentially store more energy, the volume of a solar collector can be reduced as PCMs density increases, Latent heat of fusion: PCMs with the high latent heat of fusion is desired, Specific heat (Cp): High specific heat of PCMs is favored, and Thermal conductivity (k): PCMs with high thermal conductivity is better than the lower thermal conductivity [2].
Normally, the substance has a constant melting point and a narrow melting range. A melting point for an impure substance is lower and broader than pure substances. Figure 3 shows that point a and b are the melting points of the pure substance A and B, respectively. Point E is the eutectic point where the melting point or the solidification temperature is the lowest, which causes both A and B at any proportion to molten simultaneously [3].
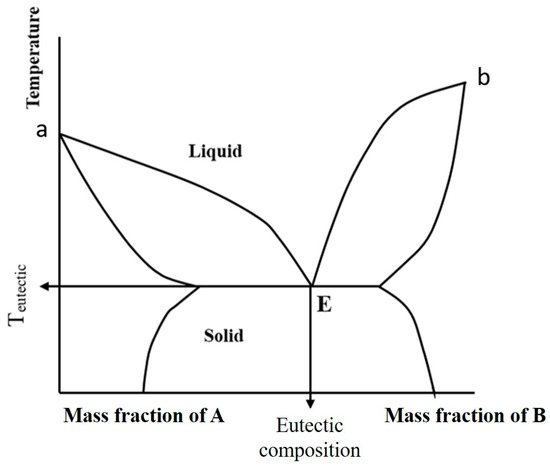
Figure 3.
Phase diagram showing the eutectic point, E, and points a and b–the melting points of pure substances, A and B.
Phase change materials (PCMs) in this work used sugar mixtures as heat storage at the low-temperature range of 0–120 degrees Celsius [4]. Sugar mixtures were used in this research because they had high heat capacities and were environmentally friendly substances. The sugar was fructose (F), and the sugar alcohol was xylitol (X) and the mixtures were labeled X-F.
Thermal energy storage systems can store energy from many sources. Solar energy is a source that can provide abundant energy, in three forms: Solar power to generate electricity, solar energy to produce heat, and solar cooling [5]. We studied solar energy to produce heat. The system converts solar energy from shorter wavelength radiation into longer wave heat energy through a solar collector. The heat has ranges of temperature from 40 to 1500 °C, which depend on the characteristics of the solar collector. We studied evacuated tubular collectors. They had high efficiency in heat transfer and generating heat at a high temperature because it had a vacuum region between the glass tubes, which prevented heat loss. This evacuated tubular collector can produce water temperatures from 90 to 200 °C.
We used an evacuated tubular collector for the storage of the radiation from the sun to heat water. Furthermore, we used PCMs inside the water tank to capture the heat from water in the morning and release it to water at night. PCMs retained heat from the hot water as the sugars changed their state from solid to liquid, absorbing latent heat. The sugar was heated continuously by heat transferred from the water (sensible heat), and when sunlight was no longer available, the PCMs became a heat source for water instead of sunlight by releasing heat as the sugar changed its state from liquid back to solid.
2. Experimental Methods
2.1. Theoretical Considerations
The eutectic temperature is the lowest temperature at which all components of the mixtures melt simultaneously [6]. Different types of sugar are mixed in various proportions. The mixtures were then heated, and we observed the temperature that made the mixture first melted. Then, phase diagrams were plotted from experiment results. Next, the mixtures were tested again with differential scanning calorimetry (DSC), which confirmed the melting temperature of the mixtures. From the DSC thermogram, the onset temperature was the eutectic temperature.
2.2. Material and Properties
In our tests, the sugar fructose and sugar alcohol were xylitol and their properties are shown in Table 1. The fructose (3S,4R,5R)-1,3,4,5,6-Pentahydoxyhexan-2-one) was sourced from Danisco Sweeteners Oy, Kotka, Finland. Xylitol (2R,3r,4S)-Pentane-1,2,3,4,5-pentol) was sourced from Hefei Reachever, Anhui, China.

Table 1.
Properties of sugar mixtures for heat storage at low to medium temperatures.
2.3. Preparation of Sugar Mixtures
Mixtures were heated until they completely melted. During melting, the mixture was stirred in order to make it a homogeneous mixture. After mixing, the mixture was cooled to about 30 °C until it was completely solid. The solid mixture was ground into a powder. For experiments to determine the eutectic temperature, the mixture thus obtained was heated. The melting was observed. The temperature at which the mixture first melted was recorded as the eutectic temperature [11].
2.4. Differential Scanning Calorimetry (DSC)
Previously, in Section 2.2, the lowest melting temperature of the mixture in any proportion was considered the eutectic temperature. We choose the proportion that made the mixture that had the lowest melting point, and confirmed the eutectic temperature of sugar mixtures by differential scanning calorimetry, using an NETZSCH—DSC 204 F1 calorimeter, at a heating rate of 10 degrees/min over a temperature range of 25–140 °C.
2.5. Calculating Properties and Eutectic Temperatures of Sugar Mixtures
The heat of fusion of these substances indicates the ability to store an energy in the substance. To calculate the heat of fusion, we used the rule of mixtures as follows.
Calculate specific heat capacity of sugar mixtures [12]:
Heat of fusion of mixture [13]:
where
: Specific heat capacity (J/kg K);
: Mass (kg);
: Heat of fusion (kJ/kg);
x: Mass fraction.
Solid-Liquid Equilibrium Lines
The solid-liquid equilibrium line of a binary system is based on the Excess Gibbs Energy [7]. The specific heats of the liquid and solid were found to have no influence on the calculation of solid-liquid equilibrium, so the specific heat was ignored [14]. The phase diagram can be modeled by Equations (3) and (4) [15]. These equations described the equilibrium between a liquid mixture and pure solids A and B.
where
Mass fraction of i-compound in liquid phase;
: Enthalpy of fusion of the pure compound (J/g);
Tm: Melting temperature of the pure compound;
T: Temperature of the system.
Differential scanning calorimetry analysis was used to calculate the activity coefficient in Equations (3) and (4). The Excess Gibbs Energy can be calculated by:
where
: Excess Gibbs Energy (kJ/kg);
T: Temperature;
R: Ideal gas constant;
: Activity coefficient of substance j in the liquid phase.
Calculate heat capacity of water
where
: Specific heat capacity of water (J/kg K);
: Mass of water (kg);
: Temperature ().
2.6. Experiment
The evacuated tubular collector used for thermal energy storage is shown in Figure 4. The evacuated tubular collector received solar radiation for heating water in a manifold. The temperature of the water increased to a maximum around noon. The water was released to a stainless tank of which contained PCMs, shown in Figure 5. We measured the temperature of PCMs and water by using thermocouples. For the preparation of the sugar mixture, we used a flat aluminum foil bag (77 mm × 175 mm) shown in Figure 6, to store the sugar mixture. In the experiment, heat was exchanged between sugar and water. The temperature distribution along a horizontal cross-section was measured.
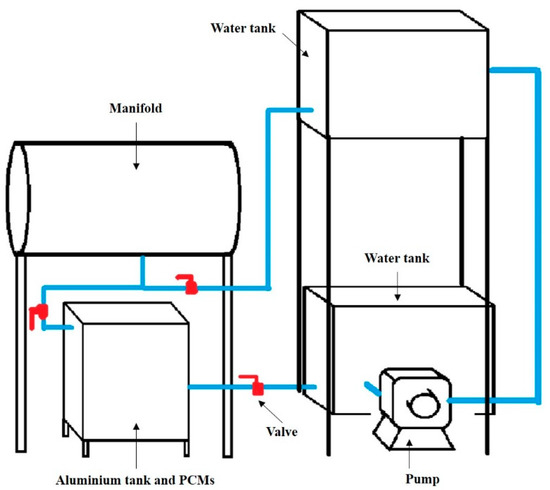
Figure 4.
Thermal energy storage system.
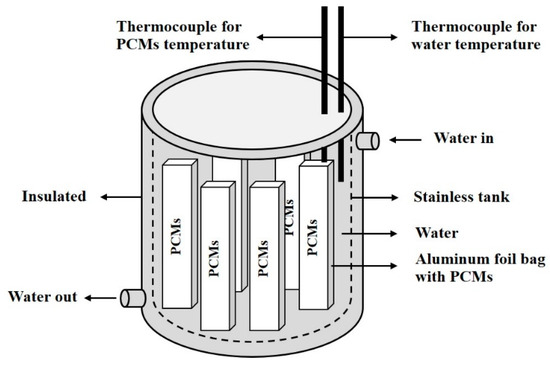
Figure 5.
Thermal energy storage system.
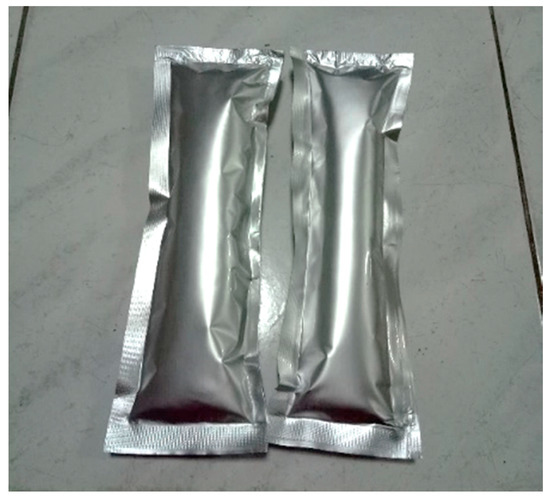
Figure 6.
Aluminum foil bag with PCMs.
The experiment was separated into two parts.
In Part 1, hot water (3 L) at 90 °C, i.e., at the minimum temperature, at which the evacuated tubes can produce heat. The water was poured into the PCM tank, see Figure 6, and we recorded the water and PCM temperatures after 2.5 h.
In Part 2, take PCMs, which were in the liquid phase, in the water tank with water at 30 °C and recorded the temperature of the water and PCMs after 20 min.
3. Result and Discussion
3.1. Properties of Xylitol–Fructose Mixture
We measured the eutectic temperature of the xylitol-fructose mixture in three ways: Direct observation, calorimetry, and calculation.
The first experiment shown in Figure 7 shows that the eutectic temperature of the mixture occurred at a mass fraction ratio of xylitol: fructose of 1:1. The eutectic temperature from the experiment was 79.0 °C.
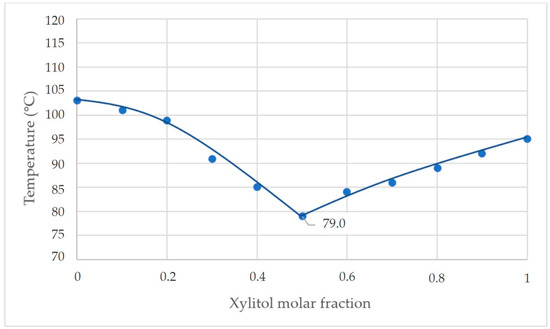
Figure 7.
Phase diagram of the xylitol-fructose system from experiment (a) and from calorimetry (b).
From the DSC curves at various mole fractions, shown in Figure 8, we found that the mole fraction of xylitol was 0.45 and fructose 0.55, at the eutectic point–the lowest temperature that the mixture began to melt. The xylitol-fructose mixtures melted is 76.4 °C.
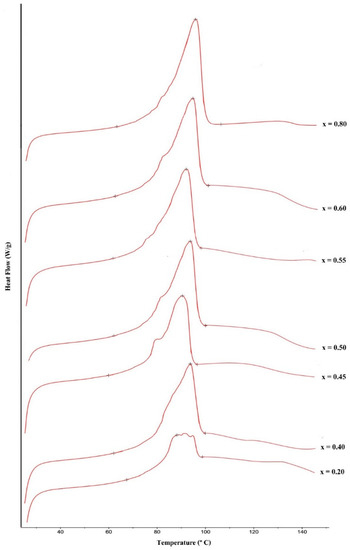
Figure 8.
Thermogram of the xylitol-fructose system, where x was the mole fraction of xylitol.
From the direct observation, the eutectic temperature was 79 °C, but from scanning calorimetry (see Figure 9), the eutectic temperature was 76.4 °C. Therefore, the difference in temperature between the experiment and DSC was 2.6 °C.
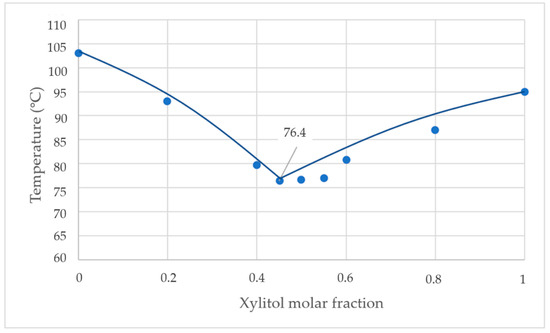
Figure 9.
Phase diagram of the xylitol-fructose from DSC.
DSC thermograms were used to determine the specific heat capacity, heat of fusion, activity coefficient, and excess Gibb’s energy. Firstly, specific heat capacity and heat of fusion were calculated at the eutectic point was 1.21 J/kg K, using Equation (1), and the heat of fusion was 215 kJ/mol from Equation (2). Secondly, the activity coefficients for xylitol and fructose were calculated using Equations (3) and (4). Lastly, the Excess Gibbs Energy for both xylitol and fructose were calculated using Equation (5). Table 2 shows the activity coefficient and excess Gibb’s energy at different xylitol—fructose proportions. For the eutectic point (bold), xylitol, and fructose had activity coefficients of 2.06 and 1.69. Excess Gibbs Energies of xylitol and fructose were 458 and 332 kJ/kg. The activity coefficient of xylitol and fructose in the liquid phase were 2.07 and 1.69.
Table 2.
Activity coefficient and Excess Gibbs Energy.
From Figure 10 and Figure 11, both graphs had similar trends: The Excess Gibbs Energy and activity coefficients decreased as the mole fraction increased. Equations showing the relationship between mass fraction and activity coefficients were:
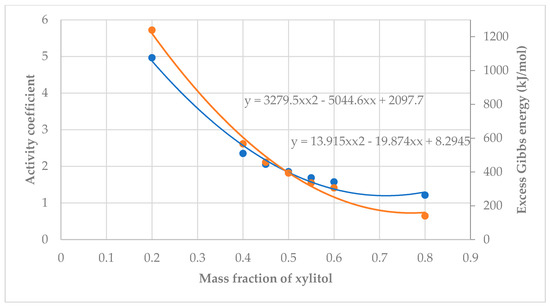
Figure 10.
Relationship between mass fraction of xylitol, activity coefficient (blue), vs. Excess Gibbs Energy (orange).
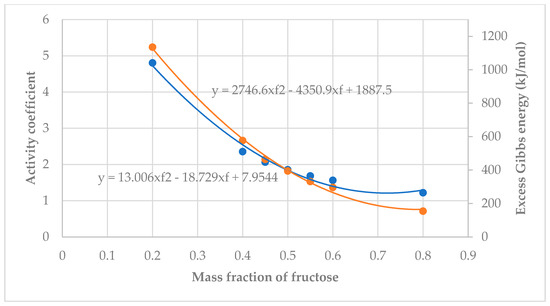
Figure 11.
Activity coefficient (blue) and Excess Gibbs Energy (orange) vs. mass fraction of fructose.
xylitol: yxylitol = 13.915x2 − 19.874x + 8.2945 and
fructose: yfructose = 13.006x2 − 18.729x + 7.9544.
Excess Gibbs Energy versus mole fractions were:
xylitol (blue): = 3279.5x2 − 5044.6x + 2097.7 and
fructose (orange line): = 2746.6x2 − 4350.9x + 1887.5
where x is the mole fraction in both cases.
Figure 12 and Figure 13 shows the relationship between Excess Gibbs Energy and activity coefficient. Both graphs show a similar trend, when the activity coefficient increased, Excess Gibbs Energy increased. Equations for Excess Gibbs Energy and activity coefficients for both xylitol and fructose show a logarithmic trend from which the Excess Gibbs Energy can be derived.
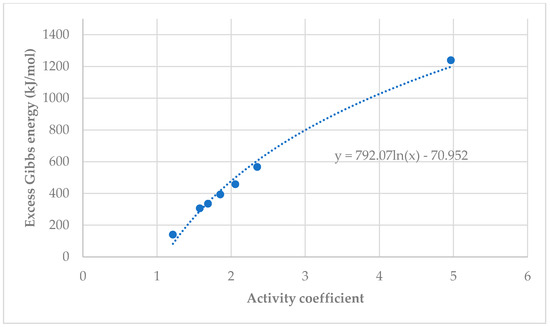
Figure 12.
Excess Gibbs Energy vs. activity coefficient for xylitol (a) and fructose (b).
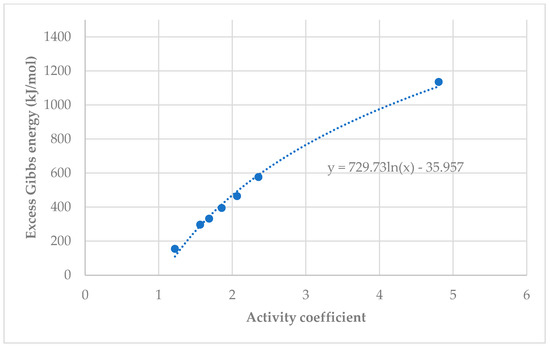
Figure 13.
Relationship between Excess Gibbs Energy and activity coefficient of fructose.
3.2. Experimental Results from the Xylitol—Fructose Phase Change System in a Solar Collector
Figure 14 displays the temperature of the hot water and PCMs versus time. In the red circle, there was significant heat transfer between hot water and the PCM. The temperature of the PCM rose to a certain point and then gradually dropped. The PCM was heated with hot water in the first 20 min. The heat transferred between the two substances was calculated as 248 kJ/kg from water to the PCM.
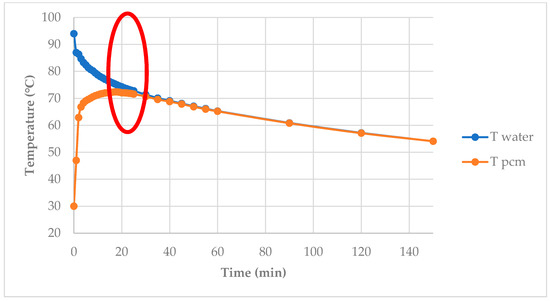
Figure 14.
Temperature of hot water and PCMs vs. time: The red circle shows the region of significant heat transfer between water and the PCM.
Figure 15 shows the temperature of the water with and without PCM versus time. The initial water temperature was 90 °C. The final temperature of the system after 150 min with the PCM was 54.1 °C or higher than the 40.0 °C without the PCM. The xylitol-fructose PCM helped maintain the temperature of the water. From calculation, the heat lost in the xylitol—fructose system was 503 kJ/kg, whereas in the pure water system it was 680 kJ/kg.
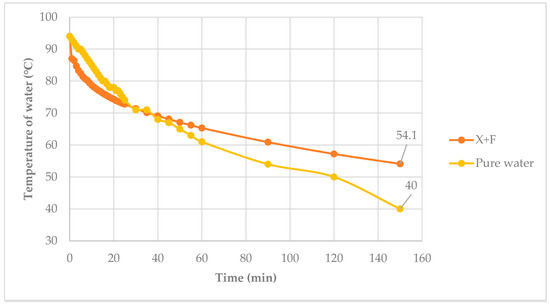
Figure 15.
Water temperature vs. time.
3.3. Experiment Using PCM as a Heating Source
Figure 16 shows temperature versus time, when heating water with the PCM. Initially, the PCM was at 90 °C, while the water was at 30 °C. The PCM temperature rapidly dropped in the first 2 min, while the water temperature gradually increased. This is because the heat capacity of water is greater than the PCM and the water quickly absorbed energy from the PCM. After 2 min, the PCM temperature slowly decreased, because the PCM started to change phase from liquid to solid. The solid surface is practiced as a heat transfer resistance. This phenomenon was clearer, when we observed the system after 10 min, at which the temperature gradually reduced at a very slow rate. The PCM temperature at 20 min was 42.8 °C, while the temperature of the water was 41.6 °C. The experiment showed that water absorbed 146 kJ/kg of energy from the xylitol—fructose system.
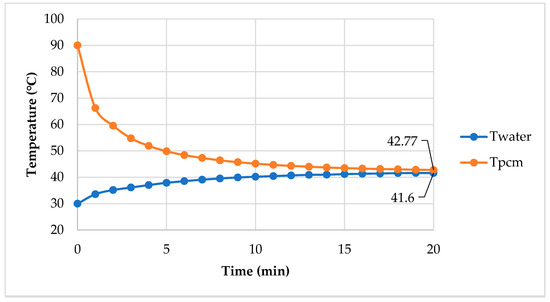
Figure 16.
Temperature of hot water and PCMs vs. time.
4. Conclusions
The phase diagram from direct observation and DSC thermograms showed that the eutectic temperature of xylitol—fructose is 76.40 degrees Celsius at a mass fraction ratio of 0.45 and 0.55, respectively. From calculation, the heat of fusion was 215 kJ/mol, the specific heat capacity was 1.21 J/kg K than the melting point and entropy values of PCMs. From DSC analysis, it was found that when the mole fraction of xylitol increased, the activity coefficient and Excess Gibbs Energy decreased. When the activity coefficient increased, the Excess Gibbs Energy increased. At the eutectic temperature, xylitol and fructose had activity coefficients of 2.06 and 1.69, respectively, and Excess Gibbs Energies were 458 and 332 kJ/kg, respectively. Our experiments showed that the xylitol—fructose mixture could maintain a water temperature higher than hot water without PCMs by ~14 °C. For heating water using PCMs when the water was at 30 °C, the heat transferred from water to the xylitol—fructose system was 146 kJ/kg.
The market price of xylitol-fructose was ~$US 4.62/kg in 2018. Compared to other PCMs, xylitol-fructose is cheaper. Therefore, PCMs are suitable for use in thermal energy storage, due to their high enthalpy and cheap price. Furthermore, it can be reused continuously, without the efficiency of the PCMs degrading.
Author Contributions
Conceptualization, S.W. and N.L.; methodology, S.W. and N.L.; validation, S.W. and N.L.; formal analysis, S.W.; data curation, S.W.; writing—original draft preparation, S.W.; writing—review and editing, S.W. and N.L.; supervision, N.L. All authors have read and agreed to the published version of the manuscript.
Funding
This research received no external funding.
Institutional Review Board Statement
Not applicable.
Informed Consent Statement
Not applicable.
Conflicts of Interest
The authors declare no conflict of interest.
References
- Ho, C.K. Concentrating Solar Power and Thermal Energy Storage. Sandia National Labratories. Available online: https://www.sandia.gov/ess-ssl/docs/NMRESGI/2016/7_Concentrated_Solar_Power_Ho.pdf (accessed on 3 May 2016).
- Alva, G.; Liu, L.; Huang, X.; Fang, G. Thermal energy storage materials and systems for solar energy applications. Renew. Sustain. Energy Rev. 2017, 68, 693–706. [Google Scholar] [CrossRef]
- Pelton, A.; Thompson, W. Phase diagrams. Prog. Solid State Chem. 1975, 10, 119–155. [Google Scholar] [CrossRef]
- Abhat, A. Low temperature latent heat thermal energy storage: Heat storage materials. Sol. Energy 1983, 30, 313–332. [Google Scholar] [CrossRef]
- The Physics Classroom. Solar Power Applications|Technology For Life. Available online: https://technology4life.wordpress.com/applications-of-solar-power/ (accessed on 10 October 2018).
- Light Absorption, Reflection, and Transmission. Available online: https://www.physicsclassroom.com/class/light/Lesson-2/Light-Absorption,-Reflection,-and-Transmission (accessed on 10 October 2018).
- Del Barrio, E.P.; Cadoret, R.; Daranlot, J.; Achchaq, F. New sugar alcohols mixtures for long-term thermal energy storage applications at temperatures between 70 °C and 100 °C. Sol. Energy Mater. Sol. Cells 2016, 155, 454–468. [Google Scholar] [CrossRef]
- Diarce, G.; Gandarias, I.; Campos-Celador, Á.; García-Romero, A.; Griesser, U.J. Eutectic mixtures of sugar alcohols for thermal energy storage in the 50–90 °C temperature range. Sol. Energy Mater. Sol. Cells 2015, 134, 215–226. [Google Scholar] [CrossRef]
- Kelly, F.H.C.; Brown, D.W. Phase equilibria in the system sucrose-glucose-fructose. J. Appl. Chem. 2007, 17, 125–126. [Google Scholar] [CrossRef]
- Nordlie, B.E. Eutectic melting. In Petrology; Kluwer Academic Publishers: Dordrecht, The Netherlands, 1989; pp. 155–157. [Google Scholar]
- Kenisarin, M.; Mahkamov, K. Solar energy storage using phase change materials. Renew. Sustain. Energy Rev. 2007, 11, 1913–1965. [Google Scholar] [CrossRef]
- Thermtest Instruments. Rule of Mixtures Calculator-Find Specific Heat Capacity of a Mixture. Available online: https://thermtest.com/rule-of-mixtures-calculator (accessed on 8 July 2018).
- Meltzer, V.; Pincu, E. Thermodynamic study of binary mixture of citric acid and tartaric acid. Open Chem. 2012, 10, 1584–1589. [Google Scholar] [CrossRef] [Green Version]
- Hidaka, H.; Yamazaki, M.; Yabe, M.; Kakiuchi, H.; Ona, E.P.; Kojima, Y.; Matsuda, H. New PCMs Prepared from Erythritol-Polyalcohols Mixtures for Latent Heat Storage between 80 and 100 °C. J. Chem. Eng. Jpn. 2004, 37, 1155–1162. [Google Scholar] [CrossRef]
- Ma, G.; Sun, J.; Zhang, Y.; Jing, Y.; Jia, Y. A novel low-temperature phase change material based on stearic acid and hex-anamide eutectic mixture for thermal energy storage. Sol. Energy Mater. Sol. Cells 2019, 714, 166–171. [Google Scholar]
Publisher’s Note: MDPI stays neutral with regard to jurisdictional claims in published maps and institutional affiliations. |
© 2021 by the authors. Licensee MDPI, Basel, Switzerland. This article is an open access article distributed under the terms and conditions of the Creative Commons Attribution (CC BY) license (https://creativecommons.org/licenses/by/4.0/).