Article

Heat Transfer Performance Potential with a High-Temperature Phase Change Dispersion

1
Competence Centre Thermal Energy Storage (TES), Lucerne University of Applied Sciences and Arts, 6048 Horw, Switzerland
2
Birmingham Centre for Energy Storage and School of Chemical Engineering, University of Birmingham, Birmingham B15 2TT, UK
3
Global Energy Interconnection Research Institute Europe GmbH, 10117 Berlin, Germany
*
Author to whom correspondence should be addressed.
Energies 2021, 14(16), 4899; https://doi.org/10.3390/en14164899
Submission received: 14 June 2021 / Revised: 27 July 2021 / Accepted: 6 August 2021 / Published: 11 August 2021

Abstract

:
Phase change dispersions are useful for isothermal cooling applications. As a result of the phase changes that occur in PCDs, they are expected to have greater storage capacities than those of single-phase heat transfer fluids. However, for appropriate heat exchanger dimensions and geometries for use in phase change dispersions, knowledge about the convective heat transfer coefficients of phase change dispersions is necessary. A test unit for measuring the local heat transfer coefficients and Nusselt numbers of PCDs was created. The boundary condition of constant heat flux was chosen for testing, and the experimental heat transfer coefficients and Nusselt numbers for the investigated phase change dispersion were established. Different experimental parameters, such as the electrical wall heat input, Reynolds number, and mass flow rate, were varied during testing, and the results were compared to those of water tests. It was found that, due to the tendency of low-temperature increases in phase change dispersions, the driving temperature difference is greater than that of water. In addition, larger heat storage capacities were obtained for phase change dispersions than for water. Through this experimentation, it was acknowledged that future investigation into the optimised operating conditions must be performed.

1. Introduction

Phase change dispersions (PCDs) are two-phase heat transfer fluids (HTFs) that are comprised of a phase change material (PCM) that is dispersed into a continuous phase (generally water) and stabilised with the help of surfactants [1]. PCDs are designed so that the PCM within the PCD changes phase at a temperature where heat can be stored or isothermally released [2]. During this phase change, the PCD exploits not only the sensible heat of its relevant components (the PCM and water), but also the latent heat of the phase change [1,3]. This ensures that PCDs have considerably higher cooling capacities compared to standard cooling fluids, such as water. As a result of this and the fact that PCDs can both store and transport heat, they have attracted recent attention in the literature. PCDs have been the centre of a few recent review articles; O’Neill et al. [1] discussed and compared the effects of the formulation properties and operational parameters on the heat transfer performance of PCDs and described the need for a better understanding of the formulation of stable PCDs with low supercooling degrees. Wang et al. [3] focused on highlighting the thermophysical, rheological, and heat transfer properties of PCDs, and Shao et al. [4] reviewed the use of PCDs for the heating, ventilation, and air-conditioning (HVAC) industry. From the reviews, the consensus on the required properties of PCDs for use in thermal management and cooling can be seen as follows [1,3,4,5]:
  • They offer great stability during both storage and thermo-mechanical cycling;
  • They have low degrees of supercooling (through either the addition of nucleating agents or the modification of surfactant properties);
  • They have a phase change temperature that matches the desired application in which they will be thermally managing/cooling;
  • They have a higher specific heat capacity (generally listed as twice that of water);
  • They have a low viscosity such that they have low pressure drops and, thus, low pumping powers;
  • They have high heat transfer coefficients.
Despite the recent traction in the field of PCD development, there have been few investigations or productions of PCD with phase change temperatures of over 30 °C [6], with many focusing on air conditioning (5–15 °C) or refrigeration (3–8 °C) [7]. As a result of this, most of the literature focuses on determining the performance of PCDs within this temperature range, and in most cases, the same PCDs are used. Almost all of the PCDs researched in the literature are based on paraffins due to their abundance in the desired temperature ranges for comfort cooling, high latent heats, and relatively low costs [1]. However, paraffins are products of petroleum refining, which removes currently formulated PCDs as potential contributors to a sustainable energy model [8]. Furthermore, it has been suggested that, from the point of view of applications, the relative inertness of paraffins can cause them to separate from the PCD, thereby attaching themselves to the piping and heat exchangers in systems [9]. The removal of these paraffin layers is a difficult and time-consuming process that requires strong organic solvents. To the authors’ knowledge, the only research performed on an organic PCM that was not a paraffin-based PCD was by Puupponen et al. [10] and in two works by Zhang et al. [11,12]. Puupponen et al. [10] investigated the formulation conditions of two fatty-acid-based PCDs with stearic and myristic acid as the PCMs. The authors found that stable stearic-acid-based PCDs were successfully formulated with a combination of both ionic and non-ionic surfactants. Despite this, the PCDs formulated with myristic acid were found to be unstable [10]. Zhang et al. [12] prepared PCDs with capric acid, lauric acid, myristic acid, palmitic acid, stearic acid, and eutectics thereof. The latent heat capacities of the eutectic formulations were found to be in the range of 36–51 J g 1 [12], which is within the same range as PCDs formulated with paraffins [1,3]. In a further study, Zhang et al. [11] determined the stability of a capric-acid-/lauric-acid-eutectic-based PCD and found that the PCD showed excellent stability over 100 freeze–melt cycles. Alongside the high stabilities of fatty acids shown by Zhang et al. [11] and Puupponen et al. [10] and the comparable phase change enthalpies shown by Zhang et al. [12], fatty acids are also have the properties of being abundant, non-toxic, and bio-based [9], rendering them promising candidates for PCD development. However, thus far, the research into fatty acids as bio-based alternatives for PCDs has been limited to thermophysical and formulation analyses; thus far, no heat transfer experiments have been performed. The lack of research on both PCDs above 30 °C and non-paraffin-based PCDs has led the authors of this paper to formulate a novel PCD that has a melting point at 50 °C and is bio-based. The formulation details and the relevant thermophysical properties of this PCD can be seen in [9]. Additionally, because there are few articles that have discussed the heat transfer performance of bio-based PCDs, this article aims to highlight preliminary heat transfer performance results.

Envisioned Application

The PCD developed for this investigation was formulated with a specific application in mind—for the temperature-sensitive electronic cooling of high-voltage direct-current (HVDC) converter components at 50 °C. Within high power transmission systems and devices such as HVDC converters, issues arise with thermal management, as within these systems, there is a high power dissipation, which can be up to 30% of the total HVDC power loss [13]. Not only does this cause problems with thermal runaway in the system, but the power losses resulting from the high power dissipation result in large maintenance costs for the operating plants [14,15]. Currently, to prevent this, there are two common methods that are employed—water cooling and air cooling. Air cooling, which is used through either forced or natural flux through cooling air channels, is normally used for electronic devices with power dissipation rates below 1500 W [14,16]. However, in the case of HVDC, this value can be up to 10 kW, and for this, air is not sufficient [13,14,17]. Water has a high cooling efficiency; however, only sensible heat can be exploited [16], as the cooling of HVDC converters is required at 50 degrees. As a result of this, it is envisioned to add PCM droplets to water to form a PCD, thus offering thermal stabilisation within the desired temperature range of 50 °C. Consequently, with the enhancement of the heat capacity during the phase change, the lower volumetric flow rates of the PCD in comparison with water can be used, thus further lowering the operational costs [8]. As a result of this, this research article will aim to preliminarily demonstrate the merit of using a newly developed bio-based PCD rather than water. The foundation of this comparison will be built on the temperature stabilisation capabilities of the PCD alongside the calculated heat capacities, heat transfer coefficients, and Nusselt number.

2. Materials and Methods

2.1. Materials

Currently, most PCDs are formulated with paraffins as their PCM; however, paraffins are derived from non-renewable feedstocks and, thus, do not contribute to a sustainable energy model. Therefore, in this investigation, the PCD consisted of a 16 wt.% dispersed mixture of Crodatherm 53/Crodatherm 47 (50:50) in water, resulting in a bio-based PCD. For the surfactant system, two steareth-based surfactants were used at 4 wt.%. The full formulation details of the PCD used in this investigation can be seen in [9].

2.2. Thermal Characterisation

Differential scanning calorimetry was employed to determine the inlet conditions that should be used in the experimental test setup, the peak melting temperature of the PCD, the enthalpy of the phase change, and the specific heat capacity. The differential scanning calorimeter (DSC) used in this experimental investigation was the Mettler Toledo DSC 832. The DSC has a reported uncertainty of +/−8% of the melting enthalpy. The heating rate used during the DSC measurement was 5 K min 1 .

2.3. Particle Size Distribution

In this investigation, a Beckman-Coulter LS13320 with polarisation intensity differential scattering (PIDS) and laser diffraction was used to investigate the particle size distribution (PSD). A greater stability of the PCD was assumed when the PSD showed particles that had a small droplet size and a narrow droplet size range. The measuring range of the instrument was 0.04–2000 μ m.

2.4. Experimental Test Rig

The test rig used in this investigation can be seen in Figure 1, and the dimensions of the experimental setup, which were previously reported by Fischer et al. [18], can be seen in Table 1. Three stainless steel tubes (1.401/304L) and a heating cable (TWIN, Arnold Rak GmbH) were used to measure the heat transfer behaviour of the PCD under a uniform heat flux. Polyisocyanurate shells from Swisspor were wrapped around the heating cables and tubes to ensure that the system was insulated. Within the tubes, the bulk and wall temperatures were directly measured with Pt-100 temperature sensors; T101, T103, T105, and T107 directly measured the bulk fluid temperatures at the outlet of each tube section by being placed parallel to the flow. T102, T104, T106, and T108 measured the wall temperatures at the outlet of each tube section. The uncertainty of each temperature sensor was found to be +/−0.05 °C during calibration. Figure 1 shows the placement of a bulk and wall temperature sensor within the tube. The mass flow rate was measured with a Coriolis flow meter and controlled with an impeller pump (Zuwa NIROSTAR/V 2000-B/PT). The temperature and mass flow rate measurements were collected with an NI 9215 unit in an NI CompactDAQ framework. The specifications of the sensors, which were previously reported by Fischer et al. [18], can be seen in Table 2. All measurements were performed under steady-state conditions.

2.5. Equations of Interest

The objective of this experimental work was to investigate the heat transfer behaviour of a PCD by using different operational parameters (applied heat flux and mass flow rate). For this, the interest lies in the local heat transfer coefficient between the bulk of the PCD and the tube wall under steady-state conditions. Additionally, the local Nusselt numbers ( N u ) are also of interest. Firstly, the specific flux density at the wall ( q ˙ w ) was calculated according to:
q ˙ w = P e l Q ˙ l o s s A
where P e l is the electrical power input, A is the inner area of the tube, and Q ˙ l o s s is the heat loss, which was calculated to be 54 W for the temperature range in this investigation (44–50 °C). Using the specific flux density and the temperature difference between the local wall temperature (T w , x ) and the local bulk temperature (T b , x ), the local heat transfer coefficient was calculated as follows:
h x = q ˙ w T w , x T b , x
Using h x , the local Nusselt number ( N u x ) was calculated according to:
N u x = h x d λ
where λ is the thermal conductivity of the PCD, which was found in a previous investigation by Fischer et al. [9] to be 0.529 W m 1 K 1 at 25 °C (when the PCM in the PCD was fully crystallised) and 0.561 W m 1 K 1 at 60 °C (when the PCM in the PCD was fully melted).
Additionally, to calculate the apparent specific heat capacity ( c ¯ p ) of the PCD during melting, in the experimental test setup for determining the quantity of heat that the PCD was able to store during cycling, the total c ¯ p over the entire length of the tube was calculated in accordance with:
c ¯ p = P e l Q ˙ l o s s m ˙ ( T b , o u t T b , i n )
where T b , o u t and T b , i n are the fluid’s bulk temperature at the outlet and inlet of the tube, respectively. The specific heat capacity can also be calculated for each section of the tube (Section 1 (0–5.3 m), Section 1 (5.3–10.6 m), and Section 1 (10.6–16.0 m)) by dividing the term P e l Q ˙ l o s s by three and taking the bulk fluid’s inlet and outlet temperatures at the inlet and outlet of each respective section.

3. Results

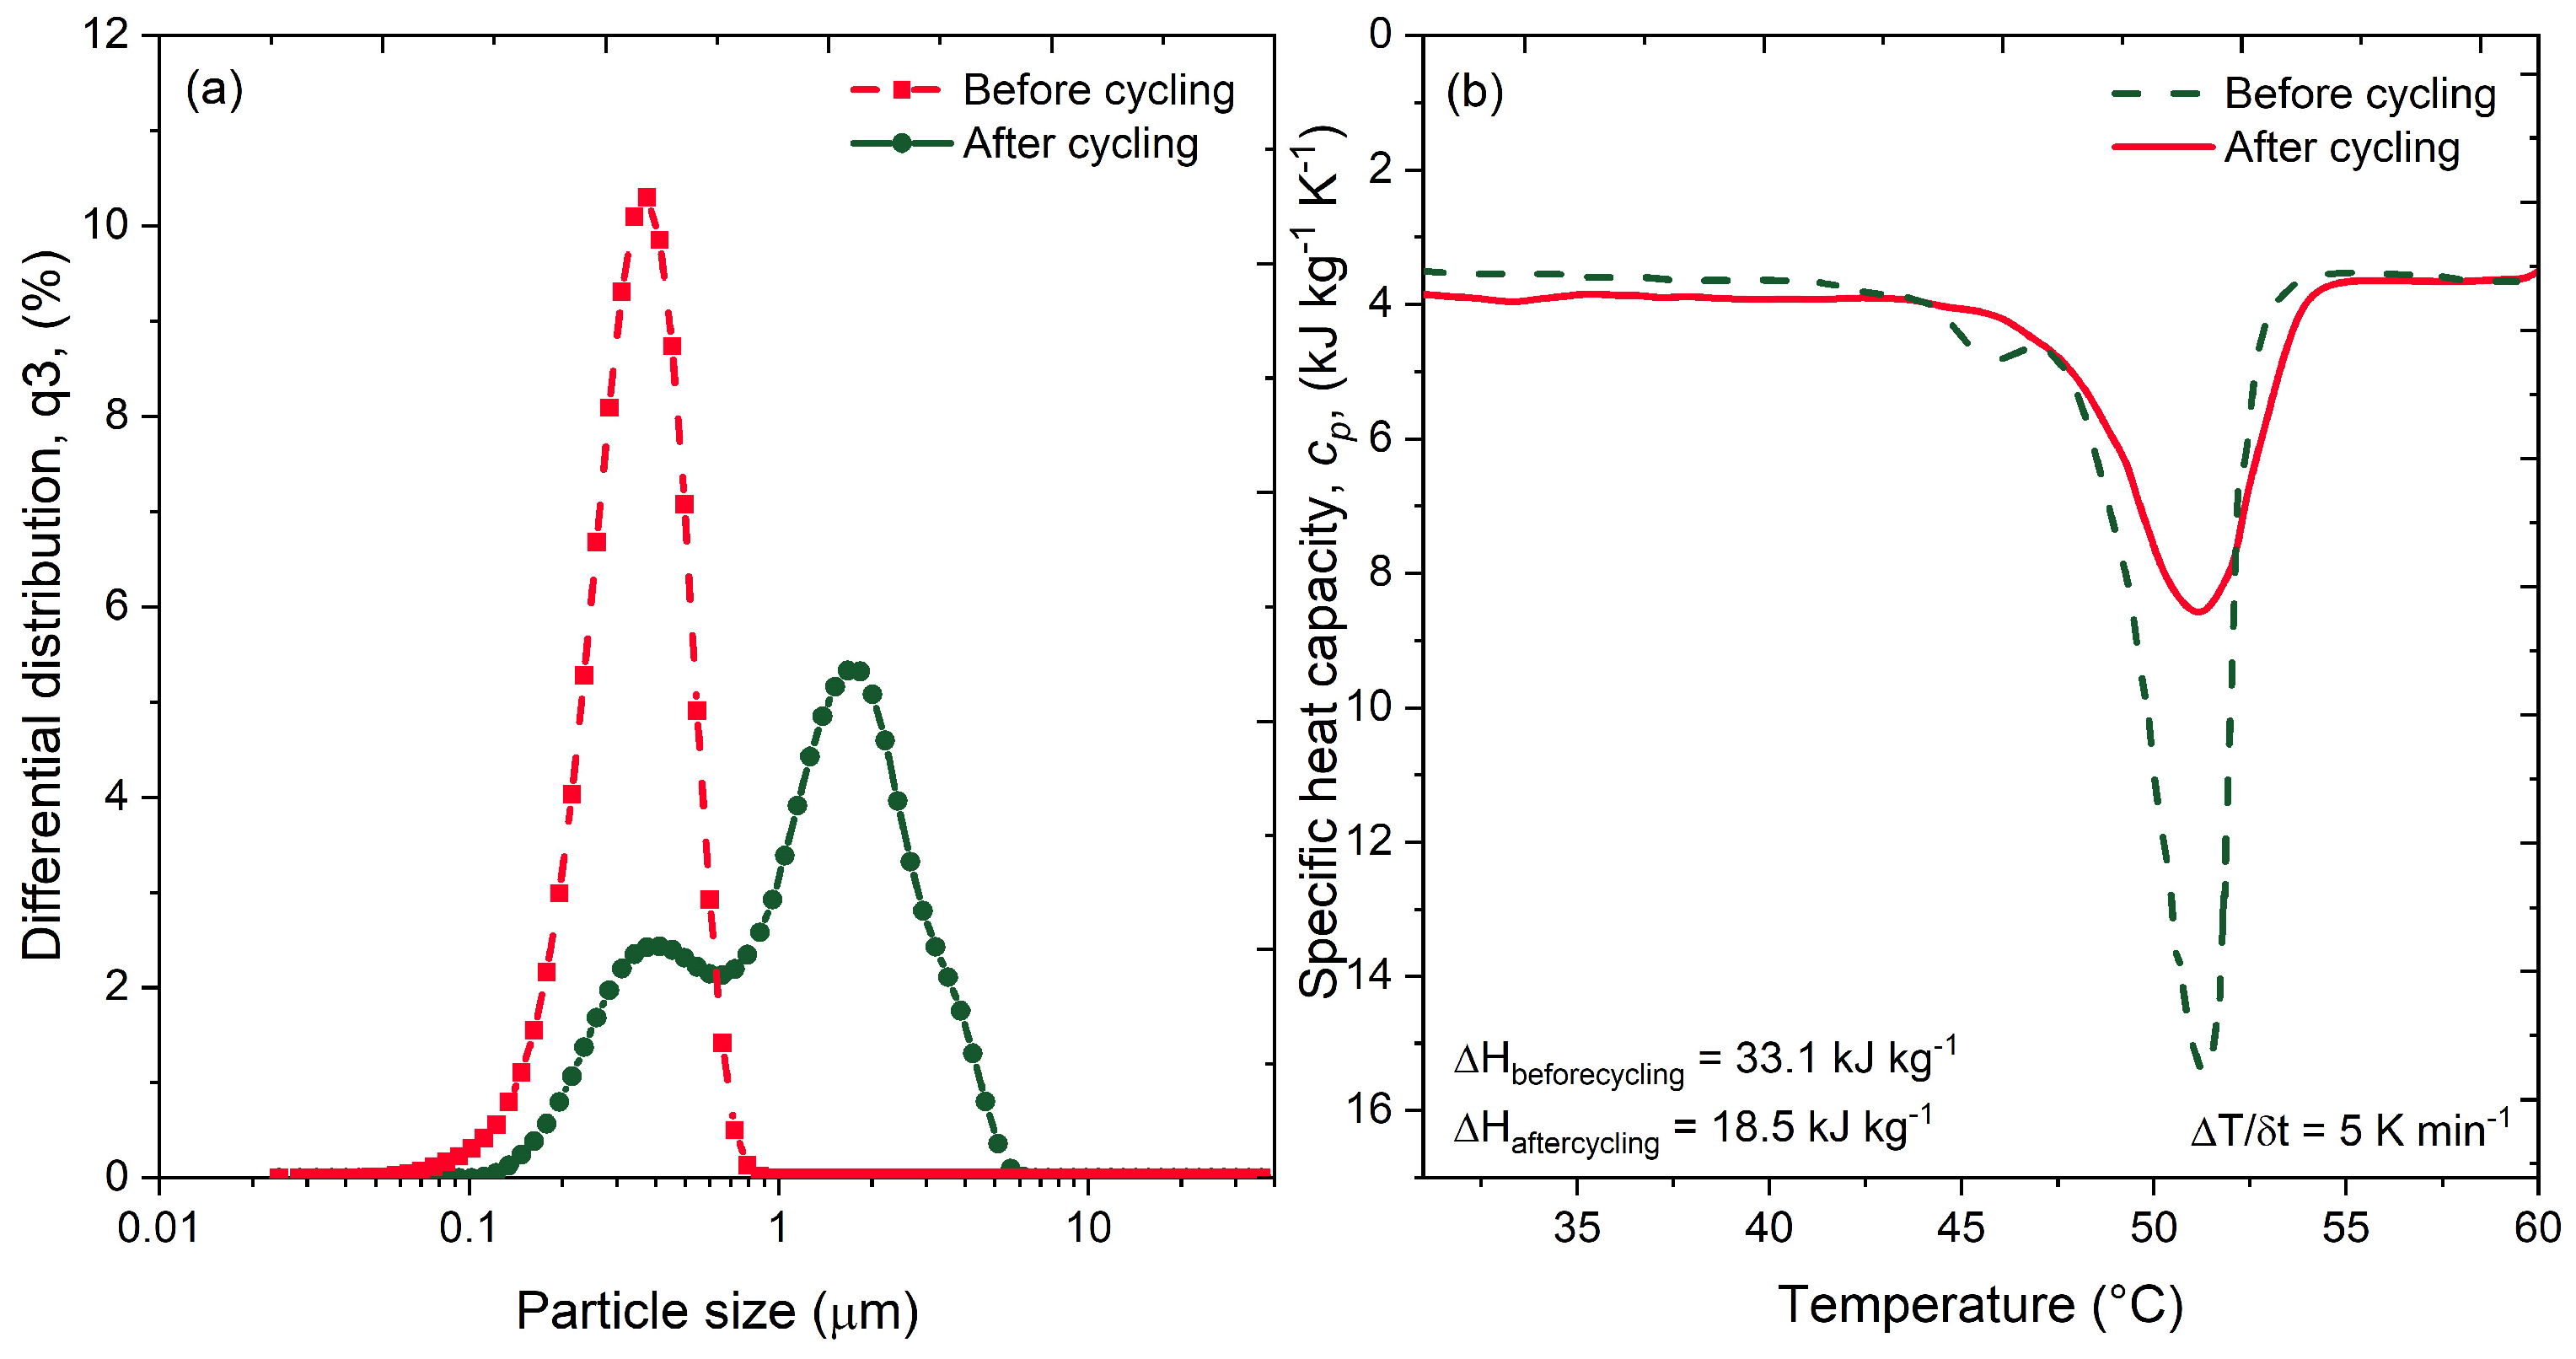
3.1. Thermophysical Characterisation

The particle size distribution of the PCD used in this investigation before and after thermo-mechanical cycling can be seen in Figure 2a. Before the PCD was cycled, the PCD had small particles with a narrow particle size distribution range (0.1 to 1.0 μ m). However, after weeks of continuous thermo-mechanical cycling, larger particle sizes and a wider particle size distribution (0.5 to 5.0 μ m) were observed. These results suggest that the particles are undergoing coalescence and are not stable after a few weeks of continuous cycling. The stability can also be determined from Figure 2b, whereby the DSC analysis showed the calculated specific heat capacity and enthalpy of melting before and after weeks of continuous thermo-mechanical cycling. Before cycling, the specific heat capacity reached a maximum at approximately 51 °C with a value of 15.8 kJ kg 1 K 1 , and after continuous cycling, the maximum value was again at 51 °C and was calculated to be approximately 8 kJ kg 1 K 1 . This is indicative that the PCD suffered from instability, most likely with some of the PCM crystallising out onto the heat exchanger and piping surfaces, thus resulting in a lower specific heat capacity.
Figure 2b serves as an additional means of determining the correct inlet temperature conditions for the heat transfer experiments. For the heat transfer to maximised and for the best possible temperature stability, the temperature of the PCD must enter the measuring section at approximately 49 °C to exploit the full range of the enhanced specific heat capacity of melting. This was taken into consideration and is further investigated in the following section.

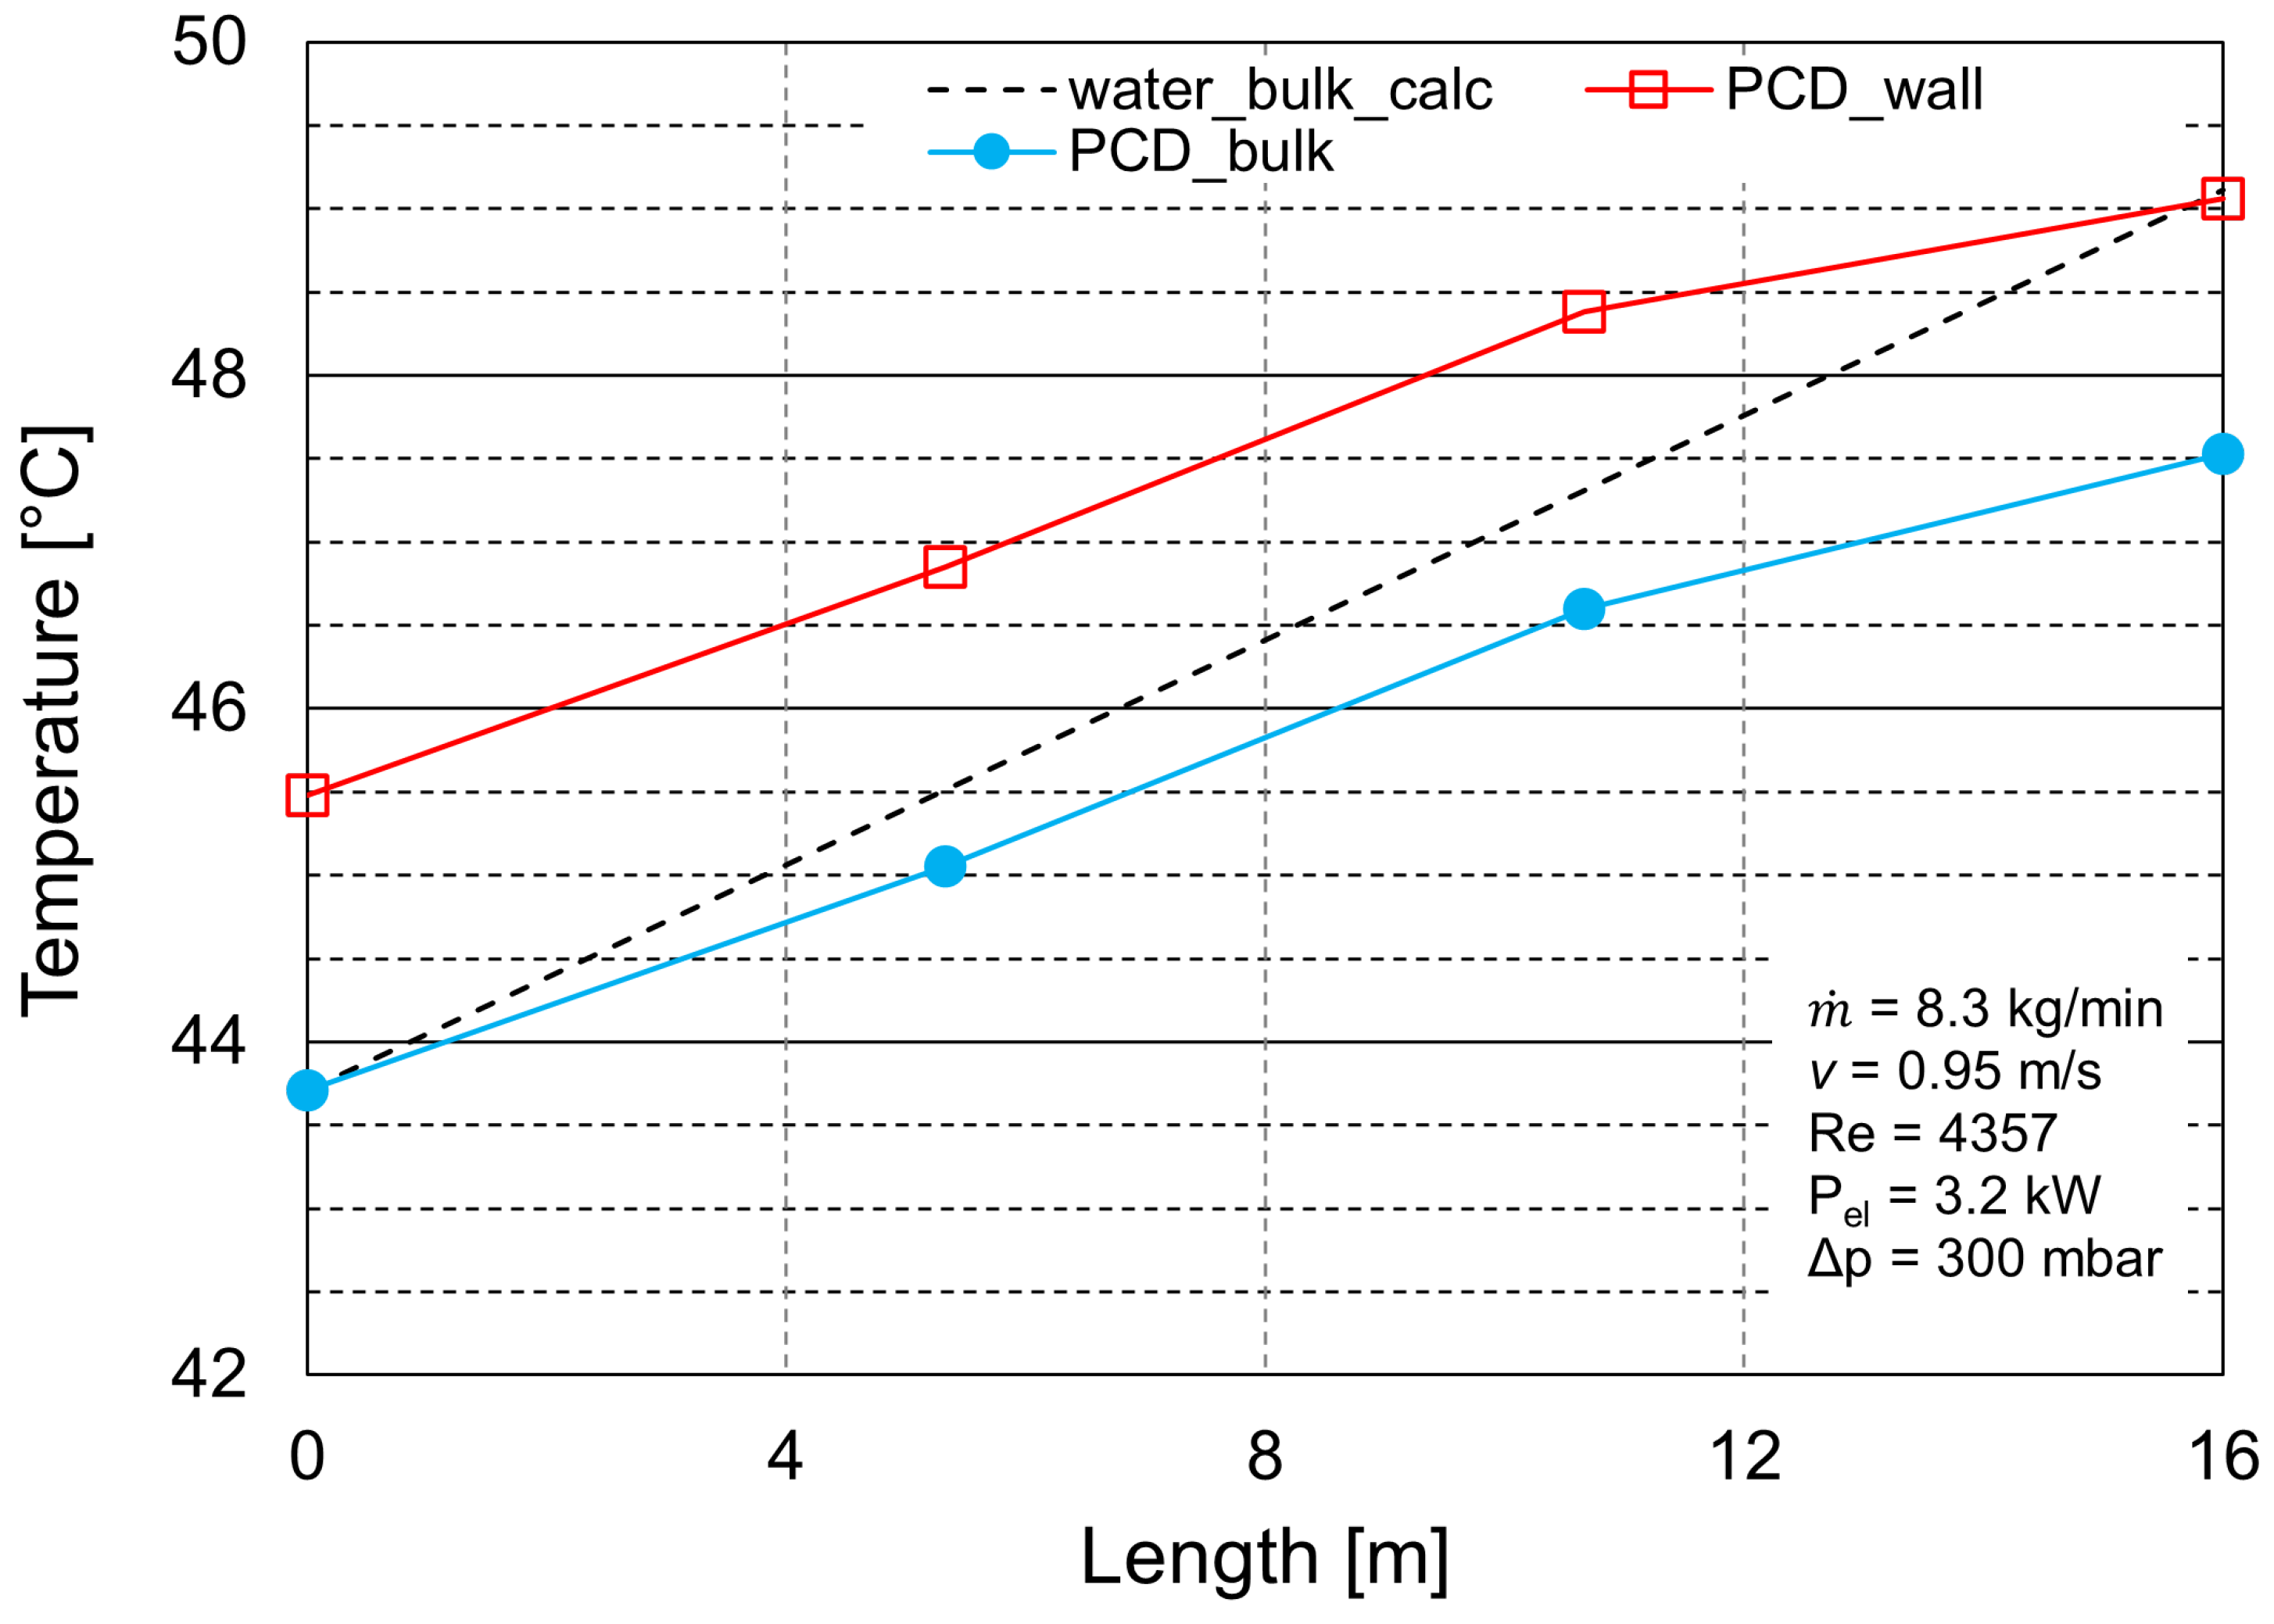
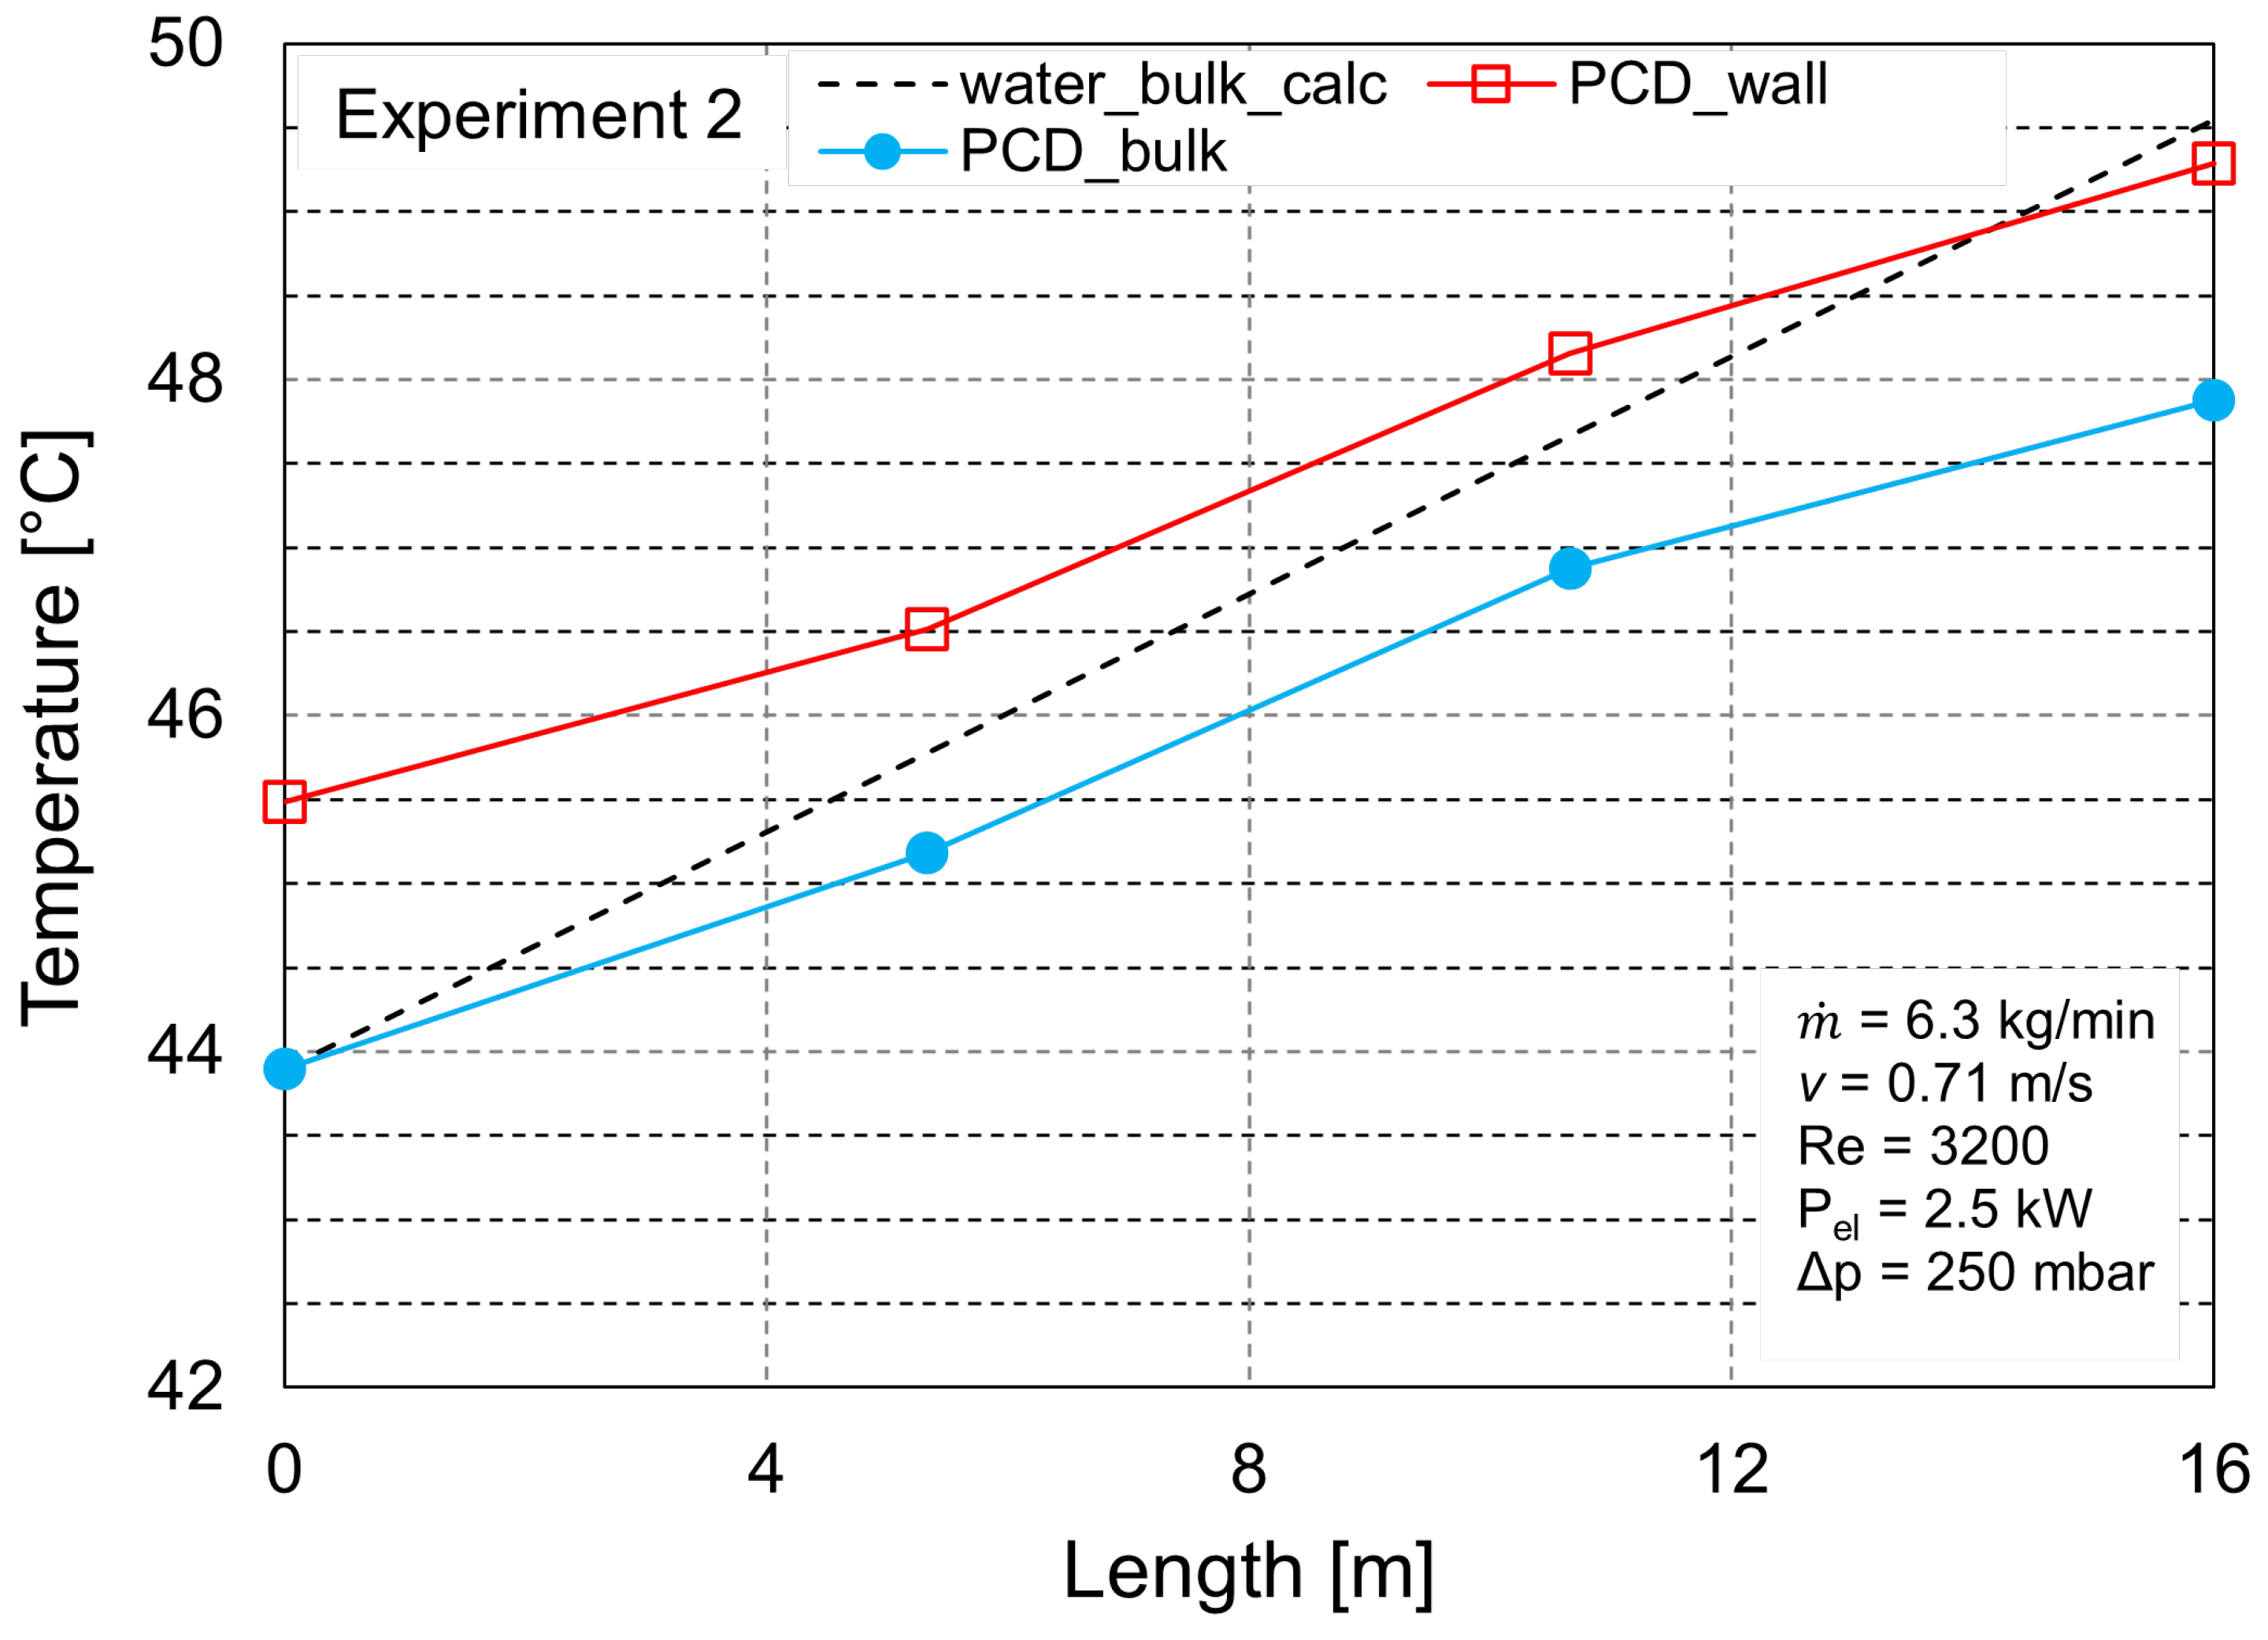
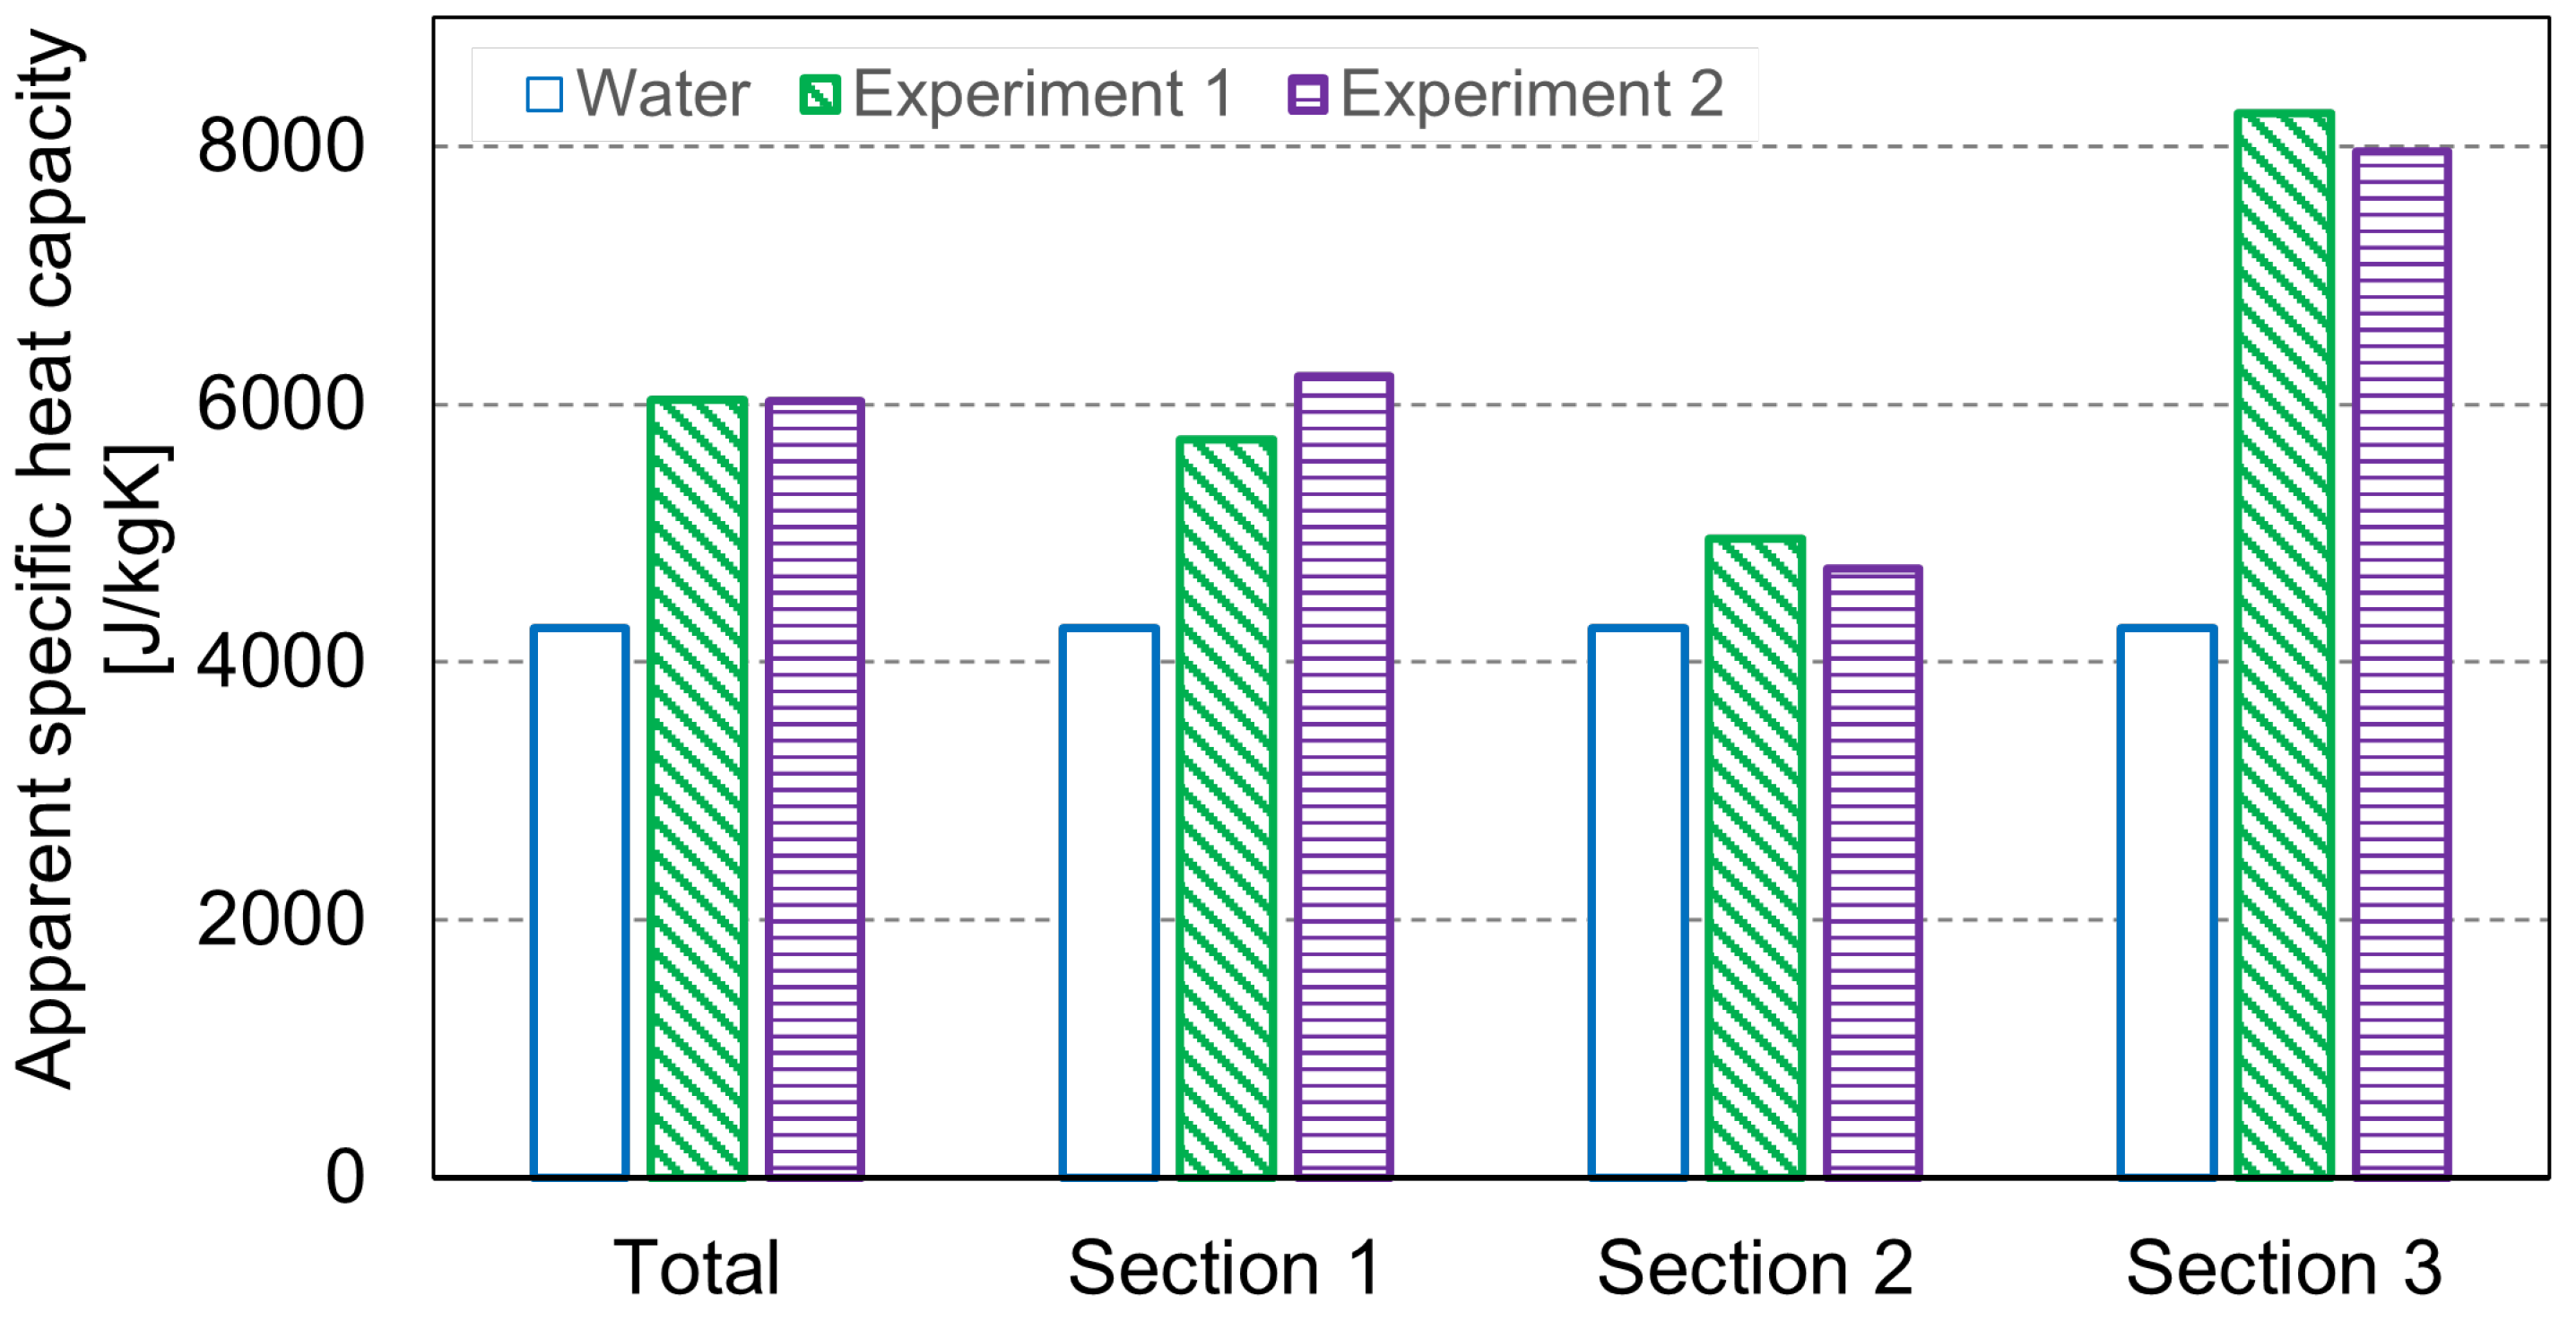
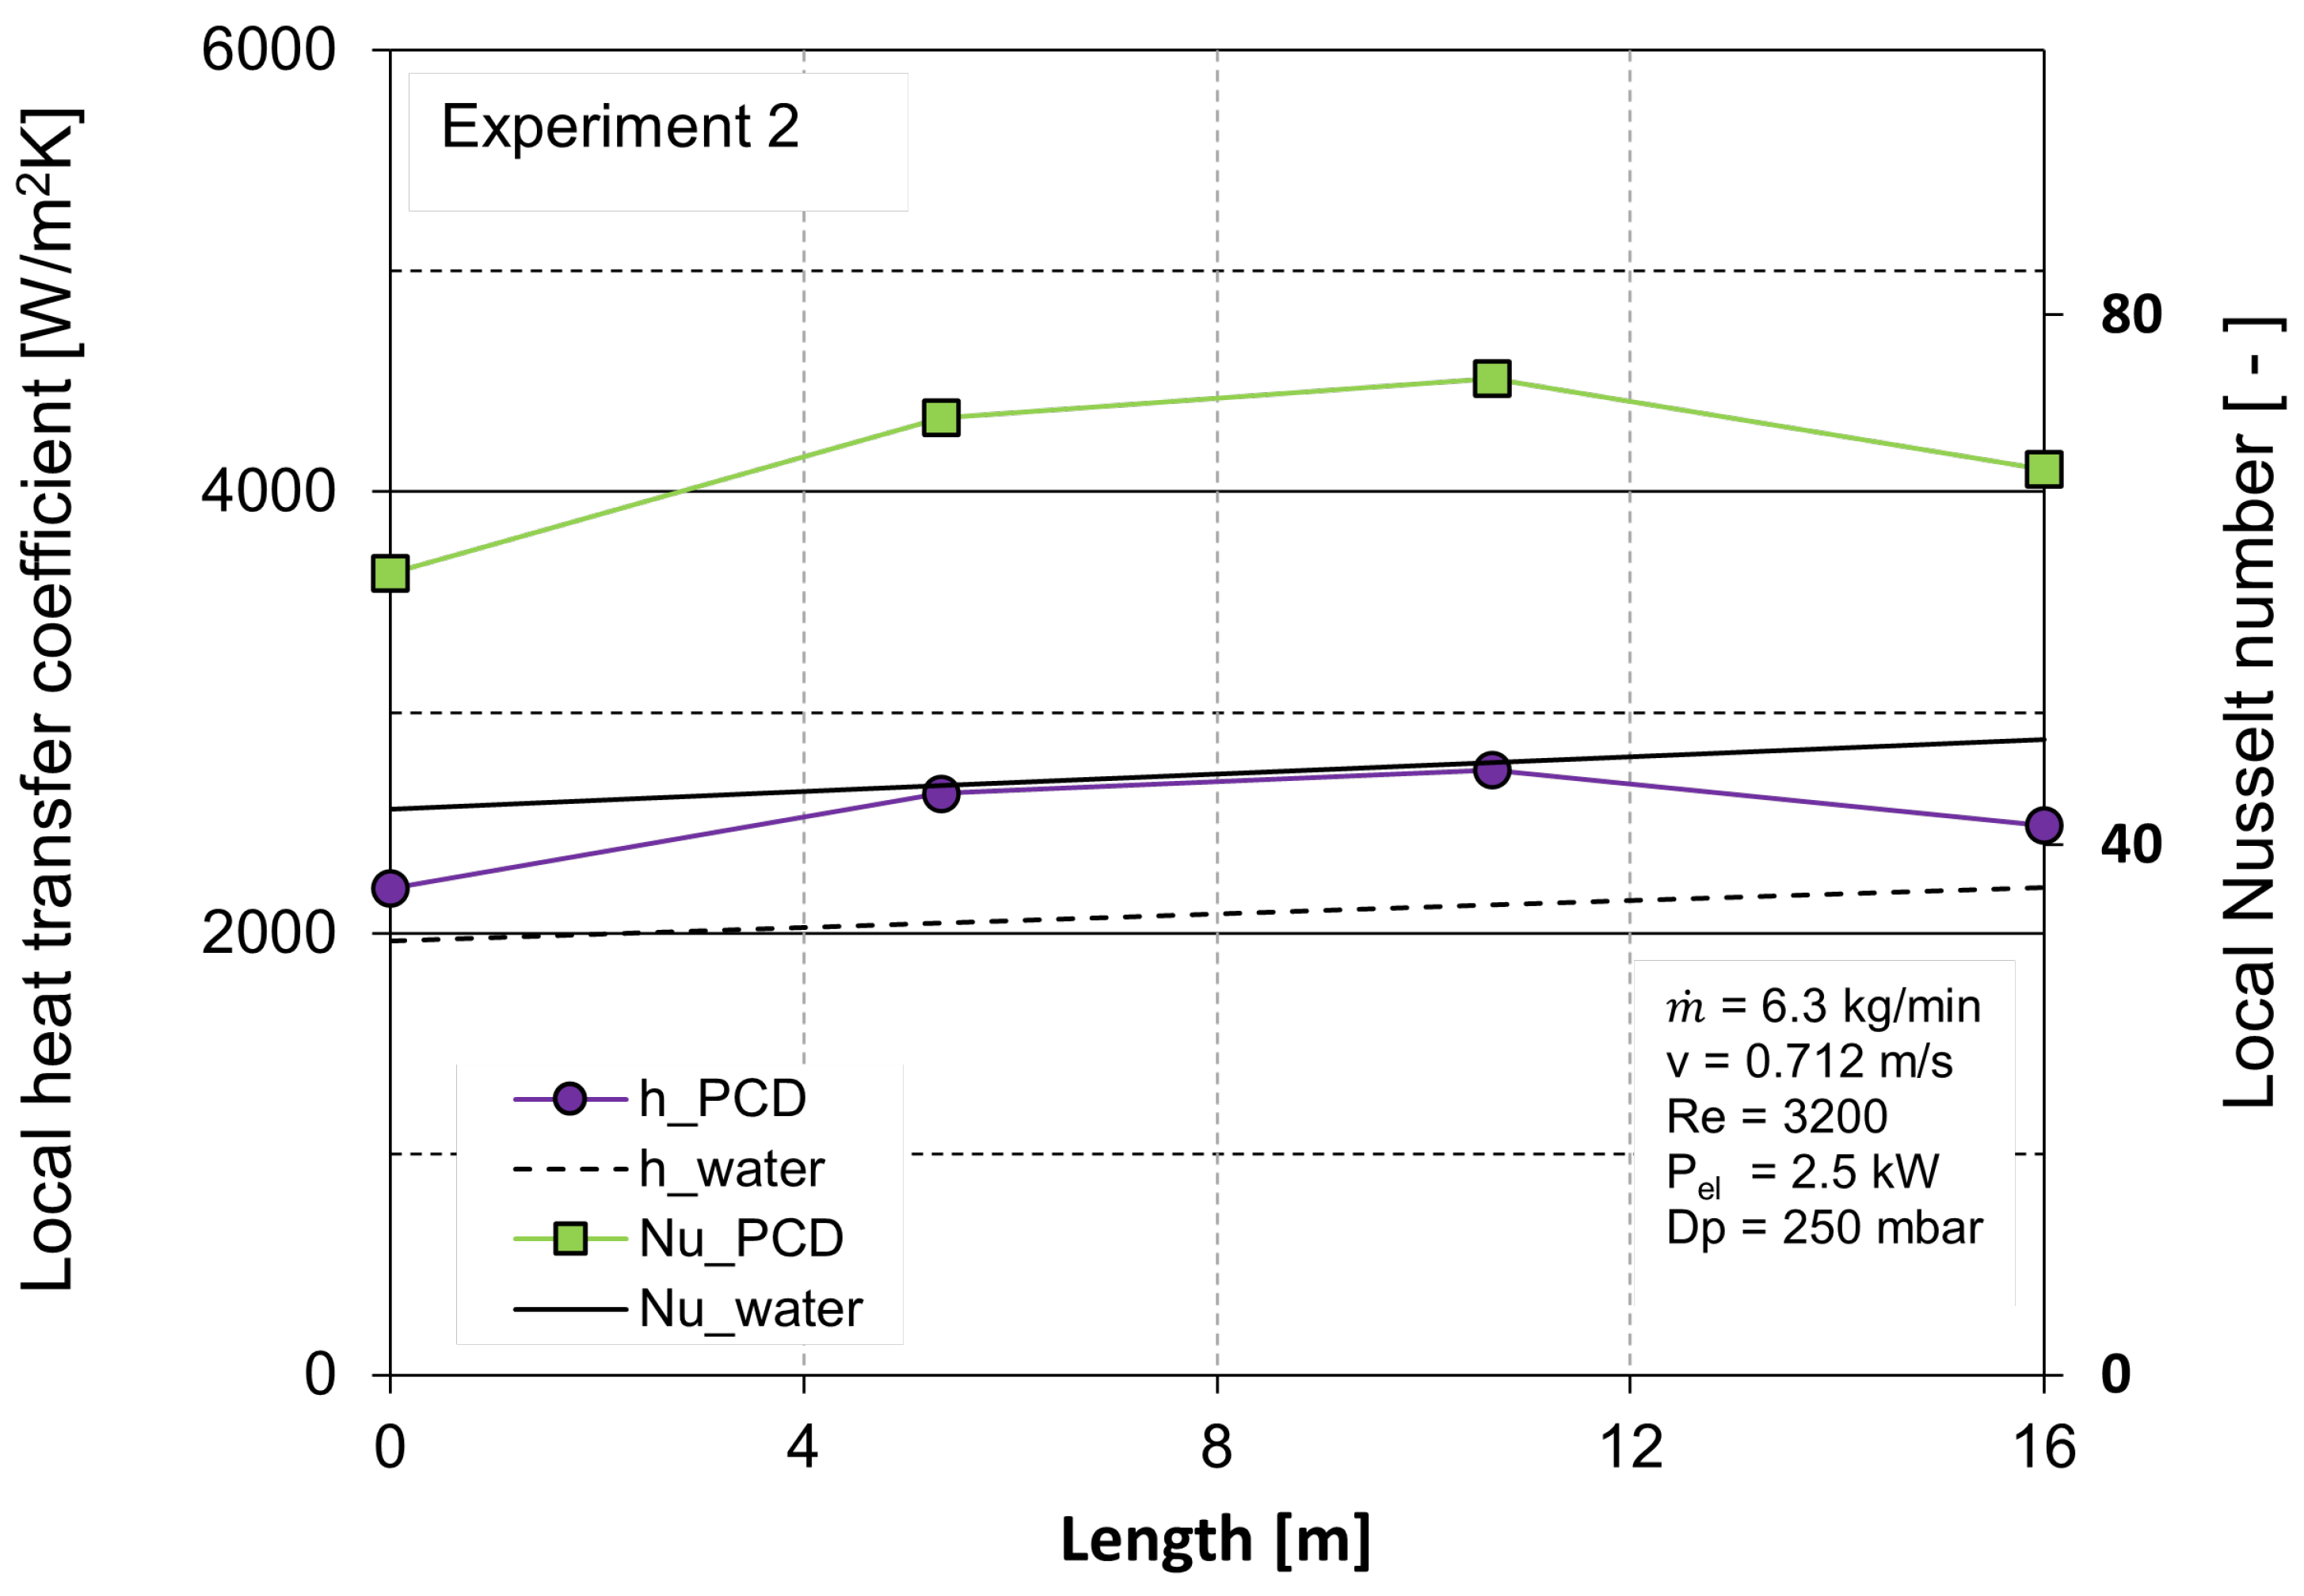
3.2. Heat Transfer Analysis

In the study by Fischer et al. [18], the same experimental test setup as that used in this investigation was validated with water. Due to this, in this investigation, all values of the heat transfer coefficients and Nusselt numbers for water in the turbulent flow regime are calculated by using the Gnielinski correlation.
N u G n i e l i n s k i = ( ( 1.8 l o g 10 R e 1.5 ) 2 ) / 8 R e P r 1 + 12.7 ( 1.8 l o g 10 R e 1.5 ) 2 8 ( P r 2 / 3 1 ) 1 + d L 2 / 3
These values were thus used for comparison with the novel PCD presented in this work. To determine the heat transfer behaviour of the PCD, two experiments were performed with different operational parameters, and the results were subsequently compared to those of water. The operational conditions of these two experiments can be seen in Table 3.
As mentioned above, the inlet temperatures were chosen on account of the DSC analysis in Section 3.1. The DSC in Figure 2b indicates that the melting range is from 44 to 50 °C, and it was envisioned that the melting of the PCD along the length of the tube would replicate the same behaviour. However, due to the high degrees of supercooling (12 K), when the PCD reached 50 °C, the cooling system could not fully crystallise the PCD, and therefore, a lower inlet temperature was investigated. This highlights the need for future modification of the experimental test setup in order to allow a larger range of operational parameters to be investigated.
The temperature profiles of the bulk and wall temperatures for experiments 1 and 2 can be seen in Figure 3 and Figure 4, respectively. Additionally, the bulk temperatures of water under the same operational conditions can be seen in both figures. During both experiments, the fluid was heated by the applied electrical heat input of the tube wall, and this was reflected in the increase in the bulk temperatures along the length of the tube. It is also to be noted that the heat input was higher in experiment 1 than in experiment 2, which is shown by the higher wall temperatures observed in experiment 1 compared to experiment 2. A 9% temperature increase was seen for the bulk temperature of the PCD in the experiment along the length of the tube, but for water, under the same experimental conditions, a 12% temperature increase was observed. The larger increase in the water’s bulk temperature compared to that of the PCD was also seen in experiment 2, wherein a 9% increase of the bulk PCD temperature was observed and a 13% temperature increase was observed for water. The smaller increase in the bulk temperatures of the PCD compared to those of water was due to the heat absorption by the PCM droplets in the PCD during the melting process. Furthermore, when observing each separate tube section, the last section of the tube (10–16 m) for experiments 1 and 2 showed the smallest increase in the bulk temperature compared to all other sections due to the PCD being subjected to temperatures that were closer to the peak melting temperature of the PCD (50 °C). The degree of melting in each tube section could also be determined by calculating the apparent specific heat capacities, as outlined in Equation (4). The apparent specific heat capacities calculated for experiments 1 and 2 and for water can be seen in Figure 5.
From Figure 5, it is evident that in all sections of the tube, the apparent specific heat capacity of the PCD was higher than for water, which indicates that melting occurred along the entire length of the tube. This explains why, as shown in Figure 3 and Figure 4, the bulk temperature increase for water was higher than for the PCD in both experiments. Within the temperatures used in this investigation, water used only sensible heat, whereas the PCD used the latent heat of the phase change of the PCM droplets in addition to the sensible heat of both the PCM and water components. For both experiments, the overall apparent heat capacity between the inlet and outlet temperatures ( δ T = 4 K) was approximately 6 kJ kg 1 K 1 , which was a 43% increase compared to that of water. However, in Section 3, where most of the melting occurred, the apparent specific heat capacities of the PCD are twice that of water. This suggests that if an enhanced test rig with the capability of cooling to lower temperatures was installed, the PCD would demonstrate even better temperature stabilisation and higher apparent specific heat capacities.
Figure 6 and Figure 7 show the local heat transfer coefficients and local Nusselt numbers for the PCD in experiments 1 and 2, respectively. Additionally, the local Nusselt and heat transfer coefficients for water are shown for the same operational conditions at the same Reynolds number. Figure 6 shows that the local heat transfer coefficient increased along the length of the tube for experiment 1. However, for experiment 2, the local heat transfer coefficient increased until 11.3 m, and then decreased. The average heat transfer coefficient for experiment 1 was 2725 W m 2 K 1 , and for experiment 2, it was 2450 W m 2 K 1 . It is to be noted that the lower value in experiment 2 most likely resulted from the lower Reynolds number used. Despite this, experiment 2 showed higher values for the local heat transfer coefficient at the outlet in Section 1 and Section 2 than in experiment 1. This could be due to the higher heating rate employed in experiment 1; when a higher heating rate is applied to a wall, the PCM will melt at the wall, which eventually limits the convective heat transfer through the wall, as it acts as the thermal conductivity of the melted PCD is lower than when solidified. The local Nusselt numbers for experiment 1 and experiment 2 can also be seen in Figure 6 and Figure 7, respectively. The local Nusselt numbers followed the same trend as that of the local heat transfer coefficients.
As shown in Figure 6, experiment 1 showed similar local heat transfer coefficients for water and for the PCD, but much higher local Nusselt numbers for the PCD than for water, with an average Nusselt enhancement of 12%. Figure 7 shows that for experiment 2, both the local heat transfer coefficients and local Nusselt numbers were higher for PCD than for water at the same Reynolds number. The average Nusselt enhancement across the length of the tube for experiment 2 was 23%. The lower heat flux used in experiment 2 could be the reason for the higher Nusselt enhancement. Morimoto and Kumano [19] found that applying a higher heat flux to the wall decreased the local heat transfer coefficient in the PCD. Morimoto and Kumano [19] suggested that this is because applying a lower heat flux means that the heat applied to the wall is distributed primarily to the latent heat of the melting of the PCM. However, when a higher heat flux is applied, some of the supplied heat is distributed to the sensible heating region of the PCD because the temperature difference between the wall and the bulk is higher than at relatively lower heat fluxes.

4. Conclusions

A novel PCD based on a fatty acid in water was investigated for its heat transfer behaviour in a circular pipe under the constant heat flux boundary condition. The DSC analysis showed that the PCD had a melting range in which latent heat was absorbed between 45 and 50 °C, with a peak melting temperature of 50 °C, which indicates an ideal melting temperature for the envisioned application in the cooling and temperature stabilisation of an HVDC converter. The merit of using the PCD was shown in the evolution of the bulk temperatures along the length of the tube, whereby bulk temperature reductions of 1.5 and 2 K were observed for experiments 1 and 2, respectively, compared to water under the same operational conditions. This reduction in temperature compared to the current industrial cooling standard (water) is extremely promising in terms of temperature stabilisation and, thus, the overall energy consumption of the cooling system. From the apparent specific heat capacities that were calculated along the length of the tube, it was found that this reduction of the temperature resulted from an increase in the heat capacity of the fluid compared to that of water. The maximum increase was found to be over 50% for the PCD compared to water. This enhanced heat capacity eventually reduces the volumetric flow rate of the pump and, thus, contributes to a reduction in the pumping power and energy consumption of the system. Additionally, two experiments were performed with different operating conditions to demonstrate the promising heat transfer performance of the PCD compared to water. In both experiments, the local heat transfer coefficients and local Nusselt numbers were higher for the PCD than for water, with Nusselt enhancements of 12% for the first set of experimental conditions and 23% for the second set of experimental conditions. The preliminary heat transfer results thus pave the way for the future optimisation of operational conditions, such as the heat input and mass flow rate, to be applied for experimentation and, eventually, applications. An additional and important operational condition is the inlet temperature used. As mentioned before, in this investigation, a range of inlet conditions could not be tested due to the large degrees of supercooling observed for the PCD. It is therefore suggested by the authors that, in future work, a screening of suitable nucleating agents can be performed in order to reduce the supercooling of the PCM. A further future research point is to screen for suitable surfactant systems; the DSC in this investigation revealed that after continuous operation, 50% of the total heat capacity of the PCD was lost. This was assumed to be a result of a freezing-out mechanism of the PCM from the continuous water phase. It is suggested that, in future work, this loss of capacity can be subjected to further investigation. Despite the aforementioned limitations, this paper presents preliminary results that demonstrate the potential temperature stabilisation and heat transfer capabilities of PCDs as novel HTFs. Additionally, the paper presents the heat transfer performance of a bio-based PCD that, to the authors’ knowledge, is the first to be investigated for its heat transfer properties.

Author Contributions

Conceptualisation, J.W., L.F., E.M. and G.Q.; methodology, S.v.A.; formal analysis, P.O. and S.v.A.; investigation, S.v.A.; resources, J.W., Q.L., L.F. and Y.D.; writing—original draft preparation, P.O.; writing—review and editing, P.O.; supervision, J.W., L.F., E.M. and Y.D.; project administration, J.W., L.F., E.M., G.Q. and Y.D.; funding acquisition, J.W., L.F. All authors have read and agreed to the published version of the manuscript.

Funding

This research was funded by the “Cooling of converters by using phase change materials” project of the State Grid Corporation of China and the Global Energy Interconnection Research Institute Europe GmbH (No. SGRIWLZXQT[2017]882).

Institutional Review Board Statement

Not applicable.

Informed Consent Statement

Not applicable.

Data Availability Statement

Not applicable.

Acknowledgments

The authors gratefully acknowledge the financial support from the aforementioned funding body. Additionally, the paper was a collaboration between three research groups: Lucerne University of Applied Sciences, the University of Birmingham, and Global Energy Interconnection Research Institute Europe.

Conflicts of Interest

The authors declare no conflict of interest.

Abbreviations

The following abbreviations are used in this manuscript:
Roman LettersParameter
aThermal diffusivity (m 2 s 1 )
AArea (m 2 )
CpApparent specific heat capacity (J kg 1 K 1 )
dInner diameter of the pipe (m)
hConvective heat transfer coefficient (W m 2 K 1 )
HPhase change enthalpy (kJ kg 1 )
LLength of pipe (m)
Mass flow rate (kg s 1 )
PPower (W)
Heat transfer rate (W)
rRadius (m)
tTime (s)
TTemperature (°C)
Dimensionless Numbers
NuNusselt number
PrPrandtl number
ReReynolds number
SteStefan number
Subscripts
bBulk fluid
wWall
elelectrical
Greek Letters
μ Dynamic viscosity (mPa·s)
λ Thermal conductivity (W m 1 K 1 )
ρ Density (kg m 3 )
Abbreviations
HVDCHigh-voltage direct-current
PCMPhase change material
PCDPhase change dispersion
PSDParticle size distribution
FAEFatty acid ester
NANucleating agents
DSCDifferential scanning calorimeter
MPCMSMicroencapsulated phase change material slurry
HTFHeat transfer fluid

References

  1. O’Neill, P.; Fischer, L.; Revellin, R.; Bonjour, J. Phase change dispersions: A literature review on their thermo-rheological performance for cooling applications. Appl. Therm. Eng. 2021, 192, 116920. [Google Scholar] [CrossRef]
  2. Fischer, L.J.; von Arx, S.; Wechsler, U.; Züst, S.; Worlitschek, J. Phase change dispersion, potentially a new class of heat transfer fluids. J. Phys. Conf. Ser. 2016, 745, 032133. [Google Scholar] [CrossRef] [Green Version]
  3. Wang, F.; Lin, W.; Ling, Z.; Fang, X. A comprehensive review on phase change material emulsions: Fabrication, characteristics, and heat transfer performance. Sol. Energy Mater. Sol. Cells 2019, 191, 218–234. [Google Scholar] [CrossRef]
  4. Shao, J.; Darkwa, J.; Kokogiannakis, G. Review of phase change emulsions (PCMEs) and their applications in HVAC systems. Energy Build. 2015, 94, 200–217. [Google Scholar] [CrossRef] [Green Version]
  5. Delgado, M.; Lázaro, A.; Mazo, J.; Zalba, B. Review on phase change material emulsions and microencapsulated phase change material slurries: Materials, heat transfer studies and applications. Renew. Sustain. Energy Rev. 2012, 16, 253–273. [Google Scholar] [CrossRef]
  6. Wang, F.; Fang, X.; Zhang, Z. Preparation of phase change material emulsions with good stability and little supercooling by using a mixed polymeric emulsifier for thermal energy storage. Sol. Energy Mater. Sol. Cells 2018, 176, 381–390. [Google Scholar] [CrossRef]
  7. Morimoto, T.; Sugiyama, M.; Kumano, H. Experimental study of heat transfer characteristics of phase change material emulsions in a horizontal circular tube. Appl. Therm. Eng. 2021, 188, 116634. [Google Scholar] [CrossRef]
  8. Delgado, M.; Lázaro, A.; Mazo, J.; Peñalosa, C.; Dolado, P.; Zalba, B. Experimental analysis of a low cost phase change material emulsion for its use as thermal storage system. Energy Convers. Manag. 2015, 106, 201–212. [Google Scholar] [CrossRef]
  9. Fischer, L.; Mura, E.; O’Neill, P.; von Arx, S.; Worlitschek, J.; Qiao, G.; Li, Q.; Ding, Y. Thermophysical properties of a phase change dispersion for cooling around 50 °C. Int. J. Refrig. 2020, 119, 410–419. [Google Scholar] [CrossRef]
  10. Puupponen, S.; Seppälä, A.; Vartia, O.; Saari, K.; Ala-Nissilä, T. Preparation of paraffin and fatty acid phase changing nanoemulsions for heat transfer. Thermochim. Acta 2015, 601, 33–38. [Google Scholar] [CrossRef]
  11. Zhang, Z.; Yuan, Y.; Zhang, N.; Cao, X. Experimental investigation on thermophysical properties of capric acid–lauric acid phase change slurries for thermal storage system. Energy 2015, 90, 359–368. [Google Scholar] [CrossRef]
  12. Zhang, Z.; Yuan, Y.; Zhang, N.; Cao, X. Thermophysical properties of some fatty acids/surfactants as phase change slurries for thermal energy storage. J. Chem. Eng. Data 2015, 60, 2495–2501. [Google Scholar] [CrossRef]
  13. Li, Q.; Qiao, G.; Mura, E.; Li, C.; Fischer, L.; Ding, Y. Experimental and numerical studies of a fatty acid based phase change dispersion for enhancing cooling of high voltage electrical devices. Energy 2020, 198, 117280. [Google Scholar] [CrossRef]
  14. Li, Q.; Fischer, L.; Qiao, G.; Mura, E.; Li, C.; Ding, Y. High performance cooling of a HVDC converter using a fatty acid ester-based phase change dispersion in a heat sink with double-layer oblique-crossed ribs. Int. J. Energy Res. 2020, 44, 5819–5840. [Google Scholar] [CrossRef]
  15. Kang, S.S. Advanced cooling for power electronics. In Proceedings of the 2012 7th International Conference on Integrated Power Electronics Systems (Cips), Nuremberg, Germany, 6–8 March 2012; pp. 1–8. [Google Scholar]
  16. Wang, F.; Cao, J.; Ling, Z.; Zhang, Z.; Fang, X. Experimental and simulative investigations on a phase change material nano-emulsion-based liquid cooling thermal management system for a lithium-ion battery pack. Energy 2020, 207, 118215. [Google Scholar] [CrossRef]
  17. Kabalyk, Y. Determination of energy loss in power voltage inverters for power supply of locomotive traction motors. Procedia Eng. 2016, 165, 1437–1443. [Google Scholar] [CrossRef]
  18. Fischer, L.; Maranda, S.; Stamatiou, A.; von Arx, S.; Worlitschek, J. Experimental investigation on heat transfer with a phase change dispersion. Appl. Therm. Eng. 2019, 147, 61–73. [Google Scholar] [CrossRef]
  19. Morimoto, T.; Kumano, H. Flow and heat transfer characteristics of phase change emulsions in a circular tube: Part 2. Turbulent flow. Int. J. Heat Mass Transf. 2018, 117, 903–911. [Google Scholar] [CrossRef]
Figure 1. Schematic of the experimental test-rig used in this experimental investigation. The measuring section is highlighted. The figure was adapted from [18].
Energies 14 04899 g001
Figure 2. (a) Particle size distributions for the PCD used in this investigation before it was thermo-mechanically cycled and after it was cycled. (b) DSC analysis before and after the PCD was thermo-mechanically cycled for several weeks.
Energies 14 04899 g002
Figure 3. The evolution of the bulk and wall temperatures for the PCD for experiment 1 alongside the bulk temperatures calculated for water along the length of the tube.
Energies 14 04899 g003
Figure 4. The evolution of the bulk and wall temperatures for the PCD in experiment 2 alongside the bulk temperatures calculated for water along the length of the tube.
Energies 14 04899 g004
Figure 5. The apparent specific heat capacities calculated for different sections of the tube for the PCD in both experiment 1 and experiment 2. The apparent specific heat capacities of water are also shown.
Energies 14 04899 g005
Figure 6. The local heat transfer coefficients and local Nusselt numbers for the PCD in experiment 1. Additionally, the local heat transfer coefficients and local Nusselt numbers for water at the same Reynolds number are shown.
Energies 14 04899 g006
Figure 7. The local heat transfer coefficients and local Nusselt numbers for the PCD in experiment 2. Additionally, the local heat transfer coefficients and local Nusselt numbers for water at the same Reynolds number are shown.
Energies 14 04899 g007
Table 1. Geometrical details of the components in the experimental test rig.
Material of the tubesStainless steel 1.401/304L
Inner diameter of the pipe (d)14 mm
Wall thickness of the pipe3 mm
Total length of the heated part of the pipe15.966 m
Total length of the measuring section16.05 m
Material of the flangeStainless steel 1.4404/316L
Flange thickness14 mm
Length of the inlet section140 mm
Material of the springStainless steel
Diameter of the spring3 mm
Pitch of the spring6.36 mm
Thickness of insulation50 mm
Table 2. Specifications and details of all types of sensors used.
SensorManufacturerTypeRangeUncertainty
T b (T101/03/05/07)Roth+Co AGPT100 4 wire, A−65–200 °C0.03 °C
T w (T102/04/06/08)Roth+Co AGPT100 4 wire, A−65–200 °C0.03 °C
Coriolis, m ˙ Endress+HauserF83, Type 4x0–6500 m ˙ 0.004
Electrical power, P e l Jumo GmbHJUMO TYA 2010–4 kW0.002 P e l
Table 3. The operational parameters used for the initial testing of the phase change dispersion.
Experiment Number m ˙ (kg h 1 )Reynolds Number (-)T b , in (°C)Electrical Heat Input (kW)
1500435743.73.2
2375320043.92.5
Publisher’s Note: MDPI stays neutral with regard to jurisdictional claims in published maps and institutional affiliations.

