Abstract
Advancements in wind turbine condition monitoring systems over the last decade have made it possible to optimise operational performance and reduce costs associated with component failure and other unplanned maintenance activities. While much research focuses on providing more automated and accurate fault diagnostics and prognostics in relation to predictive maintenance, efforts to quantify the impact of such strategies have to date been comparatively limited. Through time-based simulation of wind farm operation, this paper quantifies the cost benefits associated with predictive and condition-based maintenance strategies, taking into consideration both direct O&M costs and lost production. Predictive and condition-based strategies have been modelled by adjusting known component failure and repair rates associated with a more reactive approach to maintenance. Results indicate that up to 8% of direct O&M costs can be saved through early intervention along with up to 11% reduction in lost production, assuming 25% of major failures of the generator and gearbox can be diagnosed through advanced monitoring and repaired before major replacement is required. Condition-based approaches can offer further savings compared to predictive strategies by utilising more component life before replacement. However, if weighing up the risk between component failure and replacing a component too early, results suggest that it is more cost effective to intervene earlier if heavy lift vessels can be avoided, even if that means additional major repairs are required over the lifetime of the site.
1. Introduction
Maintenance strategies have evolved over the last decade in line with increased turbine size, changes in wind turbine technology and reduction in capital expenditure relative to power output [1,2]. With sites now designed for higher average wind speeds in more remote geographical locations (particularly offshore), it is imperative that O&M costs are as low as possible to keep the overall LCOE down [3]. One way of achieving this is by employing improved maintenance strategies, made possible with increased monitoring capabilities, improved digitilisation and more in-depth analysis of data [4]. This allows engineers and operators to assess asset performance, understand reliability and make informed maintenance decisions that can drive down costs over the lifetime of the site, maximising availability. With this in mind, machine learning has a large role to play in automating both monitoring and analysis activities across a fleet, allowing engineers to focus their efforts on more complex decisions regarding faults and under-performance. The majority of literature in this area focuses on applications of machine learning on various operational data, aiming to more autonomously and accurately diagnose faults and predict failure of key drivetrain components without quantifying the potential costs savings of implementing such approaches [5]. Focusing on offshore wind farms (where the biggest costs savings can be made), this paper aims to quantify the operational cost savings of predictive maintenance strategies over the lifetime of a wind farm with respect to gearbox and generator failures, which are commonly associated with the largest wind turbine downtime per failure [6]. Without a true understanding of operational economic benefits, any prospective maintenance strategy based on turbine condition cannot be understood. Additionally, the initial outlay for the CM system and associated costs cannot be justified [7]. A basis to form such justifications is what this paper aims to provide.
Potential cost savings are assessed by firstly calculating a range of predicted failure and repair rates associated with maintenance strategies enabled by different levels of condition monitoring (CM) capabilities. These predicted intervention rates are supplied as inputs into a cost model that simulates wind farm O&M costs over its lifetime. Costs are compared to a benchmarked O&M cost of known failure rates connected to a more reactive approach to maintenance. Results presented aim to provide clarity into how different fault detection and repair rates translate into direct O&M costs savings for offshore wind farms, assuming major components can be repaired before failure, and relating these cost savings back to different maintenance strategies. It is expected that maximum savings will be made by avoiding as many major component failures as possible while maximising component life before each repair. This scenario would occur through a condition-based maintenance strategy.
2. Literature Review
In an effort to optimise CMS activities, machine learning techniques are increasingly being used to enhance wind turbine diagnostics and prognostics, with extensive publications and multiple review papers having been published in recent years which can be found in [8,9,10]. In one such comprehensive review by Stecto et.al in 2018 [11], models were classified by typical ML steps, including data sources, feature selection and extraction, model selection (classification, regression), validation and decision making. Findings showed that most models use SCADA or simulated data, with almost two-thirds of methods using classification and the rest relying on regression. Neural networks, support vector machines and decision trees are most commonly used, with more recent papers now combining techniques and data sources to optimise performance such as [12,13].
With regards to reliability, there have been several studies to date investigating the failure rates of wind turbines and their subassemblies, which is a crucial aspect to correctly analyse costs related to wind farm OPEX. One such study in 2007, which shows failure rates and associated downtime, was obtained from analysing 1500 German turbines over a 15 year period [14]. It should be noted that while this is a large population, the majority of turbines are rated under 1 MW, which is relatively small when compared to the 10–12 MW machines being installed offshore today. Another study worth mentioning by Spinato in 2009 [15], consists of a dataset of more than 6000 wind turbines in Denmark and Germany over an 11 year period. In 2010, a similar study by Reliawind [16], uses larger, more modern wind turbines and calculates failure rates that are remarkably consistent with the top end of the scale found in [15]. In 2015, Carroll [6], considers a dataset of 2222 wind turbines, each of the same power rating of between 1.5 and 2.5 MW. They differ only by their generator and drivetrain configuration and have been categorised into two groups for the study. The first configuration in the analysis is a doubly fed induction generator (DFIG), with the second being a permanent magnet generator (PMG) with fully rated converter (FRC). All turbine generators and converters are in their first 5 years of operation and located in wind farms throughout Europe. Key findings when comparing DFIG and PMG configurations showed that PMG had a failure rate 40% lower to that of the DFIG, which actually could be lowered further if minor failures related to its cooling and lubrication system were not included in [6]. Spinato’s study [15], also suggests that direct-drive machines (DD) are not necessarily more reliable when compared to their geared counterpart. In fact, if you take into consideration the aggregated failure intensity of the generator and converter in the DD machine, it is greater than that of the gearbox, generator and converter in geared-drive wind turbines. Finally, in a more recent study in 2018 [17], Artigao identified thirteen reliability studies in scientific literature to review. This work made an effort to unify the various studies to obtain comparable results. Failure rates are normalised and reveals that the control system, gearbox, electric system, generator and hub and blades are the most critical assemblies with regards to wind turbine condition monitoring. Taking into account the top-three contributors to failure rates for each study, the most recurrent ones across all studies are the electric, control and yaw systems, and hub and blades categories; for downtime these are the gearbox, generator, and braking and electric system. Mechanical and electrical/control components show similar failure rates. However, mechanical components cause higher amount of downtime when compared to electrical/control ones, reaching more than 75% of the total downtime.
Not much literature exists when it comes to quantifying the impact of predictive maintenance strategies on wind farm OPEX. A review on reliability and its impact on cost of energy for wind is given in [18]. One attempt of quantifying the impact of costs and revenue can be found in [2]. The influence of extending potential-to-functional failure intervals has on offshore wind turbine availability is explored in [19].
3. Methodology and Model Overview
To ensure a robust analysis of O&M costs for different maintenance strategies, a number of hypothetical offshore sites were analysed of varying size (number of turbines) and distance from shore. This allowed changes in downtime, vessel costs, total repair costs and times to be analysed and compared with different component failure rates. Data used for both wind and sea state was assumed to be the same for all hypothetical sites.
3.1. Methodology
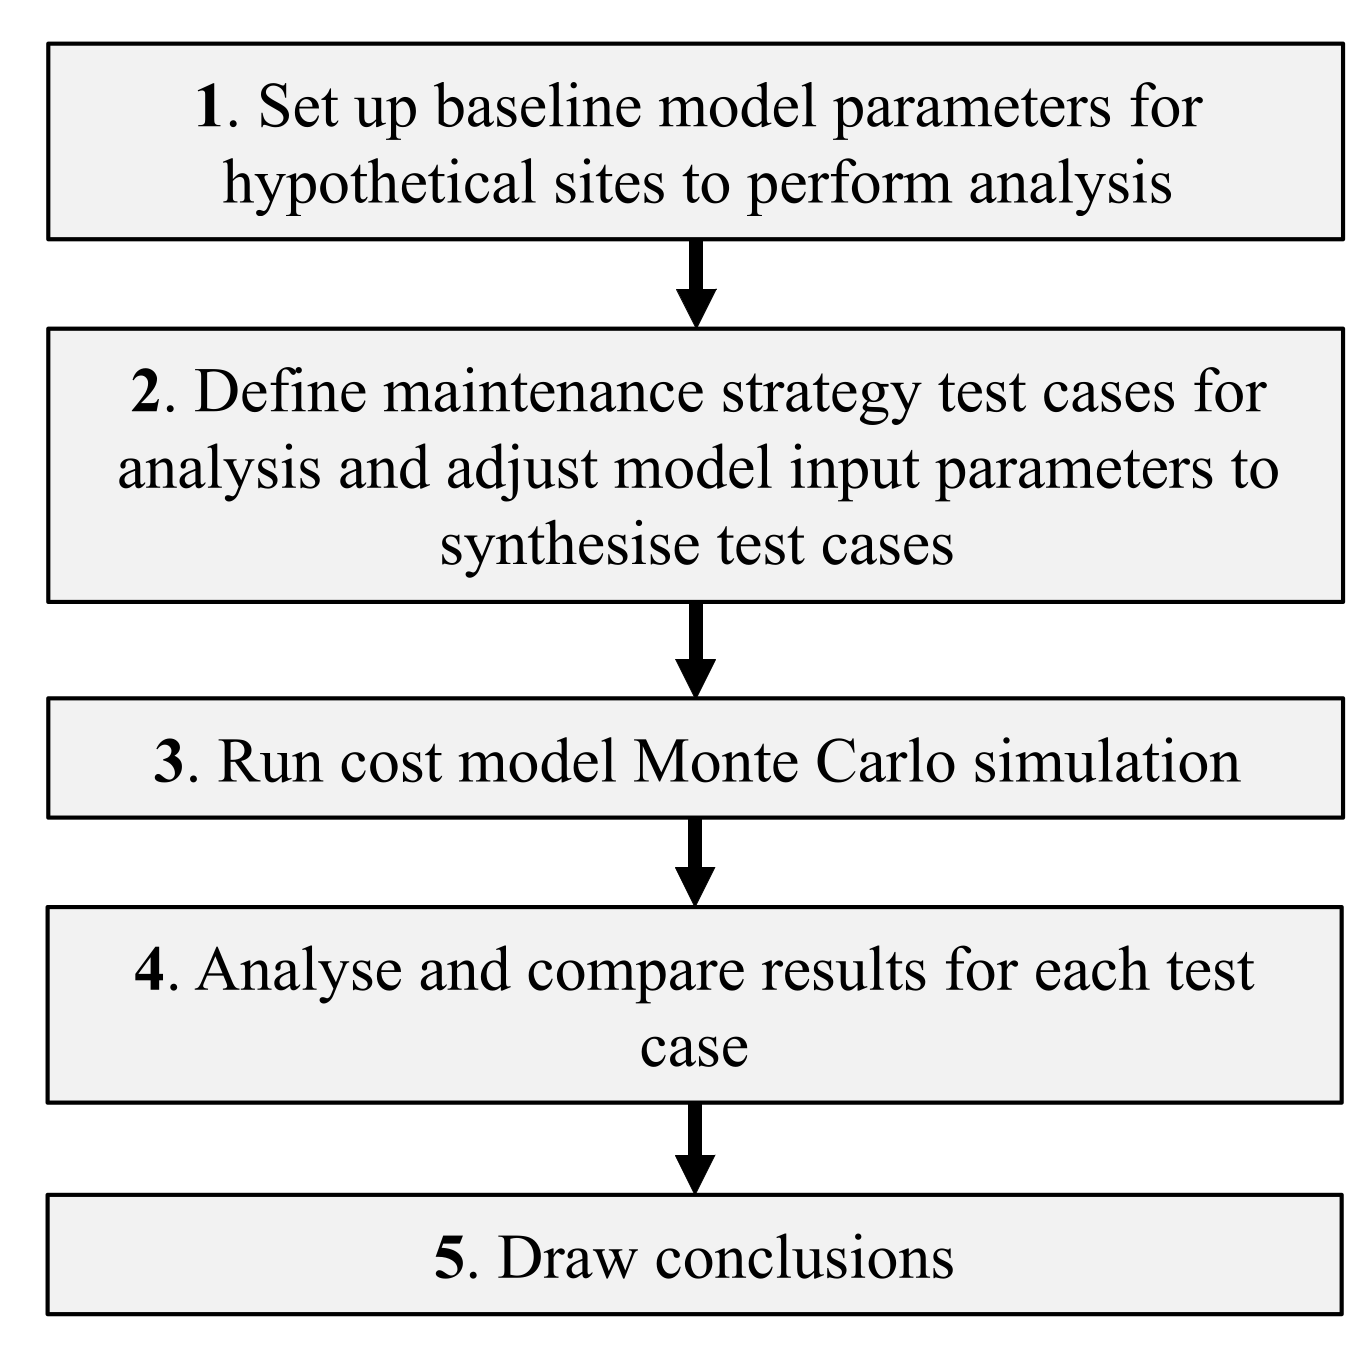
Figure 1 shows the step by step approach taken to perform the analysis. As the quality of results obtained was highly dependent on setting the correct inputs for each case, time was first taken to become familiar with the model and adjustable parameters (the cost model utilised is described in more detail in the next section). From here, the baseline model parameters were chosen for each hypothetical site, as described in Section 3.3. Test cases were then defined that could synthesise each of the maintenance strategies. These are detailed in Section 3.4. Finally, the models could be run, outputs analysed for each maintenance strategy across different sites and conclusions formed.

Figure 1.
Overall approach to analysis.
3.2. O&M Cost Model Description
The benchmarked O&M cost model used throughout this analysis was developed by the University of Strathclyde and is a time-based simulation of operations of an offshore wind farm over its lifetime. To provide an overview, a Monte Carlo Markov Chain is used to model failure behaviour, with maintenance operations simulated based on both site conditions and available resources. Model input parameters are used to determine these constraints over the lifetime of the asset operations. The model has the capability to calculate availability, turbine downtime, power production and maintenance resource allocation of the simulated wind farm, along with associated costs. Lost revenue is determined from the power produced at each simulated wind speed time step. Losses associated with electrical transmission and wind farm arrays are represented by efficiency coefficients, with the value of power produced determined by a combination of the market price of electricity and the value of UK support mechanisms. It should be noted that these costs may not reflect current prices. However, they are still valid to give a good indication of changes in price with differing strategies. The lost revenue cost due to maintenance is calculated using availability of the wind farm, which is defined as the number of operational turbines divided by the total number of turbines. Wind distribution is characterised by a two-parameter Weibull curve. However, climate data more broadly consisted of wind speed, wave height and wave period, each of which had its own seasonal variability which influenced both generation capacity and accessibility over the year. The expected repair cost of each intervention category was provided by the industrial partner for the 3 stage PMG FRC wind turbine configuration.
This paper will focus on analysing costs for both operations and maintenance of theoretical sites. However, we will discuss results in relation to overall availability, downtime and power production. A diagram describing model inputs and outputs, as well as the key features of the simulation loop can be found in Figure 2. Full details of the model with all interdependencies can be found in [20,21].
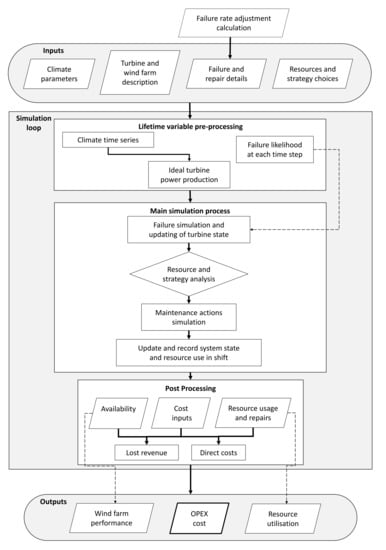
Figure 2.
Simplified cost model structural overview, adapted from [20].
3.3. Theoretical Site Characteristics
Four different offshore wind farms were simulated of different sizes and distances from shore. Three distances of 25, 50 and 100 km were chosen to represent “near”, “mid” and “far” offshore sites. To then understand the effect of wind farm size on costs, two different sizes of 50 and 100 turbines were also chosen to represent “medium” and “large” sites. A 3 stage PMG FRC turbine was utilised throughout the analysis, for which representative failure rates were gathered and used based on [22]. The assumed cut-in speed was 3 m/s, with a rated wind speed of 15.5 m/s and cut-out speed of 25 m/s. Although this technology is not representative of some of the larger turbines currently being installed offshore, it does offer an opportunity for more trusted reliability rates to be used over a larger population of operational turbines. Water depth was not considered with all turbines assumed to have the same fixed bottom foundations. For all sites modelled, it was assumed that each had the same weather and climate characteristics as per FINO climate data from an offshore research platform. The site chosen to represent the climate of all cases was located 45 km offshore in the North Sea, and corresponds to both existing and future wind farms currently being developed. Although different sea state data may improve analysis authenticity by avoiding this assumption, having the same sea states allows for a direct comparison between distances and sizes to be made. The same wind speed is also used across each site, which as found in [22], is a valid assumption based on the observed mean wind speeds across 60 offshore wind farms in operation ranging from 1 km to just over 200 km from shore, which showed less than 2% deviation. Each wind farm simulated utilised a modern multi-MW offshore wind turbine with rated power between 2 and 4 MW. However, the exact power rating cannot be provided for confidentiality reasons.
3.4. Types of Maintenance Strategies
There are several terms observed in literature to describe the different maintenance strategies, which are not always exactly the same. For clarity, Table 1 defines each strategy terminology as used in this paper with respect to component replacement. Four strategies are described including preventative, reactive, predictive and condition-based. However, it will be the latter two that will form much of the analysis.

Table 1.
Maintenance strategy definitions.
Preventative maintenance is the act of performing routine maintenance that will minimise the risk of faults developing in the first place. This type of strategy is inefficient, does not utilise a components full design life and is wasteful of both materials and technician time performing the work. It allows for a less hands on approach to condition monitoring.
Reactive maintenance allows components to run to failure, making use of their entire design life, but risking other components health at failure. This type of strategy reduces cost of routine O&M while providing a hands-off approach to condition monitoring. However, this means more expensive replacements and more downtime while waiting for spare parts.
Predictive maintenance and condition-based maintenance are similar in nature and can often be used interchangeably in literature. They both require condition monitoring to detect faults and engineers to assess component condition and make a prognosis to some extent. Predictive maintenance involves acting on that prognosis, and perhaps reassessing if condition does worsen. The goal of this is to perform maintenance activity at as low a cost as possible within a suitable time frame once a fault is confirmed. Some design life will naturally be compromised for minimising risk of extended periods of downtime.
Condition-based maintenance aims to get extra life out of the component by continuously monitoring component health and setting hard upper limits for maintenance. Damage progression is not always predictable and therefore there is added risk here of further damage to additional components or even assemblies within the drivetrain. This can increase the cost of maintenance activities further down the line.
3.5. Analysis Cases
Analysis cases will attempt to synthesise scenarios to represent the maintenance strategies described above. Before describing how this is achieved, Table 2 details how intervention types are categorised for a generator and gearbox within the cost model. Each intervention type has distinctive constraints and resource requirements which must be met when looking for suitable windows to perform the work. It should be noted that a major replacement requires a heavy lift vessel (HLV) in either case, while both major and minor repairs only require a crew transfer vessel (CTV). This is key, as by intervening earlier HLV costs can be avoided by performing a major repair rather than a major replacement.
Table 2.
Intervention categories.
The premise of this analysis is the underlying assumption that as certain faults are left unaddressed, through time damage has the potential to worsen and spread throughout a component or assembly. This can eventually lead to failure, more expensive repairs or replacements along with additional inspections over the life of the fault progression. There may also be higher refurbishment costs if the component is to be re-used. Inversely, leaving the component running fundamentally extends the life of the component, reduces the risk of premature replacement or repair with little to no observed damage or change after intervention. This will ultimately increase the mean time between failures for a site. In other words, each strategy has its own unique opportunity cost that must be considered. It should be noted that this analysis does not attempt to take into consideration O&M and asset management contracts (such as warranty periods) that may affect decision making.
To summarise, moving from reactive maintenance to predictive or condition-based maintenance should cause a decrease in major replacements and an increase in major repairs. Distinguishing between predictive and condition based will depend on how much the failure rates are adjusted, which will be explained in detail in Section 3.5.2.
3.5.1. Baseline Failure Rates
The baseline failure rates used for the model can be found in Table 3, taken from [23]. The assemblies used were “Generator”, “Gearbox”, “Converter” and “Rest of Turbine”, each broken down into intervention categories “Major Replacement”, “Major Repair” and “Minor Repair”. Although these were the categories used when setting up the model parameters, only gearbox and generator failures were considered and adjusted for the purposes of this analysis. Rates were adjusted for both major replacements and major repairs as described in the below section, with minor repairs remaining constant for every component/assembly category. This baseline represented a reactive maintenance strategy, whereby some components were ran to failure before being replaced.
Table 3.
Baseline failure rates [23].
3.5.2. Adjusted Failure Rates
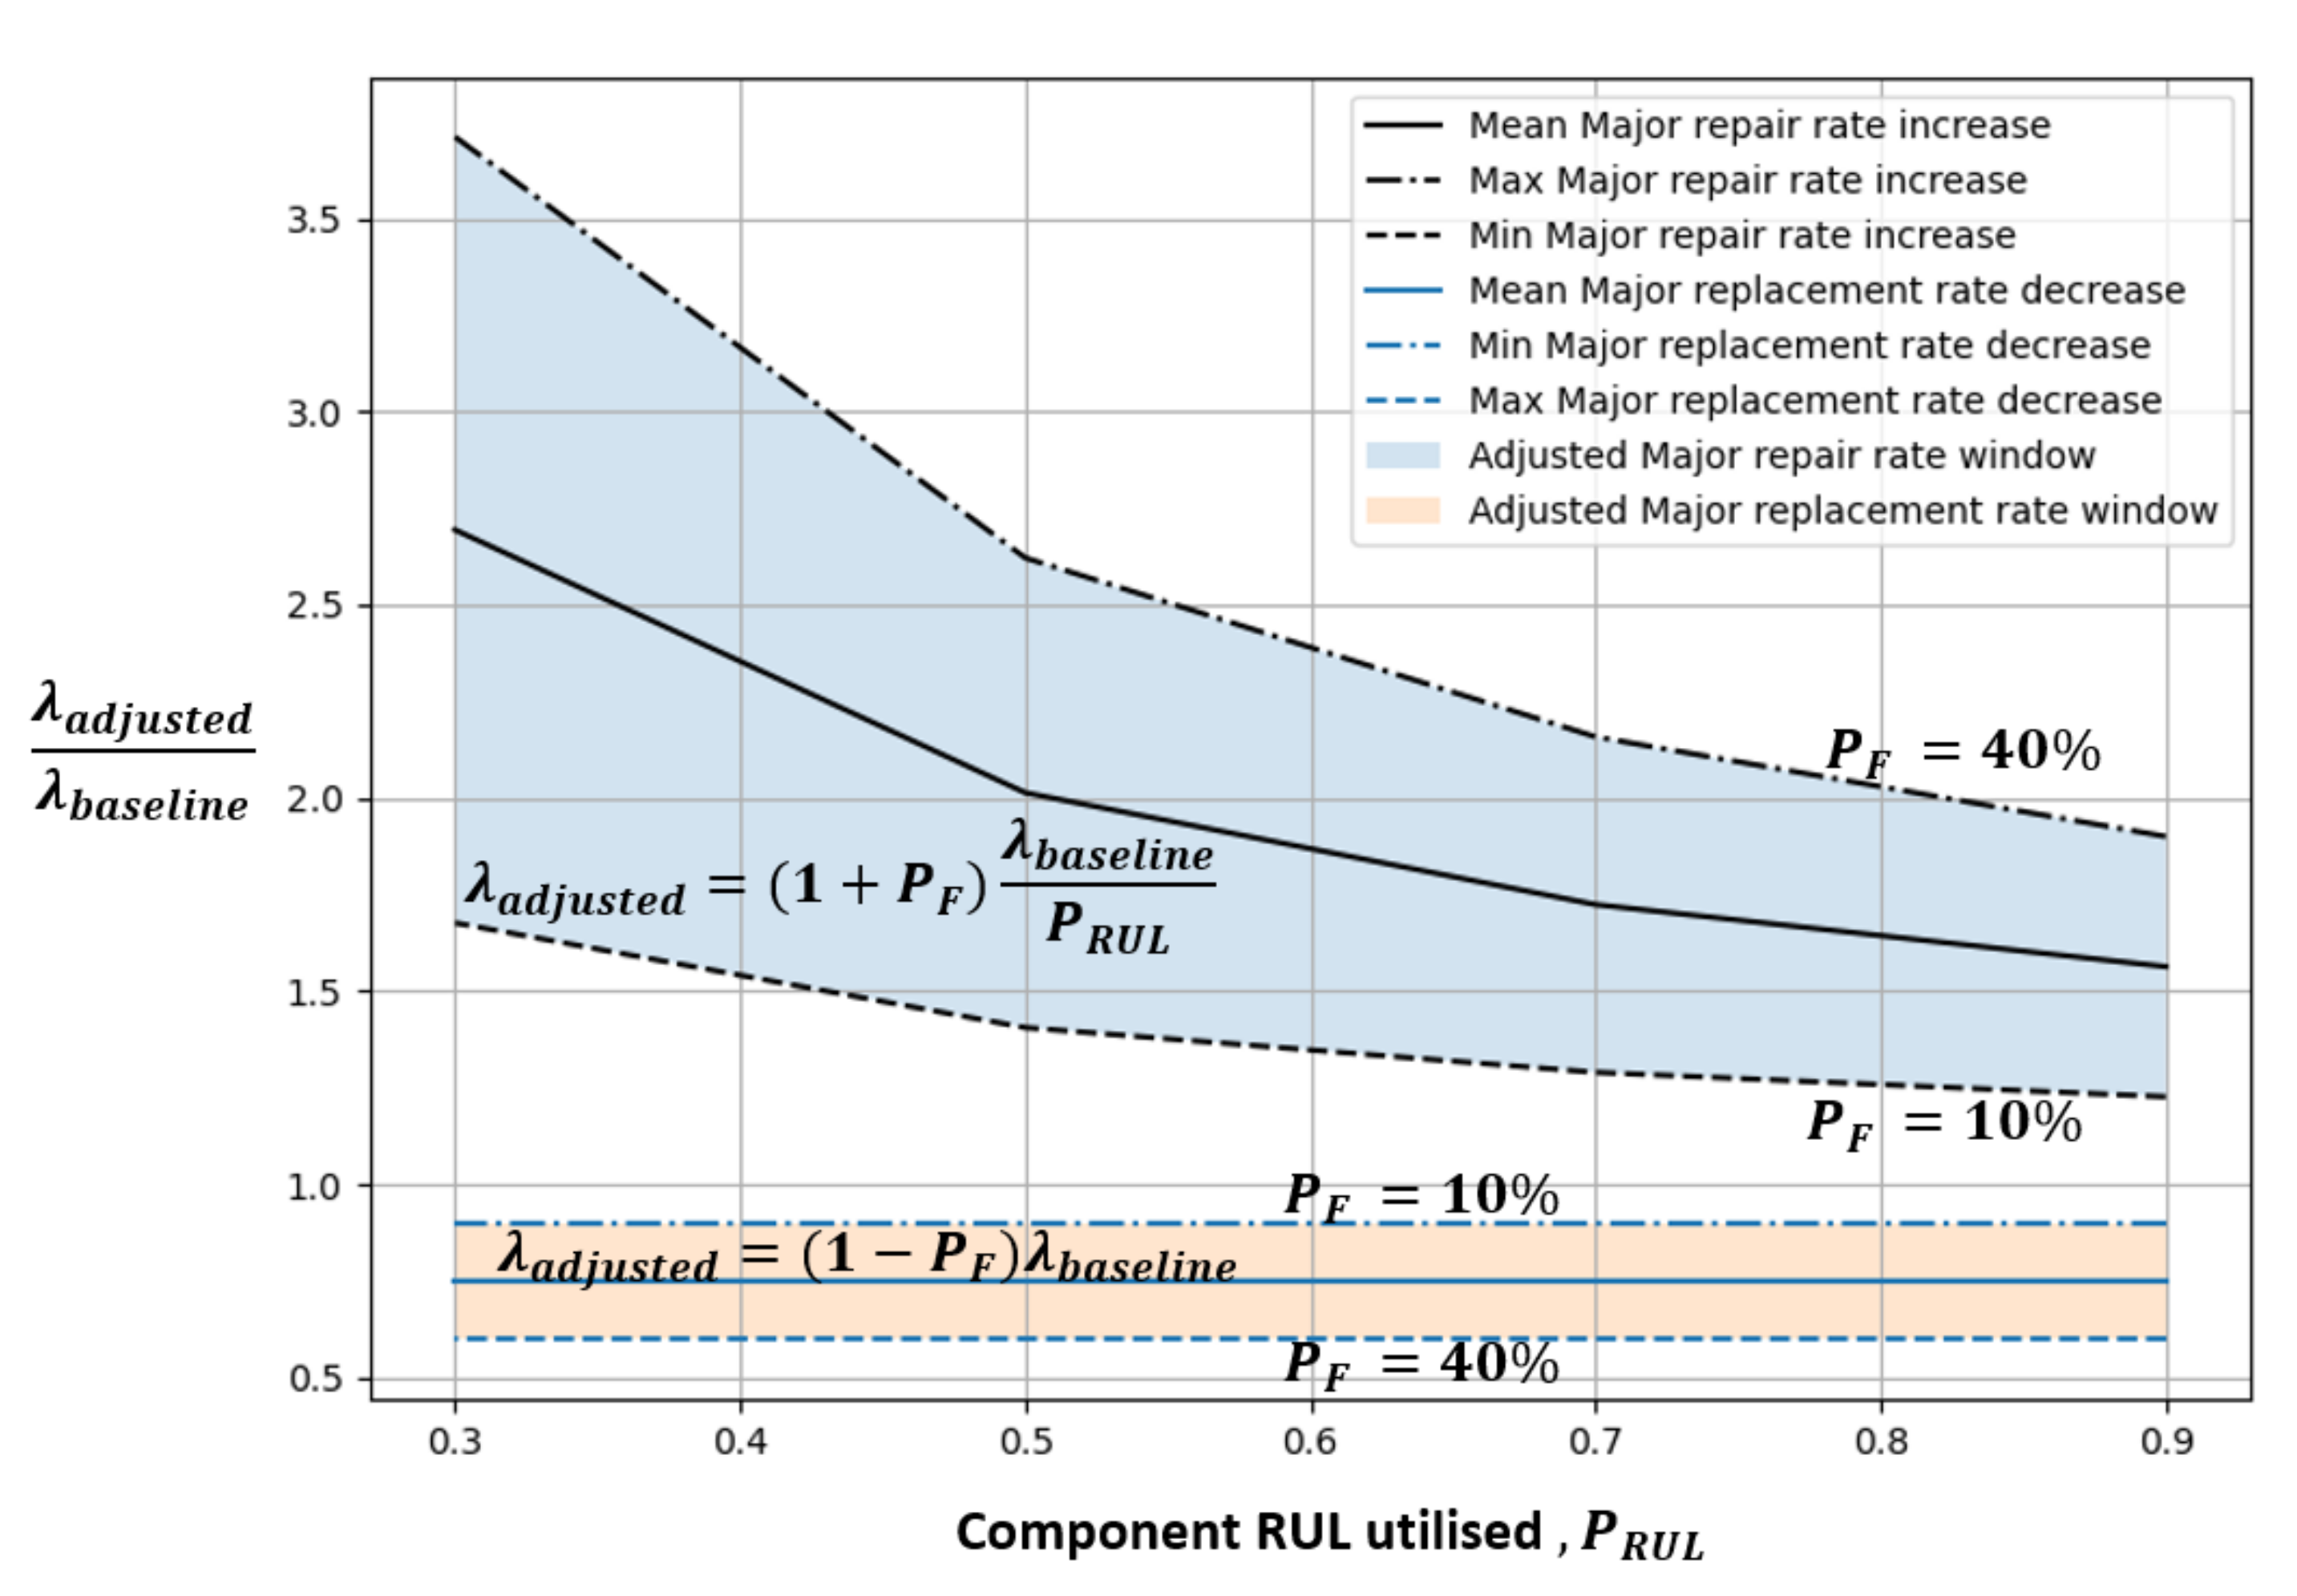
Predictive and condition-based maintenance strategies will be represented by altering the failure rate of each intervention category. The failure rates per turbine per year for both the generator and gearbox were adjusted from the baseline as per the following equations:
where is the failure rate, is the percentage of additional failures per turbine per year that are diagnosed and are repairable in line with the explanation of repair categories above, and is the percentage of component remaining useful life that is utilised prior to repair (but before failure when a major replacement is required). It is difficult to set a definitive number for as it is impossible to understand the root cause of every major replacement and determine if the failure could have been avoided with better condition monitoring practices and earlier intervention. A range of values between 10% and 40% are therefor used to account for this uncertainty. With regards to , the baseline assumes a value of 100% as the component was run to failure for all major replacements as per the reactive maintenance strategy. For a predictive maintenance strategy, the lower the percentage of , the earlier the repair took place, ultimately leading to a higher rate of major repairs over a wind farm life. Values of 30%, 50%, 70% and 90% were used for each scenario to understand the effects of earlier repair on the cost of maintenance activities, as described for each analysis case in Table 4. This gave a total of 16 different hypothetical wind farms to be simulated per scenario along with the scenario baseline simulation.
Table 4.
Analysis cases.
Figure 3 shows the adjusted failure rate in relation to and the baseline failure rate (for which the ). For the range of values described above, the major replacement rate is reduced as per Equation (1), and does not have any dependency on . Conversely, the major repair rate increases as per Equation (2), with lower values causing a larger increase in repair rate.
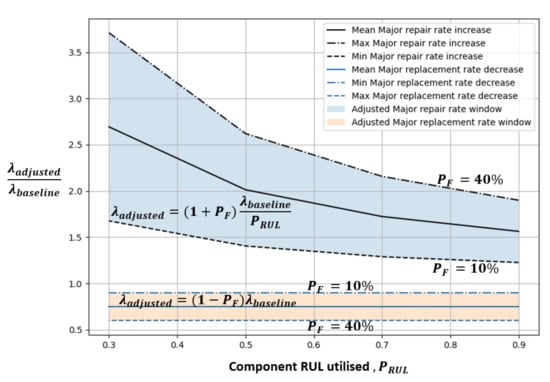
Figure 3.
Adjusted failure rates.
4. Results
4.1. Baseline O&M Costs
First of all, the baseline costs are considered, which for this analysis will form the reactive maintenance strategy described previously in Table 1 to compare against. Presented in Table 5 are the calculated costs, in £/MWhr, of the total O&M costs broken down into lost revenue, transport, staff and repair costs. Total direct O&M costs are also given, which is the combination of transport, staff and repair costs. In other words, all costs associated with O&M minus any lost production revenue. The uncertainty provided in the table is determined through running 4 identical Monte Carlo simulations, each made up of 25 random simulations and converging with approximately 0.15% accuracy.
Table 5.
Baseline costs overview.
4.2. Effects of Predictive and Condition-Based Maintenance Strategies
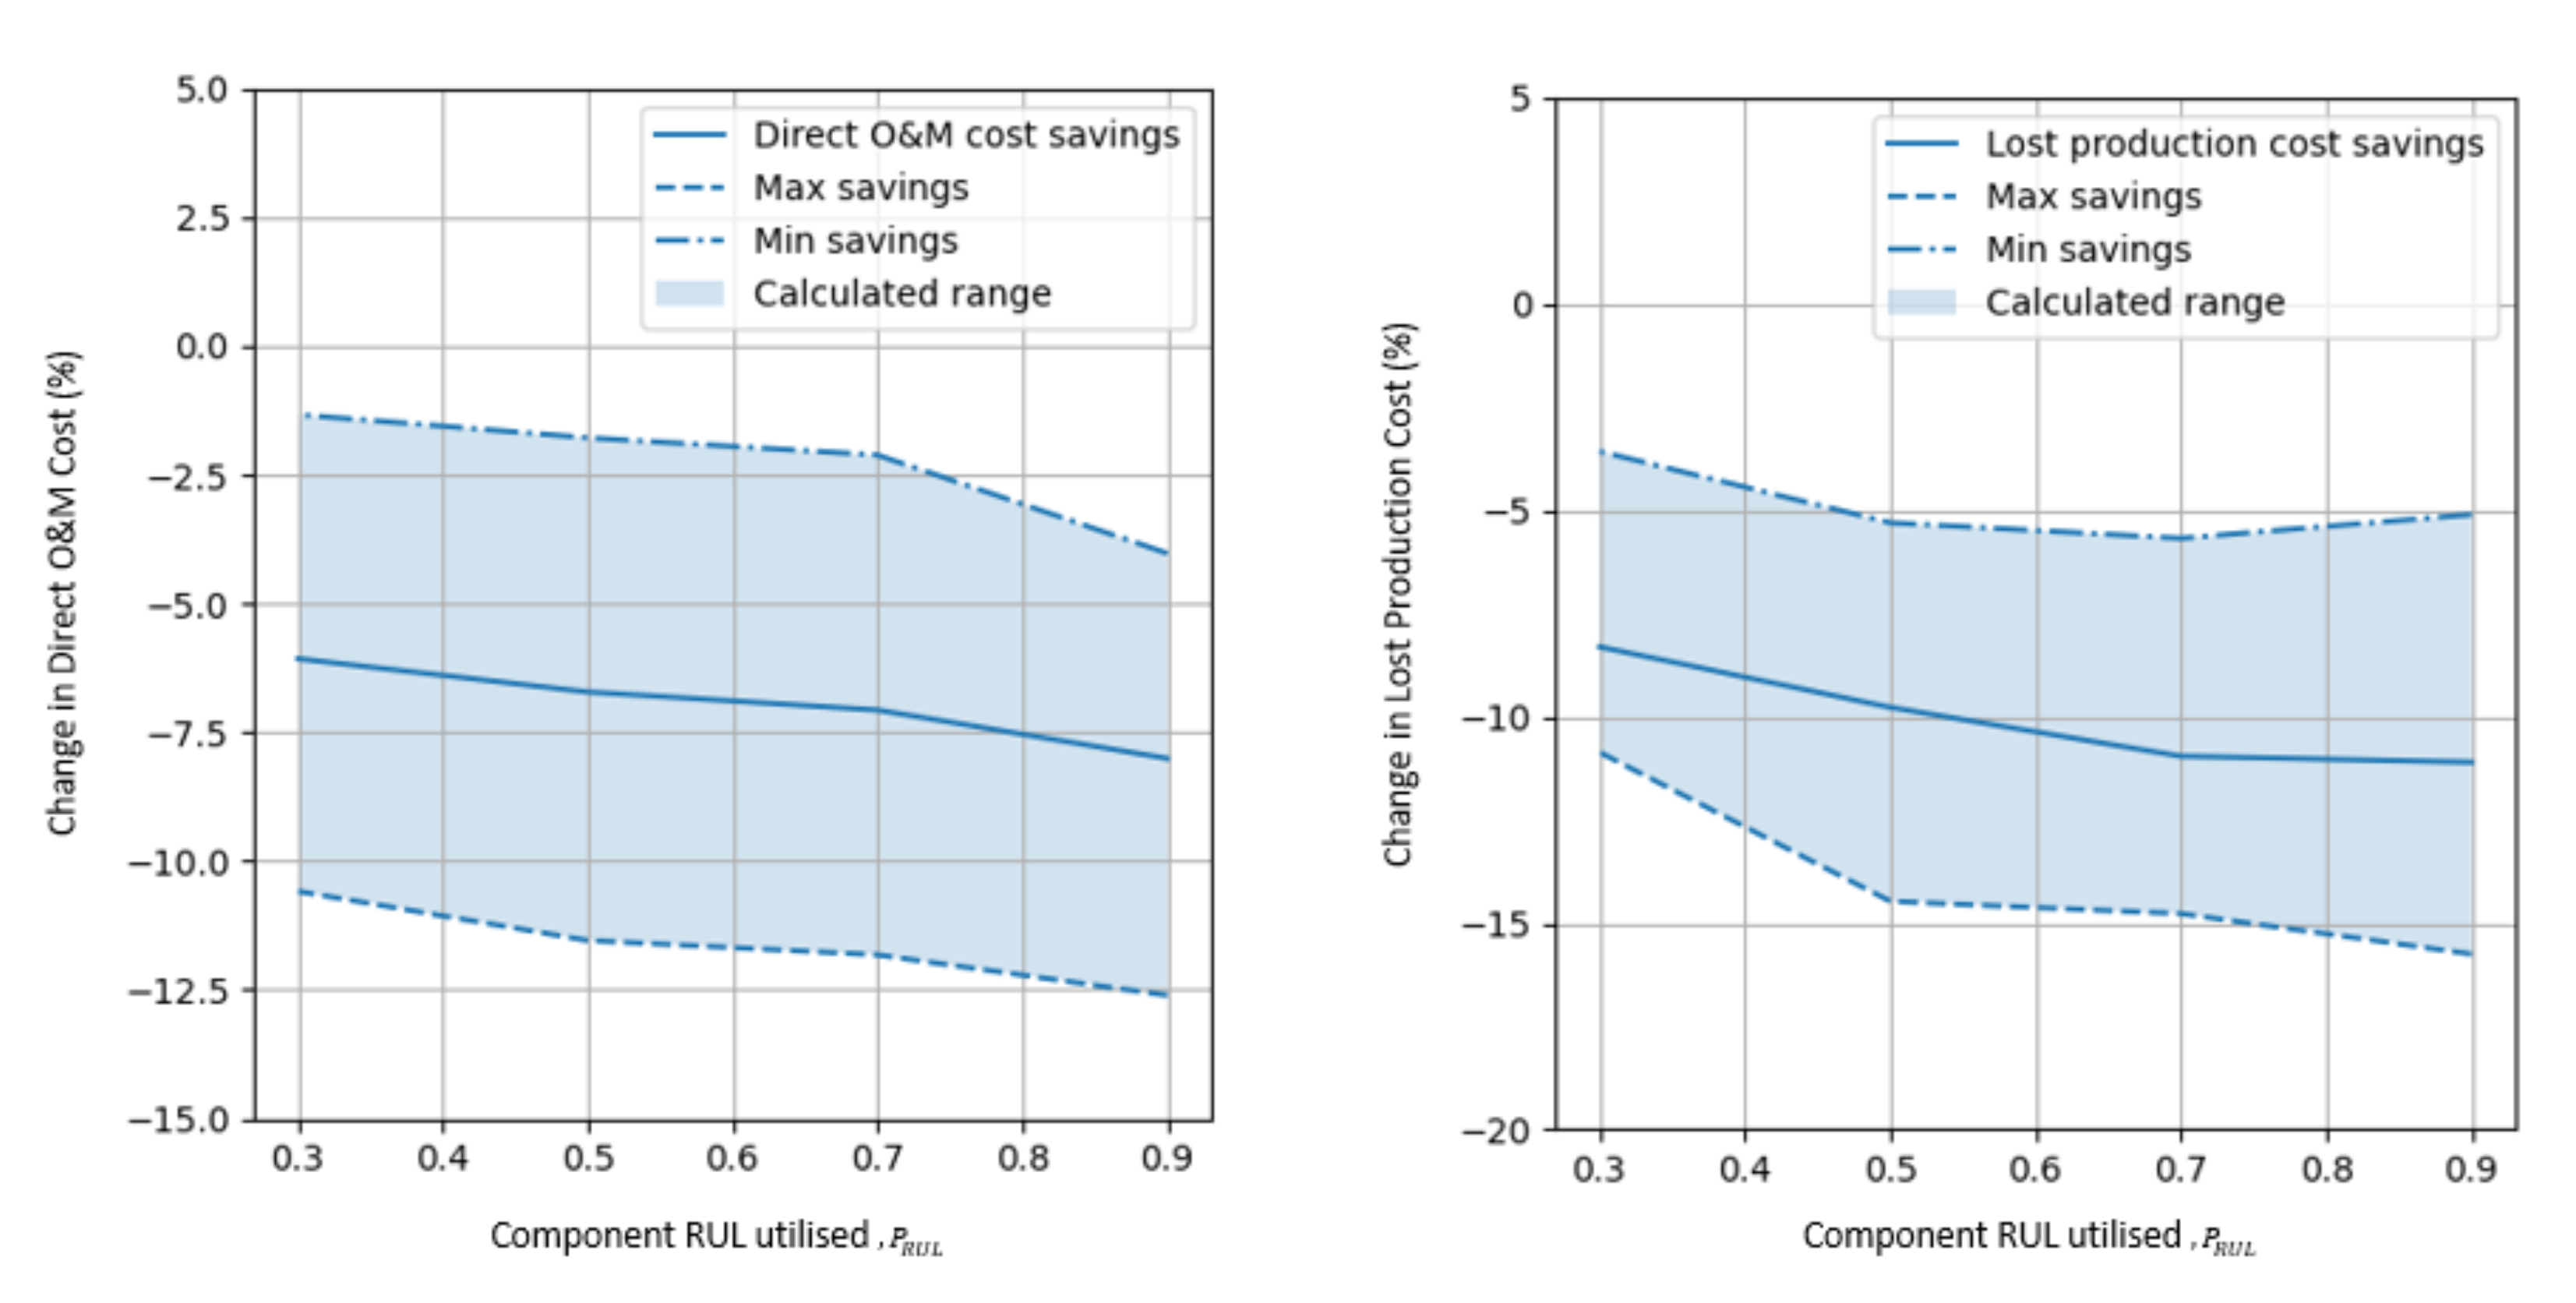
The direct O&M costs with the failure rate adjustments can be found in Figure 4, which shows the costs in relation to the percentage RUL utilised as a percentage change from the baseline costs. Disregarding percentage RUL utilised for a moment, overall it can be seen that by taking a proactive approach to maintenance between 2% and 12.5% can be saved by repairing a component early before major replacement is required depending on the percentage of faults detected and acted upon. Compared to the baseline case this equates to a saving of approximately £0.355–2.128 per MWhr over the lifetime of the wind farm. With regards to changes in lost production, also found in Figure 4, between 3.6% and 15.75% less energy is lost across the range of simulations.

Figure 4.
Percentage cost reduction in predictive maintenance strategies.
Comparing predictive and condition-based strategies in more detail, results suggest that with a condition-based approach that utilises as much component life as possible before repair, an extra 1–2% can be saved on average in direct O&M costs. This equates to approximately £0.177–0.355 per MWhr over the lifetime of the wind farm. There also appears to be a closer correlation between lost production and utilised life of the component, suggesting that a higher energy yield can be obtained by running components for longer before replacement (assuming a HLV is not required). This is likely due to a reduction in downtime made possible by less repairs over the lifetime of the site.
4.3. Analysis of Wind Farm Size and Location
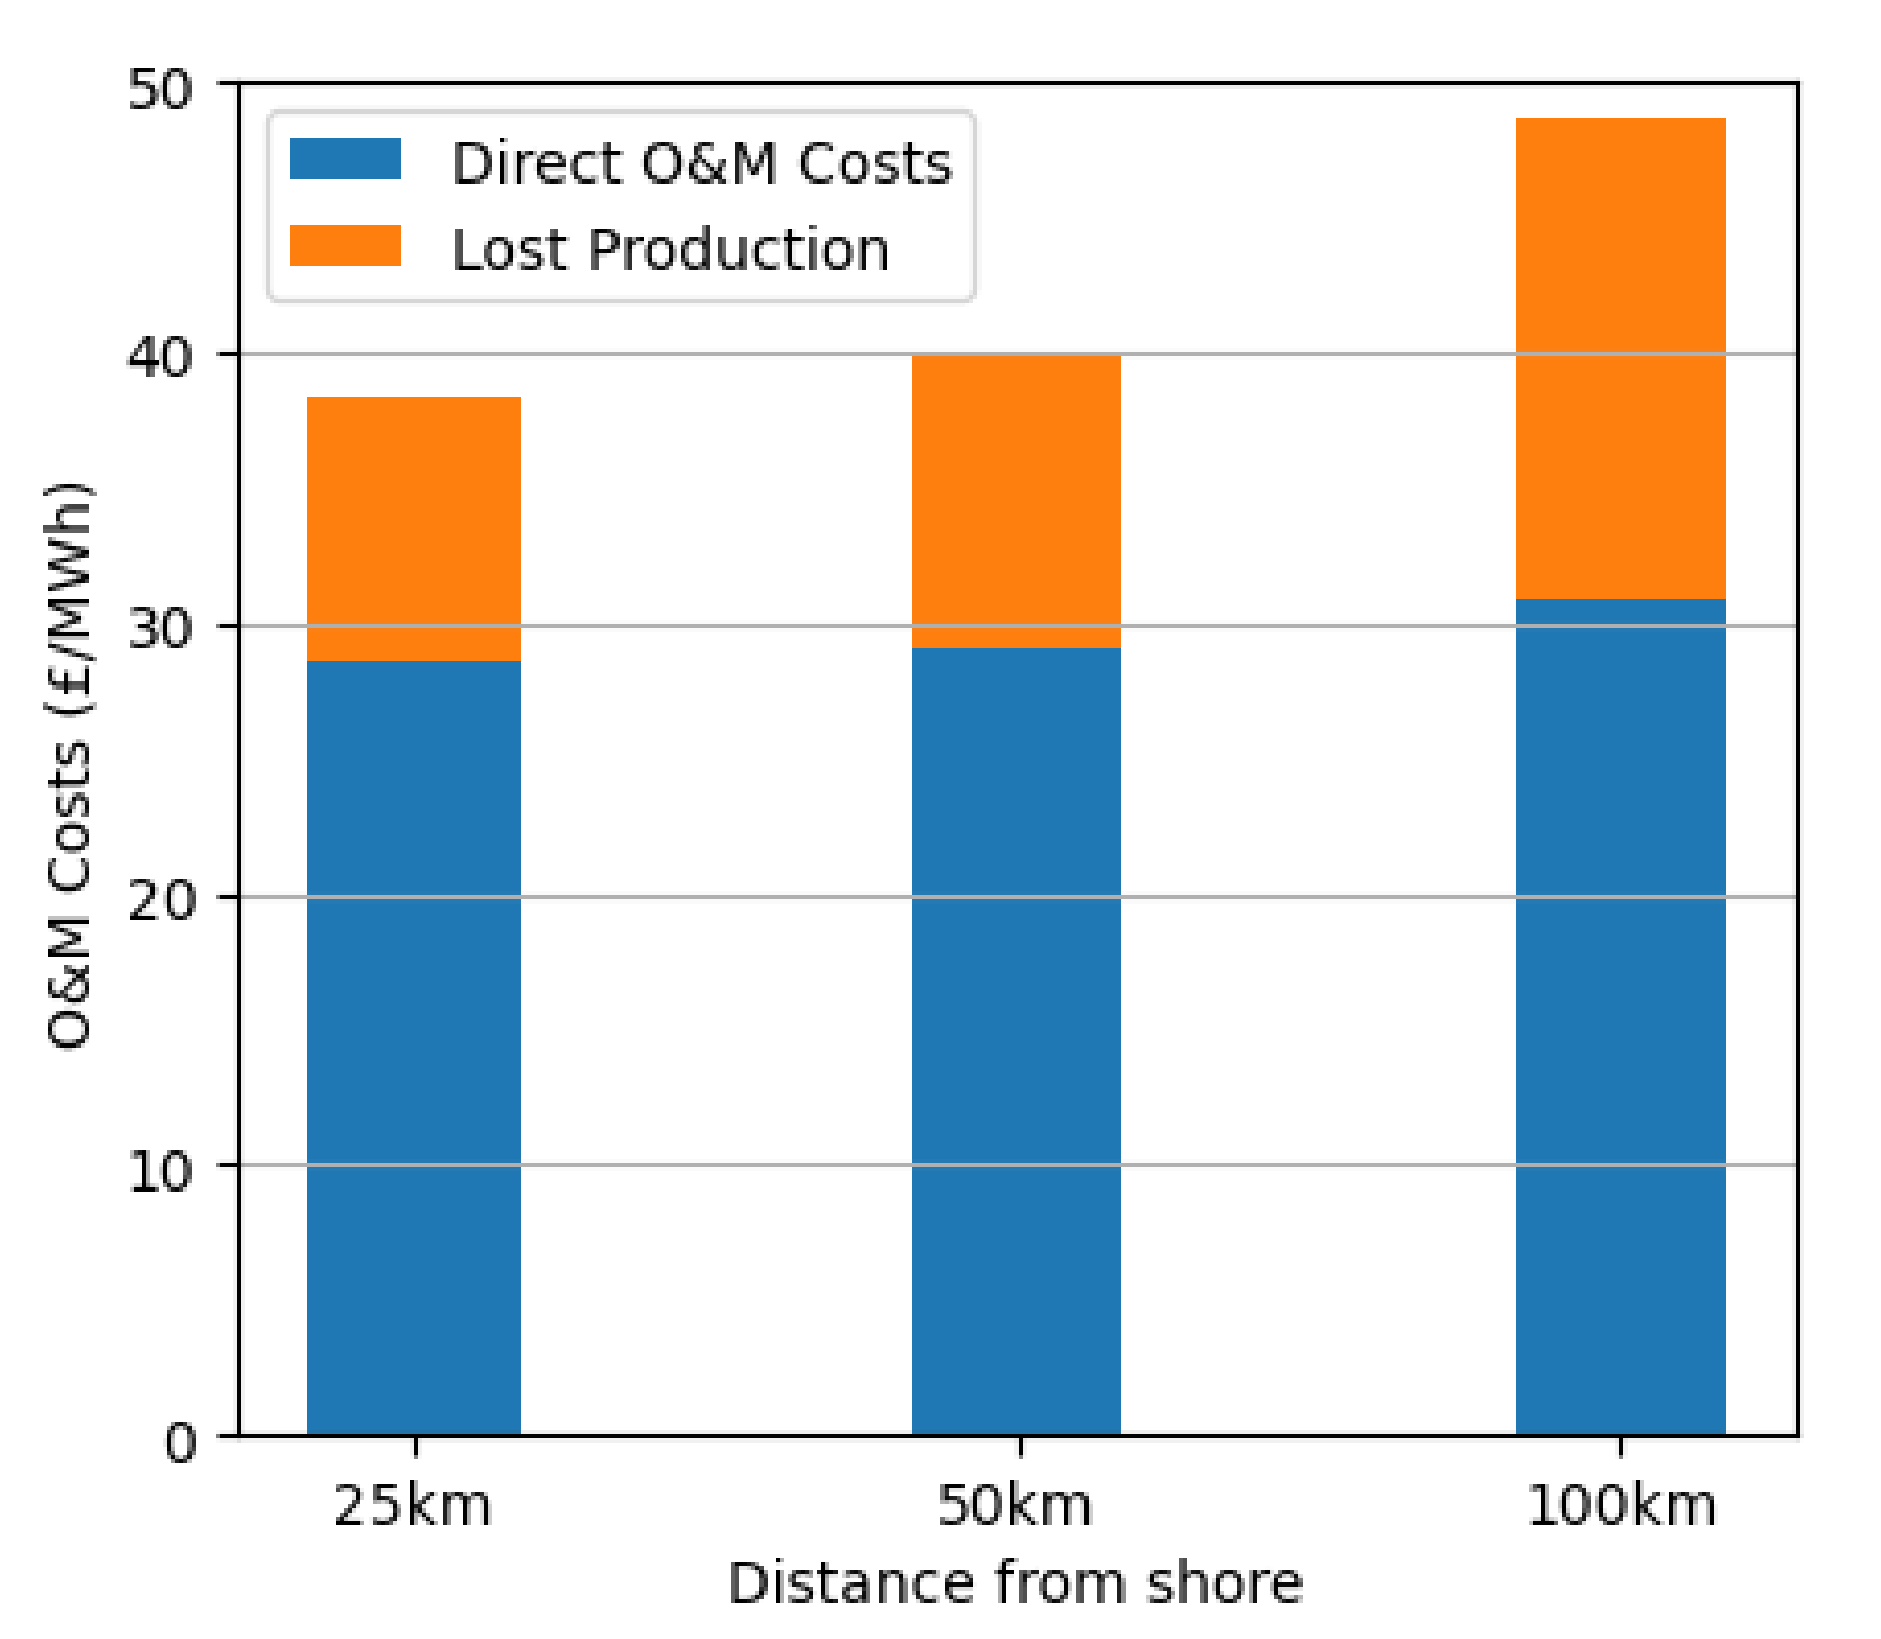
To consider the effect wind farm size and distance from shore has on O&M cost reduction Scenarios 2–4 (see Table 4) were simulated. For each scenario a baseline cost was again calculated by running 4 Monte Carlo simulations with identical input parameters. As with scenario 1, baseline failure rates were used with each simulated site made up of 25 random simulations. Figure 5 shows the baseline direct O&M costs for wind farms located 25, 50 and 100 km (Scenarios 2, 3 and 4 respectively), along with the expected lost revenue. Each Monte Carlo simulation had a convergence of below 0.1%. For each baseline, we see a modest rise in direct O&M costs from approximately 28.6 at 25 km to 31.1 £/MWh at 100 km. The lost production, however, increases more substantially as the wind farm is located further offshore increasing on average from 10.7 to 17.7 £/MWh when moved from 50 km to 100 km offshore. This phenomenon was also found in [23], and can be explained through a restriction of resources applied in the cost model. This constraint meant that as the site was moved further offshore, not enough technicians and CTVs were available to complete all repairs, increasing overall downtime. The number of resources can be optimised to reduce this. However, a relative comparison of strategies is then not possible due to higher base O&M costs.
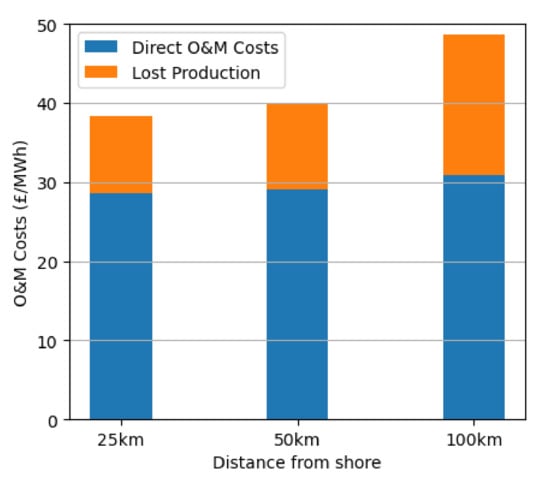
Figure 5.
Baselinedirect O&M costs and lost production, Scenarios 2–4.
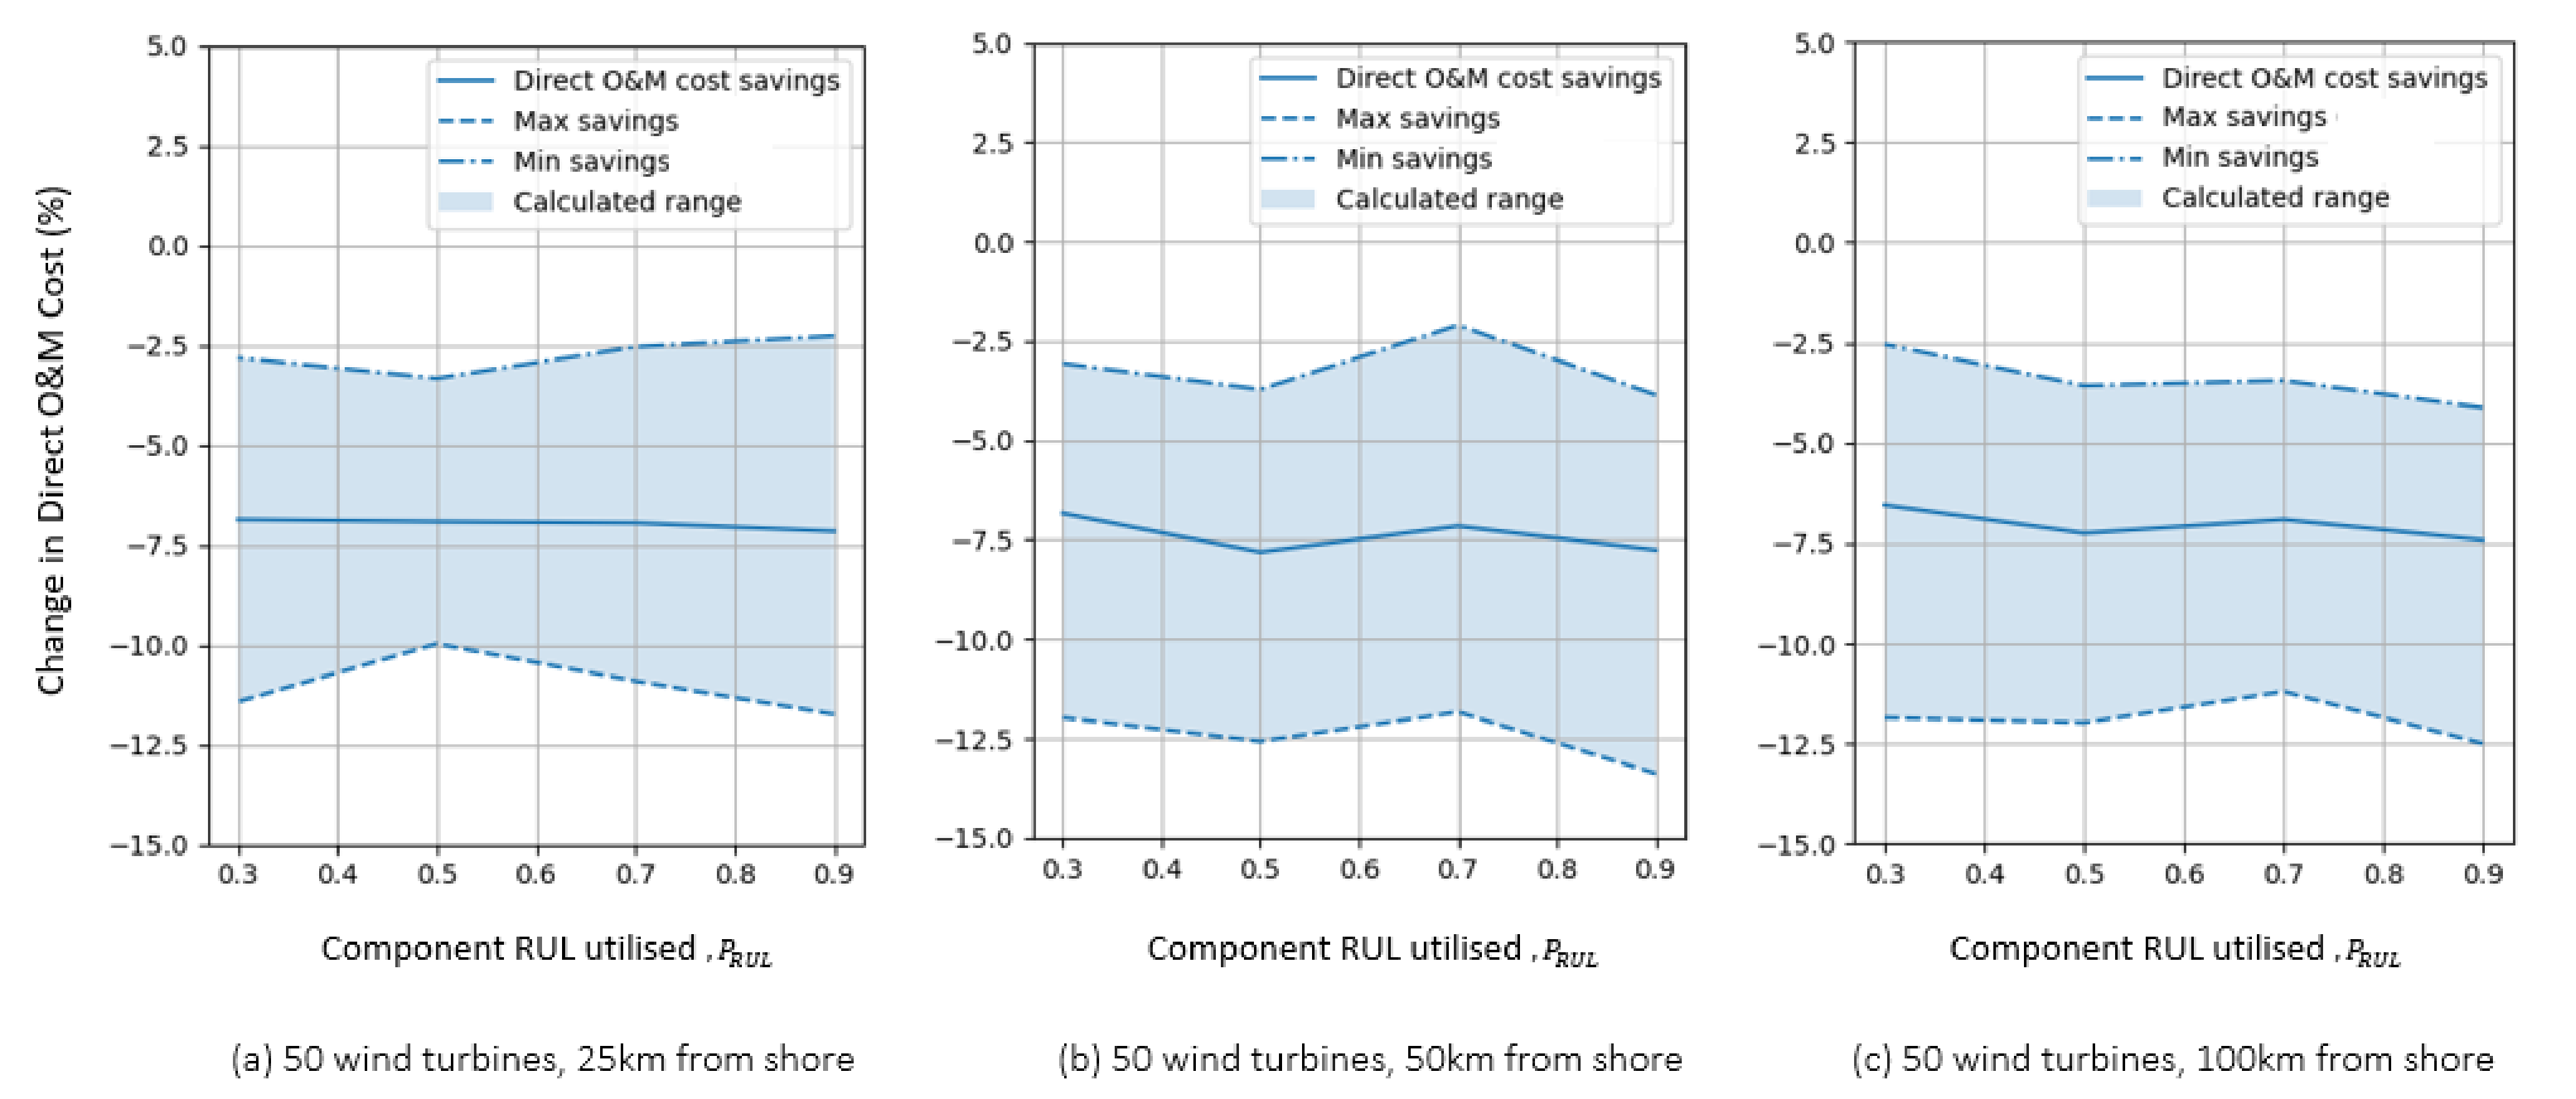
Concentrating on direct O&M costs for each scenario, the cost reduction in relation to the percentage RUL utilised was plotted in Figure 6, with (a), (b) and (c) representing scenarios 2, 3 and 4 respectively. As a whole, the calculated reduction in direct O&M costs is remarkably consistent across the different sites, suggesting that distance from shore has little impact on direct O&M costs savings for a medium-sized wind farm. As a percentage of the baseline, results also suggest that similar savings can be made per MWh when compared to larger sites.
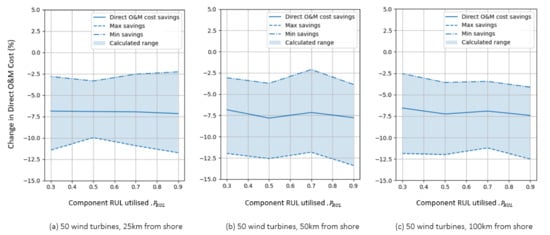
Figure 6.
Percentage change in direct O&M costs for predictive maintenance strategies. Subfigures (a–c) present results for scenario 2 (50 WT, 25 km from shore), 3 (50 WT, 50 km from shore) and 4 (50 WT, 100 km from shore) respectively.
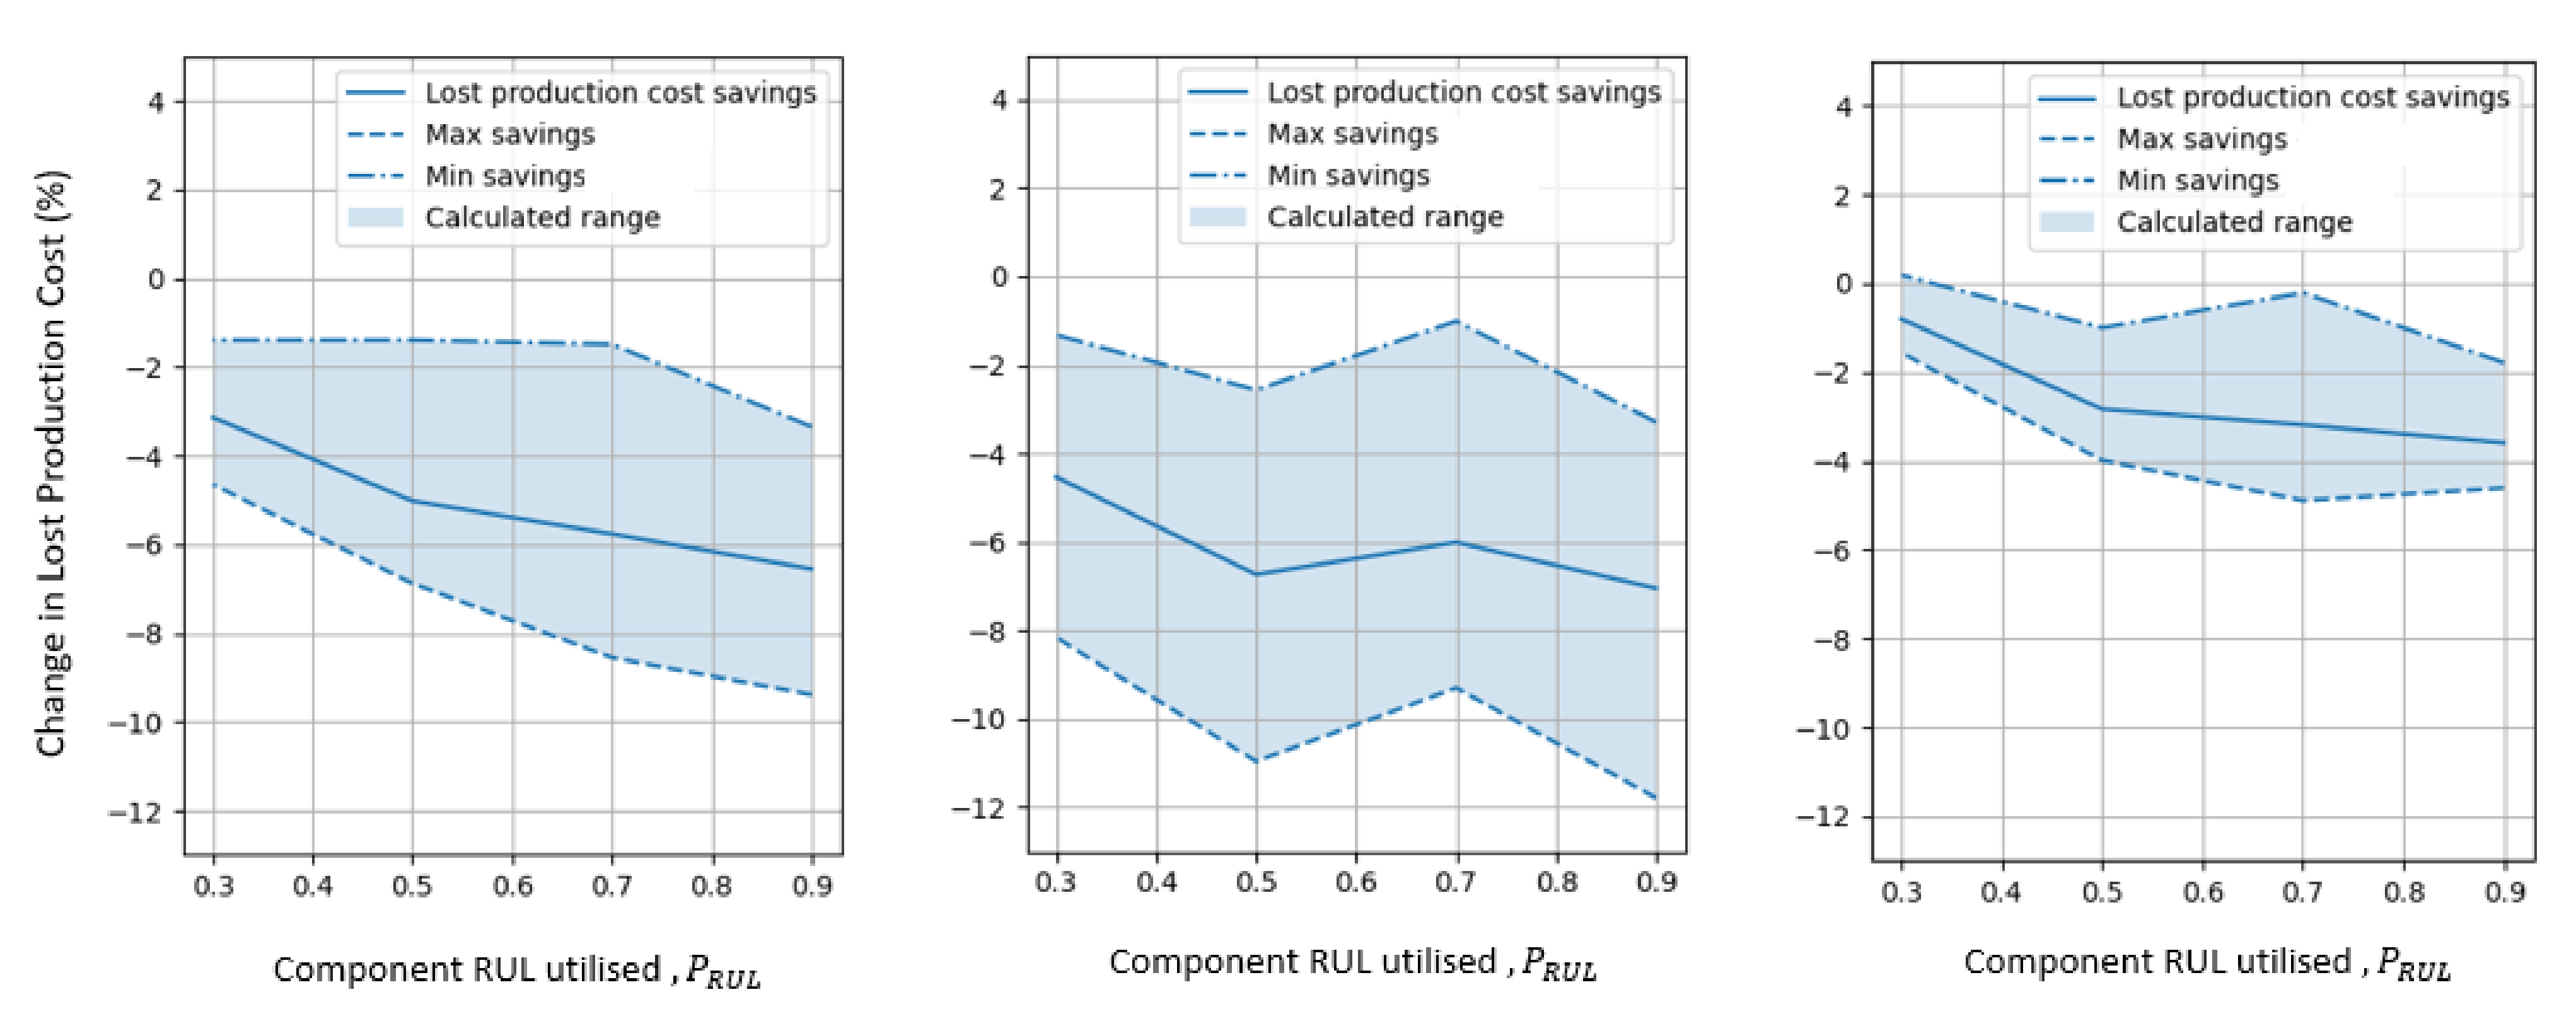
Looking at lost production in Figure 7, results show more deviation in potential savings with respect to distance from shore when compared to direct O&M costs, with values ranging from approximately 1.5% to 12% depending on and . It should be noted that the percentage drop at 100 km can attributed to the substantial increase in absolute lost production shown in Figure 5. There is also stronger correlation between and lost production, with greater values of on average producing less lost production over the wind farm’s 20 years operation. This trend is more obvious with lost production due to the direct link between turbine downtime and increased major repair rate. For direct O&M costs, any additional CSV time due to increased major repair rate may not show as strongly due to the dominant effect of offsetting the cost of a HLV with a CSV.

Figure 7.
Percentage change in lost production costs for predictive maintenance strategies. Subfigures (a–c) present results for scenario 2 (50 WT, 25 km from shore), 3 (50 WT, 50 km from shore) and 4 (50 WT, 100 km from shore) respectively.
5. Discussion
The choice facing operators and owners with regards to O&M strategies is complex, and is often a reflection of the technology, monitoring capabilities and contracts in place at a particular wind farm. Regardless, this analysis aims to provide insight into how OPEX can be reduced over a wind farm life with alternative maintenance strategies assuming that advanced monitoring is possible to gain the required insight.
Two key parameters were analysed for a variety of sites— to simulate a range of additional failures per turbine per year that are diagnosed early and are repairable without using a HLV, and to simulate how early the component was repaired in relation to the expected remaining useful life before failure, at which time a HLV would be required. Considering direct O&M costs (transport, staff and repair costs), results indicate that identifying more faults and repairing them earlier is more important than utilising more of the component life, for which comparatively lower gains can be made. This highlights the importance of making informed maintenance decisions, as analysis shows that the risk of failure and requiring a HLV is much greater than repairing a component too early and compromising some design life. Due to the much higher cost of HLVs over CTVs, this is true even if statistically it means the same component needs repaired several times over the wind farm life. In relation to maintenance strategies, results suggests that predictive maintenance may be the optimal solution for offshore wind farms under the conditions that an optimal weather window can be chosen to limit lost revenue and a HLV can be avoided by the early repair. Having said this, results also show that lost production can be further reduced over the wind farm operation lifetime by increasing through a more condition-based approach. However, gains are limited and therefore a trade-off between further cost savings and the risk of failure will have to be considered carefully. This decision will ultimately be fault case specific and require prudent diagnostics and prognostics.
Results presented in this paper have introduced a methodology to provide a link between potential reduction in O&M costs due to reduced failure rates enabled by improved maintenance strategies. By considering these costs across the entire life of a wind farm, the initial outlay for advanced CMS hardware, network infrastructure and subsequent monitoring costs can be better justified and adopted by developers, providing a business case for prospective service providers further down the supply chain.
6. Conclusions
To summarise, this research has presented analysis in an attempt to bring much needed clarity on the impact that advanced monitoring strategies can have on lifetime O&M costs. The key findings are as follows:
- With input parameters described throughout the methodology, results showed a potential cost reduction of up to 8% in direct O&M costs (transport, staff and repair costs) and up to 11% reduction in lost production by utilising advanced monitoring strategies, assuming 25% of major failures of the generator and gearbox can be diagnosed through advanced monitoring and repaired before major replacement is required. This increases to 12.5% and 15.75% respectively, with of 40%.
- Results showed that the major driving factor of realising these savings is through early intervention to avoid failure and major component replacement, and hence avert the need to use a HLV and instead use a CTV for a simpler repair.
- Findings indicate that opting for predictive or condition-based maintenance strategies can generate substantial savings over the lifetime of a wind farm when compared to a more reactive approach. Furthermore, using a more condition-based approach and pushing components closer to the end of their RUL can further reduce costs due to increased overall availability and reduced lost revenue.
- If weighing up the risk of component failure and replacing a component too early, results suggest that it is more cost effective to intervene earlier if HLVs can be avoided, even if that means more major repairs over the lifetime of the site.
6.1. Result Limitations
As with all results presented, it is important to reflect on limitations and the major causes of uncertainties within the analysis. To reduce uncertainty, failure and repair rates for the baseline reactive maintenance strategy have been taken from [23], for which rates were obtained with a population of offshore wind turbines over a number of years. Other studies do, however, exist with varying observed rates across different wind turbine models which would effect calculated costs. Vessel, staff and component repair costs were taken from the original cost model, and reflect costs at the time the model was created in 2016, which may not reflect current rates. The final key source of uncertainty when trying to understand costs is , which as stated previously used values of between 10% and 40%. This range has been chosen to reflect the uncertainty, as it will ultimately be specific to each site and turbine with various impact factors such as differing loading patterns, ambient conditions, manufacturing and installation tolerances and levels of routine maintenance. Results also do not take into consideration the reliability and extra cost associated with the CMS system and network infrastructure, which may have some impact on failure rates and overall costs of implementing predictive and condition-based strategies.
6.2. Future Work
There are three key areas that could be improved in future research to build on the results presented. First of all, there should an attempt to better define the failure rate adjustments, more specifically in relation to , which could be tailored to each component and fault type. This could only be achieved through industry engagement to better understand the link between calculated failure rates and potential fault detection rates with the capacity for repair. Secondly, future research should aim to understand the true benefit of these savings by offsetting any potential gains with additional costs of condition monitoring hardware and services. Finally, future research should address limitations in the applied cost model by updating electricity prices and market mechanisms to better reflect current and future offshore developments.
Author Contributions
Conceptualisation, A.T. and J.C.; methodology, A.T.; validation, A.T. and J.C.; formal analysis, A.T.; investigation, A.T.; writing—original draft preparation, A.T.; writing—review and editing, A.T. and J.C.; visualisation, A.T.; supervision, J.C. Both authors have read and agreed to the published version of the manuscript.
Funding
This research was funded by EPSRC grant number EP/L016680/1.
Institutional Review Board Statement
Not applicable.
Informed Consent Statement
Not applicable.
Data Availability Statement
Not applicable.
Acknowledgments
The authors would like to thank the creators of the Dinwoodie O&M cost model at the University of Strathclyde used in this paper.
Conflicts of Interest
The funders had no role in the design of the study; in the collection, analyses, or interpretation of data; in the writing of the manuscript, or in the decision to publish the results.
Abbreviations
The following abbreviations are used in this manuscript:
| CMS | Condition Monitoring System |
| CRV | Crew Transfer Vessel |
| DD | Direct Drive |
| DFIG | Doubly Fed Induction Generator |
| FRC | Fully Rated Converter |
| HLV | Heavy Lift Vessel |
| LCOE | Levelised Cost of Energy |
| O&M | Operations and Maintenance |
| OPEX | Operational Expenditure |
| PMG | Permanent Magnet Generator |
| RUL | Remaining Useful Life |
| WT | Wind Turbine |
References
- Santos, F.; Teixeira, A.P.; Soares, C.G. Modelling and simulation of the operation and maintenance of offshore wind turbines. J. Risk Reliab. 2015, 229, 385–393. [Google Scholar] [CrossRef]
- May, A.; McMillan, D.; Thöns, S. Economic analysis of condition monitoring systems for offshore wind turbine sub-systems. IET Renew. Power Gener. 2015, 9, 900–907. [Google Scholar] [CrossRef] [Green Version]
- Crabtree, C.J.; Zappala, D.; Hogg, S.I. Wind energy: UK experiences and offshore operational challenges. Proc. Inst. Mech. Eng. Part A J. Power Energy 2015, 229, 727–746. [Google Scholar] [CrossRef] [Green Version]
- Valpy, B.; Philip, E. Future Renewable Energy Costs: Offshore Wind, How Technology Innovation Is Anticipated to Reduce the Cost of Energy from European Offshore Wind Farms. 2014. Available online: https://eit.europa.eu/library/future-renewable-energy-costs-offshore-wind (accessed on 11 May 2019).
- Tchakoua, P.; Wamkeue, R.; Ouhrouche, M.; Slaoui-Hasnaoui, F.; Tameghe, T.A.; Ekemb, G. Wind turbine condition monitoring: State-of-the-art review, new trends, and future challenges. Energies 2014, 7, 2595–2630. [Google Scholar] [CrossRef] [Green Version]
- Carroll, J.; McDonald, A.; McMillan, D. Reliability Comparison of Wind Turbines With DFIG and PMG Drive Trains. IEEE Trans. Energy Convers. 2015, 30, 663–670. [Google Scholar] [CrossRef] [Green Version]
- McMillan, D.; Ault, G.W. Quantification of Condition Monitoring Benefit for Offshore Wind Turbines. Wind Eng. 2016, 31, 267–285. [Google Scholar] [CrossRef]
- Tsui, K.L.; Chen, N.; Zhou, Q.; Hai, Y.; Wang, W. Prognostics and health management: A review on data driven approaches. Math. Probl. Eng. 2015, 2015. [Google Scholar] [CrossRef] [Green Version]
- Liu, R.; Yang, B.; Zio, E.; Chen, X. Artificial intelligence for fault diagnosis of rotating machinery: A review. Mech. Syst. Signal Process. 2018, 108, 33–47. [Google Scholar] [CrossRef]
- Tautz-Weinert, J.; Watson, S. Using SCADA data for wind turbine condition monitoring—A review. IET Renew. Power Gener. 2017, 11, 382–394. [Google Scholar] [CrossRef] [Green Version]
- Stetco, A.; Dinmohammadi, F.; Zhao, X.; Robu, V.; Flynn, D.; Barnes, M.; Keane, J.; Nenadic, G. Machine learning methods for wind turbine condition monitoring: A review. Renew. Energy 2019, 133, 620–635. [Google Scholar] [CrossRef]
- Turnbull, A.; Carroll, J.; McDonald, A. Combining SCADA and vibration data into a single anomaly detection model to predict wind turbine component failure. Wind Energy 2021, 24, 197–211. [Google Scholar] [CrossRef]
- Turnbull, A.; Carroll, J.; McDonald, A.; Koukoura, S. Prediction of wind turbine generator failure using two-stage cluster-classification methodology. Wind Energy 2019, 22, 1593–1602. [Google Scholar] [CrossRef]
- Hahn, B.; Durstewitz, M.; Rohrig, K. Reliability of wind turbines—Experiences of 15 years with 1500 WTs. Wind Energy 2007, 328–330. [Google Scholar] [CrossRef]
- Spinato, F.; Tavner, P.J.; van Bussel, G.J.W.; Koutoulakos, E. Reliability of wind turbine subassemblies. IET Renew. Power Gener. 2009, 3, 387–401. [Google Scholar] [CrossRef] [Green Version]
- Wilkinson, M.; Hendriks, B.; Spinato, F.; Harman, K.; Gomez, E.; Bulacio, H.; Roca, J.; Tavner, P.J.; Feng, Y.; Long, H. Methodology and results of the reliawind reliability field study. In Proceedings of the European Wind Energy Conference, Warsaw, Poland, 20–23 April 2010. [Google Scholar]
- Artigao, E.; Martín-Martínez, S.; Honrubia-Escribano, A.; Gómez-Lázaro, E. Wind turbine reliability: A comprehensive review towards effective condition monitoring development. Appl. Energy 2018, 228, 1569–1583. [Google Scholar] [CrossRef]
- Dao, C.; Kazemtabrizi, B.; Crabtree, C. Wind turbine reliability data review and impacts on levelised cost of energy. Wind Energy 2019, 22, 1848–1871. [Google Scholar] [CrossRef] [Green Version]
- Koukoura, S.; Scheu, M.N.; Kolios, A. Influence of extended potential-to-functional failure intervals through condition monitoring systems on offshore wind turbine availability. Reliab. Eng. Syst. Saf. 2021, 208, 107404. [Google Scholar] [CrossRef]
- Dinwoodie, I. Modelling the Operation and Maintenance of Offshore Wind Farms. Ph.D. Thesis, University of Strathclyde, Glasgow, UK, 2014. [Google Scholar]
- Carroll, J.; McDonald, A.; Dinwoodie, I.; McMillan, D.; Revie, M.; Lazakis, I. Availability, operation and maintenance costs of offshore wind turbines with different drive train configurations. Wind Energy 2017, 20, 361–378. [Google Scholar] [CrossRef] [Green Version]
- Carroll, J. Cost of Energy Modelling and Reduction Opportunities for Offshore Wind Turbines. Ph.D. Thesis, University of Strathclyde, Glasgow, UK, 2016. [Google Scholar]
- Carroll, J.; McDonald, A.; McMillan, D. Failure rate, repair time and unscheduled O and M cost analysis of offshore wind turbines. Wind Energy 2016, 19, 1107–1119. [Google Scholar] [CrossRef] [Green Version]

Publisher’s Note: MDPI stays neutral with regard to jurisdictional claims in published maps and institutional affiliations. |
© 2021 by the authors. Licensee MDPI, Basel, Switzerland. This article is an open access article distributed under the terms and conditions of the Creative Commons Attribution (CC BY) license (https://creativecommons.org/licenses/by/4.0/).