Abstract
This paper discusses the conversion of solar irradiance energy into electricity. Double-sided (bifacial) panels are gaining increasing popularity in commercial applications due to the increased energy yield with a constant occupied mounting surface. However, the value of the additional energy yield produced by the back of the panel depends on several important factors. This paper presents the influence of working conditions on electricity generation in bifacial modules. This paper also investigates the influence of weather conditions, the module inclination angle, and the substrate beneath the panel surface on electricity generation. Fill factor and efficiency were calculated for each case included in the study scope. Based on the current voltage, power characteristics, and calculations, the module operation for different conditions was compared. It was observed that the optimal inclination angle to the surface is higher for the bifacial modules compared to the unilateral modules. The type of surface under the module has also been indicated to impact the amount of electricity generated. The additional energy yield associated with the panels’ rear side accounts for 2% to more than 35% of the total power generated by a photovoltaic (PV) module. The unit cost of electricity generation in the analyzed cases was also determined.
1. Introduction
Renewable energy sources (RES), in particular photovoltaic energy sources, have become increasingly popular. Ongoing research increases installations’ efficiency and develops new technologies. The energy yield can be improved with bifacial photovoltaic modules that use both direct radiation (incident on modules’ front side) and reflected radiation (incident on the module’s rear side) to generate electricity. Figure 1a shows a bifacial module with two glass layers for absorption of sunlight on both sides of the module; radiation also reaches the rear side of the module. Radiation from around the module and passing the free spaces between the PV cells are reflected from the module’s surface. Figure 1b shows a monofacial module whose rear layer is composed of an underlay impervious to solar radiation.
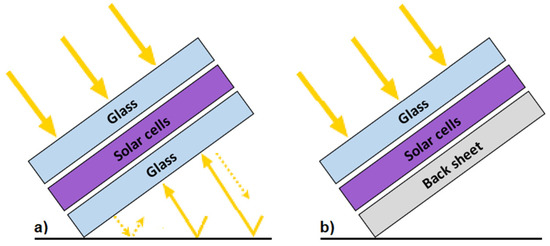
Figure 1.
Diagram of: (a) bifacial, (b) monofacial module [1].
Due to additional absorption of the radiation incident on the rear side of the cell and the increased number of photocarriers generated, a bifacial module generates greater current and voltage than that of the monofacial module, making it possible to obtain more power. The additional energy yield depends on the amount of intense solar radiation reflected from the ground and reaching the module’s rear side. One of the most common bifacial cells structures is the p+-p-n+ structure, based on an n-type semiconductor (shown in Figure 2). Silicon oxide or nitride (SiO2/SiNx) are used for front side and rear side passivation. The front side mesh is composed of silver or aluminum (Ag/Al), and the rear side mesh is composed of silver (Ag).
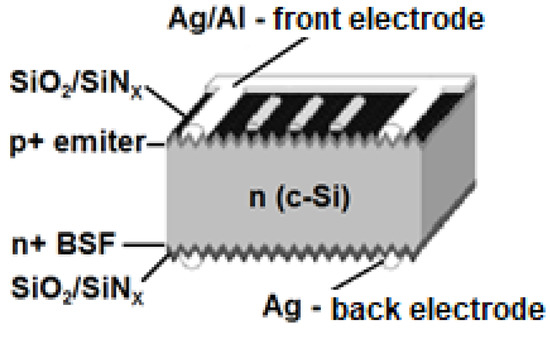
Figure 2.
The diagram of a type of bifacial cell p+-n-n+ [2].
Experimental systems with low installed capacity achieve an efficiency range between 15% to 25% higher than standard modules in commercial solutions; however, the actual extra yield is in the 5–15% range [3]. The systems’ operation depends on many factors, including the type of substrate below the module surface; the use of bifacial modules makes it possible to maximize the concentration of installed power. The use of bifacial modules offers another advantage—installations consisting of double-sided modules make it possible to obtain a greater energy yield from 1 m2 of photovoltaic installation than single-sided modules [4].
In most cases, bifacial modules are used in ground-mounted structures, on roofs-racks, or in BIPV installations (Building Integrated Photovoltaics) systems for sunlight absorption on both sides of the module. The International Technology Roadmap for Photovoltaic (ITRPV) predicts that the share of bifacial panels in the global photovoltaic market will increase to 60% by 2029 [5]. The authors [6] analyzed the two-sided panels market and predicted its growth from 3% in 2018 to as much as 40% in 2025; particular hope for greater use of bifacial panels is attached to BIPV and installations floating on water reservoirs [7], mounted soundproof barriers [8,9], in photovoltaic farms [10], and in solar-tracking systems [11,12]. Compared to single-sided modules, additional energy yield from two-sided modules is estimated to reach 30% or 40% in solar tracking [13]. Moreover, the prices of double-sided panels are only slightly higher than those of single-sided panels. The use of a glass pane at the panel backing extends the panels’ service life as well as the warranty period offered by manufacturers.
The applicable IEC 60904 standard [14] specifies the measuring conditions for single-sided photovoltaic modules; however, the existing standards do not specify the conditions for measuring the back irradiance intensity and measuring bifacial panels’ methods, which have gained increasing popularity on the photovoltaic market. There have been suggestions on measurement specification (such as the one presented in [15]) for two-sided modules; however, the conditions set out in these documents are not yet precisely defined and do not offer general principles that ensure measurable results in all field conditions. Many researchers study bifacial panels, both in laboratory and field conditions. However, the research results are not consistent and usually cover a selected operation and applications area of panels that absorb light at the front and rear sides of the cell. For example, there are studies whose authors report as much as 50% additional yield from the rear side of bifacial panels compared to single-sided panels [16]. Conversely, a 20% increase in power yield can be obtained with an optimal mounting height of the panel; this ensures that the direct solar radiation is reflected from the ground and reaches the rear side of the panel [17]. Moreover, the change in the module mounting height and inclination angle, as well as panel-to-panel correlation, contribute to large variations in additional power yield in bifacial panels, as indicated in the following papers [18,19,20]. The paper [21] indicates the lack of precise tools for modeling energy yields from bifacial panels. However, the use of accurate radiation sensors with a breakdown of its individual components (direct, reflected, and diffused radiation) and accounting for the substrate surface’s albedo and the data related to the installation location in the available simulation models makes it possible to obtain the generated power values whose error is less than 1% for stationary systems and 2% for following systems. The use of double-sided panels introduces an additional approx. 0.5% uncertainty in the modeling process of photovoltaic installations.
The difference in power generation of south-facing bifacial panels compared to unilateral panels is about 21%, as reported in the studies conducted in the north of Alaska [22]. Conversely, the vertical installation of double-sided panels in the east-west configuration resulted in the same annual energy generation as in the case of south-facing panels. However, the generation profiles were different, which may also be of great importance for energy consumption for current needs without the need for energy storage. A comparison of power generation curves in single-sided and double-sided panels in different assembly configurations is shown in Figure 3.
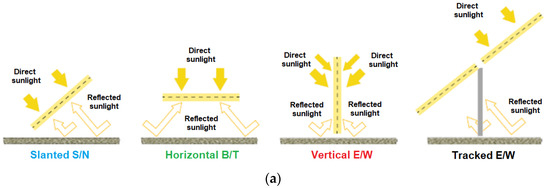
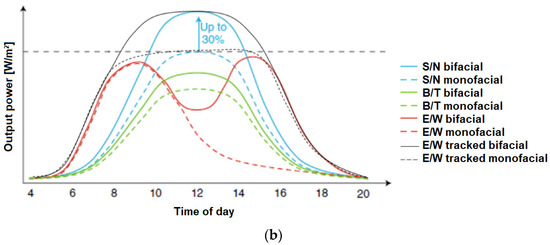
Figure 3.
(a) Possible mounting configurations of double-sided panels; (b) comparison of power generation curves in single- and double-sided panels in different mounting configurations [23]. Reprint with permission [23]; Copyright 2018, Publisher: Springer Nature Limited.
The comparison of the generated power values in photovoltaic installations located in Poland: rated installed power of 5.04 kW (one-sided panels) and 6.1 kW (two-sided panels) installed on grassy ground, a 10% or 28% greater energy efficiency was obtained for double-sided panels in high and low insolation, respectively. The calculated value of CO2 emission reduction with two-sided cells was 16% higher compared to unilateral cells [24]. In the installations located in Korea [25], the year-round additional energy yield from double-sided panels was 10.5% when installed over a concrete floor whose albedo was 21%. With an albedo of 79% (white membrane), the increased yield reached 33.3% compared to single-sided panels. The uniaxial tracker increased energy generation by 15.8% compared to a stationary structure with single-sided panels in the same research period. Energy yields modeling in solar-tracking systems must take into account additional yields from the generation in the rear side of bifacial panels [26,27]. However, the solar tracking system determines the optimal setting for the front side of the panel.
In [28], its authors determined the 130–140 W/m2 irradiance value reaching the rear part of the bifacial panel in the test conditions specified in IEC 60904, with an irradiance of 1000 W/m2 at the front of the panel (the mounting height of the panel—1 m above the ground, and the albedo coefficient for light soil is 0.21). The value of the back irradiance was observed to depend on many factors, such as the light transmittance degree of the panel surface, the panel’s mounting height and angle, and the substrate’s reflectance. A new method used to characterize bifacial photovoltaic cells in STC is presented in [29]; a cell’s front and rear are simultaneously illuminated in order to make it possible to perform electrical measurements of the front side (efficiency, open-circuit voltage, short-circuit current, and fill factor) and the short-circuit current of the rear side below the STC conditions. The authors indicate that the output current of the bifacial panel is the total of the currents generated in the front and rear side of the panel, and the irradiance reaching the panel rear side is always lower than that reaching the front side. The compensated-current method (the sum of the panel rear and front side parts’ currents) is also used by the authors of [30] in order to model energy generation from bifacial panels. The [29] authors introduced the two new parameters (i.e., the product of bifacial yield and additional yield) in order to describe the bifacial panels in greater detail. Bifacial monocrystalline panels placed on a supporting structure directly on the ground at an inclination of 30° were tested for four different values of the albedo coefficient (0.1, 0.2, 0.3, and 0.6). The measurement results were compared with the data obtained from the simulation of generated power, and the maximum error was 6.7% with an average error of 1.86% [7]. These tests reports included the date of the test, as it impacted the direct and scattered irradiation components and thus irradiation reaching the rear side of the panel. In other works [31,32], the authors also indicate the energy yields dependence from two-sided cells on the region where these panels are installed and latitude affecting environmental conditions. However, greater energy yield from bifacial panels changes the charging and discharging cycles of energy storage facilities, which results in an alteration of the values related to the stored energy. This also affects the battery service life and self-discharge losses [33].
Air purity, assembly orientation of panels, and the size of the surface reflecting solar radiation also affect the work of bifacial panels, which has been confirmed by the research results reported in [34]. An increased concentration of PM10 dust in the air by 100 μg/m3 resulted in the module’s efficiency dropping by 0.9%. Moreover, a double surface area of the substrate with the tested albedo increased the efficiency by 1.6%. Conversely, compared to the horizontal one, the vertical assembly of the panel has contributed to the shading of a bigger area under the panel and resulted in the short-circuit current value decrease by 14.3%.
The optical model used in [35] and the possible, additional power yields from the bifacial panels were determined in panels that had the rear coatings of various materials (a white primer, glass, and glass with mesh) for internal reflections from the back substrate to the rear side of the PV cells. The analysis demonstrates that the rear side base type affects impacts of not only additional power yield but also the cells’ temperature. Therefore, a white mesh in the rear side, transparent base with a width distance equal to that between the PV cells, has proven to be the optimal solution. Moreover, the power yields obtained, resulting from the modified base, exceed the power losses associated with the additional cells’ heating.
Bearing the above in mind, the study’s authors conducted the examination for bifacial modules to determine the parameters used to estimate additional electricity yield, depending on the installation settings and environmental parameters, at the same time. The parameters which characterize bifacial modules have been determined. The analyses may be used to determine the most favorable operating conditions for such modules and, in particular, the module inclination angle with a specific substrate. The method for determination of irradiance value incident on the module has been presented; this is used to determine the module power generation without the information of the share generated by the rear part of the module. The convergence of the calculated parameters with those determined through experimental methods for various types of substrate and the module inclination angles were demonstrated.
The studies presented by the authors concern a special method of mounting bifacial panels directly on the ground, which has not been analyzed in the cited publications thus far. When installing the panels above the surface, the angle of inclination is not as important as it is when installing directly or low above the ground. The authors proved that the greater angle of inclination, the greater the surface reflecting solar radiation behind the module, and it constitutes an important element determining the value of additional energy yield.
This article has the following structure. The second section presents the test stand, measurement conditions, and analyzed parameters. The third part contains the research results related to the influence of the inclination angle and the substrate type on the modules’ parameters. The fourth part includes the discussion and analysis of research results. The article ends with a summary.
2. Materials and Methods
The research objective was to determine the current voltage and power characteristics of the LG 390N2T-A5 bifacial module of the 390 W nominal power, whose electrical rating is presented in Table 1. In order to make it possible to compare the module operation in different weather conditions, the module temperature, ambient temperature, and insolation on the module surface were also measured. The measurement system (shown in Figure 4) consisted of the devices indicated in Table 2.

Table 1.
The bifacial module parameters—LG 390-N2T-A5 in STC [36].
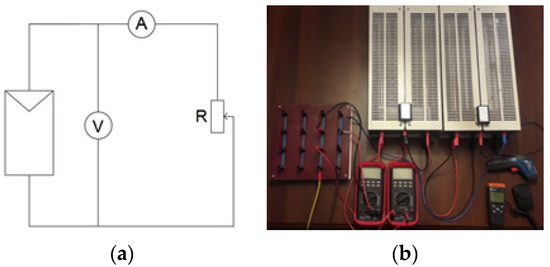
Figure 4.
(a) The measurement system diagram; (b) the measurement system photographs.
Table 2.
List of devices used.
The module edge rested on the ground at each of the measurements. Measurement of solar irradiance intensity on the module surface was conducted each time before voltage and current measurements. The solar irradiance intensity was measured at 12 points and then averaged. These values might have changed during the measurement, as the tests were performed in natural outdoor conditions. In central Poland, the measurements were performed in the vicinity of Poznań (52°05′ N, 16°54′ E) in September and October 2020. Figure 5 demonstrates the total energy of solar irradiance in particular locations in Poland. The average annual total energy in the indicated location was approx. 1080 kWh/m2. The average monthly radiation energy was 103.7 kWh/m2/month in September and in October 59.2 kWh/m2/month. The average monthly temperature in September was 14.93 °C, in October—9.33 °C [37]. The measurements were performed on days with different ambient temperatures and solar irradiance, which made it possible to obtain a spectrum of various atmospheric conditions, ranging from high cloudiness when the radiation density was approx. 60 W/m2, to an insolation of up to 1100 W/m2.
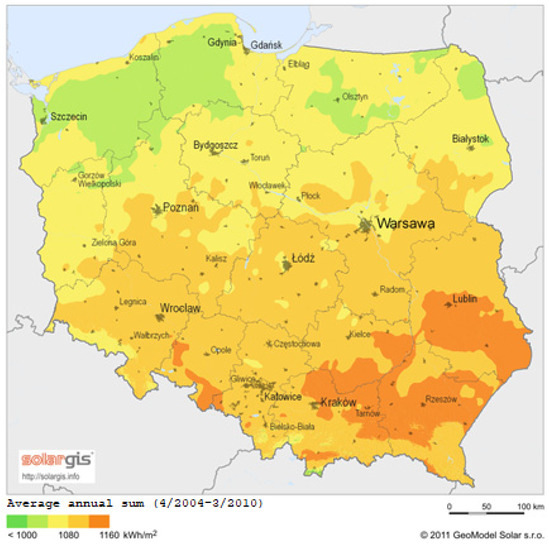
Figure 5.
The horizontal-plane insolation in Poland [38].
The research focused on determining the angle of inclination and the type of substrate (different albedo coefficients) that influences the bifacial photovoltaic modules’ operation. The tested angles were in the 15–90° range with 15° increments.
The substrates used for measurements were grass, white substrate, and foil, which well reflects solar irradiance. Grass’ reflectance is in the range between 0.15 and 0.26 [39]. The white material imitates concrete or white sand, with the respective albedo of 0.2–0.4 and 0.6 [39]. The foil used for tests was a thin sheet of metallized plastic, which has a high radiation reflectance, ranging from 0.8 to 0.9.
Figure 6 demonstrates the module inclinations (selected angles). Figure 6a presents the test object on a grassy substrate, and Figure 6b shows the system with the under-module surface covered with a white substrate; Figure 6c shows a foil substrate.
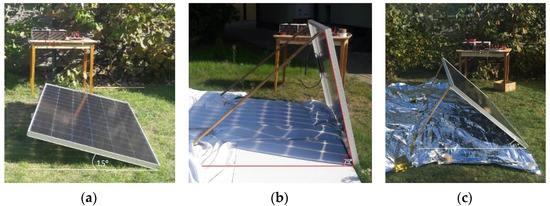
Figure 6.
The measurement stands for tested variants: (a) the measurement for 15° angle with grass substrate; (b) measurement for 75° angle with a white substrate; (c) the measurement for 45° angle with a substrate composed of foil.
When determining the bifacial module parameters, assume that the short-circuit current of the front and rear side of the module depends linearly on the irradiance reaching the given part of the module. Moreover, the total short circuit current of the bifacial module is assumed to be the total of the front and rear side currents. The selected values to compare the bifacial module work in different conditions:
- 1
- Power generated by the module, P [40]:
- 2.
- The filling factor of photovoltaic module, FF determines the maximum value ratio achieved by a power module vs. the theoretical maximum power of a module [40]:
- 3.
- The module efficiency,η, i.e., the module’s generated power ratio vs. the energy which reaches the module [40]:
- 4.
- BGE index indicates the additional power generated by the rear side of the module related to that produced at the front side of the module [1]:
- 5.
- BGEIsc index determines the current efficiency ratio of the rear side of the module to the current efficiency of the front side [1]:
- 6.
- The total value of irradiance that reached the module, EE [1,28]:
- 7.
- Short-circuit current of the bifacial module, Isc,bi [1]:
- 8.
- The open-circuit voltage of the bifacial module, Uoc,bi [1]:
- 9.
- Pseudo fill factor, pFF, which does not consider the losses generated by series resistance [29]:
- 10.
- The fill factor of the bifacial module, FFbi [1]:
3. Measurement Results
3.1. The Module Inclination Angle’s Influence on Electricity Generation
3.1.1. The Study of the Module Inclination Angle’s Influence on Electricity Generation on a Grassy Substrate
The measurements were performed in the autumn; the module inclination angles to the ground substrate: 15, 30, 45, 60, 75, and 90 degrees, respectively. The conditions during the measurement demonstrated in Table 3 and the current-voltage and power-voltage characteristics are shown in Figure 7.
Table 3.
The measurement conditions for a grassy substrate.
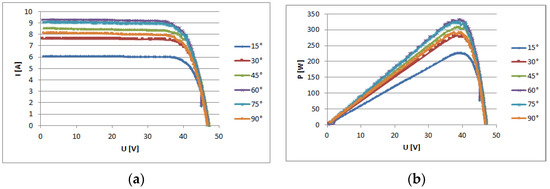
Figure 7.
The bifacial module’s characteristics for grass substrate: (a) current-voltage characteristics; (b) power-voltage characteristics.
Table 4 presents the measurements results and calculated values: the fill factor and efficiency of various configurations of the module inclinations set against the grassy substrate.
Table 4.
Results of measurements and calculations for a grassy substrate.
The photocurrent voltage and intensity measurements at the insolation were in the range of approx. 820–1050 W/m2. The open-circuit voltage for each tested module inclination was approximately 47 V. The short-circuit current ranged from 6.1 A for an angle of 15° up to 9.3 A for an angle of 60°. For higher values of the inclination angle, there was a decrease for both the irradiance value reaching the module and the currents and generated power. A conclusion can be drawn based on the power characteristics comparison; the highest generated power of 332.7 W was obtained with the 60° angle and irradiance over 1040 W/m2. In the winter months, when the sun is lower in the sky in a particular location, the highest energy yields were generated for modules uninclined in the 60–70° angles range. The module inclined at 75° angle was also advantageous. The average radiation energy was lower by approx. 80 W/m2, and the power characteristic slightly differed from the characteristics for the 60° angle. The highest, 16.3% efficiency, was reported for the 90° inclination angle, while the lowest efficiency was 13.1% for 15°.
3.1.2. The Study of the Module Inclination Angle’s Influence on Electricity Generation on a White Substrate
Measurements on the white substrate were performed in autumn 2020, as was the case of the grassy substrate. The conditions during the measurement demonstrated in Table 5 and the current-voltage and power-voltage characteristics are shown in Figure 8.
Table 5.
The measurement conditions for a white substrate.
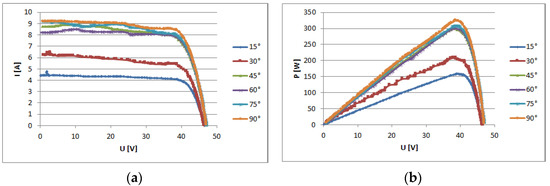
Figure 8.
The bifacial module’s characteristics—measurements for white substrate: (a) current-voltage characteristics; (b) power-voltage characteristics.
Table 6 presents the measurements results and calculations for inclinations of the module over the white substrate.
Table 6.
Results of measurements and calculations for a white substrate.
The photocurrent voltage and intensity measurements for the white substrate at the insolation were in the range of approx. 575–1030 W/m2. The smallest measurement values related to the 15° and 30° inclination. There was smaller differentiation of the solar radiation energy measured at 45°, 60°, 75°, and 90° angles. The open-circuit voltage for each tested module setting was in the 46.5–47 V range. The short-circuit current range was 4.8 A for the 15° angle up to 9.3 A for the 75° angle. Slight changes in cloud cover might have caused the current value fluctuations. The power characteristics comparison concludes that the highest generated power was for the angle of 90° and amounted to 325.9 W. The fill factor was the highest for 60° and the lowest for 30° angles. The highest, 17.6% efficiency, was reported for the 90° inclination angle, while the lowest efficiency was 13% for 15°.
3.1.3. The Study of the Module Inclination Angle’s Influence on Electricity Generation on a Foil Substrate
The measurements were performed in autumn 2020, the conditions during the measurement are demonstrated in Table 7, and the current-voltage and power-voltage characteristics are shown in Figure 9.
Table 7.
The measurement conditions for a foil substrate.
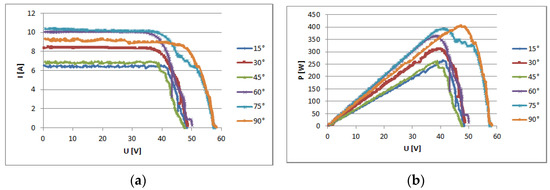
Figure 9.
The bifacial module’s characteristics—measurements for the foil substrate: (a) current-voltage characteristics; (b) power-voltage characteristics.
Table 8 presents the measurements results and calculations for inclinations of the module over the foil substrate.
Table 8.
Results of measurements and calculations for a foil substrate.
The photocurrent voltage and intensity measurements for the foil substrate at the insolation were in the range of approx. 760–1090 W/m2. The current-voltage characteristic for 75° was irregular, which was related to the atmospheric conditions’ variability and the rapidly changing cloudiness during the measurement. The open-circuit voltage ranged from 47.6 V at the 45° inclination angle to 58.4V at the module’s 90° inclination angle in relation to the surface. During the measurements, the open-circuit voltage was as much as 9 V higher than the open-circuit voltage under STC conditions, i.e., to 49.2 V. The short-circuit current’s values ranged from 6.5 A for 15° to 10.4 A for 75° angle. The short-circuit current for standard test conditions is 10.15 A; thus, it was slightly higher, resulting from a higher irradiance value than the STC conditions. A conclusion can be drawn based on the power characteristics comparison; the highest generated power of 404 W was obtained with the 90° angle, and irradiance was 404 W/m2. The fill factor was the highest for 15° and the lowest for 75° angle because of the sudden cloudiness and current drop at 45 V. The highest, 20.75% efficiency, was reported for the 90° inclination angle, while the lowest efficiency was 15.2% for 45°.
3.2. The Influence of the Substrate on Electricity Generation in Bifacial PV Modules
3.2.1. A Comparative Analysis of the Substrate Influence on Electricity Generation in Bifacial PV Modules for the 60° Inclination Angle and Different Substrates
On 6 October 2020, additional measurements, current-voltage characteristics (Figure 10a), and power-voltage characteristics (Figure 10b) were performed in order to compare the influence of the substrate type on the value of the power generated by the bifacial module. The irradiance was 1030–1060 W/m2, and the module inclination angle to the surface was 60°. The measurements were repeated twice for each substrate, with different irradiance values in order to obtain more accurate results.
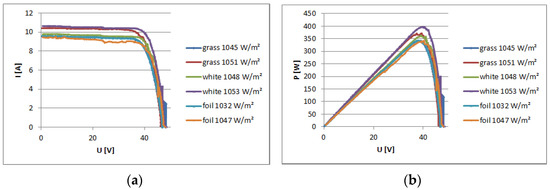
Figure 10.
Comparative characteristics of the bifacial module set at an angle of 60° using different substrates: (a) current-voltage characteristics; (b) power-voltage characteristics.
Table 9 presents the measurements results and calculations for 60° inclination of the module over different substrates.
Table 9.
The measurements results and calculations for 60° inclination of the module.
There was similar radiation for each measurement, and the characteristics have a similar course. The open-circuit voltage reached the highest value of 51.1 V for the white substrate with an average of 1048 W/m2 insolation; the greatest short-circuit current was recorded with 1053 W/m2 radiation in the case of the same substrate. The maximum power recorded with the above measurements was 396.7 W. The lowest of all maximum powers was 340.7 W and was recorded for a grassy substrate, with an insolation of 1045 W/m2. The fill factor reached the highest at 76.8% value for the white substrate and the lowest for the foil substrate at 68.2%. The highest efficiency was recorded for the white substrate at 17.8%. With practically identical irradiance values (1045–1048 W/m2), the module’s highest parameters were recorded when the module was mounted over a white substrate. Similar results were recorded for the grass and foil, despite the foil having a higher albedo. This was influenced because not only did the foil reflect the sunlight, but it also caused many glares and backlights reflected from the module’s glass surface; this impeded the sunlight from reaching the solar cells. The temporary cloudiness during when the last measurements with the use of foil were performed resulted in a slight “bend” of the curves (in the 25–35V voltage range) visible on the characteristics. This was manifested with the lower values of the FF coefficient compared to grass substrates. Compared to all other substrates, the bifacial modulus generated 6.5% more power under the same external conditions when a white substrate was used.
3.2.2. A Comparative Analysis of the Substrate Influence on Electricity Generation in Bifacial PV Modules for the 75° Inclination Angle of the Module and Different Substrates
In order to confirm the measurement results presented in Section 3.2.1, current-voltage characteristics (Figure 11a) and the power-voltage characteristics (Figure 11b) were conducted in order; the irradiance range was 950–1150 W/m2, and the module inclination angle to the surface was 75°.
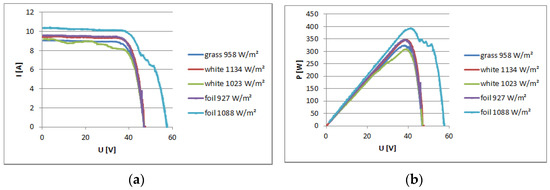
Figure 11.
Comparative characteristics of the bifacial module set at an angle of 75° using different substrates: (a) current-voltage characteristics; (b) power-voltage characteristics.
Table 10 presents the measurements results and calculations for 75° inclination of the module over different substrates.
Table 10.
The measurements results and calculations for 75° inclination of the module mounted over different substrates.
The results analyses indicate that the best results were reported for the substrate composed of foil. The maximum power generated by the module was 393.5 W, with average insolation of 1088 W/m2. The apparent change in the curve’s slope was caused by sudden cloudiness; thus, it can be assumed that obtained results would have been better in clear-sky conditions. The measurement with the white and foil substrate had a similar characteristic course. The measurements were performed at different insolation values. In the case of the white substrate, the irradiance power was higher by approx. 100 W/m2 compared to the measurement performed with the foil substrate. Thus, it can be concluded that the use of a foil substrate is more advantageous. The measurement for the grass substrate was performed at approx. 960 W/m2 insolation. The power at the maximum power point was 324.6 W. The second measurement for the white substrate was performed with an average of 1023 W/m2 radiation. The current value fluctuations may be caused by changes in cloud cover, which occurred during the measurement procedure. The fill factors ranged from 67.2% to 78.4%, and the efficiencies ranged from 14.26% to 17.66%. A comparison of the power generated by the module working over the foil substrate, the reported value was approx. 6.5% higher than that for the white substrate, and as much as approx. 20% higher than that for the white substrate.
In summary, the module inclination angle played a significant role at similar external conditions and the same substrates. An increased inclination angle resulted in an increase in the substrate surface, reflecting the radiation to the rear of the module.
3.3. Contribution of the Bifacial Photovoltaic Module’s Rear Side towards Electricity Generation
3.3.1. The Measurement of the Current and Power Values Generated by the Whole Module and Its Rear Side, a Grassy Substrate, 75° Inclination
In order to compare the characteristic parameters’ values of the bifacial module in the whole-module generation vs. its rear side cells generation, the measurements were performed for the module inclined at 75° angle mounted over grass. A tabulation of current-voltage characteristics (Figure 12a) and power-voltage characteristics (Figure 12b) was generated.
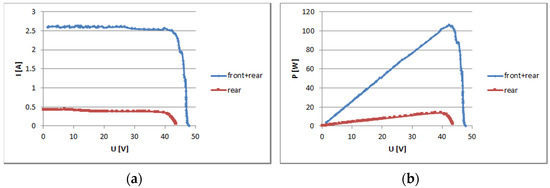
Figure 12.
The whole vs. rear side yield characteristics benchmark in a bifacial module: (a) current-voltage characteristics; (b) power-voltage characteristics for 75° inclination, over the grass substrates.
Table 11 presents the measurement results and calculations for 75° inclination of the module over the grass substrate, the values for the whole-module generation and its rear side generation.
Table 11.
The measurement results and calculations for 75° inclination of the module over the grass substrate, considering the values for the whole-module generation and its rear side generation.
The average radiation incident on the front side of the module was 159 W/m2, the rear side of the module—an average of approx. 68 W/m2. The short-circuit current for the whole module was more than six times greater than the current generated by its rear side. During the bifacial module operation, the open-circuit voltage was 47.9 V, while its rear part only—the open-circuit voltage of 43.6 V. The total maximum power of the module under the given weather conditions was 106.5 W; the power generated by the module rear side was 13.8 W, thus an additional 13% of the power. The fill factor for the entire module was 85.3%, with 73.7% for the rear part only and 88% for the front part. The module’s front side efficiency was 27.3%, and its rear side—9.6%.
3.3.2. The Measurement of the Current and Power Values Generated by the Whole Module and Its Rear Side, a White Substrate, 75° Inclination
In order to compare the characteristic parameters’ values of the bifacial module in the whole-module generation vs. its rear side cells generation, the measurements were performed for the module inclined at 75° angle mounted over a white substrate. A tabulation of current-voltage characteristics (Figure 13a) and power-voltage characteristics (Figure 13b) was generated.
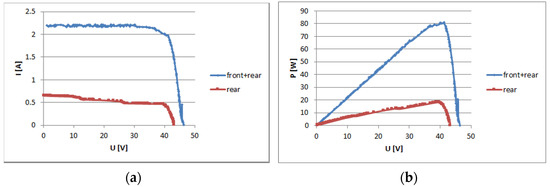
Figure 13.
The whole vs. rear side yield characteristics benchmark in a bifacial module: (a) current-voltage characteristics; (b) power-voltage characteristics for 75° inclination, over the white substrates.
Table 12 presents the measurement results and calculations for 75° inclination of the module over the white substrate, the values for the whole-module generation, and its rear side generation.
Table 12.
The measurement results and calculations for 75° inclination of the module over the white substrate, considering the values for the whole-module generation and its rear side generation.
The measurement was performed with moderate cloudiness. The radiation that reached the rear side of the module averaged 68 W/m2. A much lower short-circuit current value at the rear side was noticed compared to the whole module. The open-circuit voltage also had a lower value. The power at the maximum power point for the whole was 81.1 W, with only 18.3 W at the rear side of the module, which accounted for 22.6% of the whole module power. The fill factor for the whole module was 79.7%; this parameter was 64.8% for the rear side of the module and 86.8% for the front side. The efficiency measurement for the whole module was 15.4%, 12.7% for the rear side, and 16.2% for the front side. Again, the overall efficiency of the bifacial panel largely depends on its front side efficiency, with overall efficiency being slightly lower than the front side’s efficiency.
3.3.3. The Measurement of the Current and Power Values Generated by the Whole Module and Its Rear Side, a Foil Substrate, 75° Inclination
In order to compare the characteristic parameters’ values of the bifacial module in the whole-module generation vs. its rear side cells generation, the measurements were performed for the module inclined at 75° angle mounted over the foil substrate. A tabulation of current-voltage characteristics (Figure 14a) and power-voltage characteristics (Figure 14b) was generated.
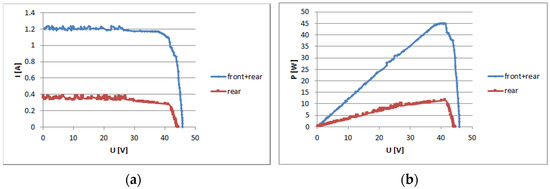
Figure 14.
The whole vs. rear side yield characteristics benchmark in a bifacial module: (a) current-voltage characteristics; (b) power-voltage characteristics for 75° inclination over the foil substrates.
Table 13 presents the measurements results and calculations for 75° inclination of the module over the foil substrate, the values for the whole-module generation, and its rear side generation.
Table 13.
The measurements results and calculations for 75° inclination of the module over the foil substrate, considering the values for the whole-module generation and its rear side generation.
The measurements were performed with dense cloud cover. The irradiance on the front side of the module was only 97 W/m2 and reached only half of this value (48 W/m2) on the rear side. The open-circuit voltage in both cases had similar values due to the relatively low value of irradiance reaching the PV cells. The maximum power reached 44.9 W for the whole module and only 11.6 W for the rear side. The fill factor was 80.1% for the whole module, 77.5% for the rear side, and 82.3% for the front side. The efficiencies were respectively 14.7%, 11.4%, and 16.4%.
With heavy cloud cover, the power generated by the rear side of the module was 25.6% of the total power generated at the maximum power point, as demonstrated in Table 14.
Table 14.
A comparison of the generated power value of the test of the module—inclination of 75° angle mounted above the foil substrate.
3.3.4. The Measurement of the Current and Power Values Generated by the Whole Module and Its Rear Side, a Grassy Substrate, 60° Inclination
In order to compare the characteristic parameters’ values of the bifacial module in the whole-module generation vs. its rear side cells generation, the measurements were performed for the module inclined at 60° angle mounted over grass. A tabulation of current-voltage characteristics (Figure 15a) and power-voltage characteristics (Figure 15b) was generated.
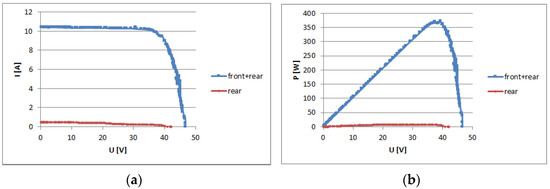
Figure 15.
The whole vs. rear side yield characteristics benchmark in a bifacial module: (a) current-voltage characteristics; (b) power-voltage characteristics for 60° inclination over the grass substrates.
Table 15 presents the measurement results and calculations for 60° inclination of the module over the grass substrate, the values for the whole-module generation and its respective parts’ generation.
Table 15.
The measurements results and calculations for 60° inclination of the module over the grass substrate, considering the values for the whole-module generation and its rear side generation.
The atmospheric conditions during the measurements were constant. The radiation incident on the front side of the module was 1045 W/m2, the radiation incident on the rear side of the module was 47 W/m2. The current generated reached a value of slightly over 10.4 A—the measurement for the whole working module. The short-circuit current was 0.5 A when only rear side of the module was working. The open-circuit voltage was 46.8 V, 42.2 V, and 46.8 V. The module’s maximum power in the given conditions was 371.4 W; the maximum power generated by the module rear side was 8.7 W. The fill factor was 76.2% for the whole module and 41.3% for the rear side. The efficiency was 16.1%, 8.7%, and 16.1%.
3.3.5. The Measurement of the Current and Power Values Generated by the Whole Module and Its Rear Side, a White Substrate, 60° Inclination
In order to compare the characteristic parameters’ values of the bifacial module in the whole-module generation vs. its rear side cells generation, the measurements were performed for the module inclined at 60° angle mounted over a white substrate. A tabulation of current-voltage characteristics (Figure 16a) and power-voltage characteristics (Figure 16b) was generated.
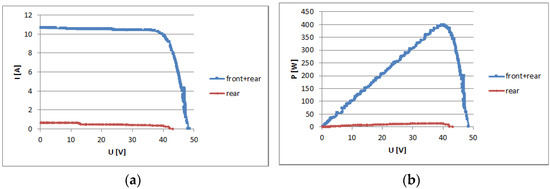
Figure 16.
The whole vs. rear side yield characteristics benchmark in a bifacial module: (a) current-voltage characteristics; (b) power-voltage characteristics for 60° inclination over the white substrates.
Table 16 presents the measurement results and calculations for 60° inclination of the module over the white substrate, the values for the whole-module generation, and its respective parts’ generation.
Table 16.
The measurements results and calculations for 60° inclination of the module over the white substrate, considering the values for the whole-module generation and its rear side generation.
The measurements were performed at intense insolation with an average value of 1045 W/m2. The short-circuit current of the entire module was 10.6 A. This value is less than 10 A lower, with only the rear of the module working. The open-circuit voltage for the whole module was 48.6 V, and for the rear side only, 43.2 V The power at the maximum power point was 396.7 W for the whole module. This value was 14.7 W for the rear side of the module. The fill factor was 76.8% for the whole module and 49.7% for the rear side. The efficiency was 16.9%, 10.7% and 17.3%.
3.3.6. The Measurement of the Current and Power Values Generated by the Whole Module and Its Rear Side, a Foil Substrate, 60° Inclination
In order to compare the characteristic parameters’ values of the bifacial module in the whole-module generation vs. its rear side cells generation, the measurements were performed for the module inclined at 60° angle mounted over the foil substrate. A tabulation of current-voltage characteristics (Figure 17a) and power-voltage characteristics (Figure 17b) was generated.
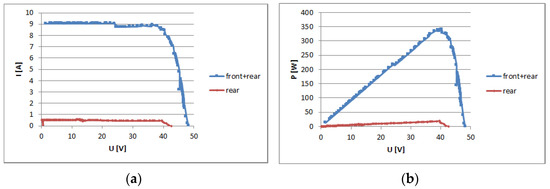
Figure 17.
The whole vs. rear side yield characteristics benchmark in a bifacial module: (a) current-voltage characteristics; (b) power-voltage characteristics for 60° inclination over the foil substrates.
Table 17 presents the measurement results and calculations for 60° inclination of the module over the foil substrate, the values for the whole-module generation and its respective parts’ generation.
Table 17.
The measurements results and calculations for 60° inclination of the module over the foil substrate, considering the values for the whole-module generation and its rear side generation.
The measurements for the module front side, with irradiation slightly over 1030 W/m2 and for the rear side, were at a low 80 W/m2 level. The short-circuit current for the whole module was less than 9.1 A, and for the rear side of the module only, less than 0.6 A. The open-circuit voltage for the whole module was 48.2 V and 42.6 V for the rear side. The power at the maximum power point for the whole module was 341 W, and for the module rear side was 18.8 W. The fill factor was 77.8%, 75.7%, and 78.5%. The whole module efficiency was 14.5%, 14.8% for the front side and 11.1% for the rear side. The efficiency of the front side was again proven to play an important role in the overall panel’s results.
4. Discussion
The project’s measurements made it possible to test the bifacial photovoltaic module operation in various conditions. The factors which have been examined and found to influence the module’s performance are the module’s inclination angle in relation to the substrate and various substrate types under its module.
For grass-covered ground, the highest power was recorded for the module’s inclination angle 60° and 75° in relation to the ground. The lowest values were reported with the module’s inclination at 15° angle, the highest efficiency with the 90° angle. In the case of the white substrate, the maximum power was recorded with the 90° inclination angle; the module mounted at the 75, 60, and 45° angle in relation to the ground also proved to be a beneficial option. In the case of the foil substrate, the test was conducted under changing weather conditions; rapid radiation changes are reflected in photocurrent fluctuations. The results show that the 90, 75, and 60° angle in relation of the module to the ground were advantageous. These values were optimal for each of the tested substrates. The optimal inclination angle for a single-sided module mounted in Central Europe was within the 25–70° range, depending on the period; in the spring and summer period, 30 to 45° angle proved to be the most optimal [8]. A greater inclination angle for double-sided modules indicates that the rear side cells absorb more solar radiation, owing to the radiation reflected from a larger substrate surface than that in the panel with a smaller inclination angle.
Subsequent measurements made it possible to compare the influence of the particular substrate on the module’s operation. The tests were conducted with the 75 and 60° inclination angles and with similar irradiance values. The best results were achieved with 75° inclination with the foil substrate. The white substrate and the grassy substrate had similar results. For the 60° inclination angle, the maximum power was achieved with the white substrate. The module assembled above the surface covered with a radiation-reflecting foil or a white-coated substrate had a positive effect on the generation of electricity in the module; this was caused by a high albedo coefficient of the substrates and the increased solar energy reaching the rear PV cells of the bifacial module.
The characteristics presented in the second part of this paper demonstrates the operation-related data of both the front and rear side of the module and only its rear side. This illustrates the additional energy yield from the rear side of the module. The recorded values of photocurrent were measured when the module’s front side reached up to 0.7 A. The maximum rear side power of the module is demonstrated in Table 12 and Table 17; the values are 18.3 W and 18.8 W, respectively. With a heavy cloud cover, when the irradiance value was below 100 W/m2, the module’s rear side proportion of energy was more noticeable than intense incident radiation. Table 14 compares the module’s front and rear side yields. The power at the maximum power point for the rear side was 25.6% of the total power generated by the whole module.
In order to determine the parameters characteristic for the bifacial panels, calculations were performed with the use of Equations (4)–(10). The results are presented in the tabularized form in Table 18. The data demonstrates that the additional energy yield in the bifacial module depends on the inclination angle and the type of substrate; the greater the inclination angle and the higher albedo, the greater the BGE increases. There is a wide variation in the results; they range from 2.4% to as much as 35.5%, which was caused by the total increase of short-circuit current of the module, from 5% to as much as 42%. This results from the fact that the rear side cells can generate the same current and voltage values as the front side cells; thus, the vertical orientation of the bifacial panels in the east-west direction will result in symmetrical power gains (with constant irradiance) maintained during the day.
Table 18.
A comparison of the calculated parameters for the bifacial module tested in various operating conditions.
The particularly important parameter can be used for simulation tests is the GE indicator, which informs about the value of irradiance incident on the front side of the module and which will generate the power equal to the power value when the bifacial module operates in certain conditions. Thus, it is not necessary to know the value of the irradiance reaching the rear of the module and the inclination angle and the substrate albedo. The determined cells’ fill factor FF also indicates the good quality of the cells.
In order to determine the unit cost of electricity generation from various photovoltaic installations, based on bifacial and traditional photovoltaic modules, analysis of the discounted unit cost of energy generation was conducted. Due to most of the financial outlays incurred today (mainly investment costs) and the effects observed in the future, in a longer time horizon, the conducted economic calculations should be standardized to a common time point using the discount account (discount rate df). The UNIPEDE method proposed by the International Union of Producers and Distributors of Electricity consists of analyzing the valuation of current expenses and future income using the discount factor. The discounted unit cost of electricity generation for an installation whose construction period does not exceed one year can be calculated from the relationship [41]:
where: kjf—discounted unit cost of electricity generation (EUR/kWh), KI0—investment expenditure (EUR), KUt—maintenance and repair costs in a given year (EUR), KP—cost of fuel used to generate a unit of electricity in a given year (EUR), Et—the amount of electricity produced in a given year (kWh), df—discount rate in the year of the investment (-).
In order to perform a comparative unit cost of electricity generation from a photovoltaic installation based on traditional PV panels and bifacial modules, the following costs (collected in Table 19) and data were assumed:
Table 19.
Costs of the components of the photovoltaic installation subject to the analysis [EUR].
- annual energy yield from 1 kW of installed power at the level of 1000 kWh/year;
- for installations with bifacial modules, the data presented in Table 18 calculated BGE indices, indicating increased energy yields,
- a linear decrease in the installation capacity of 0.7% per year was assumed;
- installation lifetime of 25 years;
- KI0 investment outlays include photovoltaic modules, an inverter, accessories, and labor;
- the KUt maintenance costs include the replacement of the inverter with a new one in the 13th year of the installation’s use, inspection, and cleaning of the installation;
- KP fuel costs 0 EUR;
- the “Accessories” item (Table 19) includes the cabling, required protections, etc.;
- discount rate df = 7%.
Installation based on bifacial panels is characterized by higher investment costs (as the price of bifacial modules is approx. 65% higher than the price of traditional PV panels). In certain cases, an inverter with a higher power should also be used due to the higher values of the generated power. For bifacial modules, a higher maintenance cost was also assumed, e.g., due to the need to wash the back side of the module (EUR 65.93 instead of EUR 43.96). The remaining elements of the installation, such as electrical installation equipment (protections, limiters, disconnectors, etc.) are comparable in both cases. To calculate the unit costs of electricity generation, the power of the installation was referred to 1 kW.
The results of the calculations of the discounted unit cost of electricity generation, in accordance with relationship Equation (11), for the analyzed types of photovoltaic installations are presented in Table 20.
Table 20.
Unit costs of electricity generation for various types of photovoltaic installations [EUR/kWh].
The obtained values of the discounted unit cost of electricity generation from photovoltaic installations using traditional PV panels are approx. 0.1055 EUR/kWh. The costs of generating energy in a photovoltaic installation using bifacial modules range from 0.1385–0.1033 EUR/kWh. As the ratio of additional energy obtained from the back side of bifacial modules increases, the costs of power generation decrease, and at the highest values of the ratios obtained they are slightly lower for traditional modules. The development of photovoltaic systems’ technology and the increasing efficiency and awareness of scientists, producers, and investors result in a decrease in the prices of installation components, which translates into lower energy production costs.
5. Conclusions
Research on new technologies and increasing the efficiency of the solutions used now make it possible to further develop renewable energy sources. RES use is important in improving the natural environment’s quality and making it possible to discontinue the use of non-renewable, exhaustible sources.
Electricity generation from photovoltaic modules has increased over time; in addition to standard single-sided modules, bifacial modules are also used.
This paper focused on the influence of selected parameters, i.e., the angle of inclination of the panel to the substrate and the type of this substrate, on the operation of bifacial photovoltaic modules. The comparison to classic, one-sided modules may be of particular interest.
The latter makes it possible to increase the energy yield with the same surface the cells are mounted on. Bifacial modules’ work depends on, inter alia, the inclination angle. The optimal inclination angle in relation to the ground of the bifacial module is greater than that of single-sided modules.
In the case of single-sided modules, for a given latitude, the key parameter is the module inclination angle in relation to the ground. In Poland, this angle is on average 37° to the south and is within the range of the most frequently used roof slope angles of single-family houses (20–45°). For bifacial modules, the optimal angle is larger (60–75°), which implies the use of these modules in installations mounted on flat roofs or on the ground. A consequence of this larger angle is also the possibility of placing more modules, and hence the installed power, per unit area.
Another conclusion from the conducted research is the answer to the question of whether a several percent increase in the generated power from a single module is sufficient from an economic viewpoint for the use of this type of module in a PV farm. In most cases, apart from the base composed of aluminum foil, the cost of producing 1 kWh of energy is higher for the bifacial module. A key component of this cost is the price of the module itself. However, in the case of high costs of obtaining land for a PV farm, bifacial modules may be a better solution.
The type of surface under the module is also important, as substrates with a higher albedo make it possible to generate higher powers in double-sided modules than when using substrates with a lower reflectance value. There is another argument favoring bifacial technology; the increasing popularity of “cool roof” systems covered with a light coating that reflects solar radiation well. The roof’s white top layer reflects radiation of greater power directed to the rear side of the module. A further increase in solar radiation sources to generate electricity in the energy mix on a global scale is expected. The use of solar-tracking systems as supporting structures for bifacial panels will result in a significant increase in yields compared to traditional solar panels.
Among the directions of further research on the use of bifacial modules, in our opinion, the analysis of the impact of the size of transparent gaps between individual cells on the efficiency of the entire panel deserves special attention.
Author Contributions
Conceptualization and methodology, A.D. and E.M.; validation, D.K.; formal analysis, E.M.; writing—original draft preparation, E.M. and D.K.; writing—review and editing, A.D. All authors have read and agreed to the published version of the manuscript.
Funding
This research is funded by the project “Analysis of electricity yields from bifacial panels in various assembly configurations” no. 0212-SBAD-0540, financed by the Polish Ministry of Education and Science.
Institutional Review Board Statement
Not applicable.
Informed Consent Statement
Not applicable.
Conflicts of Interest
The authors declare no conflict of interest.
List of Symbols Used
| P | power generated by the PV module (W) |
| I | current of the PV module (A) |
| U | voltage of the PV module (V) |
| PMPP | power at the maximum power point (A) |
| IMPP | current intensity at the maximum power point (A) |
| UMPP | voltage at maximum power point (V) |
| UOC | open-circuit voltage (V) |
| ISC | short-circuit current intensity (A) |
| η | efficiency of the PV module (-) |
| FF | fill factor of photovoltaic module (-) |
| pFF | pseudo fill factor, which does not consider the losses generated by series resistance (-) |
| E | solar irradiance intensity, irradiance (W/m2) |
| EE | the total value of irradiance that reached the bifacial module (W/m2) |
| S | module’s surface area (m2) |
| BGE | additional energy (power) ratio generated by the rear part of the module in relation to the energy (power) generated by the panel front part (%) |
| BGEIsc | current efficiency ratio of the rear side of the module to the current efficiency of the front side (-) |
| n | number of PV cells in the module (pcs.) |
| k | Boltzmann constant (1.38 × 10⁻²³ J/K) |
| q | electric charge (1 eV = 1.6 × 10⁻¹⁹ J) |
| T | temperature (298 K) |
| Subscript bi | refers to the bifacial module |
| Subscript rear | refers to the rear side of the bifacial module |
| Subscript front | refers to the front side of the bifacial module |
References
- Kurz, D.; Lewandowski, K.; Szydłowska, M. Analysis of efficiency of photovoltaic bifacial cells. In Proceedings of the ITM Web of Conferences 19/2018, Poznań, Poland, 23–24 April 2018; p. 01020. [Google Scholar] [CrossRef]
- Aoyama, T.; Aoki, M.; Sumita, I.; Yoshino, Z.; Ogura, A. Effect of Glass Frit in Metallization Paste on the Electrical Losses in Bifacial N-type Crystalline Silicon Solar Cells. In Proceedings of the 43rd IEEE Photovoltaic Specialists Conference (PVSC), Portland, OR, USA, 5–10 June 2016; pp. 2854–2858. [Google Scholar]
- Schmid, A.; Reise, C. Realistic Yield Expectations for Bifacial PV Systems—An Assessment of Announced, Predicted and Observed Benefits, Fraunhofer Institute for Solar Energy Systems ISE, 2015, Kolonia. Available online: https://www.tuv.com/media/corporate/solar_1/pv_modulworkshop_2/42_Reise_Realistic_Yield_Expectations_for_Bifacial_PV_Systems.pdf (accessed on 23 January 2021).
- Langels, H.; Gannedahl, F. BiFacial PV Systems A Technological and Financial Comparison between BiFacial and Standard PV Panels, Uppsala, 2018. Available online: https://www.diva-portal.org/smash/get/diva2:1218780/FULLTEXT01.pdf (accessed on 12 January 2021).
- International Technology Roadmap for PV(ITRPV) 2018 Results, Version 10. Available online: https://itrpv.vdma.org/en/ (accessed on 1 May 2021).
- Wang, X.; Barnett, A. The Evolving Value of Photovoltaic Module Efficiency. Appl. Sci. 2019, 9, 1227. [Google Scholar] [CrossRef]
- Cha, H.L.; Bhang, B.G.; Park, S.Y.; Choi, J.H.; Ahn, H.K. Power Prediction of Bifacial Si PV Module with Different Reflection Conditions on Rooftop. Appl. Sci. 2018, 8, 1752. [Google Scholar] [CrossRef]
- Faturrochman, G.J.; de Jong, M.M.; Santbergen, R.; Folkerts, W.; Zeman, M.; Smets, A.H.M. Maximising annual yield of bifacial photovoltaic noise barriers. Sol. Energy 2018, 162, 300–305. [Google Scholar] [CrossRef]
- Jong, M.M.; Kester, J.; van der Graaf, D.; Verkuilen, S.; Folkerts, W. Building the world’s largest bifacial solar noise barrier. In Proceedings of the EUPVSEC, Brussels, Belgium, 7–11 September 2018; pp. 1493–1495. [Google Scholar]
- Khan, M.R.; Hanna, A.; Sun, X.; Alam, M.A. Vertical bifacial solar farms Physics, design, and global optimisation. Appl. Energy 2017, 206, 240–248. [Google Scholar] [CrossRef]
- Ricco Galluzzo, F.; Zani, P.E.; Foti, M.; Canino, A.; Gerardi, C.; Lombardo, S. Numerical Modeling of Bifacial PV String Performance: Perimeter Effect and Influence of Uniaxial Solar Trackers. Energies 2020, 13, 869. [Google Scholar] [CrossRef]
- Mermoud, A.; Wittmer, B. Yield simulations for horizontal axis trackers with bifacial PV modules in PVsyst. In Proceedings of the EUPVSEC, Brussels, Belgium, 7–11 September 2018; pp. 1929–1934. [Google Scholar]
- Kopecek, R.; Libal, J. Bifacial Photovoltaics 2021: Status, Opportunities and Challenges. Energies 2021, 14, 2076. [Google Scholar] [CrossRef]
- IEC 60904-1:2020, Photovoltaic Devices—Part 1: Measurement Of photovoltaic Current-Voltage Characteristics; IEC: Geneva, Switzerland, 2020.
- Fakhfouri, V. Photovoltaic Devices—Part 1–2: Measurement of Current-Voltage Characteristics of Bifacial Photovoltaic (PV) Devices, Proposal 82/1044/NP; IEC: Geneva, Switzerland, 2015. [Google Scholar]
- Bifacial Solar Photovoltaic Modules Program on Technology Innovation. Electric Power Research Institute. 2016. Available online: https://www.epri.com/research/products/3002009163 (accessed on 1 May 2021).
- Wang, S.; Wilkie, O.; Lam, J.; Steeman, R.; Zhang, W.; Khoo, K.S.; Sim, C.S.; Rostan, H. Bifacial photovoltaic systems energy yield modelling. Energy Procedia 2015, 77, 428–433. [Google Scholar] [CrossRef]
- Yusufoglu, U.A.; Pletzer, T.M.; Koduvelikulathu, L.J.; Comparotto, C.; Kopecek, R.; Kurz, H. Analysis of the annual performance of bifacial modules and optimisation methods. IEEE J. Photovolt. 2015, 5, 320–328. [Google Scholar] [CrossRef]
- Yusufoglu, U.A.; Lee, T.H.; Pletzer, T.M.; Halm, A.; Koduvelikulathu, L.J.; Comparotto, C.; Kopecek, R.; Kurz, H. Simulation of energy production by bifacial modules with revision of ground reflection. Energy Procedia 2014, 55, 389–395. [Google Scholar] [CrossRef]
- Chudinzow, D.; Haas, J.; Diaz-Ferran, G.; Moreno-Leiva, S.; Eltrop, L. Simulating the energy yield of a bifacial photovoltaic power plant. Sol. Energy 2019, 183, 812–822. [Google Scholar] [CrossRef]
- Riedel-Lyngskær, N.; Berrian, D.; Alvarez Mira, D.; Aguilar Protti, A.; Poulsen, P.B.; Libal, J.; Vedde, J. Validation of Bifacial Photovoltaic Simulation Software against Monitoring Data from Large-Scale Single-Axis Trackers and Fixed Tilt Systems in Denmark. Appl. Sci. 2020, 10, 8487. [Google Scholar] [CrossRef]
- Pike, C.; Whitney, E.; Wilber, M.; Stein, J.S. Field Performance of South-Facing and East-West Facing Bifacial Modules in the Arctic. Energies 2021, 14, 1210. [Google Scholar] [CrossRef]
- Kopecek, R.; Libal, J. Towards large-scale deployment of bifacial photovoltaics. Nat. Energy 2018, 3, 443–446. [Google Scholar] [CrossRef]
- Olczak, P.; Olek, M.; Matuszewska, D.; Dyczko, A.; Mania, T. Monofacial and Bifacial Micro PV Installation as Element of Energy Transition—The Case of Poland. Energies 2021, 14, 499. [Google Scholar] [CrossRef]
- Park, H.; Chang, S.; Park, S.; Kim, W.K. Outdoor Performance Test of Bifacial n-Type Silicon Photovoltaic Modules. Sustainability 2019, 11, 6234. [Google Scholar] [CrossRef]
- Frydrychowicz-Jastrzębska, G.; Bugała, A. Modeling the Distribution of Solar Radiation on a Two-Axis Tracking Plane for Photovoltaic Conversion. Energies 2015, 8, 1025–1041. [Google Scholar] [CrossRef]
- Frydrychowicz-Jastrzębska, G.; Bugała, A. Solar Tracking System with New Hybrid Control in Energy Production Optimization from Photovoltaic Conversion for Polish Climatic Conditions. Energies 2021, 14, 2938. [Google Scholar] [CrossRef]
- Deline, C.; MacAlpine, S.; Marion, B.; Toor, F.; Asgharzadeh, A.; Stein, J.S. Assessment of Bifacial Photovoltaic Module Power Rating Methodologies—Inside and Out. IEEE J. Photovolt. 2017, 7, 575–580. [Google Scholar] [CrossRef]
- Singh, J.P.; Walsh, T.M.; Aberle, A.G. A new method to characterise bifacial solar cells. Prog. Photovolt. Res. Appl. 2014, 22, 903–909. [Google Scholar] [CrossRef]
- Janssen, G.J.M.; Tool, K.C.J.; Kossen, E.J.; Van Aken, B.B.; Carr, A.J.; Romijn, I.G. Aspects of bifacial cell efficiency. Energy Procedia 2017, 124, 76–83. [Google Scholar] [CrossRef]
- Kreinin, L.; Karsenty, A.; Grobgeld, D.; Eisenberg, N. PV systems based on bifacial modules: Performance simulation vs. design factors. In Proceedings of the IEEE PVSC, Portland, OR, USA, 5–10 June 2016; pp. 2688–2691. [Google Scholar]
- Sun, X.; Khan, M.R.; Deline, C.; Alam, M.A. Optimization and performance of Bifacial Solar Modules A global perspective. Appl. Energy 2018, 212, 1601–1610. [Google Scholar] [CrossRef]
- Burzyński, D.; Pietracho, R.; Kasprzyk, L.; Tomczewski, A. Analysis and Modeling of the Wear-Out Process of a Lithium-Nickel-Manganese-Cobalt Cell during Cycling Operation under Constant Load Conditions. Energies 2019, 12, 3899. [Google Scholar] [CrossRef]
- Jang, J.; Lee, K. Practical Performance Analysis of a Bifacial PV Module and System. Energies 2020, 13, 4389. [Google Scholar] [CrossRef]
- Jang, J.; Pfreundt, A.; Mittag, M.; Lee, K. Performance Analysis of Bifacial PV Modules with Transparent Mesh Backsheet. Energies 2021, 14, 1399. [Google Scholar] [CrossRef]
- Datasheet of Bifacial Module LG 390N2T-A5. Available online: https://www.lg.com/global/business/download/resources/solar/NeON%202%20BiFacial%2072cells.pdf (accessed on 27 May 2021).
- Data on Irradiance and Temperature in Poland, PVGIS. Available online: https://ec.europa.eu/jrc/en/pvgis (accessed on 14 December 2020).
- Data on Irradiation in Poland. Available online: https://solargis.com/ (accessed on 14 December 2020).
- Marion, B. Ground Albedo Measurements and Modeling, Lakewood, 2018. Available online: https://www.nrel.gov/docs/fy20osti/72589.pdf (accessed on 26 June 2020).
- Flizikowski, J.; Mroziński, A. Inżynieria instalacji fotowoltaicznych. In Engineering of Photovoltaic Installations; Grafpol: Bydgoszcz, Poland, 2016. (In Polish) [Google Scholar]
- Bickley, J.F.; Costantini, L.P.; Niebo, R.J. International Performance Definitions for Electric Generating Units: IEEE and UNIPEDE Working Together. In Proceedings of the Conference Record of the 1992 IEEE Industry Applications Society Annual Meeting, Houston, TX, USA, 4–9 October 1992; Volume 2, pp. 1281–1285. [Google Scholar] [CrossRef]


Publisher’s Note: MDPI stays neutral with regard to jurisdictional claims in published maps and institutional affiliations. |
© 2021 by the authors. Licensee MDPI, Basel, Switzerland. This article is an open access article distributed under the terms and conditions of the Creative Commons Attribution (CC BY) license (https://creativecommons.org/licenses/by/4.0/).