Article

Numerical Study and Experimental Validation of Skim Milk Drying in a Process Intensified Counter Flow Spray Dryer

by
Umair Jamil Ur Rahman
* and
Artur K. Pozarlik
Department of Thermal and Fluid Engineering, University of Twente, P.O. Box 217, 7500 AE Enschede, The Netherlands
*
Author to whom correspondence should be addressed.
Energies 2021, 14(16), 4974; https://doi.org/10.3390/en14164974
Submission received: 5 July 2021 / Revised: 5 August 2021 / Accepted: 9 August 2021 / Published: 13 August 2021
(This article belongs to the Special Issue CFD Modeling of Two-Phase Flows)

Abstract

:
This research presents 3D steady-state simulations of a skim milk spray drying process in a counter-current configuration dryer. A two-phase flow involving gas and discrete phase is modeled using the Eulerian–Lagrangian model with two-way coupling between phases. The drying kinetics of skim milk is incorporated using the Reaction Engineering Approach. The model predictions are found to be in accordance with the experimental temperature measurements with a maximum average error of 5%. The validated computational model is employed further to study the effects of nozzle position, initial spray Sauter Mean Diameter (SMD), air inlet temperature, and feed rate on the temperature and moisture profiles, particle impact positions, drying histories, and product recovery at the outlet. The location of the nozzle upwards (≈23 cm) resulted in maximum product recovery and increased the mean particle residence time at the outlet. A similar trend was observed for the highest feed rate of 26 kg/h owing to the increased spray penetration upstream in the chamber. The maximum evaporation zone was detected close to the atomizer (0–10 cm) when the spray SMD is 38 µm, whereas it shifts upstream (40–50 cm) of the dryer for an SMD of 58 µm. The high air inlet temperature resulted in enhanced evaporation rates only in the initial 10–20 cm distance from the atomizer. The results obtained in this study are beneficial for the development of the novel vortex chamber-based reactors with a counter flow mechanism.

Graphical Abstract

1. Introduction

Spray drying, a process first introduced by Percy in 1870 [1], is the most widely used method for producing milk powders. The process requires atomization of a concentrated liquid feed into tiny droplets (typical 10–200 µm) that undergo evaporation to produce dry solid powder [2,3]. In the Netherlands, milk powder contributes to around 13% of the total dairy exports of the country [4]. Despite being a mature technology, conventional dryers suffer from major challenges, such as large equipment size and high operational and maintenance costs. While counter-current dryers are thermally more efficient and require lesser energy input, owing to bigger temperature gradients between droplets and the air, than the co-current dryers [5,6], they are limited to thermally resistant materials such as detergents [6,7].
Although in the past years, many studies on spray drying have been published, less focus has been directed towards process intensification of the spray drying process with regard to reducing equipment sizes or increasing drying rates. According to Langrish [8], reducing chamber volume is one of the biggest challenges concerning the spray drying industry. Therefore, taking into account the growing world population and increase in food demand [9], combined with restrictions on CO2 emissions [10], industries are looking towards novel and improved technologies that can offer a lower carbon footprint, bigger capacities, and improved product characteristics [11].
This study investigates a novel compact dryer for producing skim milk powder (heat-sensitive material) based on a counter-current mechanism. The concept of the design originates from the Radial Multizone Dryer (RMD) [12,13,14], wherein a process intensified spray drying is achieved by applying high air inlet temperatures (300–400 °C) and high-G acceleration using vortex chamber technology. Recently, Rahman et al. [15] studied numerically the benefits of RMD and identified optimum parameters (solids outlet location, droplet size, G-acceleration) for efficient spray drying operation in RMD. A central feature of RMD is the counter-current interaction of hot air and feed spray in the central hot zone of the dryer. This is investigated in detail via the Computational Fluid Dynamics (CFD) and experimental approach in this study.
CFD modeling of the spray drying process is a well-established technique that has been widely used for investigating airflow patterns in spray dryers [16,17], studying skim milk drying kinetics [18], assessing wall depositions [19], exploring new modeling approaches to predict particle agglomeration in dryers [20,21], and aiding in the assessment of novel technologies [22,23,24]. Concerning dryer volume reduction, Frydman et al. [25], with the help of CFD, demonstrated that high drying rates in a co-current dryer could be achieved using super-heated steam.
Kievet [26] developed a 2D CFD model and validated it by comparing gas temperature and velocity profiles at different axial heights of a pilot-scale co-current dryer. It was found that the model accurately predicts the high-velocity core zone and the outer recirculation zones in the dryer. Subsequently, many authors [27,28,29] have used the geometry and boundary conditions from the work of Kievet [26] to study the influence of various parameters on spray drying performance. Huang et al. [27,30] studied the influence of air temperature, feed rate, swirl intensity, etc., Salem et al. [29] used the model of Kievet [23] to predict moisture distribution profiles of salt solution, and Anandharamakrishnan et al. [28] compared short form and tall form dryers for drying of heat-sensitive materials.
Sadripour et al. [31] validated a steady-state CFD model for spray drying of 20% skim milk and salt solutions. An average error of 5.5% was obtained. According to the authors, inlet temperature and initial droplet diameter are amongst the most important parameters controlling spray dryer performance.
Jin et al. [32,33] performed industrial-scale skim milk spray drying simulations using the Reaction Engineering Approach (REA). The authors found that the reflecting droplet-wall boundary condition resembles the industrial observations with the overprediction of the outlet temperature by 2–3 °C. Furthermore, the influence of spray cone angle on drying history and residence time was discussed.
Harvie et al. [34] applied a steady-state CFD modeling approach to skim milk drying in tall form spray dryers. The study revealed a strong dependency of initial spray momentum (droplet sizes and velocity) on the particle trajectories. Here, the big particles impacted dryer walls or were caught in recirculation zones, whilst the smaller particles followed gas streamlines resulting in a wide range of particle residence times (1–30 s). The model results were compared with the experimental value of final particle moisture content. An underprediction of the data was attributed to the inadequate droplet-wall boundary condition.
Computational studies on counter-current spray drying are limited, mainly due to the complex hydrodynamics, low availability of such dryers in the Research and Development sector [6,35], and possibly because of the relatively narrow product range. Ali et al. [6] conducted a CFD study of a pilot-scale counter-current tower for detergent production. The model showed overprediction of the final moisture content and outlet temperature attributed to the droplet-wall boundary condition and longer particle residence times.
Wawrzyniak et al. [36] validated a 3D, transient CFD model to the experimental temperature and velocity measurements for an industrial spray drying tower. The model followed a similar trend with the experiments; however, due to the high swirling and an unsteady flow near the inlets and mixing zones, large discrepancies were observed. It was concluded that despite complex, unsteady flow phenomena, the model was able to show a good approximation of air velocity fields to the measured values.
In the above-presented literature for modeling the two-phase spray drying processes, authors used the Eulerian–Lagrangian multiphase modeling approach based on the Particle-Source-In Cell (PSI-CELL) model of Crowe et al. [37] The choice for the turbulence model depended on the type of inlet flow. For low to moderate swirling flows, as encountered in co-current spray dryer geometries, the standard k-epsilon turbulence model has shown good accuracy [28,31,32,34,38,39], while for highly swirling flows such as those encountered in counter-current dryers, the Reynolds Stress Model [6,36,40], k-omega SST model [41], or k-epsilon RNG [29,42,43] were recommended. Furthermore, using reflecting particle-wall boundary conditions provided more accurate results than escape particle-wall boundary conditions [6,32].
Recently, Rahman et al. [44] conducted experimental trials of skim milk drying in a counter-current mechanism. In the study, unevaporated milk droplets were found to accumulate on the bottom wall; parts of them also entered the hot air inlet section. For a stable spray drying operation, it is crucial that milk droplets do not enter the hot air inlet section as this can lead to milk burning due to high temperatures and long exposure time and thus can cause explosion risks.
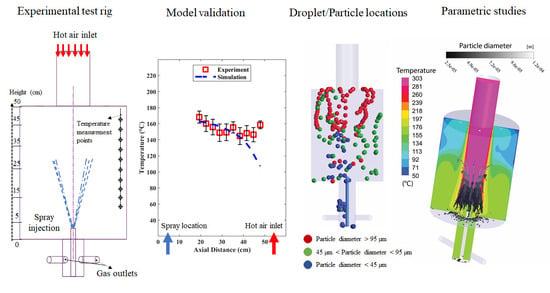
Hence, in this study, we modify this setup by injecting feed from the bottom and hot air from the top. It is our hypothesis that injecting feed from the bottom (see Figure 1), in the direction opposite to gravity, would increase the overall residence time of the droplets/particles, and thus particles can be dry before impinging dryer walls. Moreover, we believe that it can reduce the risks of droplets entering the air inlet and, consequently, minimize product deposition on the walls of the air inlet section.
In the present paper, we extend the understanding of the counter-current spray drying mechanism of skim milk using a CFD technique. Validation of the model is carried out by comparing the numerical results with experimental temperature measurements. The influence of nozzle position and operating parameters such as initial spray Sauter Mean Diameter (SMD), air inlet temperature, and feed rate on the temperature and moisture fields, particle drying histories, and product recovery is discussed in detail.

2. Materials and Methods

2.1. Experimental Setup

The skim milk experiment was conducted in the lab-scale counter-current spray dryer setup at the University of Twente, as shown in Figure 1b. The main components of the spray dryer setup are a hollow cone pressure nozzle, air flow valve, air heater, feed pump, feed tanks, and cyclone separator. Details of the experimental facility are given in a separate study [45]. The schematic representation of the setup is shown in Figure 1b, with the main drying chamber having a total height of 50 cm and a diameter of 40 cm. The spray dryer operates in a counter flow configuration with feed injected from the bottom, opposite to the direction of the air that enters from the top of the chamber via a small inlet tube. The skim milk feed is prepared using 20 wt.% powder mixed in water. The mixture was stirred for 15 min to ensure that homogeneity was obtained. Both moist air and dried particles leave the reactor via two gas outlets located around the gas outlet chimney. A cyclone separator is used to recover the dried particles from the air. The conditions of airflow and feed are given in Table 1.
The temperature of the air is measured using k-type thermocouples located at different axial heights in the dryer. Five thermocouples are mounted radially at a distance of 8 cm from the wall, and a single 10 points axial thermocouple is mounted from the top at a distance of 2.5 cm from the wall. Furthermore, the temperature of the air is measured at the inlet and outlet of the reactor; see Figure 1a.
At the start of the experiment, hot air is introduced for a period of 30 min to heat up the dryer. Once a stable process is reached with only hot air, water spray is injected into the dryer at a constant rate, and temperature profiles are monitored until a steady-state operation is achieved. Maintaining the same pump feed rate, the skim milk solution is introduced.
The obtained powder from the cyclone separator was analyzed for Particle Size Distribution using Mastersizer 3000. Additionally, the Particle Size Distribution (PSD) was confirmed from the Scanning Electron Microscopy (SEM) images taken at different amplifications.

2.2. CFD Model

The computational model of the spray drying involving a two-phase flow of gas and droplets/particles is carried out using Eulerian–Lagrangian approach in the commercial code ANSYS FLUENT 19.3.

2.2.1. Gas Flow Model

A three-dimensional, steady-state computational model is applied where the gas flow is modeled as an incompressible flow due to low Mach number [46]. The governing Equations (1)–(4) are given below [47], in which the indices i and j indicate orthogonal spatial directions: i , j = 1, 2, and 3
( ρ u i ) x i = S m
where S m is the mass source term of the dispersed phase added to the gas.
  ( ρ u i u j ) x i = P x j + x i   [ µ e ( u i x j + u j x i ) ρ u i ´ u j ´ ¯ ] + ρ g i + S f
where ρ u i ´ u j ´ ¯ is the turbulent shear stress, and S f is the source term originating from the momentum exchange with the droplets phase.
( ρ u i h ) x i = x i   [ µ e σ h h x i ] + S h
where S h is the energy source term due to the heat exchange with the discrete phase.
( ρ u i Y v ) x i = x i   [ µ e σ Y Y v x i ] + S s
where S s is the species source term.
For modeling gas-phase turbulence, the Reynolds-average approach with the two-equation eddy viscosity model is employed. Since air enters the reactor axially with no significant swirls, the k-epsilon model based on the transport of turbulent kinetic energy (k) and rate of its dissipation (ε) with standard wall functions can be employed [38]. This model is known to provide good results with no to moderate swirling flows [26,39,46].
The well-known transport equations for the standard k-ε model, along with the transport equation for kinetic energy, dissipation rate, and turbulence viscosity, can be found in the literature [47,48]. The required model constant values for C 1 ε , C 2 ε , C µ , σ k , and σ ε are set to default values of 1.44, 1.92, 0.09, 1.0, and 1.3, respectively [46,48].

2.2.2. Droplets/Particles Domain

The droplets/particles are tracked in a Lagrangian domain, while the two-way interaction between the dispersed phase (droplets/particles) and gas phase is achieved by the addition of droplets source of heat, mass, and momentum exchange. Since the volume fraction of the dispersed phase is in the range of 10−5, the particle–particle interactions are neglected [49]. The droplets/particles trajectories are calculated by solving Newton’s second law of motion/force balance:
d u p d t = F d ( U u p ) + g   ( ρ p ρ g )
where F d is the drag force per unit mass; drag force is given by,
F d = 18   µ   ρ p d p 2 C D R e 24
where R e is the relative Reynolds number based on relative velocity between particle/droplet and gas, and C D is the drag co-efficient calculated based on R e by spherical drag law.
The drying process of skim milk droplets is modeled using the REA approach [50,51]. The model has been widely used and has shown good validity in lab-scale and large-scale spray drying studies [32,33,52]. The model is briefly described as follows:
The drying rate of skim milk droplets is expressed as:
d m p d t = h m A p ( ρ v , s u r f ρ v , b )
where ρ v , s u r f is the vapor concentration at the droplet–gas interface or droplet surface, and ρ v , b   is the vapor concentration in the surrounding bulk phase (air) which is calculated by:
ρ v , b = ϕ w , b P R T b
where ϕ w , b is the mole fraction of water in air.
The value of ρ v , s u r f is an unknown parameter, which based on the REA approach [50,52] is calculated as:
ρ v , s u r f = Ҩ   ρ v , s a t   ( T s )
where Ҩ is a fractionality coefficient related to the moisture content of the droplet/particle. The interface temperature can be approximated as droplet temperature ( T d ) if the Biot number is sufficiently small. The REA approach considers evaporation as an “activation” process that requires overcoming an “energy barrier”; thus, with decreasing moisture content, it becomes more difficult to remove water. Using a simple relationship, Ҩ can be (approximately) expressed as a function of moisture content and droplet temperature as follows [50,51]:
Ҩ = e x p ( Δ E v R T d )
Thus, Ҩ ,   actually represents relative humidity (approximately) at the droplet interface. Δ E v can be viewed as a correction factor as a result of apparent activation energy for drying because of the increasing difficulty of removing water at low moisture content levels.
For 20 wt.% skim milk as feed, Δ E v is calculated by the following Equation (11) from the work of Chen and Lin [52]:
Δ E v Δ E v , b = 6.47438   ×   10 3 ( X X b ) 5 + 8.86858   ×   10 2 ( X X b ) 4 0.471097 ( X X b ) 3 + 1.22317 ( X X b ) 2 1.62539 ( X X b ) + 1.0092
where X is the particle moisture content and X b is the equilibrium moisture content. X b   is calculated from the Guggenheim–Anderson–deBoer (GAB) model with parameters fitted for 20% solids skim milk [53] as given below:
X b = m 0 C K a w ( 1 K a w ) ( 1 K a w + C K a w )
where C and K are calculated as:
C = C 0 e Δ H 1 R T b ,     K = K 0 e Δ H 2 R T b
here, m 0   = 0.06156 kg/kg, C 0 = 0.001645, K 0 = 5.71, Δ H 1 = 24,831 J/mol, Δ H 2 = −511 J/mol, a w   is the water activity calculated by Raoult’s law which approximately corresponds to the mole fraction of water in the particle mixture, and Tb is the bulk gas temperature.
The equilibrium activation energy Δ E v , b   is obtained using the gas bulk temperature and gas relative humidity as follows:
Δ E v , b = R T b l n ( ρ v , b ρ s a t , b )
The interface temperature T s in Equation (9) can be approximated as droplet/particle temperature due to the assumption of small Biot number [52,54]. This is then calculated according to the heat transfer between the droplet and the gas phase by applying the heat balance:
m p c p d T p d t = α A p ( T T d ) + d m p d t h f g .
Finally, the heat and mass transfer coefficients are calculated using the correlation of Ranz and Marshall [55] as given in Equations (16) and (17):
N u = α d p k = 2.0 + 0.6   R e d 1 2 P r 1 3
S h = h m d p D a i r v a p o r = 2.0 + 0.6 R e d 1 / 2 S c 1 / 3
For all simulation cases, a hollow cone spray pattern is used. The droplet size distribution is prescribed at a distance of 2 cm from the nozzle tip (indicated in Figure 1b). The location is based on the droplet size and velocity measurements obtained experimentally using the Particle Droplet Image Analysis technique reported in a separate study [44,45]. The droplet size is fitted to the Rosin Rammler size distribution function using the values of mean diameter and spread parameter, as shown in Table 1. The value of the spread parameter was estimated to be 1.7, which is in the range of values proposed by Lefebvre [56], and also reported by Kievet [26]. The droplet/particle dispersion caused by the turbulence is accounted for using the discrete random walk model [57]. It has been reported that the reflecting droplet/particle-wall boundary condition corresponds more closely to the practical results and observations [6,32]. Following the methodology proposed by Ali et al. [6], the normal and tangential restitution coefficients are a function of droplet/particle moisture content. Assuming the restitution coefficient of the initial wet droplet as 0 and completely dry particle as 0.2 [15], the following relationship is prescribed for calculating the restitution coefficient:
C r = 0.2   ( w l w l , i ) + 0.2
where w l , i and w l are the initial and present water mass fraction in skim milk droplets. The restitution coefficient is prescribed on all dryer walls except the bottom wall where the trap boundary condition is used. This is carried out to account for the milk droplets/particles that instantly fall on the bottom wall and accumulate there. These droplets are then dried and deposited on the bottom wall, and thus, in the model, they are removed from the calculation.
The physical processes related to particle stickiness (e.g., wall deposition, coalescence, and agglomeration) are not taken into account. Further assumptions are: (i) droplets are spherical, (ii) temperature gradients within the droplet/particle are neglected (low Biot number), and (iii) perfect shrinkage.

2.2.3. Boundary Conditions

The computational domain has one mass flow boundary inlet where a uniform velocity profile is assumed and two pressure outlets (indicated in Figure 1).
During the experimental campaign, considerable heat losses were observed from the dryer walls. Numerous studies have relied on fitting a suitable overall heat transfer coefficient by comparing dry runs (without feed spray) and matching the inlet and outlet temperatures [19,27,34,58,59]. The heat loss from the dryer walls was thus estimated following this approach; this was performed by conducting a dry run (no feed injection). Higher heat losses were estimated from the top and bottom walls due to the presence of sight glasses.
The boundary conditions applied for the gas and droplet phase are summarized in Table 1.

2.2.4. Mesh and Solver

The 3D steady-state Reynold-Averaged Navier-Stokes (RANS) equations of mass, momentum, energy, and species together with turbulence equations are solved using the commercial solver ANSYS FLUENT 19.3. The second-order upwind scheme is used to spatially discretize the convective terms [60]. The pressure-velocity coupling was achieved by the SIMPLE scheme while the pressure interpolation is completed via the PRESTO! scheme [60]. The REA drying model and modified droplet/particle wall boundary condition were incorporated into the CFD code via the User Defined Functions.
To ensure a stable solution, initially, gas-only flow is established. Once a stable, converged flow is achieved, the discrete phase is introduced in the domain. For convergence, several monitoring points (temperature and velocity) were placed inside the domain at different radial and axial locations. Furthermore, a converged solution was ensured when the target normalized residual values were in the order of 1 × 10⁻⁵ for continuity and energy and 1 × 10⁻⁴ for all other transport equations. Finally, mass-weighted average gas temperature and water mass fraction were monitored at the gas outlet. The errors in the mass and energy balances at the end of the simulation were less than 0.01%.
The computations were performed using a polyhedral mesh of 800 k cells, 1.8 M cells, and 2.6 M cells. The grid independence of the solution was ensured by comparing the velocity profile along the radial distance, at two different axial heights of the dryer. Figure 2 shows negligible differences for all three grid sizes; however, some small discrepancies can be seen for grid 1 in the outer region and in the central core region, while almost no difference is observed between grid 2 and grid 3. Therefore, grid 2 with 1.8 M cells was selected and used for all future simulation cases. The final mesh is shown in Figure 3.

3. Results

3.1. Experimental Outcomes and CFD Model Validation

Model validation is completed by comparing numerical results to the experimental temperature measurements in the skim milk test; see also Figure 4. The error bars indicate the standard deviation of the data from its mean values. From the plot, it is visible that the model predictions follow the experimental data quite well for the axial probe (Figure 4a), whereas the radial profile is somehow less well estimated (Figure 4b). The errors could be attributed to the fact that these probes are located closer to the spray umbrella, causing milk droplets to impinge these probes. Additionally, instabilities generated by the spray, especially for high viscosity flows, may lead to a local break-down of the symmetry profile in the reactor. This can also be also confirmed by the temperature differences in the experimental data of about 20–25 °C between the two probes, while the CFD model shows smaller differences between both locations due to a more symmetrical flow profile.
A maximum deviation of the model from the experimental data occurs at the probe points between 45–50 cm, where the experimental measurements show higher air temperatures for both axial and radial probes. This can be explained by the fact that these points are located at the top corners of the chamber where strong recirculation zones exist, and measurements could be inaccurate. Moreover, as explained earlier, due to fluctuations in the feed spray, the velocities of the droplets could be reduced, whereas the CFD model assumes constant velocity for all droplets. The discrepancies might also be explained as a consequence of the droplet/particle-wall boundary condition imposed in the CFD model. In the model, as the big droplets with high moisture values impact the top walls, due to very low restitution coefficient values, they are reflected towards the top-side walls of the dryer. Furthermore, upon impact with the walls, these particles have very low momentum causing them to be entrapped in recirculation zones and lose most of the moisture near the top or side walls, resulting in a bigger temperature drop in that region (45–50 cm).
In the experiments, however, the milk droplets/particles that impact the top wall (mostly bigger sized droplets) either splash or slide down the walls due to the formation of liquid film, and/or hit the top wall and fall down due to gravity, ultimately either depositing on the dryer walls (bottom or side) or leaving with the outflowing gas. This is further confirmed by looking at the final PSD of the powder recovered in the cyclone, given in Table 2. The numerically predicted mean diameter (D32) and D10 are smaller than the experimentally measured values, while the D43 measured experimentally is bigger than the predicted value.
The small discrepancies in the PSD can again be attributed to the effect of the droplet-wall boundary condition. In the model, all particles impinging the bottom wall are removed from the calculation as they are most likely to be deposited there. However, in the experiment, some of the large particulates deposited on the dryer walls could break off and be entrained in the counter flow air. This phenomenon was observed (via video recordings) during the shutdown procedure. Here, after the pump was switched off, the outflowing gas temperature was still relatively high (≈200 °C), resulting in browning and scorching of the deposited particles on the bottom wall and around the outlet chimney (indicated in Figure 5 right); some of the burnt deposited particles also broke off leaving with the outflowing gas and were recovered in the cyclone. These sintered particles were also observed in the SEM image of the powder sample (Figure 5, left). Figure 5 also reveals that some of the particles are overdried, having wrinkled or fractured surfaces. This is an effect of the high outlet temperature of the gas. Finally, Table 2 shows that the predicted outlet temperature by CFD is well within the range of experimental data.
In spite of some discrepancies between experimental and numerical results, based on the absolute average percentage error, which for the axial and radial probe is equal to 2.5% and 5%, respectively, it can be concluded that the model shows, in general, a good overall agreement with the experimental data.

3.2. Parametric Study

The aim of this section is to develop a thorough understanding of the counter-current spray drying mechanism by assessing the influence of design and operational parameters. This is achieved by carrying out a series of simulation cases, given in Table 3. Systematically in each case, one parameter is varied while keeping all other conditions identical to experimental base case A. These simulation cases are investigated in the following sections. In each section, two cases are analyzed and compared to the base case A. The effect of these parameters on the airflow patterns, heat and mass transfer characteristics, drying histories, and product recovery are discussed.

3.2.1. Influence of Nozzle Position

The location of the spray nozzle in a counter-current spray dryer, as discussed by Francia et al. [61], is of key importance influencing the final product quality, particle residence times in the dryer, agglomeration, and fine losses to the gas outlet. Therefore, in the first section, the influence of the nozzle position is investigated.
Figure 6 and Figure 7 demonstrate the air streamlines and temperature profiles on the central axial cross-sectional plane XY of the domain (indicated in Figure 6 and Figure 7), respectively.
For all different nozzle positions, the airflow patterns are similar, consisting of a high-velocity core zone and slow-moving recirculation zones around the core. As a consequence of the hollow cone spray pattern, few small recirculation zones are generated near the vicinity of the nozzle injector as well.
The temperature patterns (Figure 7) show high air temperatures concentrated in the central zone and a moderate temperature mixing zone extending radially outwards to the walls of the dryer. The highest heat and mass exchange occurs close to the atomizer as a result of high-temperature gradients and the high relative velocity of droplets/particles to the air velocity. Moreover, along the top wall of the dryer, relatively low air temperatures are seen for cases B and C compared to case A, mainly due to the bigger-sized droplets directly impinging and evaporating in that region (45–50 cm).
This is further shown in Figure 8, where the particle trajectory for three different diameters, 14 µm, 61 µm, and 97 µm, is plotted for all three cases. The smaller/fine droplets are dried instantly close to the atomizer, and due to their low Stokes number (<0.1) and small relaxation time, they are instantly entrained in the counter flow air and leave the reactor via the outlet. The larger particles (61 and 97 µm), due to their big momentum, penetrate further into the chamber and are more likely to escape the central core flow and impact the side walls or top-side walls (40–50 cm) of the dryer. These particles, depending on their respective trajectories, eventually either impinge the bottom wall where they deposit or are trapped in recirculation zones and leave later via the outlet.
As a consequence of moving the nozzle forward in the chamber, dried skim milk particles have a higher chance to be picked up by the recirculation zones and therefore do not directly impinge the bottom wall. This is depicted in Figure 9, where case B (nozzle at 23 cm) resulted in a minimum product deposition of 43 wt.%. For case C, when the nozzle is at 33 cm, the droplet’s/particle’s momentum is too high for counter-flowing air to deflect them downwards. These bigger-sized droplets/particles (>90 µm) further enter the air inlet section. This is highly undesirable since milk droplets/particles can deposit on the inlet walls leading to milk burning or causing an explosion.
Table 4 reveals that when the nozzle is moved inwards, the mean D32 particle diameter and mean residence time also increase. This is crucial when drying heat-sensitive materials since long exposure times to high outlet air temperature can degrade the product quality.

3.2.2. Influence of Initial Mean Droplet Size

The influence of initial spray SMD on the penetration depth of droplets/particles, gas temperature, and moisture fraction profile in the dryer, is discussed in this section.
The difference in spray SMD results in variations of the temperature and moisture fields, as shown in Figure 10 and Figure 11, respectively. When the SMD is maximum, i.e., 58 µm (case D), a large part of the spray penetrates upstream into the dryer, impinging the top and sidewalls, where due to bigger droplet masses, evaporation rates are still high. Additionally, as a consequence of big SMD, these particles have high momentum and tend to easily escape the central core flow impacting the cylinder walls, where drying continues. In contrast, for case E, due to the small SMD of the spray (38 µm), a significant percentage of the droplets stay within the central core flow. Furthermore, almost no drying is observed on the middle or side cylinder walls. This suggests that due to the small SMD of the spray, drying is completed before the droplets/particles reach the cylinder walls.
The base case A (SMD of 48 µm) depicts behavior similar to case E near the atomizer and resembles case D in the top part of the chamber. In general, droplets above 80 µm have a significant amount of water, and their restitution coefficient is low. This causes them to slide along the top or top-side walls, leading to a temperature drop and high moisture fractions in these regions.
Figure 12 indicates the wt.% of product deposited on the bottom wall and recovered at the outlet. For case E, the highest product recovery is obtained (49 wt.%), while no difference is observed for cases A and D. Using a big spray SMD (cases A and D), as clarified earlier, leads the spray to impact the top and side walls of the reactor and become entrapped in recirculation zones and later deposit on the walls.
The mean recovered particle diameter and mean residence time for all cases are similar (Table 5), indicating little to no impact of the initial spray SMD. This also implies that the final mean particle diameter and residence time are governed by the airflow conditions (velocity and streamlines) inside the dryer.

3.2.3. Influence of Inlet Air Temperature

The drying rate of skim milk droplets is highly dependent on the airflow conditions. In this regard, the air inlet temperature is the most crucial parameter controlling the progression rate of the drying process. For the same-size droplet, a higher air inlet temperature should result in a faster drying process due to the high convective heat transfer. This is depicted in Figure 13, where mass loss curves for a 37 µm skim milk droplet are compared for the three cases. In case G (highest air inlet temperature), the time for skim milk droplets to reach 10 wt.% moisture content is reduced by roughly 50% (compared to case F—lowest air inlet temperature); however, due to very fast drying, the final particle moisture content falls well below 1%, compared to 3% for case F. For the experimental base case A, this was also evident in the SEM images of the recovered particles (Figure 5a), where due to high outlet temperature (higher than the boiling point of water), some of the particles appeared to be overdried, fractured, or ruptured.
Therefore, in order to have an efficient, high temperature, counter-current spray drying process without adversely affecting product quality, it is paramount that as soon as the particle reaches its critical moisture content, i.e., approximately 8–13%, the semi-dried/dried particles are separated from the central core flow (temperature > 150 °C) to a mild temperature zone (<100 °C). Additionally, the outlet air temperature should be kept well below the glass transition temperature of skim milk particles.
The effect of air inlet temperature on the overall drying performance along the axial height of the dryer is presented in Figure 14. Here, the normalized evaporation rate and average particle diameter (obtained as weighted averages along the axial planes) are presented. Evidently, the highest evaporation rate and smallest average particle diameter are observed in case G (highest air temperature of 360 °C), while the opposite trend is observed in case F (lowest air temperature of 240 °C). In general, the plots for all three cases show similar trends of peaks and falls. In the region close to the atomizer (0–15 cm), the evaporation rates are high due to high droplet concentration in the central core and high thermal gradients. Consequently, the average particle diameters are the smallest in this region (0–15 cm). Further upstream of the atomizer, droplets/particles move radially outwards, escaping the central core flow, and become entrapped in complex recirculation zones; subsequently, evaporation rates decrease after a distance of 15 cm. This indicates that high evaporation rates and the advantage of high air inlet temperature are taken only in the initial 10–20 cm of the dryer length.
The mean residence time of the particles leaving the outlet increases considerably from 0.1 s to 0.4 s as the inlet temperature is reduced (see Table 6). The main reason for this is the smaller volumetric flow rates entering the dryer resulting in a reduction of inlet air velocity from 15 to 12 m/s. Similarly, for case G, the mean residence time decreases due to the higher air inlet velocity. Furthermore, case G also reveals the highest product recovery and reduced deposition; see Figure 15. This is mainly because of the major drag force of the counter-flowing air, compared to other cases, causing particles to deflect and leave via the outlet.

3.2.4. Influence of Feed Rate

In a counter-current spray drying mechanism, the interaction of hot air and spray is affected in various ways, as discussed in the preceding sections. The penetration of the spray is dependent not only on the initial SMD of the spray (as discussed previously) but also on the feed flow rate since it determines the initial momentum of the spray cloud and the evaporation zone in the dryer.
Figure 16 and Figure 17 present the effects of increasing feed rate on temperature and gas moisture fraction distribution, respectively, along the diameter of the dryer. The profiles are plotted at a distance of 5 cm, 10 cm, 15 cm, and 30 cm from the atomizer. For all cases, the peaks and falls follow similar trends, with the lowest air temperatures taking place in the central region of the dryer and more uniform profiles in the outer radial region. Furthermore, the plots depict the dependency of feed rate and the length of the evaporation zone in the dryer. It is interesting to note that for different feed rates, there are considerable differences observed in the profiles at different axial positions. In the case of A, droplet evaporation is finalized at the axial position of 10–15 cm, whereas for case I, the evaporation is still ongoing there. In this case, due to the very high feed rate (26 kg/h), high moisture fraction values are also observed along the walls of the dryer, implying droplet evaporation in the recirculation zones. Here, spray evaporates more upstream of the reactor, and thus, the majority of the droplets are not instantly deflected to the bottom wall. This results in reduced product deposition and an increase in mean recovered particle diameter and residence time at the outlet; see also Figure 18 and Table 7. An important observation is that the outlet air temperature of 145 °C is observed, which is higher than the glass transition temperature of skim milk. This suggests that in order to have an optimum non-sticky region for skim milk drying, either the air inlet temperature must be reduced or a higher feed rate must be injected.

4. Conclusions

In this study, a CFD model of skim milk drying in a novel counter flow dryer was presented. Three-dimensional, steady-state simulations were carried out using two-way coupling between the gas and discrete phase employing the Eulerian–Lagrangian multiphase model. Drying kinetics of skim milk was incorporated using the REA approach. For model validation, numerical predictions were compared to the experimental data (temperature profiles and final SMD) obtained during the skim milk test. The model showed good agreement with a maximum average error of 5% for the radial probes, while an overprediction of the mean diameter was observed (30 µm against 27 µm).
Furthermore, to evaluate the dryer performance, multiple cases were studied. The results revealed that nozzle position and feed rate had the most pronounced effect on product recovery, mean particle diameter, and mean residence time. Placing the nozzle at around mid-height of the dryer (≈23 cm) resulted in maximum product recovery, mean particle diameter, and mean residence time. Similar trends were observed with the maximum feed rate of 26 kg/h. Here, due to increased spray penetration upstream in the dryer, the final mean particle diameter and residence time also increased.
The influence of the initial spray SMD and air inlet temperatures on the evaporation zones were also discussed. It was found that due to the difference in spray penetration inside the dryer, the maximum evaporation zones vary significantly. In the case of an initial spray SMD of 58 µm, the maximum evaporation occurred upstream of the dryer (35–50 cm), whereas, in the case of the smallest SMD of 38 µm, the maximum evaporation zone occurred close to the atomizer (0–10 cm). In a similar fashion, drying and evaporation rates in the dryer were found to be a function of air inlet temperature; however, high evaporation rates were noted only in the initial 10–20 cm of distance from the atomizer where droplet concentration was highest in the central core flow. Further downstream of the atomizer (>20 cm), droplets/particles moved radially outwards in the mixing zone (recirculation zones), where evaporation rates were low for all investigated cases.
The results of this study show the potential of using high air inlet temperature in a small volume. The data can be used to optimize the dryer by including swirling/rotating flows in the periphery of the dryer for efficient separation of dried particles and their removal to a mild temperature zone in order to avoid product degradation.

Author Contributions

Conceptualization, U.J.U.R. and A.K.P.; data curation, U.J.U.R.; formal analysis, U.J.U.R.; funding acquisition, A.K.P.; investigation, U.J.U.R.; methodology, U.J.U.R. and A.K.P.; project administration, A.K.P.; resources, A.K.P.; software, U.J.U.R.; supervision, A.K.P.; validation, U.J.U.R.; visualization, U.J.U.R.; writing—original draft, U.J.U.R.; writing—review and editing, A.K.P. Both authors have read and agreed to the published version of the manuscript.

Funding

This project is co-funded by TKI-Energy with the supplementary grant ‘TKI- Toeslag’ for Topconsortia for Knowledge and Innovation (TKI’s) of the Ministry of Economic Affairs and Climate Policy.

Institutional Review Board Statement

Not applicable.

Informed Consent Statement

Not applicable.

Data Availability Statement

Not applicable.

Acknowledgments

This research is conducted within the project RMD-Radial Multizone Dryer (DR-20-10), in collaboration with Institute for Sustainable Process Technology (within the Drying and Dewatering cluster), FrieslandCampina, Energy Research Center of the Netherlands (ECN) part of TNO, and Université Catholique de Louvain. The authors would like to express their gratitude to all the project members for the fruitful discussions during the meetings.

Conflicts of Interest

The authors declare no conflict of interest.

Abbreviations

NomenclatureSymbols
A p Surface area (m2)
C r Restitution coefficient
D a i r v a p o r Diffusivity of vapor to air (m2/s)
d p Particle/droplet diameter (m)
g i Gravitational acceleration (m/s2)
h Specific enthalpy (J/kg)
h f g Latent heat of vaporization (J/kg)
h m Mass transfer coefficient (1/s)
k Thermal conductivity of gas (W/m · K)
N u Nusselt number
P Pressure of the fluid (Pa)
P r Prandtl number
R Universal gas constant (J/K · mol)
R e d Reynolds number of droplet/particle
S c Schmidt number
S h Sherwood number
T b Bulk air temperature (K)
u i Gas velocity vector (m/s)
u p Particle velocity (m/s)
Y v Mass fraction of vapor
w l , i Water mass fraction
X Particle moisture content (kg/kg)
X b Equilibrium moisture content (kg/kg)
Subscripts
b Bulk
i Vector components, Coordinate index
l Liquid
l , i Initial liquid
p Particle
s a t Saturated
s u r f Surface
v Vapor phase
v , b Vapor concentration in the bulk phase
v , s u r f Vapor concentration on the surface
w , b Wet bulb
Greek letters
µ e Effective viscosity (kg/m · s)
ρ p   Particle density (kg/m3)
ϕ w , b Mole fraction of water in air
α Heat transfer coefficient (J/m2 · s · K)

References

  1. Percy, S.R. Improvement in Drying and Concentrating Liquid Substances by Atomizing. U.S. Patent 125406, 9 April 1872. [Google Scholar]
  2. Masters, K. Spray Drying Handbook; George Godwin Ltd.: London, UK, 1985. [Google Scholar]
  3. Schuck, P.; Jeantet, R.; Bhandari, B.; Chen, X.D.; Perrone, Í.T.; de Carvalho, A.F.; Fenelon, M.; Kelly, P. Recent advances in spray drying relevant to the dairy industry: A comprehensive critical review. Dry. Technol. 2016, 3, 1773–1790. [Google Scholar] [CrossRef]
  4. ZuivelNL. Dutch Dairy in Figures 2015. 2015, p. 27. Available online: http://www.zuivelnl.org/wp-content/uploads/2016/09/Dutch-dairy-in-figures-2015.pdf (accessed on 5 January 2020).
  5. Wawrzyniak, P.; Podyma, M.; Zbicinski, I.; Bartczak, Z.; Polanczyk, A.; Rabaeva, J. Model of Heat and Mass Transfer in an Industrial Counter-Current Spray-Drying Tower. Dry. Technol. 2012, 30, 1274–1282. [Google Scholar] [CrossRef]
  6. Ali, M.; Mahmud, T.; Heggs, P.J.; Ghadiri, M.; Bayly, A.; Ahmadian, H.; de Juan, L.M. CFD modeling of a pilot-scale countercurrent spray drying tower for the manufacture of detergent powder. Dry. Technol. 2017, 35, 281–299. [Google Scholar] [CrossRef]
  7. Wawrzyniak, P.; Jaskulski, M.; Piatkowski, M.; Sobulska, M.; Zbicinski, I.; Egan, S. Experimental detergent drying analysis in a counter-current spray dryer with swirling air flow. Dry. Technol. 2020, 38, 108–116. [Google Scholar] [CrossRef]
  8. Langrish, T.A.G.; Fletcher, D.F. Spray drying of food ingredients and applications of CFD in spray drying. Chem. Eng. Process. 2001, 40, 345–354. [Google Scholar] [CrossRef]
  9. Food and Agriculture Organization of the United Nations. The Future of Food and Agriculture: Trends and Challenges. 2017, p. 180. Available online: http://www.fao.org/3/a-i6583e.pdf (accessed on 20 April 2018).
  10. European Commission. Energy Roadmap 2050. 2012. Available online: https://ec.europa.eu/energy/sites/ener/files/documents/2012_energy_roadmap_2050_en_0.pdf (accessed on 20 May 2018).
  11. Pierrot, J.M.; Schure, K.M. Decarbonisation Options for the Dutch Dairy Processing Industry. 2020, p. 63. Available online: https://www.pbl.nl/sites/default/files/downloads/pbl-2020-decarbonisation-options-for-the-dutch-dairy-processing-industry_4171.pdf (accessed on 5 May 2019).
  12. de Broqueville, A.; De Wilde, J.; Tourneur, T. Device for Treating Particles in a Rotating Fluidized Bed. WO/2018/203745, 8 November 2018. [Google Scholar]
  13. Rahman, U.J.U.; Pozarlik, A.K.; Baiazitov, I.; Tourneur, T.; de Broqueville, A.; De Wilde, J.; Brem, G. Stationary and transient aspects of air flow in a novel radial multi-zone dryer. In Proceedings of the Euro Drying, Torino, Italy, 10–12 July 2019. [Google Scholar]
  14. Rahman, U.J.U.; Baiazitov, I.; Pozarlik, A.K.; Brem, G. CFD study of air flow patterns and droplet trajectories in a vortex chamber spray dryer. In Proceedings of the 21st International Drying Symposium, Valencia, Spain, 11–14 September 2018. [Google Scholar]
  15. Rahman, U.J.U.; Pozarlik, A.K.; Tourneur, T.; de Broqueville, A.; De Wilde, J.; Brem, G. Numerical Study toward Optimization of Spray Drying in a Novel Radial Multizone Dryer. Energies 2021, 14, 1233. [Google Scholar] [CrossRef]
  16. Kieviet, F.G.; Van Raaij, J.; De Moor, P.P.E.A.; Kerkhof, P.J.A.M. Measurement and modelling of the air flow pattern in a pilot-plant spray dryer. Chem. Eng. Res. Des. 1997, 75, 321–328. [Google Scholar] [CrossRef] [Green Version]
  17. Gabites, J.R.; Abrahamson, J.; Winchester, J.A. Air flow patterns in an industrial milk powder spray dryer. Chem. Eng. Res. Des. 2010, 88, 899–910. [Google Scholar] [CrossRef] [Green Version]
  18. Mezhericher, M.; Levy, A.; Borde, I. Modeling of droplet drying in spray chambers using 2D and 3D computational fluid dynamics. Dry. Technol. 2009, 27, 359–370. [Google Scholar] [CrossRef]
  19. Keshani, S.; Montazeri, M.H.; Daud, W.R.W.; Nourouzi, M.M. CFD Modeling of Air Flow on Wall Deposition in Different Spray Dryer Geometries. Dry. Technol. 2015, 33, 784–795. [Google Scholar] [CrossRef]
  20. Malafronte, L.; Ahrné, L.; Innings, F.; Jongsma, A.; Rasmuson, A. Prediction of regions of coalescence and agglomeration along a spray dryer-Application to skim milk powder. Chem. Eng. Res. Des. 2015, 104, 703–712. [Google Scholar] [CrossRef]
  21. Jaskulski, M.; Wawrzyniak, P.; Zbiciński, I. CFD model of particle agglomeration in spray drying. Dry. Technol. 2015, 33, 1971–1980. [Google Scholar] [CrossRef]
  22. Norton, T.; Sun, D.W. Computational fluid dynamics (CFD)—an effective and efficient design and analysis tool for the food industry: A review. Trends Food Sci. Technol. 2006, 17, 600–620. [Google Scholar] [CrossRef]
  23. Huang, L.; Mujumdar, A.S. Numerical study of two-stage horizontal spray dryers using computational fluid dynamics. Dry. Technol. 2006, 24, 727–733. [Google Scholar] [CrossRef]
  24. Wu, Z.; Mujumdar, A.S. A Parametric Study of Spray Drying of a Solution in a Pulsating High-Temperature Turbulent Flow. Dry. Technol. 2006, 24, 751–761. [Google Scholar] [CrossRef]
  25. Frydman, A.; Vasseur, J.; Moureh, J.; Sionneau, M.; Tharrault, P. Comparison of superheated steam and air operated spray dryers using Computational Fluid Dynamics. Dry. Technol. 1998, 16, 1305–1338. [Google Scholar] [CrossRef]
  26. Kieviet, F.G. Modelling Quality in Spray Drying. Ph.D. Thesis, Eindhoven University of Technology, Eindhoven, The Netherlands, 1997. [Google Scholar]
  27. Huang, L.; Kumar, K.; Mujumdar, A.S. A parametric study of the gas flow patterns and drying performance of co-current spray dryer: Results of a computational fluid dynamics study. Dry. Technol. 2003, 21, 957–978. [Google Scholar] [CrossRef]
  28. Anandharamakrishnan, C.; Gimbun, J.; Stapley, A.G.F.; Rielly, C.D. A Study of Particle Histories during Spray Drying Using Computational Fluid Dynamic Simulations. Dry. Technol. 2010, 28, 566–576. [Google Scholar] [CrossRef] [Green Version]
  29. Salem, A.; Ahmadlouiedarab, M.; Ghasemzadeh, K. CFD approach for the moisture prediction in spray chamber for drying of salt solution. J. Ind. Eng. Chem. 2011, 17, 527–532. [Google Scholar] [CrossRef]
  30. Huang, L.X.; Kumar, K.; Mujumdar, A.S. A comparative study of a spray dryer with rotary disc atomizer and pressure nozzle using computational fluid dynamic simulations. Chem. Eng. Process. Process Intensif. 2006, 45, 461–470. [Google Scholar] [CrossRef]
  31. Sadripour, M.; Rahimi, A.; Hatamipour, M.S. CFD modeling and experimental study of a spray dryer performance. Chem. Prod. Process Model. 2014, 9, 15–24. [Google Scholar] [CrossRef]
  32. Jin, Y.; Chen, X.D. Numerical study of the drying process of different sized particles in an industrial-scale spray dryer. Dry. Technol. 2009, 27, 371–381. [Google Scholar] [CrossRef]
  33. Jin, Y.; Chen, X.D. A three-dimensional numerical study of the gas/particle interactions in an industrial-scale spray dryer for milk powder production. Dry. Technol. 2009, 27, 1018–1027. [Google Scholar] [CrossRef]
  34. Harvie, D.J.E.; Langrish, T.A.G.; Fletcher, D.F. A Computational Fluid Dynamics Study of a Tall-Form Spray Dryer. Food Bioprod. Process. 2002, 80, 163–175. [Google Scholar] [CrossRef]
  35. Zbicinski, I.; Piatkowski, M. Continuous and Discrete Phase Behavior in Countercurrent Spray Drying Process. Dry. Technol. 2009, 27, 1353–1362. [Google Scholar] [CrossRef]
  36. Wawrzyniak, P.; Jaskulski, M.; Zbiciński, I.; Podyma, M. CFD modelling of moisture evaporation in an industrial dispersed system. Adv. Powder Technol. 2017, 28, 167–176. [Google Scholar] [CrossRef]
  37. Crowe, C.T.; Sharma, M.P.; Stock, D.E. The Particle-Source-In Cell (PSI-CELL) Model for Gas-Droplet Flows. J. Fluids Eng. 1977, 99, 325. [Google Scholar] [CrossRef]
  38. Huang, L.; Mujumdar, A.S. Simulation of an industrial spray dryer and prediction of off-design performance. Dry. Technol. 2007, 25, 703–714. [Google Scholar] [CrossRef]
  39. Li, X.; Zbiciński, I. A sensitivity study on CFD modeling of cocurrent spray-drying process. Dry. Technol. 2005, 23, 1681–1691. [Google Scholar] [CrossRef]
  40. Wawrzyniak, P.; Podyma, M.; Zbicinski, I. Modeling of Air Flow in an Industrial Countercurrent Spray-Drying Tower. Dry. Technol. 2011, 30, 217–224. [Google Scholar] [CrossRef]
  41. Jubaer, H.; Afshar, S.; Xiao, J.; Chen, X.D.; Selomulya, C.; Woo, M.W. On the effect of turbulence models on CFD simulations of a counter-current spray drying process. Chem. Eng. Res. Des. 2019, 141, 592–607. [Google Scholar] [CrossRef]
  42. Huang, L.; Kumar, K.; Mujumdar, A.S. Simulation of a spray dryer fitted with a rotary disk atomizer using a three-dimensional computational fluid dynamic model. Dry. Technol. 2004, 22, 1489–1515. [Google Scholar] [CrossRef]
  43. Woo, M.W.; Che, L.M.; Daud, W.R.W.; Mujumdar, A.S.; Chen, X.D. Highly swirling transient flows in spray dryers and consequent effect on modeling of particle deposition. Chem. Eng. Res. Des. 2012, 90, 336–345. [Google Scholar] [CrossRef]
  44. Rahman, U.J.U.; Diepeveen, H.; Pozarlik, A.; Brem, G. Process Intensified Spray Drying of Milk in a Counter Flow Dryer: Experimental Investigation of Evaporation and Deposition Zones. In Proceedings of the 2020 Virtual AIChE Annual Meeting; Session: Physical Properties for Chemical Product and Process Design, USA, 16–20 November 2020; Available online: https://www.aiche.org/academy/conferences/aiche-annual-meeting/2020/proceeding/paper/83e-process-intensified-spray-drying-milk-counter-flow-dryer-experimental-investigation-evaporation (accessed on 15 March 2021).
  45. Rahman, U.J.U.; Pozarlik, A.K.; Brem, G. Experimental analysis of spray drying in a process intensified counter flow dryer. Dry. Technol. 2021. article submitted to Drying Technology. [Google Scholar]
  46. Fluent, A. Ansys Fluent Theory Guide; ANSYS Inc.: Canonsburg, PE, USA, 2011; Volume 15317, pp. 724–746. [Google Scholar]
  47. Bird, R.B.; Lightfoot, E.N.; Stewart, W.E. Transport Phenomena; John Wiley & Sons: Hoboken, NJ, USA, 2002. [Google Scholar]
  48. Launder, B.E.; Spalding, D.B. Lectures in Mathematical Models of Turbulence; Academic Press: London, UK, 1972. [Google Scholar]
  49. Elgobashi, S. An Updated Classification Map of Particle-Laden Turbulent Flows. In Proceedings of the IUTAM Symposium on Computational Approaches to Multiphase Flow, Lemont, IL, USA, 4–7 October 2004. [Google Scholar]
  50. Chen, X.D.; Xie, G.Z. Fingerprints of the drying behaviour of particulate or thin layer food materials established using a reaction engineering model. Food Bioprod. Process. Trans. Inst. Chem. Eng. Part C 1997, 75, 213–222. [Google Scholar] [CrossRef]
  51. Chen, X.D. The basics of a reaction engineering approach to modeling air-drying of small droplets or Thin-layer materials. Dry. Technol. 2008, 26, 627–639. [Google Scholar] [CrossRef]
  52. Chen, X.D.; Lin, S.X.Q. Air drying of milk droplet under constant and time-dependent conditions. AIChE J. 2005, 51, 1790–1799. [Google Scholar] [CrossRef]
  53. Lin, S.X.Q.; Chen, X.D.; Pearce, D.L. Desorption isotherm of milk powders at elevated temperatures and over a wide range of relative humidity. J. Food Eng. 2005, 68, 257–264. [Google Scholar] [CrossRef]
  54. Chen, X.D.; Peng, X. Modified Biot Number in the Context of Air Drying of Small Moist Porous Objects. Dry. Technol. 2005, 23, 83–103. [Google Scholar] [CrossRef]
  55. Ranz, W.E.; Marshall, W.R. Evaporation from drops. Chem. Eng. Prog. 1952, 48, 141–146. [Google Scholar]
  56. Lefebvre, A.H.; McDonell, V.G. Atomization and Sprays; CRC Press: Boca Raton, FL, USA, 2017. [Google Scholar]
  57. Hutchinson, P.; Hewitt, G.F.; Dukler, A.E. Deposition of liquid or solid dispersions from turbulent gas streams: A stochastic model. Chem. Eng. Sci. 1971, 26, 419–439. [Google Scholar] [CrossRef]
  58. Woo, M.W.; Rogers, S.; Selomulya, C.; Chen, X.D. Particle drying and crystallization characteristics in a low velocity concurrent pilot scale spray drying tower. Powder Technol. 2012, 223, 39–45. [Google Scholar] [CrossRef]
  59. Woo, M.W.; Daud, W.R.W.; Mujumdar, A.S.; Wu, Z.H.; Talib, M.Z.M.; Tasirin, S.M. CFD evaluation of droplet drying models in a spray dryer fitted with a rotary atomizer. Dry. Technol. 2008, 26, 1180–1198. [Google Scholar] [CrossRef]
  60. Versteeg, H.K.; Malalasekera, W. An Introduction to Computational Fluid Dynamics: The Finite Volume Method; Prentice Hall: London, UK, 2007. [Google Scholar]
  61. Francia, V.; Martín, L.; Bayly, A.E.; Simmons, M.J.H. Agglomeration in counter-current spray drying towers. Part A: Particle growth and the effect of nozzle height. Powder Technol. 2016, 301, 1330–1343. [Google Scholar] [CrossRef] [Green Version]
Figure 1. Schematic overview of the reactor depicting inlet, outlet, walls, and probes locations (a) and lab-scale counter-flow spray dryer (b).
Energies 14 04974 g001
Figure 2. Comparison of gas velocity at two axial locations for grid independency study.
Energies 14 04974 g002
Figure 3. Mesh overview of the final mesh, 3D view of surface mesh (a), and top view of cross-section of the computational domain (b).
Energies 14 04974 g003
Figure 4. Comparison of experimental temperature measurements and CFD model predictions, at the single axial probe (a), and at five radial probes (b).
Energies 14 04974 g004
Figure 5. SEM image of recovered powdered sample (left), skim milk powder deposition on the bottom wall (right).
Energies 14 04974 g005
Figure 6. Air streamlines across the central axial cross-sectional plane (XY) for three different nozzle locations, A = 3 cm (left); B = 23 cm (middle); C = 33 cm (right) (to introduce more clarity, the maximum value of the velocity has been restricted to 15 m/s).
Energies 14 04974 g006
Figure 7. Temperature profile across the central axial cross-sectional plane (XY) for three different nozzle locations, A = 3 cm (left); B = 23 cm (middle); C = 33 cm (right).
Energies 14 04974 g007
Figure 8. Particle trajectories of 1.4 × 10⁻⁵ m (top), 6.1 × 10⁻⁵ m (middle), and 9.7 × 10⁻⁵ m (bottom), for three different nozzle positions: 3 cm (left); 23 cm (middle); and 33 cm (right).
Energies 14 04974 g008
Figure 9. Product recovery at outlet and deposition in the dryer for cases A, B, and C.
Energies 14 04974 g009
Figure 10. Temperature profile across the central axial cross-sectional plane (XY) for three different initial spray SMD, Case A = 48 µm; Case D = 58 µm; Case E = 38 µm.
Energies 14 04974 g010
Figure 11. Gas moisture fraction profile across the central axial cross-sectional plane (XY) for three different initial spray SMD, Case A = 48 µm; Case D = 58 µm; Case E = 38 µm (to provide better clarity of different moisture fractions in the dryer, the maximum value has been restricted to 0.065).
Energies 14 04974 g011
Figure 12. Product recovery at outlet and deposition in the dryer for cases A, D and E.
Energies 14 04974 g012
Figure 13. Mass loss curves for typical particle diameter of 37 µm for three different air inlet temperatures.
Energies 14 04974 g013
Figure 14. Normalized evaporation rates (left), and average particle diameters (right) along the axial height of the dryer for cases A, F and G (location of atomizer = 0).
Energies 14 04974 g014
Figure 15. Product recovery at outlet and deposition in the dryer for cases A, F, and G.
Energies 14 04974 g015
Figure 16. Gas temperature profiles along the radial length of dryer at different distances from the atomizer for centerline of X–Y plane, (where atomizer location is z = 0 cm).
Energies 14 04974 g016
Figure 17. Gas moisture fraction profiles along the radial length of dryer at different distances from the atomizer for centerline of X–Y plane, (where atomizer location is z = 0 cm).
Energies 14 04974 g017
Figure 18. Product recovery at outlet and deposition in the dryer for cases A, H and I.
Energies 14 04974 g018
Table 1. Boundary conditions for the simulation case and experimental conditions.
Boundary ConditionsBase Simulation Case
Central inlet of air:
DirectionNormal
Mass flow rate (kg/h)360
Temperature (°C)302
Water vapor mass fraction (kg H2O/kg air)0.009
Outlet:
Gauge pressure (Pa)0
Walls:
Convective heat transfer coefficient (W/m2 · K) for:
-Top and bottom wall18
-Side walls, exhaust walls, hot tube walls16
Free stream temperature (°C)20
MaterialSteel
Atomization and feed:
Feed rate (kg/h)20
Density (20 wt.% skim milk) (kg/m3)1039
Temperature (°C)20
Initial droplet velocity (m/s)96
Spray angle (degrees)20
Mean droplet size (µm)48
Maximum droplet size (µm)180
Minimum droplet size (µm)14
Rosin–Rammler spread parameter1.7
Table 2. Comparison of model predictions against experimentally measured data.
ParametersCFD ModelExperimental Measured
Values
Gas outlet temperature (°C)171Tout = 164 ± 18
Particle Size Distribution of recovered sample (µm)
D101514
D323027
D434150
Table 3. Investigated cases.
Simulation Cases InvestigatedParameters
Case AExperimental conditions
Case BNozzle position = 23 cm
Case CNozzle position = 33 cm
Case DInitial spray SMD = 58 µm
Case EInitial spray SMD = 38 µm
Case FAir inlet temperature = 240 °C
Case GAir inlet temperature = 360 °C
Case HFeed flow rate = 23 kg/h
Case IFeed flow rate = 26 kg/h
Table 4. Particle mean diameter and mean residence time at outlet.
CaseMean Particle Size, D32 (µm)Mean Residence Time (s)
A300.10
B380.80
C360.70
Table 5. Particle mean diameter and mean residence time at outlet.
CaseMean Particle Size, D32 (µm)Mean Residence Time (s)
A300.11
D260.14
E290.17
Table 6. Particle mean diameter and mean residence time at outlet.
CaseMean Particle Size, D32 (µm)Mean Residence Time (s)
A300.11
F300.42
G280.15
Table 7. Particle mean diameter and mean residence time at outlet.
CaseMean Particle Size, D32 (µm)Mean Residence Time (s)Gas Outlet Temperature (°C)
A300.11171
H280.30157
I600.91145
Publisher’s Note: MDPI stays neutral with regard to jurisdictional claims in published maps and institutional affiliations.

